Estimated zip code population in 2022: 23,615 Zip code population in 2010: 24,229 Zip code population in 2000: 23,725
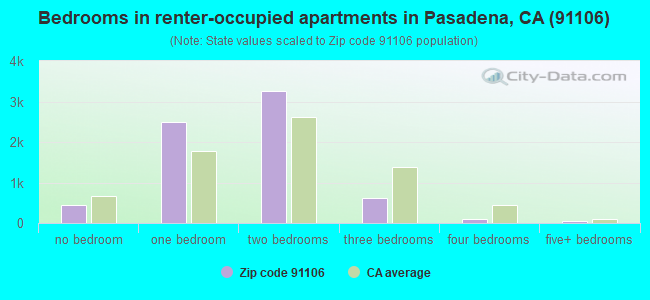
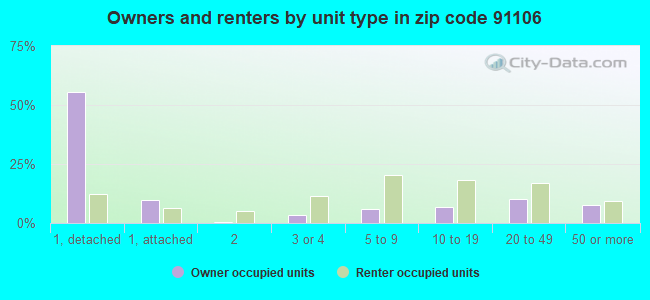
Houses and condos: 12,081 Renter-occupied apartments: 6,993
% of renters here:
65%
State:
44%
March 2022 cost of living index in zip code 91106: 139.3 (high, U.S. average is 100)
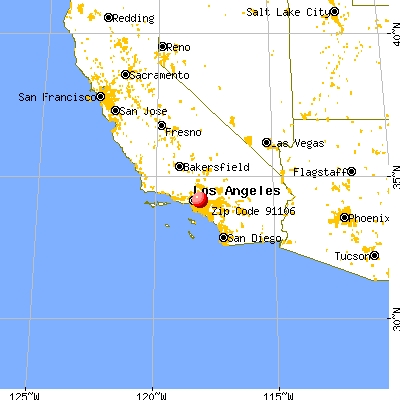
Land area: 3.0 sq. mi. Water area: 0.0 sq. mi.
Population density: 8,002 people per square mile
(high).
OSM Map
General Map
Google Map
MSN Map
OSM Map
General Map
Google Map
MSN Map
OSM Map
General Map
Google Map
MSN Map
OSM Map
General Map
Google Map
MSN Map
Please wait while loading the map...
Real estate property taxes paid for housing units in 2022:
This zip code:
0.7% ($6,788)
California:
0.7% ($4,831)
Median real estate property taxes paid for housing units with mortgages in 2022: $7,539 (0.7%) Median real estate property taxes paid for housing units with no mortgage in 2022: $3,843 (0.4%)
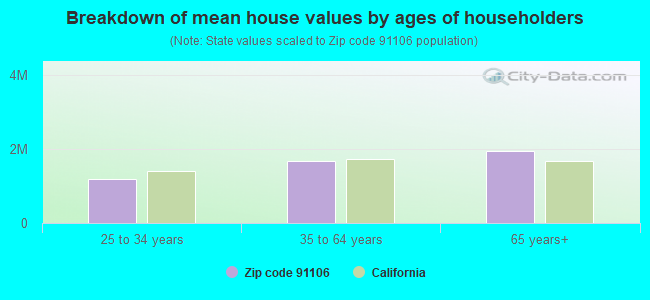
Estimated median house/condo value in 2022: $1,013,314
91106:
$1,013,314
California:
$715,900
According to our research of California and other state lists, there were 6 registered sex offenders living in 91106 zip code as of April 27, 2024. The ratio of all residents to sex offenders in zip code 91106 is 4,205 to 1. The ratio of registered sex offenders to all residents in this zip code is much lower than the state average.
Median resident age:
This zip code:
37.2 years
California median age:
37.9 years
Average household size:
This zip code:
2.2 people
California:
2.8 people
Averages for the 2020 tax year for zip code 91106, filed in 2021:
Average Adjusted Gross Income (AGI) in 2020: $135,148 (Individual Income Tax Returns)
Here:
$135,148
State:
$95,910
Salary/wage: $102,586 (reported on 81.0% of returns)
Here:
$102,586
State:
$77,331
(% of AGI for various income ranges: 1219.8% for AGIs below $25k, 4103.7% for AGIs $25k-50k, 7821.3% for AGIs $50k-75k, 11297.0% for AGIs $75k-100k, 21306.4% for AGIs $100k-200k, 158421.2% for AGIs over 200k)
Taxable interest for individuals: $4,621 (reported on 40.5% of returns)
This zip code:
$4,621
California:
$2,294
(% of AGI for various income ranges: 23.9% for AGIs below $25k, 33.3% for AGIs $25k-50k, 49.6% for AGIs $50k-75k, 97.6% for AGIs $75k-100k, 191.2% for AGIs $100k-200k, 5648.5% for AGIs over 200k)
Ordinary dividends: $25,903 (reported on 29.7% of returns)
Here:
$25,903
State:
$10,949
(% of AGI for various income ranges: 52.8% for AGIs below $25k, 60.1% for AGIs $25k-50k, 128.7% for AGIs $50k-75k, 211.5% for AGIs $75k-100k, 582.2% for AGIs $100k-200k, 25277.3% for AGIs over 200k)
Net capital gain/loss in AGI: +$43,348 (reported on 28.5% of returns)
Here:
+$43,348
State:
+$49,306
(% of AGI for various income ranges: 33.8% for AGIs below $25k, 85.5% for AGIs $25k-50k, 121.5% for AGIs $50k-75k, 222.4% for AGIs $75k-100k, 667.7% for AGIs $100k-200k, 42344.8% for AGIs over 200k)
Profit/loss from business: +$17,398 (reported on 23.1% of returns)
Here:
+$17,398
State:
+$15,671
(% of AGI for various income ranges: 232.9% for AGIs below $25k, 288.0% for AGIs $25k-50k, 296.0% for AGIs $50k-75k, 344.3% for AGIs $75k-100k, 934.0% for AGIs $100k-200k, 7268.8% for AGIs over 200k)
Taxable individual retirement arrangement distribution: $31,483 (reported on 6.2% of returns)
91106:
$31,483
California:
$23,505
(% of AGI for various income ranges: 42.3% for AGIs below $25k, 66.5% for AGIs $25k-50k, 158.8% for AGIs $50k-75k, 246.2% for AGIs $75k-100k, 524.7% for AGIs $100k-200k, 3915.8% for AGIs over 200k)
Self-employed (Keogh) retirement plans: $40,995 (reported on 1.7% of returns)
91106:
$40,995
California:
$30,163
(% of AGI for various income ranges: 39.4% for AGIs $50k-75k, 49.7% for AGIs $100k-200k, 2313.0% for AGIs over 200k)
Total itemized deductions: $50,248 (reported on 17.8% of returns)
Here:
$50,248
State:
$39,517
(% of AGI for various income ranges: 126.2% for AGIs below $25k, 159.0% for AGIs $25k-50k, 445.3% for AGIs $50k-75k, 863.8% for AGIs $75k-100k, 1847.3% for AGIs $100k-200k, 22213.9% for AGIs over 200k)
Charity contributions: $22,202 (reported on 15.2% of returns)
Here:
$22,202
State:
$12,598
(% of AGI for various income ranges: 6.5% for AGIs below $25k, 19.9% for AGIs $25k-50k, 67.7% for AGIs $50k-75k, 123.9% for AGIs $75k-100k, 341.7% for AGIs $100k-200k, 10805.8% for AGIs over 200k)
Taxes paid: $8,951 (reported on 17.6% of returns)
91106:
$8,951
State:
$8,807
(% of AGI for various income ranges: 24.1% for AGIs below $25k, 37.9% for AGIs $25k-50k, 112.3% for AGIs $50k-75k, 272.8% for AGIs $75k-100k, 591.9% for AGIs $100k-200k, 2597.9% for AGIs over 200k)
Earned income credit: $1,601 (reported on 9.2% of returns)
Here:
$1,601
State:
$2,074
(% of AGI for various income ranges: 66.1% for AGIs below $25k, 32.6% for AGIs $25k-50k)
Percentage of individuals using paid preparers for their 2020 taxes: 92.0%
Here:
92%
State:
92%
(% for various income ranges: 90.6% for AGIs below $25k, 90.5% for AGIs $25k-50k, 92.2% for AGIs $50k-75k, 93.8% for AGIs $75k-100k, 93.7% for AGIs $100k-200k, 93.4% for AGIs over 200k)
Averages for the 2012 tax year for zip code 91106, filed in 2013:
Average Adjusted Gross Income (AGI) in 2012: $133,592 (Individual Income Tax Returns)
Here:
$133,592
State:
$72,726
Salary/wage: $85,230 (reported on 82.9% of returns)
Here:
$85,230
State:
$59,079
(% of AGI for various income ranges: 75.0% for AGIs below $25k, 82.6% for AGIs $25k-50k, 83.4% for AGIs $50k-75k, 81.0% for AGIs $75k-100k, 78.9% for AGIs $100k-200k, 37.1% for AGIs over 200k)
Taxable interest for individuals: $5,294 (reported on 42.3% of returns)
This zip code:
$5,294
California:
$2,146
(% of AGI for various income ranges: 1.0% for AGIs below $25k, 0.5% for AGIs $25k-50k, 0.5% for AGIs $50k-75k, 0.7% for AGIs $75k-100k, 0.8% for AGIs $100k-200k, 2.2% for AGIs over 200k)
Ordinary dividends: $26,245 (reported on 25.6% of returns)
Here:
$26,245
State:
$9,308
(% of AGI for various income ranges: 2.3% for AGIs below $25k, 1.4% for AGIs $25k-50k, 1.2% for AGIs $50k-75k, 1.6% for AGIs $75k-100k, 2.3% for AGIs $100k-200k, 6.9% for AGIs over 200k)
Net capital gain/loss in AGI: +$74,593 (reported on 22.5% of returns)
Here:
+$74,593
State:
+$30,460
(% of AGI for various income ranges: 0.3% for AGIs $25k-50k, 0.6% for AGIs $75k-100k, 1.4% for AGIs $100k-200k, 19.4% for AGIs over 200k)
Profit/loss from business: +$20,717 (reported on 20.9% of returns)
Here:
+$20,717
State:
+$17,064
(% of AGI for various income ranges: 14.4% for AGIs below $25k, 5.2% for AGIs $25k-50k, 2.7% for AGIs $50k-75k, 3.8% for AGIs $75k-100k, 4.6% for AGIs $100k-200k, 2.2% for AGIs over 200k)
Taxable individual retirement arrangement distribution: $34,231 (reported on 7.3% of returns)
91106:
$34,231
California:
$19,557
(% of AGI for various income ranges: 2.0% for AGIs below $25k, 1.4% for AGIs $25k-50k, 1.6% for AGIs $50k-75k, 1.7% for AGIs $75k-100k, 2.6% for AGIs $100k-200k, 1.8% for AGIs over 200k)
Self-employment retirement plans: $37,127 (reported on 1.9% of returns)
91106:
$37,127
California:
$24,530
(% of AGI for various income ranges: 0.3% for AGIs below $25k, 0.3% for AGIs $50k-75k, 0.4% for AGIs $100k-200k, 0.7% for AGIs over 200k)
Total itemized deductions: $49,743 (18% of AGI, reported on 40.0% of returns)
Here:
$49,743
State:
$34,004
Here:
17.6% of AGI
State:
22.7% of AGI
(% of AGI for various income ranges: 10.6% for AGIs below $25k, 9.8% for AGIs $25k-50k, 13.7% for AGIs $50k-75k, 17.1% for AGIs $75k-100k, 19.0% for AGIs $100k-200k, 14.6% for AGIs over 200k)
Charity contributions: $10,159 (reported on 33.6% of returns)
Here:
$10,159
State:
$4,659
(% of AGI for various income ranges: 0.7% for AGIs below $25k, 1.0% for AGIs $25k-50k, 1.5% for AGIs $50k-75k, 1.6% for AGIs $75k-100k, 2.0% for AGIs $100k-200k, 3.1% for AGIs over 200k)
Taxes paid: $25,245 (reported on 39.9% of returns)
91106:
$25,245
State:
$14,448
(% of AGI for various income ranges: 2.6% for AGIs below $25k, 2.3% for AGIs $25k-50k, 4.0% for AGIs $50k-75k, 6.4% for AGIs $75k-100k, 8.0% for AGIs $100k-200k, 8.6% for AGIs over 200k)
Earned income credit: $1,913 (reported on 12.1% of returns)
Here:
$1,913
State:
$2,286
(% of AGI for various income ranges: 5.0% for AGIs below $25k, 0.5% for AGIs $25k-50k)
Percentage of individuals using paid preparers for their 2012 taxes: 59.8%
Here:
60%
State:
64%
(% for various income ranges: 58.3% for AGIs below $25k, 53.7% for AGIs $25k-50k, 55.7% for AGIs $50k-75k, 60.5% for AGIs $75k-100k, 63.7% for AGIs $100k-200k, 79.8% for AGIs over 200k)
Averages for the 2004 tax year for zip code 91106, filed in 2005:
Average Adjusted Gross Income (AGI) in 2004: $90,646 (Individual Income Tax Returns)
Here:
$90,646
State:
$58,600
Salary/wage: $65,143 (reported on 83.6% of returns)
Here:
$65,143
State:
$49,455
(% of AGI for various income ranges: 79.5% for AGIs $10k-25k, 85.8% for AGIs $25k-50k, 85.4% for AGIs $50k-75k, 84.1% for AGIs $75k-100k, 47.8% for AGIs over 100k)
Taxable interest for individuals: $4,635 (reported on 49.5% of returns)
This zip code:
$4,635
California:
$2,365
(% of AGI for various income ranges: 1.8% for AGIs $10k-25k, 1.1% for AGIs $25k-50k, 1.0% for AGIs $50k-75k, 1.2% for AGIs $75k-100k, 3.0% for AGIs over 100k)
Taxable dividends: $12,927 (reported on 28.5% of returns)
Here:
$12,927
State:
$4,746
(% of AGI for various income ranges: 1.3% for AGIs $10k-25k, 1.3% for AGIs $25k-50k, 1.1% for AGIs $50k-75k, 1.5% for AGIs $75k-100k, 5.2% for AGIs over 100k)
Net capital gain/loss: +$39,561 (reported on 24.3% of returns)
Here:
+$39,561
State:
+$23,418
(% of AGI for various income ranges: 0.2% for AGIs $10k-25k, 0.9% for AGIs $25k-50k, 0.5% for AGIs $50k-75k, 1.0% for AGIs $75k-100k, 15.0% for AGIs over 100k)
Profit/loss from business: +$17,570 (reported on 19.0% of returns)
Here:
+$17,570
State:
+$16,826
(% of AGI for various income ranges: 7.8% for AGIs $10k-25k, 3.3% for AGIs $25k-50k, 3.1% for AGIs $50k-75k, 3.6% for AGIs $75k-100k, 3.4% for AGIs over 100k)
IRA payment deduction: $3,042 (reported on 3.0% of returns)
91106:
$3,042
California:
$3,192
(% of AGI for various income ranges: 0.2% for AGIs $10k-25k, 0.2% for AGIs $25k-50k, 0.2% for AGIs $50k-75k, 0.2% for AGIs $75k-100k, 0.0% for AGIs over 100k)
Self-employed pension: $25,820 (reported on 2.2% of returns)
Here:
$25,820
California:
$17,688
(% of AGI for various income ranges: 0.1% for AGIs $10k-25k, 0.1% for AGIs $25k-50k, 0.2% for AGIs $50k-75k, 0.3% for AGIs $75k-100k, 0.8% for AGIs over 100k)
Total itemized deductions: $35,294 (20% of AGI, reported on 41.4% of returns)
Here:
$35,294
State:
$28,113
Here:
19.5% of AGI
State:
25.3% of AGI
(% of AGI for various income ranges: 9.7% for AGIs $10k-25k, 13.4% for AGIs $25k-50k, 16.4% for AGIs $50k-75k, 19.9% for AGIs $75k-100k, 16.2% for AGIs over 100k)
Charity contributions deductions: $7,600 (4% of AGI, reported on 35.8% of returns)
Here:
$7,600
State:
$3,923
Here:
3.8% of AGI
State:
3.3% of AGI
(% of AGI for various income ranges: 0.8% for AGIs $10k-25k, 1.6% for AGIs $25k-50k, 2.0% for AGIs $50k-75k, 2.4% for AGIs $75k-100k, 3.5% for AGIs over 100k)
Total tax: $20,521 (reported on 81.5% of returns)
91106:
$20,521
State:
$10,761
(% of AGI for various income ranges: 5.4% for AGIs $10k-25k, 8.3% for AGIs $25k-50k, 11.5% for AGIs $50k-75k, 12.7% for AGIs $75k-100k, 22.2% for AGIs over 100k)
Earned income credit: $1,446 (reported on 10.2% of returns)
Here:
$1,446
State:
$1,763
Percentage of individuals using paid preparers for their 2004 taxes: 58.0%
Here:
58%
State:
66%
(% for various income ranges: 54.4% for AGIs below $10k, 53.3% for AGIs $10k-25k, 54.6% for AGIs $25k-50k, 58.6% for AGIs $50k-75k, 58.2% for AGIs $75k-100k, 72.4% for AGIs over 100k)
Likely homosexual households (counted as self-reported same-sex unmarried-partner households)
Lesbian couples: 0.3% of all households
Gay men: 0.2% of all households
Household received Food Stamps/SNAP in the past 12 months: 919 Household did not receive Food Stamps/SNAP in the past 12 months: 9,742
Women who had a birth in the past 12 months: 311 (281 now married, 28 unmarried) Women who did not have a birth in the past 12 months: 6,108 (2,095 now married, 4,026 unmarried)
Housing units in zip code 91106 with a mortgage: 2,379 (224 second mortgage, 5 home equity loan, 182 both second mortgage and home equity loan) Median monthly owner costs for units with a mortgage: $3,194 Median monthly owner costs for units without a mortgage: $1,044
Residents with income below the poverty level in 2022:
This zip code:
13.2%
Whole state:
12.2%
Residents with income below 50% of the poverty level in 2022:
This zip code:
4.7%
Whole state:
6.2%
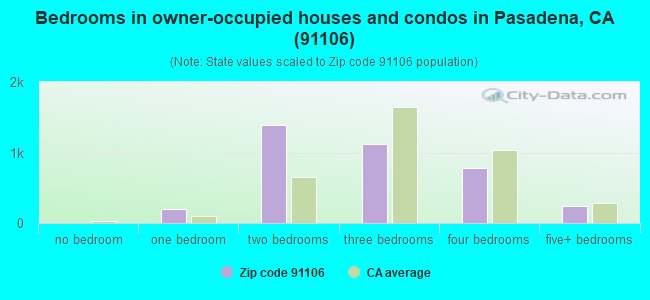
Median number of rooms in houses and condos:
Here:
5.7
State:
6.0
Median number of rooms in apartments:
Here:
3.6
State:
3.9
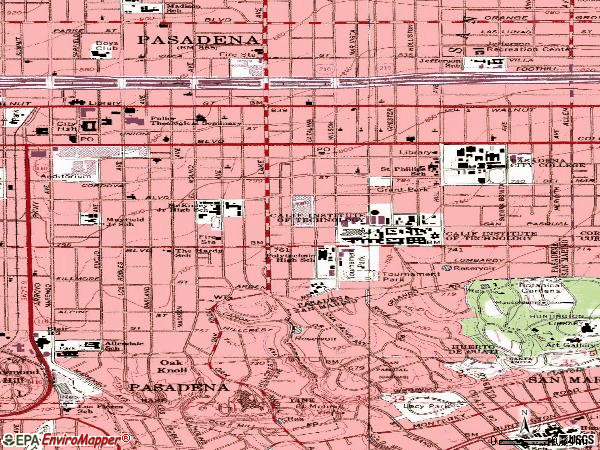
Notable locations in this zip code not listed on our city pages
Notable locations in zip code 91106: Hill Avenue Branch Pasadena Public Library (A), Allendale Branch Pasadena Public Library (B), Pasadena Fire Department Station 34 (C), Hale Solar Laboratory (D), Hutto-Patterson Gymnasium (E), Harbeson Hall (F). Display/hide their locations on the map
Churches in zip code 91106 include: Hill Avenue Grace Lutheran Church (A), Knox Presbyterian Church (B), Saint Philip Roman Catholic Church (C), Trinity Lutheran Church (D), Calvary Baptist Church of Pasadena (E), Holliston United Methodist Church (F). Display/hide their locations on the map
Parks in zip code 91106 include: Robinson Stadium (1), Grant Park (2), Jefferson Recreation Center (3), Allendale Park (4), Tournament Park (5). Display/hide their locations on the map
2,527 married couples with children.
777 single-parent households (323 men, 454 women).
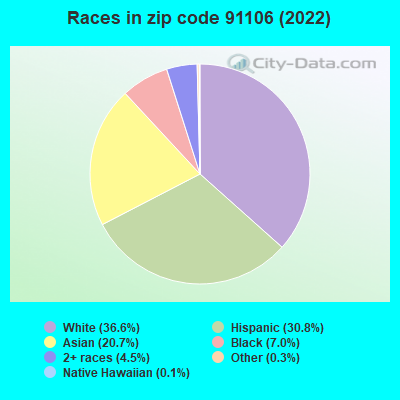
58.1% of residents of 91106 zip code speak English at home.
21.2% of residents speak Spanish at home (60% very well, 21% well, 12% not well, 7% not at all).
6.9% of residents speak other Indo-European language at home (77% very well, 12% well, 7% not well, 3% not at all).
12.1% of residents speak Asian or Pacific Island language at home (67% very well, 23% well, 8% not well, 2% not at all).
1.4% of residents speak other language at home (87% very well, 13% well).
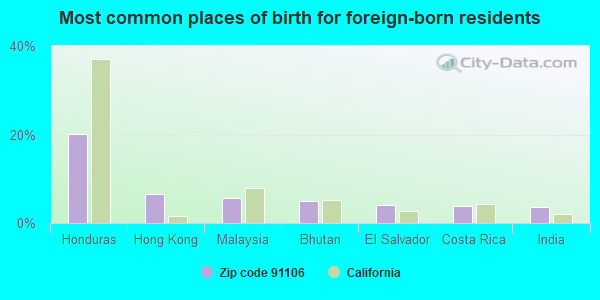
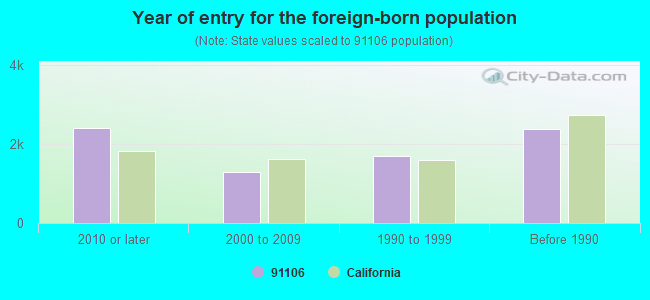
Foreign born population: 7,268 (30.8%) (53.9% of them are naturalized citizens)
Major facilities with environmental interests located in this zip code:
LOUD FORD (1365 COLORADO BLVD in PASADENA, CA)
STATE MASTER (California - Hazardous Waste Tracking) - HAZARDOU WASTE PROGRAM Small Quantity Generators, between 100 kg and 1000 kg of hazardous waste/month (Resource Conservation and Recovery Act (tracking hazardous waste)) - notification Small Quantity Generators, between 100 kg and 1000 kg of hazardous waste/month (Resource Conservation and Recovery Act (tracking hazardous waste)) - notification Organizations: ROBERT H LOUD (CONTACT/OWNER)
, PASADENA FORD (CONTACT/OWNER)
Alternative names: PASADENA FORD, ROBERT H LOUD FORD
JIFFY LUBE #2215 (1603 EAST COLORADO BLVD in PASADENA, CA)
(Resource Conservation and Recovery Act (tracking hazardous waste)) STATE MASTER (California - Used Oil Recycling System ) - USED OIL RECYCLING Business NAICS classification: ALL OTHER AUTOMOTIVE REPAIR AND MAINTENANCE. Organizations: QUAKER STATE MINIT LUBE INC (CONTACT/OWNER)
Alternative names: MINIT LUBE 1294
JEFFERSON ELEMENTARY SCHOOL (1500 E VILLA ST in PASADENA, CA)
(National Center for Education Statistics) - STATE ID-6021638 Small Quantity Generators, between 100 kg and 1000 kg of hazardous waste/month (Resource Conservation and Recovery Act (tracking hazardous waste)) - notification TRANSPORTER (Resource Conservation and Recovery Act (tracking hazardous waste)) - notification Organizations: PASADENA UNIFIED SCHOOL DIST (CONTACT/OWNER)
, PASADENA UNIFIED (SCHOOL DISTRICT)
MIKE GIBSON AUTO SERV CENTER (1701 E WALNUT in PASADENA, CA)
STATE MASTER (California - Hazardous Waste Tracking) - HAZARDOU WASTE PROGRAM Small Quantity Generators, between 100 kg and 1000 kg of hazardous waste/month (Resource Conservation and Recovery Act (tracking hazardous waste)) - notification Business NAICS classification: GENERAL AUTOMOTIVE REPAIR.
ALLENDALE ELEMENTARY SCHOOL (1135 S EUCLID AVE in PASADENA, CA)
(Geographic Names Information System) (National Center for Education Statistics) - STATE ID-6021497 Organizations: PASADENA UNIFIED (SCHOOL DISTRICT)
CHEVRON STATION 90274 (1400 EAST COLORADO BLVD in PASADENA, CA)
STATE MASTER (California - Hazardous Waste Tracking) - HAZARDOU WASTE PROGRAM Small Quantity Generators, between 100 kg and 1000 kg of hazardous waste/month (Resource Conservation and Recovery Act (tracking hazardous waste)) - notification Organizations: CHEVRON PRODUCTS CO (CONTACT/OWNER)
Alternative names: CHEVRON STATION #90274
JOHN P KASSABIAN (1485 E CALIFORNIA BLVD in PASADENA, CA)
(Resource Conservation and Recovery Act (tracking hazardous waste))
MAZDA OF PASADENA (1136 E COLORADO BLVD in PASADENA, CA)
(Resource Conservation and Recovery Act (tracking hazardous waste)) Organizations: ROD RHODEN (CONTACT/OWNER)
HOLMES BODY SHOP INC (1095 E COLORADO BLVD in PASADENA, CA)
CRITERIA AND HAZARDOUS AIR POLLUTANT INVENTORY (Inventory of air pollution sources) Small Quantity Generators, between 100 kg and 1000 kg of hazardous waste/month (Resource Conservation and Recovery Act (tracking hazardous waste)) - notification Business SIC classification: TOP, BODY, AND UPHOLSTERY REPAIR SHOPS AND PAINT SHOPS Business NAICS classification: AUTOMOTIVE BODY, PAINT, AND INTERIOR REPAIR AND MAINTENANCE.
CALVARY CHRISTIAN SCHOOL (1555 EAST COLORADO BLVD in PASADENA, CA)
COMPLIANCE ACTIVITY (Tracking inspections of insecticide, fungicide, and rodenticide, and toxic substances) Alternative names: CALVERY CHRISTIAN SCHOOL
FORENSIC TOXICOLOGY ASSOC INC (36 SOUTH CHESTER AVE in PASADENA, CA)
Small Quantity Generators, between 100 kg and 1000 kg of hazardous waste/month (Resource Conservation and Recovery Act (tracking hazardous waste)) - notification Business NAICS classification: MEDICAL LABORATORIES. Organizations: BYLTHE OLSON (CONTACT/OWNER)
JIM DANDY CLEANERS (10 S MENTOR AVE in PASADENA, CA)
Small Quantity Generators, between 100 kg and 1000 kg of hazardous waste/month (Resource Conservation and Recovery Act (tracking hazardous waste)) - notification Organizations: TIMUSHI MIYAWAKA (CONTACT/OWNER)
LAWN MOWER CORNER (1657 E WALNUT ST in PASADENA, CA)
Small Quantity Generators, between 100 kg and 1000 kg of hazardous waste/month (Resource Conservation and Recovery Act (tracking hazardous waste)) - notification Organizations: SEELEY JIM (CONTACT/OWNER)
Housing units lacking complete plumbing facilities: 0.3% Housing units lacking complete kitchen facilities: 1.9%
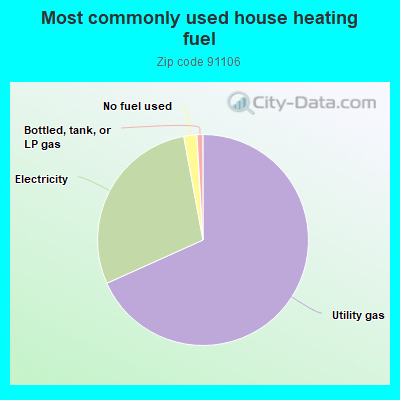
67.8%Utility gas
28.6%Electricity
2.0%No fuel used
0.9%Bottled, tank, or LP gas
Population in 1990: 23,854.
Place of birth for U.S.-born residents:
This state: 11,352
Northeast: 1,501
Midwest: 1,363
South: 1,132
West: 582
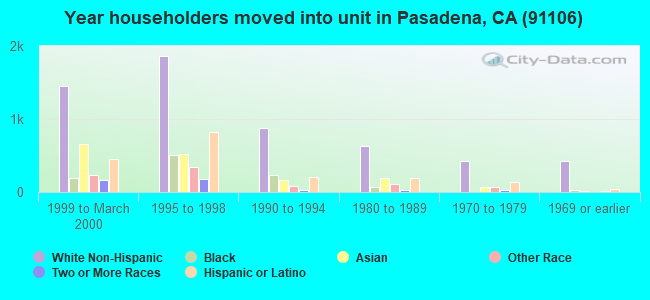
44% of the 91106 zip code residents lived in the same house 5 years ago. Out of people who lived in different houses, 68% lived in this county. Out of people who lived in different counties, 50% lived in California.
86% of the 91106 zip code residents lived in the same house 1 year ago. Out of people who lived in different houses, 73% moved from this county. Out of people who lived in different houses, 6% moved from different county within same state. Out of people who lived in different houses, 11% moved from different state. Out of people who lived in different houses, 7% moved from abroad.
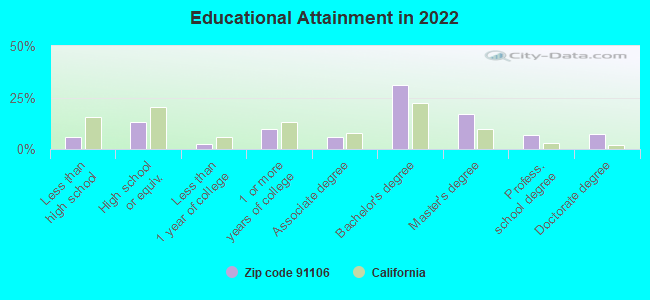
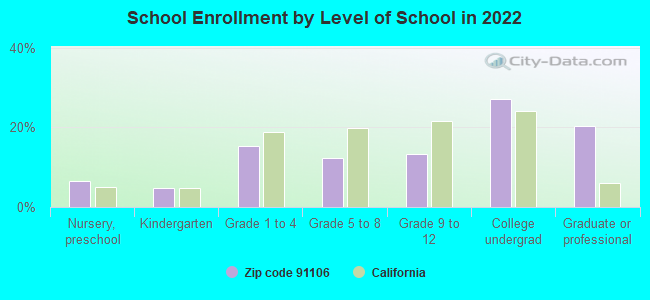
Private vs. public school enrollment:
Students in private schools in grades 1 to 8 (elementary and middle school): 677
Here:
44.6%
California:
10.5%
Students in private schools in grades 9 to 12 (high school): 223
Here:
31.5%
California:
8.5%
Students in private undergraduate colleges: 463
Here:
31.8%
California:
15.9%
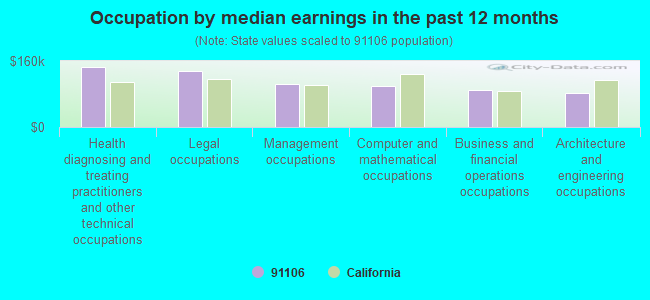
Occupation by median earnings in the past 12 months ($)
145,907Health diagnosing and treating practitioners and other technical occupations
134,574Legal occupations
103,830Management occupations
99,268Computer and mathematical occupations
90,326Business and financial operations occupations
81,895Architecture and engineering occupations
Companies with federal contracts located in this zip code:
OEWAVES INC (1010 E UNION STREET in PASADENA, CA; small business) : $8,149,157 in 20 contractsfrom 2001 to 2006
Contracts for Other Defense -- Applied Research and Exploratory Development (R&D), Other Research and Development -- Advanced Development (R&D), Engineering -- Applied Research and Exploratory Development (R&D), Other Defense -- Management and Support (R&D), and moreby Army, Navy Signed by year:2000: $0; 2001: $517,759; 2002: $274,000; 2003: $1,741,952; 2004: $3,524,058; 2005: $1,321,343; 2006: $770,045.
Biggest contracts:
$1,135,420 with Army for Other Defense -- Applied Research and Exploratory Development (R&D). Signed on 2004-02-27. Completion date: 2007-10-01.
$990,000 with Navy for Other Research and Development -- Advanced Development (R&D). Signed on 2004-06-28. Completion date: 2005-06-27.
$950,000 with Army for Other Defense -- Applied Research and Exploratory Development (R&D). Signed on 2005-07-01. Completion date: 2007-10-01.
$748,635 with Navy for Engineering -- Applied Research and Exploratory Development (R&D). Signed on 2004-08-20. Completion date: 2006-08-19.
SPECTRAL IMAGING LABORATORY (1785 LOCUST ST STE 10 in PASADENA, CA; small business) : $3,227,244 in 14 contractsfrom 2002 to 2006
Contracts for Other Defense -- Applied Research and Exploratory Development (R&D), Services -- Applied Research and Exploratory Development (R&D), Weapons -- Management and Support (R&D), Other Research and Development -- Basic Research (R&D), and moreby Air Force, Army Signed by year:2000: $0; 2001: $0; 2002: $168,689; 2003: $612,286; 2004: $1,181,991; 2005: $149,339; 2006: $1,114,939.
Biggest contracts:
$600,000 with Air Force for Other Defense -- Applied Research and Exploratory Development (R&D). Signed on 2004-07-27. Completion date: 2006-07-18.
$413,138 with Army for Services -- Applied Research and Exploratory Development (R&D). Signed on 2003-06-26. Completion date: 2005-07-24.
$374,783 with Air Force for Weapons -- Management and Support (R&D). Signed on 2006-04-03. Completion date: 2008-07-10.
$374,478, same as above.Signed on 2006-07-07. Completion date: 2008-07-10.
HOLOPLEX (600 S LAKE AVE SUITE 102 in PASADENA, CA; small business) : $327,290 in 3 contractsfrom 2000 to 2003
$374,865 with Army for Other Defense -- Applied Research and Exploratory Development (R&D). Signed on 2000-05-03. Completion date: 2001-06-30.
-$1, same as above.Signed on 2003-05-13. Completion date: 2001-09-30.
-$47,574, same as above.Signed on 2003-03-20. Completion date: 2001-09-30.
SITUS LOGIC (1442 LOMITA DR in PASADENA, CA; small business) : $291,265 in 3 contractsfrom 2002 to 2004
$99,418 with Air Force for Defense Missile and Space Systems -- Basic Research (R&D). Signed on 2004-04-14. Completion date: 2005-04-15.
$96,266 with Army for Other Defense -- Applied Research and Exploratory Development (R&D). Signed on 2003-05-28. Completion date: 2003-05-15.
$95,581, same as above.Signed on 2002-10-24. Completion date: 2003-06-24.
AONEX TECHNOLOGIES INC (129 NORTH HILL, SUITE 108 in PASADENA, CA; small business) : $89,178 in 2 contractsin 2005
$99,178 with Air Force for Defense Missile and Space Systems -- Operational Systems Development (R&D). Taking place in AL. Signed on 2005-07-13. Completion date: 2006-04-17.
-$10,000, same as above.Signed on 2005-07-26. Completion date: 2006-04-17.
jeffrey p. phelan (959 E. Walnut St., Suite 200 in Pasadena, CA; small business) : $83,743 in 5 contractsfrom 2001 to 2005
Contracts for Expert Witness by Offices, Boards and Divisions (includes Attorney General, Deputy Attorney General, etc.) Signed by year:2000: $0; 2001: $26,000; 2002: $0; 2003: $30,093; 2004: $0; 2005: $27,650; 2006: $0.
Biggest contracts:
$28,242 with Offices, Boards and Divisions (includes Attorney General, Deputy Attorney General, etc.) for Expert Witness. Signed on 2003-10-01. Completion date: 2004-09-30.
$27,650 with Offices, Boards and Divisions (includes Attorney General, Deputy Attorney General, etc.) for Expert Witness. Taking place in IL. Signed on 2005-07-15. Completion date: 2005-09-15.
$26,200 with Offices, Boards and Divisions (includes Attorney General, Deputy Attorney General, etc.) for Expert Witness. Taking place in FL. Signed on 2003-07-15. Completion date: 2004-01-15.
$26,000 with Offices, Boards and Divisions (includes Attorney General, Deputy Attorney General, etc.) for Expert Witness. Signed on 2001-08-15. Completion date: 2002-10-15.
CORDING, FRAN & ASSOC (700 S LAKE AVE STE 120 in PASADENA, CA; small business)
$6,030 with Air Force for Court Reporting Services. Signed on 2003-09-19. Completion date: 2003-09-25.
Top industries in this zip code by the number of employees in 2005:
Accommodation and Food Services: Hotels (except Casino Hotels) and Motels (500-999 employees: 1 establishment, 10-19 employees: 3 establishments)
2005 - 2018 National Fire Incident Reporting System (NFIRS) incidents
Based on the data from the years 2005 - 2018 the average number of fires per year is 31. The highest number of reported fire incidents - 45 took place in 2013, and the least - 23 in 2006. The data has a constant trend.
When looking into fire subcategories, the most reports belonged to: Structure Fires (55.2%), and Outside Fires (20.2%).
Fire incident types reported to NFIRS in Zip Code 91106


 Nearest zip codes: 91101, 91108, 91104, 91105, 91030, 91107.


 Based on the data from the years 2005 - 2018 the average number of fires per year is 31. The highest number of reported fire incidents - 45 took place in 2013, and the least - 23 in 2006. The data has a constant trend.
 When looking into fire subcategories, the most reports belonged to: Structure Fires (55.2%), and Outside Fires (20.2%).