Estimated zip code population in 2022: 31,720 Zip code population in 2010: 31,715 Zip code population in 2000: 30,010
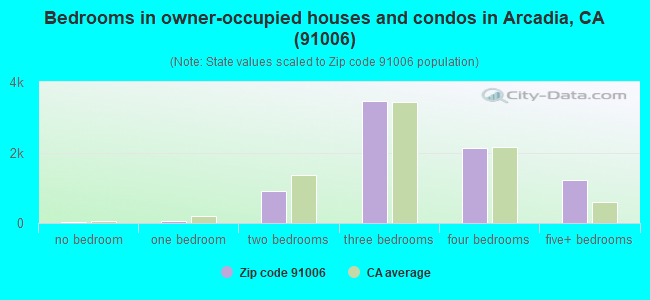
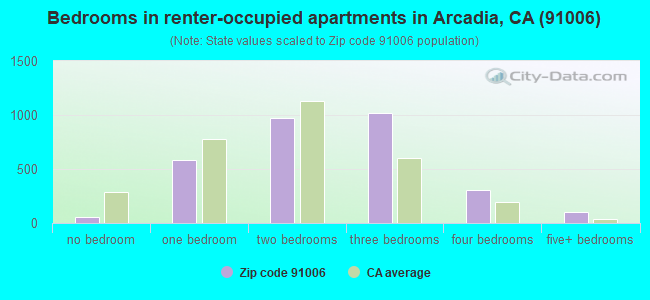
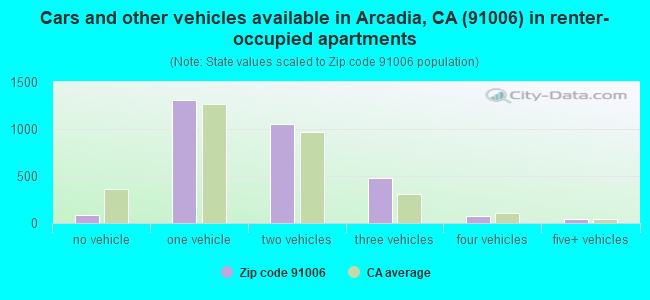
Houses and condos: 11,497 Renter-occupied apartments: 3,034
% of renters here:
28%
State:
44%
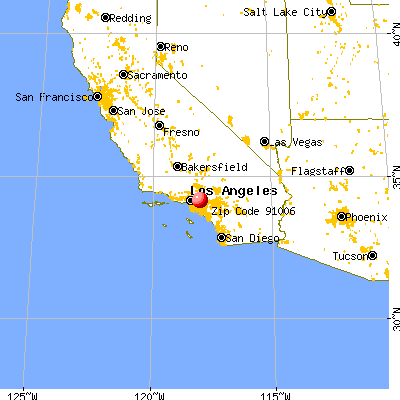
March 2022 cost of living index in zip code 91006: 137.7 (high, U.S. average is 100)
Land area: 6.3 sq. mi. Water area: 0.1 sq. mi.
Population density: 5,021 people per square mile
(average).
OSM Map
General Map
Google Map
MSN Map
OSM Map
General Map
Google Map
MSN Map
OSM Map
General Map
Google Map
MSN Map
OSM Map
General Map
Google Map
MSN Map
Please wait while loading the map...
Real estate property taxes paid for housing units in 2022:
This zip code:
0.7% ($8,344)
California:
0.7% ($4,831)
Median real estate property taxes paid for housing units with mortgages in 2022: $9,059 (0.7%) Median real estate property taxes paid for housing units with no mortgage in 2022: $7,467 (0.6%)
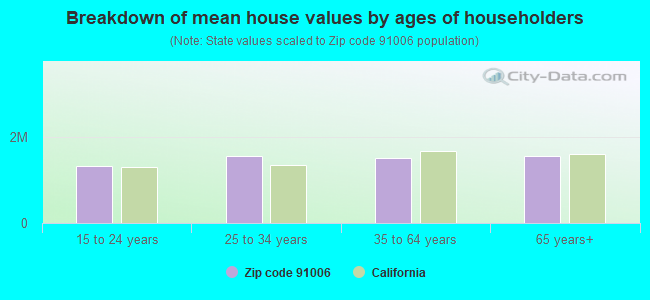
Estimated median house/condo value in 2022: $1,253,178
91006:
$1,253,178
California:
$715,900
According to our research of California and other state lists, there were 8 registered sex offenders living in 91006 zip code as of April 26, 2024. The ratio of all residents to sex offenders in zip code 91006 is 4,071 to 1. The ratio of registered sex offenders to all residents in this zip code is much lower than the state average.
Median resident age:
This zip code:
45.9 years
California median age:
37.9 years
Average household size:
This zip code:
2.9 people
California:
2.8 people
Averages for the 2020 tax year for zip code 91006, filed in 2021:
Average Adjusted Gross Income (AGI) in 2020: $125,744 (Individual Income Tax Returns)
Here:
$125,744
State:
$95,910
Salary/wage: $90,766 (reported on 74.2% of returns)
Here:
$90,766
State:
$77,331
(% of AGI for various income ranges: 1274.1% for AGIs below $25k, 3879.8% for AGIs $25k-50k, 7344.1% for AGIs $50k-75k, 11112.7% for AGIs $75k-100k, 21845.7% for AGIs $100k-200k, 102477.4% for AGIs over 200k)
Taxable interest for individuals: $4,722 (reported on 50.6% of returns)
This zip code:
$4,722
California:
$2,294
(% of AGI for various income ranges: 64.3% for AGIs below $25k, 128.6% for AGIs $25k-50k, 212.9% for AGIs $50k-75k, 309.0% for AGIs $75k-100k, 468.3% for AGIs $100k-200k, 4595.8% for AGIs over 200k)
Ordinary dividends: $12,087 (reported on 36.2% of returns)
Here:
$12,087
State:
$10,949
(% of AGI for various income ranges: 53.9% for AGIs below $25k, 121.6% for AGIs $25k-50k, 223.2% for AGIs $50k-75k, 363.9% for AGIs $75k-100k, 784.9% for AGIs $100k-200k, 10020.8% for AGIs over 200k)
Net capital gain/loss in AGI: +$41,684 (reported on 35.9% of returns)
Here:
+$41,684
State:
+$49,306
(% of AGI for various income ranges: 36.6% for AGIs below $25k, 147.3% for AGIs $25k-50k, 339.7% for AGIs $50k-75k, 561.3% for AGIs $75k-100k, 1489.7% for AGIs $100k-200k, 41117.6% for AGIs over 200k)
Profit/loss from business: +$16,168 (reported on 22.2% of returns)
Here:
+$16,168
State:
+$15,671
(% of AGI for various income ranges: 287.3% for AGIs below $25k, 477.5% for AGIs $25k-50k, 346.1% for AGIs $50k-75k, 314.5% for AGIs $75k-100k, 934.3% for AGIs $100k-200k, 4494.4% for AGIs over 200k)
Taxable individual retirement arrangement distribution: $25,722 (reported on 8.4% of returns)
91006:
$25,722
California:
$23,505
(% of AGI for various income ranges: 55.5% for AGIs below $25k, 106.5% for AGIs $25k-50k, 228.3% for AGIs $50k-75k, 427.3% for AGIs $75k-100k, 768.4% for AGIs $100k-200k, 2987.2% for AGIs over 200k)
Self-employed (Keogh) retirement plans: $30,232 (reported on 1.4% of returns)
91006:
$30,232
California:
$30,163
(% of AGI for various income ranges: 12.7% for AGIs $25k-50k, 92.0% for AGIs $100k-200k, 1049.6% for AGIs over 200k)
Total itemized deductions: $43,489 (reported on 20.3% of returns)
Here:
$43,489
State:
$39,517
(% of AGI for various income ranges: 157.6% for AGIs below $25k, 392.5% for AGIs $25k-50k, 683.0% for AGIs $50k-75k, 1249.9% for AGIs $75k-100k, 2795.2% for AGIs $100k-200k, 15094.4% for AGIs over 200k)
Charity contributions: $13,261 (reported on 16.4% of returns)
Here:
$13,261
State:
$12,598
(% of AGI for various income ranges: 6.5% for AGIs below $25k, 26.6% for AGIs $25k-50k, 61.8% for AGIs $50k-75k, 142.2% for AGIs $75k-100k, 442.0% for AGIs $100k-200k, 5255.4% for AGIs over 200k)
Taxes paid: $9,100 (reported on 20.3% of returns)
91006:
$9,100
State:
$8,807
(% of AGI for various income ranges: 37.1% for AGIs below $25k, 99.9% for AGIs $25k-50k, 190.1% for AGIs $50k-75k, 355.8% for AGIs $75k-100k, 773.4% for AGIs $100k-200k, 2340.2% for AGIs over 200k)
Earned income credit: $1,712 (reported on 10.4% of returns)
Here:
$1,712
State:
$2,074
(% of AGI for various income ranges: 64.8% for AGIs below $25k, 63.8% for AGIs $25k-50k)
Percentage of individuals using paid preparers for their 2020 taxes: 91.2%
Here:
91%
State:
92%
(% for various income ranges: 89.7% for AGIs below $25k, 91.3% for AGIs $25k-50k, 92.2% for AGIs $50k-75k, 91.4% for AGIs $75k-100k, 91.2% for AGIs $100k-200k, 93.0% for AGIs over 200k)
Averages for the 2012 tax year for zip code 91006, filed in 2013:
Average Adjusted Gross Income (AGI) in 2012: $105,423 (Individual Income Tax Returns)
Here:
$105,423
State:
$72,726
Salary/wage: $76,888 (reported on 77.5% of returns)
Here:
$76,888
State:
$59,079
(% of AGI for various income ranges: 70.8% for AGIs below $25k, 75.3% for AGIs $25k-50k, 74.0% for AGIs $50k-75k, 72.3% for AGIs $75k-100k, 72.8% for AGIs $100k-200k, 41.5% for AGIs over 200k)
Taxable interest for individuals: $3,802 (reported on 53.8% of returns)
This zip code:
$3,802
California:
$2,146
(% of AGI for various income ranges: 3.0% for AGIs below $25k, 1.6% for AGIs $25k-50k, 1.4% for AGIs $50k-75k, 1.1% for AGIs $75k-100k, 1.1% for AGIs $100k-200k, 2.5% for AGIs over 200k)
Ordinary dividends: $9,906 (reported on 34.8% of returns)
Here:
$9,906
State:
$9,308
(% of AGI for various income ranges: 3.5% for AGIs below $25k, 1.9% for AGIs $25k-50k, 1.9% for AGIs $50k-75k, 2.2% for AGIs $75k-100k, 2.1% for AGIs $100k-200k, 4.3% for AGIs over 200k)
Net capital gain/loss in AGI: +$27,274 (reported on 31.2% of returns)
Here:
+$27,274
State:
+$30,460
(% of AGI for various income ranges: 0.4% for AGIs $25k-50k, 0.7% for AGIs $75k-100k, 1.3% for AGIs $100k-200k, 14.7% for AGIs over 200k)
Profit/loss from business: +$21,087 (reported on 21.7% of returns)
Here:
+$21,087
State:
+$17,064
(% of AGI for various income ranges: 17.8% for AGIs below $25k, 7.5% for AGIs $25k-50k, 4.6% for AGIs $50k-75k, 3.7% for AGIs $75k-100k, 4.5% for AGIs $100k-200k, 3.0% for AGIs over 200k)
Taxable individual retirement arrangement distribution: $22,951 (reported on 9.8% of returns)
91006:
$22,951
California:
$19,557
(% of AGI for various income ranges: 3.4% for AGIs below $25k, 2.4% for AGIs $25k-50k, 2.8% for AGIs $50k-75k, 3.0% for AGIs $75k-100k, 2.6% for AGIs $100k-200k, 1.6% for AGIs over 200k)
Self-employment retirement plans: $27,124 (reported on 1.7% of returns)
91006:
$27,124
California:
$24,530
(% of AGI for various income ranges: 0.7% for AGIs below $25k, 0.2% for AGIs $50k-75k, 0.4% for AGIs $100k-200k, 0.6% for AGIs over 200k)
Total itemized deductions: $44,364 (24% of AGI, reported on 47.4% of returns)
Here:
$44,364
State:
$34,004
Here:
23.6% of AGI
State:
22.7% of AGI
(% of AGI for various income ranges: 18.8% for AGIs below $25k, 16.2% for AGIs $25k-50k, 19.7% for AGIs $50k-75k, 20.9% for AGIs $75k-100k, 22.1% for AGIs $100k-200k, 19.4% for AGIs over 200k)
Charity contributions: $6,487 (reported on 38.9% of returns)
Here:
$6,487
State:
$4,659
(% of AGI for various income ranges: 0.8% for AGIs below $25k, 1.1% for AGIs $25k-50k, 1.7% for AGIs $50k-75k, 1.9% for AGIs $75k-100k, 2.3% for AGIs $100k-200k, 2.9% for AGIs over 200k)
Taxes paid: $20,719 (reported on 47.3% of returns)
91006:
$20,719
State:
$14,448
(% of AGI for various income ranges: 6.9% for AGIs below $25k, 5.0% for AGIs $25k-50k, 6.5% for AGIs $50k-75k, 7.7% for AGIs $75k-100k, 9.4% for AGIs $100k-200k, 10.5% for AGIs over 200k)
Earned income credit: $1,927 (reported on 12.8% of returns)
Here:
$1,927
State:
$2,286
(% of AGI for various income ranges: 5.1% for AGIs below $25k, 0.8% for AGIs $25k-50k)
Percentage of individuals using paid preparers for their 2012 taxes: 67.9%
Here:
68%
State:
64%
(% for various income ranges: 64.5% for AGIs below $25k, 67.4% for AGIs $25k-50k, 70.0% for AGIs $50k-75k, 70.7% for AGIs $75k-100k, 66.7% for AGIs $100k-200k, 77.1% for AGIs over 200k)
Averages for the 2004 tax year for zip code 91006, filed in 2005:
Average Adjusted Gross Income (AGI) in 2004: $89,681 (Individual Income Tax Returns)
Here:
$89,681
State:
$58,600
Salary/wage: $62,654 (reported on 76.4% of returns)
Here:
$62,654
State:
$49,455
(% of AGI for various income ranges: 69.0% for AGIs $10k-25k, 74.5% for AGIs $25k-50k, 73.8% for AGIs $50k-75k, 73.9% for AGIs $75k-100k, 43.5% for AGIs over 100k)
Taxable interest for individuals: $3,399 (reported on 63.4% of returns)
This zip code:
$3,399
California:
$2,365
(% of AGI for various income ranges: 4.3% for AGIs $10k-25k, 3.1% for AGIs $25k-50k, 2.5% for AGIs $50k-75k, 2.4% for AGIs $75k-100k, 2.0% for AGIs over 100k)
Taxable dividends: $6,281 (reported on 37.6% of returns)
Here:
$6,281
State:
$4,746
(% of AGI for various income ranges: 2.8% for AGIs $10k-25k, 2.2% for AGIs $25k-50k, 2.0% for AGIs $50k-75k, 1.4% for AGIs $75k-100k, 2.7% for AGIs over 100k)
Net capital gain/loss: +$46,066 (reported on 34.4% of returns)
Here:
+$46,066
State:
+$23,418
(% of AGI for various income ranges: 0.3% for AGIs $10k-25k, 0.4% for AGIs $25k-50k, 1.6% for AGIs $50k-75k, 2.2% for AGIs $75k-100k, 23.8% for AGIs over 100k)
Profit/loss from business: +$22,386 (reported on 21.6% of returns)
Here:
+$22,386
State:
+$16,826
(% of AGI for various income ranges: 12.9% for AGIs $10k-25k, 7.6% for AGIs $25k-50k, 5.7% for AGIs $50k-75k, 6.1% for AGIs $75k-100k, 4.4% for AGIs over 100k)
IRA payment deduction: $3,941 (reported on 6.5% of returns)
91006:
$3,941
California:
$3,192
(% of AGI for various income ranges: 0.6% for AGIs $10k-25k, 0.8% for AGIs $25k-50k, 0.6% for AGIs $50k-75k, 0.5% for AGIs $75k-100k, 0.1% for AGIs over 100k)
Self-employed pension: $22,000 (reported on 2.3% of returns)
Here:
$22,000
California:
$17,688
(% of AGI for various income ranges: 0.2% for AGIs $25k-50k, 0.2% for AGIs $50k-75k, 0.5% for AGIs $75k-100k, 0.7% for AGIs over 100k)
Total itemized deductions: $35,385 (22% of AGI, reported on 47.8% of returns)
Here:
$35,385
State:
$28,113
Here:
21.7% of AGI
State:
25.3% of AGI
(% of AGI for various income ranges: 17.5% for AGIs $10k-25k, 19.8% for AGIs $25k-50k, 23.1% for AGIs $50k-75k, 24.0% for AGIs $75k-100k, 17.2% for AGIs over 100k)
Charity contributions deductions: $6,954 (4% of AGI, reported on 41.4% of returns)
Here:
$6,954
State:
$3,923
Here:
4.0% of AGI
State:
3.3% of AGI
(% of AGI for various income ranges: 1.2% for AGIs $10k-25k, 1.7% for AGIs $25k-50k, 2.4% for AGIs $50k-75k, 2.8% for AGIs $75k-100k, 3.6% for AGIs over 100k)
Total tax: $18,404 (reported on 78.3% of returns)
91006:
$18,404
State:
$10,761
(% of AGI for various income ranges: 5.2% for AGIs $10k-25k, 7.3% for AGIs $25k-50k, 8.8% for AGIs $50k-75k, 10.0% for AGIs $75k-100k, 18.9% for AGIs over 100k)
Earned income credit: $1,522 (reported on 10.2% of returns)
Here:
$1,522
State:
$1,763
Percentage of individuals using paid preparers for their 2004 taxes: 68.4%
Here:
68%
State:
66%
(% for various income ranges: 63.2% for AGIs below $10k, 67.5% for AGIs $10k-25k, 68.8% for AGIs $25k-50k, 69.9% for AGIs $50k-75k, 69.8% for AGIs $75k-100k, 72.5% for AGIs over 100k)
Likely homosexual households (counted as self-reported same-sex unmarried-partner households)
Lesbian couples: 0.1% of all households
Gay men: 0.1% of all households
Household received Food Stamps/SNAP in the past 12 months: 679 Household did not receive Food Stamps/SNAP in the past 12 months: 9,985
Women who had a birth in the past 12 months: 265 (231 now married, 33 unmarried) Women who did not have a birth in the past 12 months: 6,205 (2,458 now married, 3,746 unmarried)
Housing units in zip code 91006 with a mortgage: 4,257 (506 second mortgage, 466 both second mortgage and home equity loan) Houses without a mortgage: 24
Median monthly owner costs for units with a mortgage: $3,876 Median monthly owner costs for units without a mortgage: $1,017
Residents with income below the poverty level in 2022:
This zip code:
8.2%
Whole state:
12.2%
Residents with income below 50% of the poverty level in 2022:
This zip code:
4.8%
Whole state:
6.2%
Median number of rooms in houses and condos:
Here:
6.6
State:
6.0
Median number of rooms in apartments:
Here:
4.6
State:
3.9
Notable locations in this zip code not listed on our city pages
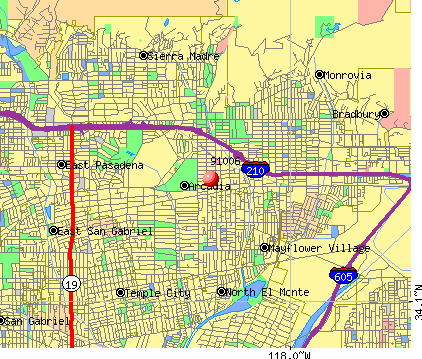
Notable locations in zip code 91006: Arcadia Golf Course (A), Live Oak Branch County of Los Angeles Public Library (B), City of Arcadia Fire Department Station 107 (C), City of Arcadia Fire Department Station 105 (D). Display/hide their locations on the map
Churches in zip code 91006 include: Arcadia Presbyterian Church (A), Congregation Shaarei Torah (B), Mandarin Baptist Church (C), San Gabriel Valley Chinese Church (D), Victory Chapel (E), Annunciation Church (F), Arcadia Bible Church (G), Arcadia Friends Church (H), Episcopal Church of the Transfiguration (I). Display/hide their locations on the map
Parks in zip code 91006 include: Arcadia Wilderness Park (1), Bonita Park (2), Eisenhower Park (3), Forest Park (4), Santa Anita Park (5), Tierra Verde Park (6), Bicentennial Park (7), Camino Grove Park (8), Highland Oaks Park (9). Display/hide their locations on the map
4,471 married couples with children.
1,334 single-parent households (364 men, 970 women).
42.2% of residents of 91006 zip code speak English at home.
11.8% of residents speak Spanish at home (72% very well, 13% well, 12% not well, 3% not at all).
3.7% of residents speak other Indo-European language at home (82% very well, 16% well, 1% not well, 1% not at all).
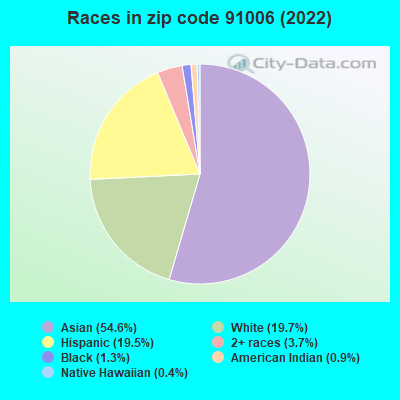
42.1% of residents speak Asian or Pacific Island language at home (51% very well, 27% well, 18% not well, 4% not at all).
0.3% of residents speak other language at home (71% very well, 29% well).
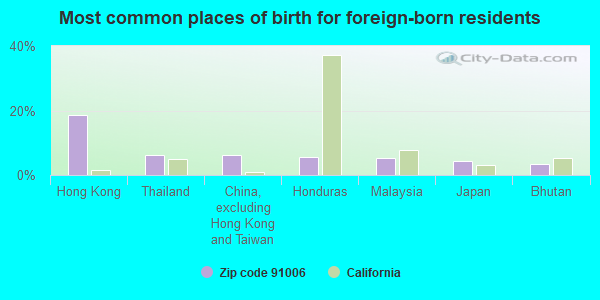
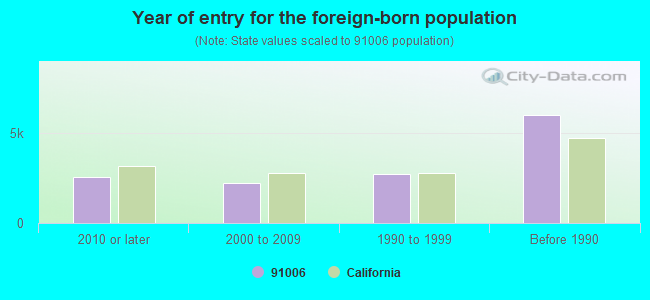
Foreign born population: 13,263 (41.8%) (75.1% of them are naturalized citizens)
Major facilities with environmental interests located in this zip code:
MIRACLE SEALANTS CO (12318 LOWER AZUSA RD in ARCADIA, CA)
STATE MASTER (California - Hazardous Waste Tracking) - HAZARDOU WASTE PROGRAM (Integrated Compliance Information System) - ICIS-09-2004-0238, FORMAL ENFORCEMENT ACTION STATE MASTER (New Jersey environmental info) - NJEMS-003814, PESTICIDES - MANUFACTURE Large Quantity Generators, more that 1000 kg of hazardous waste/month (Resource Conservation and Recovery Act (tracking hazardous waste)) - notification Organizations: ELIO E SALVO (CONTACT/OWNER)
EQUILON ENTERPRISES (916 SANTA ANITA in ARCADIA, CA) . Federal Facility
STATE MASTER (California - Hazardous Waste Tracking) - HAZARDOU WASTE PROGRAM Large Quantity Generators, more that 1000 kg of hazardous waste/month (Resource Conservation and Recovery Act (tracking hazardous waste)) Organizations: SHELL OIL PRODUCTS US (CONTACT/OPERATOR)
, EQUILON ENTERPRISES LLC DBA SHELL OIL PR (CONTACT/OWNER)
Alternative names: SHELL OIL CO
JJ MAUGET CO (5435 PECK RD in ARCADIA, CA)
COMPLIANCE ACTIVITY (Tracking inspections of insecticide, fungicide, and rodenticide, and toxic substances) STATE MASTER (New Jersey environmental info) - NJEMS-000383, PESTICIDES - MANUFACTURE, NJEMS-003513, Organizations: LEWIS & HARRISON LLC Alternative names: J.J. MAUGET
ARCADIA CITY CORPORATION YARD (11800 GOLDRING RD in ARCADIA, CA)
STATE MASTER (California - Hazardous Waste Tracking) - HAZARDOU WASTE PROGRAM Small Quantity Generators, between 100 kg and 1000 kg of hazardous waste/month (Resource Conservation and Recovery Act (tracking hazardous waste)) - notification Organizations: ARCADIA CITY OF (CONTACT/OWNER)
Alternative names: CITY OF ARCADIA PUBLIC WORKS SERVICES
METHODIST HOSPITAL OD SO CAL (300 W HUNTINGTON DR in ARCADIA, CA)
STATE MASTER (California - Hazardous Waste Tracking) - HAZARDOU WASTE PROGRAM CRITERIA AND HAZARDOUS AIR POLLUTANT INVENTORY (Inventory of air pollution sources) Small Quantity Generators, between 100 kg and 1000 kg of hazardous waste/month (Resource Conservation and Recovery Act (tracking hazardous waste)) Business SIC classification: GENERAL MEDICAL AND SURGICAL HOSPITALS Alternative names: METHODIST HOSPITAL OF SO CAL
FASHION CLEANERS (834 FOOTHILL BLVD in ARCADIA, CA)
SUPERFUND (Superfund database) STATE MASTER (California - Hazardous Waste Tracking) - HAZARDOU WASTE PROGRAM Small Quantity Generators, between 100 kg and 1000 kg of hazardous waste/month (Resource Conservation and Recovery Act (tracking hazardous waste)) Alternative names: FASHION CLEANERS #2
ARCADIA RADIOLOGY MEDICAL GRP (612 W DUARTE RD STE 101 in ARCADIA, CA)
STATE MASTER (California - Hazardous Waste Tracking) - HAZARDOU WASTE PROGRAM Small Quantity Generators, between 100 kg and 1000 kg of hazardous waste/month (Resource Conservation and Recovery Act (tracking hazardous waste)) Small Quantity Generators, between 100 kg and 1000 kg of hazardous waste/month (Resource Conservation and Recovery Act (tracking hazardous waste)) Business NAICS classification: OFFICES OF PHYSICIANS, MENTAL HEALTH SPECIALISTS.
KNIGHT CLEANERS (424 E FOOTHILL in ARCADIA, CA)
STATE MASTER (California - Hazardous Waste Tracking) - HAZARDOU WASTE PROGRAM Small Quantity Generators, between 100 kg and 1000 kg of hazardous waste/month (Resource Conservation and Recovery Act (tracking hazardous waste)) - notification Organizations: PETER DELGATTO (CONTACT/OWNER)
CHEVRON STATION NO 93583 (11 E LIVE OAK AVE in ARCADIA, CA)
STATE MASTER (California - Hazardous Waste Tracking) - HAZARDOU WASTE PROGRAM Small Quantity Generators, between 100 kg and 1000 kg of hazardous waste/month (Resource Conservation and Recovery Act (tracking hazardous waste)) - notification Organizations: CHEVRON PRODUCTS CO (CONTACT/OWNER)
JOHNS SERVICE STATION SMOG PROS (5 W FOOTHILL BLVD in ARCADIA, CA)
STATE MASTER (California - Hazardous Waste Tracking) - HAZARDOU WASTE PROGRAM Small Quantity Generators, between 100 kg and 1000 kg of hazardous waste/month (Resource Conservation and Recovery Act (tracking hazardous waste)) - notification Organizations: ARCO PRODUCTS CO (CONTACT/OWNER)
HIGHLANDER PET CENTER (159 E. FOOTHILL BLVD. in ARCADIA, CA)
(Integrated Compliance Information System) - ICIS-09-2004-0074, FORMAL ENFORCEMENT ACTION COMPLIANCE ACTIVITY (Tracking inspections of insecticide, fungicide, and rodenticide, and toxic substances)
FIRST AVENUE MIDDLE (301 S. FIRST AVE. in ARCADIA, CA)
(National Center for Education Statistics) - STATE ID-6057467 Organizations: ARCADIA UNIFIED (SCHOOL DISTRICT)
FOOTHILLS MIDDLE (171 E. SYCAMORE AVE. in ARCADIA, CA)
(National Center for Education Statistics) - STATE ID-6061246 Organizations: ARCADIA UNIFIED (SCHOOL DISTRICT)
Housing units lacking complete plumbing facilities: 2.5% Housing units lacking complete kitchen facilities: 4.5%
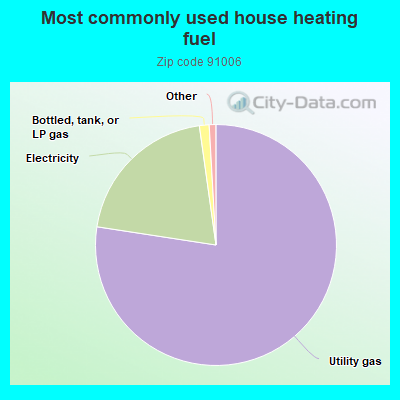
77.5%Utility gas
20.4%Electricity
1.3%Bottled, tank, or LP gas
Population in 1990: 30,550.
Place of birth for U.S.-born residents:
This state: 15,574
Northeast: 803
Midwest: 745
South: 539
West: 581
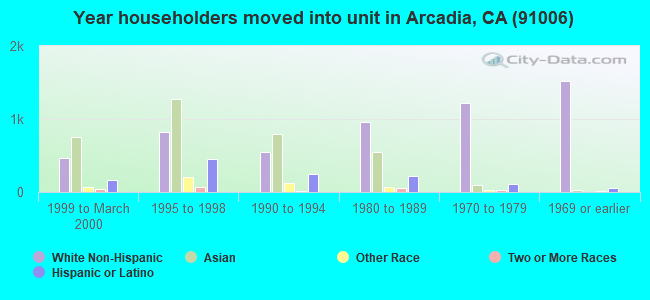
66% of the 91006 zip code residents lived in the same house 5 years ago. Out of people who lived in different houses, 84% lived in this county. Out of people who lived in different counties, 50% lived in California.
93% of the 91006 zip code residents lived in the same house 1 year ago. Out of people who lived in different houses, 75% moved from this county. Out of people who lived in different houses, 7% moved from different county within same state. Out of people who lived in different houses, 8% moved from different state. Out of people who lived in different houses, 12% moved from abroad.
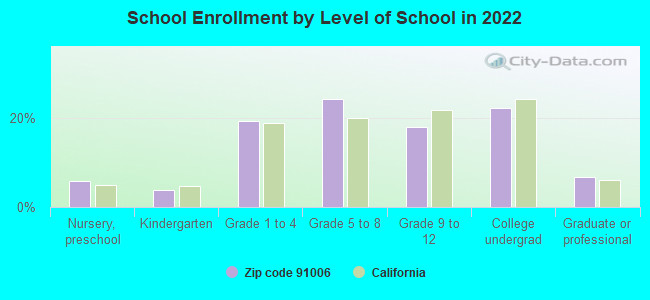
Private vs. public school enrollment:
Students in private schools in grades 1 to 8 (elementary and middle school): 627
Here:
18.1%
California:
10.5%
Students in private schools in grades 9 to 12 (high school): 121
Here:
8.5%
California:
8.5%
Students in private undergraduate colleges: 322
Here:
18.2%
California:
15.9%
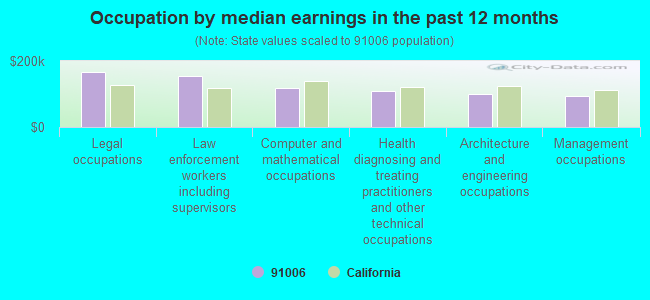
Occupation by median earnings in the past 12 months ($)
165,298Legal occupations
154,850Law enforcement workers including supervisors
119,521Computer and mathematical occupations
110,459Health diagnosing and treating practitioners and other technical occupations
99,385Architecture and engineering occupations
93,414Management occupations
Companies with federal contracts located in this zip code (ARCADIA, CA):
GAR ENTERPRISES INC (418 E LIVE OAK AVE; small business) : $1,968,012 in 16 contractsfrom 2000 to 2006
Contracts for Converters, Electrical, Nonrotating, Miscellaneous Communication Equipment, Converters, Electrical, Rotating, Aircraft Maintenance and Repair Shop Specialized Equipment, and moreby Defense Logistics Agency, Army, Air Force, Department of Defense, and others Signed by year:2000: $25,300; 2001: $74,440; 2002: $80,100; 2003: $8,534; 2004: $20,937; 2005: $1,700,361; 2006: $58,340.
Biggest contracts:
$1,506,600 with Defense Logistics Agency for Converters, Electrical, Nonrotating. Signed on 2005-02-28. Completion date: 2006-07-17.
$174,825, same as above.Signed on 2005-11-29. Completion date: 2020-06-05.
$80,100 with Army for Miscellaneous Communication Equipment. Signed on 2002-03-25. Completion date: 2002-09-30.
$51,840, same as above.Signed on 2006-01-27. Completion date: 2006-10-31.
ALLSTAR FIRE EQUIPMENT, INC (12328 LOWER AZUSA RD; small business) : $219,621 in 10 contractsfrom 2001 to 2006
Contracts for Inspection Gages and Precision Layout Tools, Fire Fighting Equipment, Facilities Operations Support Services, Clothing, Special Purpose, and moreby Navy, Army Signed by year:2000: $0; 2001: $29,546; 2002: $0; 2003: $101,044; 2004: $5,212; 2005: $66,406; 2006: $17,413.
Biggest contracts:
$101,044 with Navy for Inspection Gages and Precision Layout Tools. Signed on 2003-08-06. Completion date: 2003-09-29.
$39,986 with Navy for Fire Fighting Equipment. Signed on 2005-09-30. Completion date: 2005-11-30.
$29,546 with Navy for Facilities Operations Support Services. Signed on 2001-03-30. Completion date: 2001-07-01.
$17,413 with Army for Clothing, Special Purpose. Signed on 2006-03-13. Completion date: 2006-03-31.
EVENT SYSTEMS SUPPORT, LLC (11621 CLARK STREET, # 104; small business) : $215,981 in 12 contractsfrom 2000 to 2006
Contracts for ADP Input/Output and Storage Devices, ADPE System Configuration, Electrical and Electronic assemblies, Boards, Cards, and Associated Hardware by Air Force, Army Signed by year:2000: $58,221; 2001: $0; 2002: $28,600; 2003: $0; 2004: $113,215; 2005: $11,615; 2006: $4,330.
Biggest contracts:
$101,275 with Air Force for ADP Input/Output and Storage Devices. Signed on 2004-09-10. Completion date: 2005-10-21.
$30,980 with Army for ADPE System Configuration. Signed on 2000-05-03. Completion date: 2001-05-02.
$28,600 with Air Force for ADP Input/Output and Storage Devices. Signed on 2002-09-29. Completion date: 2002-11-30.
$27,241 with Air Force for Electrical and Electronic assemblies, Boards, Cards, and Associated Hardware. Signed on 2000-01-27. Completion date: 2000-05-31.
MYRICOM, INC (325 N SANTA ANITA AVE; small business) : $86,583 in 2 contractsfrom 2003 to 2005
$74,106 with National Institutes of Health for Computer Aided Design/Computer Aided Manufacturing (CAD/CAM) Services. Signed on 2003-07-15. Completion date: 2003-08-15.
$12,477 with Navy for Other Defense -- Applied Research and Exploratory Development (R&D). Signed on 2005-08-04. Completion date: 2005-08-11.
J J MAUGET CO (5435 PECK ROAD)
$64,317 with Army for Miscellaneous Chemical Specialties. Signed on 2000-12-01. Completion date: 2001-02-28.
IVA EQUIPMENT (411 E HUNTINGTON DR; small business) : $48,189 in 2 contractsin 2004
$26,303 with Navy for Earth Moving and Excavating Equipment. Signed on 2004-07-06. Completion date: 2004-06-10.
$21,886 with Navy for Miscellaneous Construction Equipment. Signed on 2004-07-08. Completion date: 2004-09-26.
WINDSOR CAPITAL GROUP INC (211 E HUNTINGTON DRIVE; small business) : $36,250 in 6 contractsfrom 2003 to 2006
Contracts for Lodging - Hotel/Motel, by NASA, Forest Service, Army Signed by year:2000: $0; 2001: $0; 2002: $0; 2003: $12,216; 2004: $12,869; 2005: -$1,140; 2006: $12,305.
Biggest contracts:
$13,378 with NASA for Lodging - Hotel/Motel. Signed on 2003-09-16. Completion date: 2003-09-26.
$12,869 with NASA for . Signed on 2004-08-11. Completion date: 2004-08-13.
$6,257 with Forest Service for Lodging - Hotel/Motel. Taking place in NC. Signed on 2006-05-24. Completion date: 2006-05-24.
$6,048 with Army for Lodging - Hotel/Motel. Taking place in OR. Signed on 2006-02-24. Completion date: 2006-03-02.
SYNERGY MEDICAL CORPORATION (136 E SANTA CLARA STREET,; small business)
$1,961 with Navy for Medical and Surgical Instruments, Equipment, and Supplies. Signed on 2005-07-15. Completion date: 2005-07-15.
TEKTEST INC (225 NORTH SECOND AVE; small business) 50 employees, $0 revenue
$73 with Navy for Miscellaneous Electrical and Electronic Components. Signed on 2005-03-10. Completion date: 2005-03-17.
Top industries in this zip code by the number of employees in 2005:
2005 - 2018 National Fire Incident Reporting System (NFIRS) incidents
Based on the data from the years 2005 - 2018 the average number of fires per year is 43. The highest number of reported fire incidents - 115 took place in 2005, and the least - 3 in 2015. The data has a dropping trend.
When looking into fire subcategories, the most incidents belonged to: Structure Fires (56.1%), and Outside Fires (27.1%).
Fire incident types reported to NFIRS in Zip Code 91006


 Nearest zip codes: 91007, 91016, 91024, 91780, 91731, 91008.


 Based on the data from the years 2005 - 2018 the average number of fires per year is 43. The highest number of reported fire incidents - 115 took place in 2005, and the least - 3 in 2015. The data has a dropping trend.
 When looking into fire subcategories, the most incidents belonged to: Structure Fires (56.1%), and Outside Fires (27.1%).