Pico Rivera, California Submit your own pictures of this city and show them to the world
OSM Map
General Map
Google Map
MSN Map
OSM Map
General Map
Google Map
MSN Map
OSM Map
General Map
Google Map
MSN Map
OSM Map
General Map
Google Map
MSN Map
Please wait while loading the map...
Population in 2022: 59,781 (100% urban, 0% rural). Population change since 2000: -5.7%Males: 29,200 Females: 30,581
March 2022 cost of living index in Pico Rivera: 138.3 (high, U.S. average is 100) Percentage of residents living in poverty in 2022: 9.6%for White Non-Hispanic residents , 6.3% for Black residents , 9.3% for Hispanic or Latino residents , 5.5% for American Indian residents , 11.7% for other race residents , 8.1% for two or more races residents )
Profiles of local businesses
Business Search - 14 Million verified businesses
Data:
Median household income ($)
Median household income (% change since 2000)
Household income diversity
Ratio of average income to average house value (%)
Ratio of average income to average rent
Median household income ($) - White
Median household income ($) - Black or African American
Median household income ($) - Asian
Median household income ($) - Hispanic or Latino
Median household income ($) - American Indian and Alaska Native
Median household income ($) - Multirace
Median household income ($) - Other Race
Median household income for houses/condos with a mortgage ($)
Median household income for apartments without a mortgage ($)
Races - White alone (%)
Races - White alone (% change since 2000)
Races - Black alone (%)
Races - Black alone (% change since 2000)
Races - American Indian alone (%)
Races - American Indian alone (% change since 2000)
Races - Asian alone (%)
Races - Asian alone (% change since 2000)
Races - Hispanic (%)
Races - Hispanic (% change since 2000)
Races - Native Hawaiian and Other Pacific Islander alone (%)
Races - Native Hawaiian and Other Pacific Islander alone (% change since 2000)
Races - Two or more races (%)
Races - Two or more races (% change since 2000)
Races - Other race alone (%)
Races - Other race alone (% change since 2000)
Racial diversity
Unemployment (%)
Unemployment (% change since 2000)
Unemployment (%) - White
Unemployment (%) - Black or African American
Unemployment (%) - Asian
Unemployment (%) - Hispanic or Latino
Unemployment (%) - American Indian and Alaska Native
Unemployment (%) - Multirace
Unemployment (%) - Other Race
Population density (people per square mile)
Population - Males (%)
Population - Females (%)
Population - Males (%) - White
Population - Males (%) - Black or African American
Population - Males (%) - Asian
Population - Males (%) - Hispanic or Latino
Population - Males (%) - American Indian and Alaska Native
Population - Males (%) - Multirace
Population - Males (%) - Other Race
Population - Females (%) - White
Population - Females (%) - Black or African American
Population - Females (%) - Asian
Population - Females (%) - Hispanic or Latino
Population - Females (%) - American Indian and Alaska Native
Population - Females (%) - Multirace
Population - Females (%) - Other Race
Coronavirus confirmed cases (Apr 28, 2024)
Deaths caused by coronavirus (Apr 28, 2024)
Coronavirus confirmed cases (per 100k population) (Apr 28, 2024)
Deaths caused by coronavirus (per 100k population) (Apr 28, 2024)
Daily increase in number of cases (Apr 28, 2024)
Weekly increase in number of cases (Apr 28, 2024)
Cases doubled (in days) (Apr 28, 2024)
Hospitalized patients (Apr 18, 2022)
Negative test results (Apr 18, 2022)
Total test results (Apr 18, 2022)
COVID Vaccine doses distributed (per 100k population) (Sep 19, 2023)
COVID Vaccine doses administered (per 100k population) (Sep 19, 2023)
COVID Vaccine doses distributed (Sep 19, 2023)
COVID Vaccine doses administered (Sep 19, 2023)
Likely homosexual households (%)
Likely homosexual households (% change since 2000)
Likely homosexual households - Lesbian couples (%)
Likely homosexual households - Lesbian couples (% change since 2000)
Likely homosexual households - Gay men (%)
Likely homosexual households - Gay men (% change since 2000)
Cost of living index
Median gross rent ($)
Median contract rent ($)
Median monthly housing costs ($)
Median house or condo value ($)
Median house or condo value ($ change since 2000)
Mean house or condo value by units in structure - 1, detached ($)
Mean house or condo value by units in structure - 1, attached ($)
Mean house or condo value by units in structure - 2 ($)
Mean house or condo value by units in structure by units in structure - 3 or 4 ($)
Mean house or condo value by units in structure - 5 or more ($)
Mean house or condo value by units in structure - Boat, RV, van, etc. ($)
Mean house or condo value by units in structure - Mobile home ($)
Median house or condo value ($) - White
Median house or condo value ($) - Black or African American
Median house or condo value ($) - Asian
Median house or condo value ($) - Hispanic or Latino
Median house or condo value ($) - American Indian and Alaska Native
Median house or condo value ($) - Multirace
Median house or condo value ($) - Other Race
Median resident age
Resident age diversity
Median resident age - Males
Median resident age - Females
Median resident age - White
Median resident age - Black or African American
Median resident age - Asian
Median resident age - Hispanic or Latino
Median resident age - American Indian and Alaska Native
Median resident age - Multirace
Median resident age - Other Race
Median resident age - Males - White
Median resident age - Males - Black or African American
Median resident age - Males - Asian
Median resident age - Males - Hispanic or Latino
Median resident age - Males - American Indian and Alaska Native
Median resident age - Males - Multirace
Median resident age - Males - Other Race
Median resident age - Females - White
Median resident age - Females - Black or African American
Median resident age - Females - Asian
Median resident age - Females - Hispanic or Latino
Median resident age - Females - American Indian and Alaska Native
Median resident age - Females - Multirace
Median resident age - Females - Other Race
Commute - mean travel time to work (minutes)
Travel time to work - Less than 5 minutes (%)
Travel time to work - Less than 5 minutes (% change since 2000)
Travel time to work - 5 to 9 minutes (%)
Travel time to work - 5 to 9 minutes (% change since 2000)
Travel time to work - 10 to 19 minutes (%)
Travel time to work - 10 to 19 minutes (% change since 2000)
Travel time to work - 20 to 29 minutes (%)
Travel time to work - 20 to 29 minutes (% change since 2000)
Travel time to work - 30 to 39 minutes (%)
Travel time to work - 30 to 39 minutes (% change since 2000)
Travel time to work - 40 to 59 minutes (%)
Travel time to work - 40 to 59 minutes (% change since 2000)
Travel time to work - 60 to 89 minutes (%)
Travel time to work - 60 to 89 minutes (% change since 2000)
Travel time to work - 90 or more minutes (%)
Travel time to work - 90 or more minutes (% change since 2000)
Marital status - Never married (%)
Marital status - Now married (%)
Marital status - Separated (%)
Marital status - Widowed (%)
Marital status - Divorced (%)
Median family income ($)
Median family income (% change since 2000)
Median non-family income ($)
Median non-family income (% change since 2000)
Median per capita income ($)
Median per capita income (% change since 2000)
Median family income ($) - White
Median family income ($) - Black or African American
Median family income ($) - Asian
Median family income ($) - Hispanic or Latino
Median family income ($) - American Indian and Alaska Native
Median family income ($) - Multirace
Median family income ($) - Other Race
Median year house/condo built
Median year apartment built
Year house built - Built 2005 or later (%)
Year house built - Built 2000 to 2004 (%)
Year house built - Built 1990 to 1999 (%)
Year house built - Built 1980 to 1989 (%)
Year house built - Built 1970 to 1979 (%)
Year house built - Built 1960 to 1969 (%)
Year house built - Built 1950 to 1959 (%)
Year house built - Built 1940 to 1949 (%)
Year house built - Built 1939 or earlier (%)
Average household size
Household density (households per square mile)
Average household size - White
Average household size - Black or African American
Average household size - Asian
Average household size - Hispanic or Latino
Average household size - American Indian and Alaska Native
Average household size - Multirace
Average household size - Other Race
Occupied housing units (%)
Vacant housing units (%)
Owner occupied housing units (%)
Renter occupied housing units (%)
Vacancy status - For rent (%)
Vacancy status - For sale only (%)
Vacancy status - Rented or sold, not occupied (%)
Vacancy status - For seasonal, recreational, or occasional use (%)
Vacancy status - For migrant workers (%)
Vacancy status - Other vacant (%)
Residents with income below the poverty level (%)
Residents with income below 50% of the poverty level (%)
Children below poverty level (%)
Poor families by family type - Married-couple family (%)
Poor families by family type - Male, no wife present (%)
Poor families by family type - Female, no husband present (%)
Poverty status for native-born residents (%)
Poverty status for foreign-born residents (%)
Poverty among high school graduates not in families (%)
Poverty among people who did not graduate high school not in families (%)
Residents with income below the poverty level (%) - White
Residents with income below the poverty level (%) - Black or African American
Residents with income below the poverty level (%) - Asian
Residents with income below the poverty level (%) - Hispanic or Latino
Residents with income below the poverty level (%) - American Indian and Alaska Native
Residents with income below the poverty level (%) - Multirace
Residents with income below the poverty level (%) - Other Race
Air pollution - Air Quality Index (AQI)
Air pollution - CO
Air pollution - NO2
Air pollution - SO2
Air pollution - Ozone
Air pollution - PM10
Air pollution - PM25
Air pollution - Pb
Crime - Murders per 100,000 population
Crime - Rapes per 100,000 population
Crime - Robberies per 100,000 population
Crime - Assaults per 100,000 population
Crime - Burglaries per 100,000 population
Crime - Thefts per 100,000 population
Crime - Auto thefts per 100,000 population
Crime - Arson per 100,000 population
Crime - City-data.com crime index
Crime - Violent crime index
Crime - Property crime index
Crime - Murders per 100,000 population (5 year average)
Crime - Rapes per 100,000 population (5 year average)
Crime - Robberies per 100,000 population (5 year average)
Crime - Assaults per 100,000 population (5 year average)
Crime - Burglaries per 100,000 population (5 year average)
Crime - Thefts per 100,000 population (5 year average)
Crime - Auto thefts per 100,000 population (5 year average)
Crime - Arson per 100,000 population (5 year average)
Crime - City-data.com crime index (5 year average)
Crime - Violent crime index (5 year average)
Crime - Property crime index (5 year average)
1996 Presidential Elections Results (%) - Democratic Party (Clinton)
1996 Presidential Elections Results (%) - Republican Party (Dole)
1996 Presidential Elections Results (%) - Other
2000 Presidential Elections Results (%) - Democratic Party (Gore)
2000 Presidential Elections Results (%) - Republican Party (Bush)
2000 Presidential Elections Results (%) - Other
2004 Presidential Elections Results (%) - Democratic Party (Kerry)
2004 Presidential Elections Results (%) - Republican Party (Bush)
2004 Presidential Elections Results (%) - Other
2008 Presidential Elections Results (%) - Democratic Party (Obama)
2008 Presidential Elections Results (%) - Republican Party (McCain)
2008 Presidential Elections Results (%) - Other
2012 Presidential Elections Results (%) - Democratic Party (Obama)
2012 Presidential Elections Results (%) - Republican Party (Romney)
2012 Presidential Elections Results (%) - Other
2016 Presidential Elections Results (%) - Democratic Party (Clinton)
2016 Presidential Elections Results (%) - Republican Party (Trump)
2016 Presidential Elections Results (%) - Other
2020 Presidential Elections Results (%) - Democratic Party (Biden)
2020 Presidential Elections Results (%) - Republican Party (Trump)
2020 Presidential Elections Results (%) - Other
Ancestries Reported - Arab (%)
Ancestries Reported - Czech (%)
Ancestries Reported - Danish (%)
Ancestries Reported - Dutch (%)
Ancestries Reported - English (%)
Ancestries Reported - French (%)
Ancestries Reported - French Canadian (%)
Ancestries Reported - German (%)
Ancestries Reported - Greek (%)
Ancestries Reported - Hungarian (%)
Ancestries Reported - Irish (%)
Ancestries Reported - Italian (%)
Ancestries Reported - Lithuanian (%)
Ancestries Reported - Norwegian (%)
Ancestries Reported - Polish (%)
Ancestries Reported - Portuguese (%)
Ancestries Reported - Russian (%)
Ancestries Reported - Scotch-Irish (%)
Ancestries Reported - Scottish (%)
Ancestries Reported - Slovak (%)
Ancestries Reported - Subsaharan African (%)
Ancestries Reported - Swedish (%)
Ancestries Reported - Swiss (%)
Ancestries Reported - Ukrainian (%)
Ancestries Reported - United States (%)
Ancestries Reported - Welsh (%)
Ancestries Reported - West Indian (%)
Ancestries Reported - Other (%)
Educational Attainment - No schooling completed (%)
Educational Attainment - Less than high school (%)
Educational Attainment - High school or equivalent (%)
Educational Attainment - Less than 1 year of college (%)
Educational Attainment - 1 or more years of college (%)
Educational Attainment - Associate degree (%)
Educational Attainment - Bachelor's degree (%)
Educational Attainment - Master's degree (%)
Educational Attainment - Professional school degree (%)
Educational Attainment - Doctorate degree (%)
School Enrollment - Nursery, preschool (%)
School Enrollment - Kindergarten (%)
School Enrollment - Grade 1 to 4 (%)
School Enrollment - Grade 5 to 8 (%)
School Enrollment - Grade 9 to 12 (%)
School Enrollment - College undergrad (%)
School Enrollment - Graduate or professional (%)
School Enrollment - Not enrolled in school (%)
School enrollment - Public schools (%)
School enrollment - Private schools (%)
School enrollment - Not enrolled (%)
Median number of rooms in houses and condos
Median number of rooms in apartments
Housing units lacking complete plumbing facilities (%)
Housing units lacking complete kitchen facilities (%)
Density of houses
Urban houses (%)
Rural houses (%)
Households with people 60 years and over (%)
Households with people 65 years and over (%)
Households with people 75 years and over (%)
Households with one or more nonrelatives (%)
Households with no nonrelatives (%)
Population in households (%)
Family households (%)
Nonfamily households (%)
Population in families (%)
Family households with own children (%)
Median number of bedrooms in owner occupied houses
Mean number of bedrooms in owner occupied houses
Median number of bedrooms in renter occupied houses
Mean number of bedrooms in renter occupied houses
Median number of vehichles in owner occupied houses
Mean number of vehichles in owner occupied houses
Median number of vehichles in renter occupied houses
Mean number of vehichles in renter occupied houses
Mortgage status - with mortgage (%)
Mortgage status - with second mortgage (%)
Mortgage status - with home equity loan (%)
Mortgage status - with both second mortgage and home equity loan (%)
Mortgage status - without a mortgage (%)
Average family size
Average family size - White
Average family size - Black or African American
Average family size - Asian
Average family size - Hispanic or Latino
Average family size - American Indian and Alaska Native
Average family size - Multirace
Average family size - Other Race
Geographical mobility - Same house 1 year ago (%)
Geographical mobility - Moved within same county (%)
Geographical mobility - Moved from different county within same state (%)
Geographical mobility - Moved from different state (%)
Geographical mobility - Moved from abroad (%)
Place of birth - Born in state of residence (%)
Place of birth - Born in other state (%)
Place of birth - Native, outside of US (%)
Place of birth - Foreign born (%)
Housing units in structures - 1, detached (%)
Housing units in structures - 1, attached (%)
Housing units in structures - 2 (%)
Housing units in structures - 3 or 4 (%)
Housing units in structures - 5 to 9 (%)
Housing units in structures - 10 to 19 (%)
Housing units in structures - 20 to 49 (%)
Housing units in structures - 50 or more (%)
Housing units in structures - Mobile home (%)
Housing units in structures - Boat, RV, van, etc. (%)
House/condo owner moved in on average (years ago)
Renter moved in on average (years ago)
Year householder moved into unit - Moved in 1999 to March 2000 (%)
Year householder moved into unit - Moved in 1995 to 1998 (%)
Year householder moved into unit - Moved in 1990 to 1994 (%)
Year householder moved into unit - Moved in 1980 to 1989 (%)
Year householder moved into unit - Moved in 1970 to 1979 (%)
Year householder moved into unit - Moved in 1969 or earlier (%)
Means of transportation to work - Drove car alone (%)
Means of transportation to work - Carpooled (%)
Means of transportation to work - Public transportation (%)
Means of transportation to work - Bus or trolley bus (%)
Means of transportation to work - Streetcar or trolley car (%)
Means of transportation to work - Subway or elevated (%)
Means of transportation to work - Railroad (%)
Means of transportation to work - Ferryboat (%)
Means of transportation to work - Taxicab (%)
Means of transportation to work - Motorcycle (%)
Means of transportation to work - Bicycle (%)
Means of transportation to work - Walked (%)
Means of transportation to work - Other means (%)
Working at home (%)
Industry diversity
Most Common Industries - Agriculture, forestry, fishing and hunting, and mining (%)
Most Common Industries - Agriculture, forestry, fishing and hunting (%)
Most Common Industries - Mining, quarrying, and oil and gas extraction (%)
Most Common Industries - Construction (%)
Most Common Industries - Manufacturing (%)
Most Common Industries - Wholesale trade (%)
Most Common Industries - Retail trade (%)
Most Common Industries - Transportation and warehousing, and utilities (%)
Most Common Industries - Transportation and warehousing (%)
Most Common Industries - Utilities (%)
Most Common Industries - Information (%)
Most Common Industries - Finance and insurance, and real estate and rental and leasing (%)
Most Common Industries - Finance and insurance (%)
Most Common Industries - Real estate and rental and leasing (%)
Most Common Industries - Professional, scientific, and management, and administrative and waste management services (%)
Most Common Industries - Professional, scientific, and technical services (%)
Most Common Industries - Management of companies and enterprises (%)
Most Common Industries - Administrative and support and waste management services (%)
Most Common Industries - Educational services, and health care and social assistance (%)
Most Common Industries - Educational services (%)
Most Common Industries - Health care and social assistance (%)
Most Common Industries - Arts, entertainment, and recreation, and accommodation and food services (%)
Most Common Industries - Arts, entertainment, and recreation (%)
Most Common Industries - Accommodation and food services (%)
Most Common Industries - Other services, except public administration (%)
Most Common Industries - Public administration (%)
Occupation diversity
Most Common Occupations - Management, business, science, and arts occupations (%)
Most Common Occupations - Management, business, and financial occupations (%)
Most Common Occupations - Management occupations (%)
Most Common Occupations - Business and financial operations occupations (%)
Most Common Occupations - Computer, engineering, and science occupations (%)
Most Common Occupations - Computer and mathematical occupations (%)
Most Common Occupations - Architecture and engineering occupations (%)
Most Common Occupations - Life, physical, and social science occupations (%)
Most Common Occupations - Education, legal, community service, arts, and media occupations (%)
Most Common Occupations - Community and social service occupations (%)
Most Common Occupations - Legal occupations (%)
Most Common Occupations - Education, training, and library occupations (%)
Most Common Occupations - Arts, design, entertainment, sports, and media occupations (%)
Most Common Occupations - Healthcare practitioners and technical occupations (%)
Most Common Occupations - Health diagnosing and treating practitioners and other technical occupations (%)
Most Common Occupations - Health technologists and technicians (%)
Most Common Occupations - Service occupations (%)
Most Common Occupations - Healthcare support occupations (%)
Most Common Occupations - Protective service occupations (%)
Most Common Occupations - Fire fighting and prevention, and other protective service workers including supervisors (%)
Most Common Occupations - Law enforcement workers including supervisors (%)
Most Common Occupations - Food preparation and serving related occupations (%)
Most Common Occupations - Building and grounds cleaning and maintenance occupations (%)
Most Common Occupations - Personal care and service occupations (%)
Most Common Occupations - Sales and office occupations (%)
Most Common Occupations - Sales and related occupations (%)
Most Common Occupations - Office and administrative support occupations (%)
Most Common Occupations - Natural resources, construction, and maintenance occupations (%)
Most Common Occupations - Farming, fishing, and forestry occupations (%)
Most Common Occupations - Construction and extraction occupations (%)
Most Common Occupations - Installation, maintenance, and repair occupations (%)
Most Common Occupations - Production, transportation, and material moving occupations (%)
Most Common Occupations - Production occupations (%)
Most Common Occupations - Transportation occupations (%)
Most Common Occupations - Material moving occupations (%)
People in Group quarters - Institutionalized population (%)
People in Group quarters - Correctional institutions (%)
People in Group quarters - Federal prisons and detention centers (%)
People in Group quarters - Halfway houses (%)
People in Group quarters - Local jails and other confinement facilities (including police lockups) (%)
People in Group quarters - Military disciplinary barracks (%)
People in Group quarters - State prisons (%)
People in Group quarters - Other types of correctional institutions (%)
People in Group quarters - Nursing homes (%)
People in Group quarters - Hospitals/wards, hospices, and schools for the handicapped (%)
People in Group quarters - Hospitals/wards and hospices for chronically ill (%)
People in Group quarters - Hospices or homes for chronically ill (%)
People in Group quarters - Military hospitals or wards for chronically ill (%)
People in Group quarters - Other hospitals or wards for chronically ill (%)
People in Group quarters - Hospitals or wards for drug/alcohol abuse (%)
People in Group quarters - Mental (Psychiatric) hospitals or wards (%)
People in Group quarters - Schools, hospitals, or wards for the mentally retarded (%)
People in Group quarters - Schools, hospitals, or wards for the physically handicapped (%)
People in Group quarters - Institutions for the deaf (%)
People in Group quarters - Institutions for the blind (%)
People in Group quarters - Orthopedic wards and institutions for the physically handicapped (%)
People in Group quarters - Wards in general hospitals for patients who have no usual home elsewhere (%)
People in Group quarters - Wards in military hospitals for patients who have no usual home elsewhere (%)
People in Group quarters - Juvenile institutions (%)
People in Group quarters - Long-term care (%)
People in Group quarters - Homes for abused, dependent, and neglected children (%)
People in Group quarters - Residential treatment centers for emotionally disturbed children (%)
People in Group quarters - Training schools for juvenile delinquents (%)
People in Group quarters - Short-term care, detention or diagnostic centers for delinquent children (%)
People in Group quarters - Type of juvenile institution unknown (%)
People in Group quarters - Noninstitutionalized population (%)
People in Group quarters - College dormitories (includes college quarters off campus) (%)
People in Group quarters - Military quarters (%)
People in Group quarters - On base (%)
People in Group quarters - Barracks, unaccompanied personnel housing (UPH), (Enlisted/Officer), ;and similar group living quarters for military personnel (%)
People in Group quarters - Transient quarters for temporary residents (%)
People in Group quarters - Military ships (%)
People in Group quarters - Group homes (%)
People in Group quarters - Homes or halfway houses for drug/alcohol abuse (%)
People in Group quarters - Homes for the mentally ill (%)
People in Group quarters - Homes for the mentally retarded (%)
People in Group quarters - Homes for the physically handicapped (%)
People in Group quarters - Other group homes (%)
People in Group quarters - Religious group quarters (%)
People in Group quarters - Dormitories (%)
People in Group quarters - Agriculture workers' dormitories on farms (%)
People in Group quarters - Job Corps and vocational training facilities (%)
People in Group quarters - Other workers' dormitories (%)
People in Group quarters - Crews of maritime vessels (%)
People in Group quarters - Other nonhousehold living situations (%)
People in Group quarters - Other noninstitutional group quarters (%)
Residents speaking English at home (%)
Residents speaking English at home - Born in the United States (%)
Residents speaking English at home - Native, born elsewhere (%)
Residents speaking English at home - Foreign born (%)
Residents speaking Spanish at home (%)
Residents speaking Spanish at home - Born in the United States (%)
Residents speaking Spanish at home - Native, born elsewhere (%)
Residents speaking Spanish at home - Foreign born (%)
Residents speaking other language at home (%)
Residents speaking other language at home - Born in the United States (%)
Residents speaking other language at home - Native, born elsewhere (%)
Residents speaking other language at home - Foreign born (%)
Class of Workers - Employee of private company (%)
Class of Workers - Self-employed in own incorporated business (%)
Class of Workers - Private not-for-profit wage and salary workers (%)
Class of Workers - Local government workers (%)
Class of Workers - State government workers (%)
Class of Workers - Federal government workers (%)
Class of Workers - Self-employed workers in own not incorporated business and Unpaid family workers (%)
House heating fuel used in houses and condos - Utility gas (%)
House heating fuel used in houses and condos - Bottled, tank, or LP gas (%)
House heating fuel used in houses and condos - Electricity (%)
House heating fuel used in houses and condos - Fuel oil, kerosene, etc. (%)
House heating fuel used in houses and condos - Coal or coke (%)
House heating fuel used in houses and condos - Wood (%)
House heating fuel used in houses and condos - Solar energy (%)
House heating fuel used in houses and condos - Other fuel (%)
House heating fuel used in houses and condos - No fuel used (%)
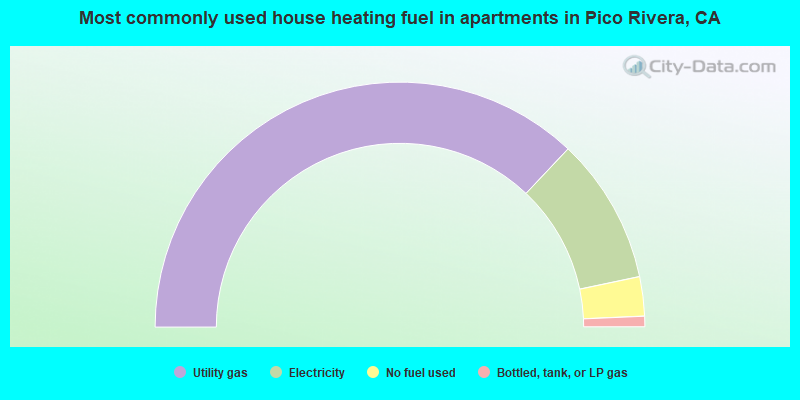
House heating fuel used in apartments - Utility gas (%)
House heating fuel used in apartments - Bottled, tank, or LP gas (%)
House heating fuel used in apartments - Electricity (%)
House heating fuel used in apartments - Fuel oil, kerosene, etc. (%)
House heating fuel used in apartments - Coal or coke (%)
House heating fuel used in apartments - Wood (%)
House heating fuel used in apartments - Solar energy (%)
House heating fuel used in apartments - Other fuel (%)
House heating fuel used in apartments - No fuel used (%)
Armed forces status - In Armed Forces (%)
Armed forces status - Civilian (%)
Armed forces status - Civilian - Veteran (%)
Armed forces status - Civilian - Nonveteran (%)
Fatal accidents locations in years 2005-2021
Fatal accidents locations in 2005
Fatal accidents locations in 2006
Fatal accidents locations in 2007
Fatal accidents locations in 2008
Fatal accidents locations in 2009
Fatal accidents locations in 2010
Fatal accidents locations in 2011
Fatal accidents locations in 2012
Fatal accidents locations in 2013
Fatal accidents locations in 2014
Fatal accidents locations in 2015
Fatal accidents locations in 2016
Fatal accidents locations in 2017
Fatal accidents locations in 2018
Fatal accidents locations in 2019
Fatal accidents locations in 2020
Fatal accidents locations in 2021
Alcohol use - People drinking some alcohol every month (%)
Alcohol use - People not drinking at all (%)
Alcohol use - Average days/month drinking alcohol
Alcohol use - Average drinks/week
Alcohol use - Average days/year people drink much
Audiometry - Average condition of hearing (%)
Audiometry - People that can hear a whisper from across a quiet room (%)
Audiometry - People that can hear normal voice from across a quiet room (%)
Audiometry - Ears ringing, roaring, buzzing (%)
Audiometry - Had a job exposure to loud noise (%)
Audiometry - Had off-work exposure to loud noise (%)
Blood Pressure & Cholesterol - Has high blood pressure (%)
Blood Pressure & Cholesterol - Checking blood pressure at home (%)
Blood Pressure & Cholesterol - Frequently checking blood cholesterol (%)
Blood Pressure & Cholesterol - Has high cholesterol level (%)
Consumer Behavior - Money monthly spent on food at supermarket/grocery store
Consumer Behavior - Money monthly spent on food at other stores
Consumer Behavior - Money monthly spent on eating out
Consumer Behavior - Money monthly spent on carryout/delivered foods
Consumer Behavior - Income spent on food at supermarket/grocery store (%)
Consumer Behavior - Income spent on food at other stores (%)
Consumer Behavior - Income spent on eating out (%)
Consumer Behavior - Income spent on carryout/delivered foods (%)
Current Health Status - General health condition (%)
Current Health Status - Blood donors (%)
Current Health Status - Has blood ever tested for HIV virus (%)
Current Health Status - Left-handed people (%)
Dermatology - People using sunscreen (%)
Diabetes - Diabetics (%)
Diabetes - Had a blood test for high blood sugar (%)
Diabetes - People taking insulin (%)
Diet Behavior & Nutrition - Diet health (%)
Diet Behavior & Nutrition - Milk product consumption (# of products/month)
Diet Behavior & Nutrition - Meals not home prepared (#/week)
Diet Behavior & Nutrition - Meals from fast food or pizza place (#/week)
Diet Behavior & Nutrition - Ready-to-eat foods (#/month)
Diet Behavior & Nutrition - Frozen meals/pizza (#/month)
Drug Use - People that ever used marijuana or hashish (%)
Drug Use - Ever used hard drugs (%)
Drug Use - Ever used any form of cocaine (%)
Drug Use - Ever used heroin (%)
Drug Use - Ever used methamphetamine (%)
Health Insurance - People covered by health insurance (%)
Kidney Conditions-Urology - Avg. # of times urinating at night
Medical Conditions - People with asthma (%)
Medical Conditions - People with anemia (%)
Medical Conditions - People with psoriasis (%)
Medical Conditions - People with overweight (%)
Medical Conditions - Elderly people having difficulties in thinking or remembering (%)
Medical Conditions - People who ever received blood transfusion (%)
Medical Conditions - People having trouble seeing even with glass/contacts (%)
Medical Conditions - People with arthritis (%)
Medical Conditions - People with gout (%)
Medical Conditions - People with congestive heart failure (%)
Medical Conditions - People with coronary heart disease (%)
Medical Conditions - People with angina pectoris (%)
Medical Conditions - People who ever had heart attack (%)
Medical Conditions - People who ever had stroke (%)
Medical Conditions - People with emphysema (%)
Medical Conditions - People with thyroid problem (%)
Medical Conditions - People with chronic bronchitis (%)
Medical Conditions - People with any liver condition (%)
Medical Conditions - People who ever had cancer or malignancy (%)
Mental Health - People who have little interest in doing things (%)
Mental Health - People feeling down, depressed, or hopeless (%)
Mental Health - People who have trouble sleeping or sleeping too much (%)
Mental Health - People feeling tired or having little energy (%)
Mental Health - People with poor appetite or overeating (%)
Mental Health - People feeling bad about themself (%)
Mental Health - People who have trouble concentrating on things (%)
Mental Health - People moving or speaking slowly or too fast (%)
Mental Health - People having thoughts they would be better off dead (%)
Oral Health - Average years since last visit a dentist
Oral Health - People embarrassed because of mouth (%)
Oral Health - People with gum disease (%)
Oral Health - General health of teeth and gums (%)
Oral Health - Average days a week using dental floss/device
Oral Health - Average days a week using mouthwash for dental problem
Oral Health - Average number of teeth
Pesticide Use - Households using pesticides to control insects (%)
Pesticide Use - Households using pesticides to kill weeds (%)
Physical Activity - People doing vigorous-intensity work activities (%)
Physical Activity - People doing moderate-intensity work activities (%)
Physical Activity - People walking or bicycling (%)
Physical Activity - People doing vigorous-intensity recreational activities (%)
Physical Activity - People doing moderate-intensity recreational activities (%)
Physical Activity - Average hours a day doing sedentary activities
Physical Activity - Average hours a day watching TV or videos
Physical Activity - Average hours a day using computer
Physical Functioning - People having limitations keeping them from working (%)
Physical Functioning - People limited in amount of work they can do (%)
Physical Functioning - People that need special equipment to walk (%)
Physical Functioning - People experiencing confusion/memory problems (%)
Physical Functioning - People requiring special healthcare equipment (%)
Prescription Medications - Average number of prescription medicines taking
Preventive Aspirin Use - Adults 40+ taking low-dose aspirin (%)
Reproductive Health - Vaginal deliveries (%)
Reproductive Health - Cesarean deliveries (%)
Reproductive Health - Deliveries resulted in a live birth (%)
Reproductive Health - Pregnancies resulted in a delivery (%)
Reproductive Health - Women breastfeeding newborns (%)
Reproductive Health - Women that had a hysterectomy (%)
Reproductive Health - Women that had both ovaries removed (%)
Reproductive Health - Women that have ever taken birth control pills (%)
Reproductive Health - Women taking birth control pills (%)
Reproductive Health - Women that have ever used Depo-Provera or injectables (%)
Reproductive Health - Women that have ever used female hormones (%)
Sexual Behavior - People 18+ that ever had sex (vaginal, anal, or oral) (%)
Sexual Behavior - Males 18+ that ever had vaginal sex with a woman (%)
Sexual Behavior - Males 18+ that ever performed oral sex on a woman (%)
Sexual Behavior - Males 18+ that ever had anal sex with a woman (%)
Sexual Behavior - Males 18+ that ever had any sex with a man (%)
Sexual Behavior - Females 18+ that ever had vaginal sex with a man (%)
Sexual Behavior - Females 18+ that ever performed oral sex on a man (%)
Sexual Behavior - Females 18+ that ever had anal sex with a man (%)
Sexual Behavior - Females 18+ that ever had any kind of sex with a woman (%)
Sexual Behavior - Average age people first had sex
Sexual Behavior - Average number of female sex partners in lifetime (males 18+)
Sexual Behavior - Average number of female vaginal sex partners in lifetime (males 18+)
Sexual Behavior - Average age people first performed oral sex on a woman (18+)
Sexual Behavior - Average number of woman performed oral sex on in lifetime (18+)
Sexual Behavior - Average number of male sex partners in lifetime (males 18+)
Sexual Behavior - Average number of male anal sex partners in lifetime (males 18+)
Sexual Behavior - Average age people first performed oral sex on a man (18+)
Sexual Behavior - Average number of male oral sex partners in lifetime (18+)
Sexual Behavior - People using protection when performing oral sex (%)
Sexual Behavior - Average number of times people have vaginal or anal sex a year
Sexual Behavior - People having sex without condom (%)
Sexual Behavior - Average number of male sex partners in lifetime (females 18+)
Sexual Behavior - Average number of male vaginal sex partners in lifetime (females 18+)
Sexual Behavior - Average number of female sex partners in lifetime (females 18+)
Sexual Behavior - Circumcised males 18+ (%)
Sleep Disorders - Average hours sleeping at night
Sleep Disorders - People that has trouble sleeping (%)
Smoking-Cigarette Use - People smoking cigarettes (%)
Taste & Smell - People 40+ having problems with smell (%)
Taste & Smell - People 40+ having problems with taste (%)
Taste & Smell - People 40+ that ever had wisdom teeth removed (%)
Taste & Smell - People 40+ that ever had tonsils teeth removed (%)
Taste & Smell - People 40+ that ever had a loss of consciousness because of a head injury (%)
Taste & Smell - People 40+ that ever had a broken nose or other serious injury to face or skull (%)
Taste & Smell - People 40+ that ever had two or more sinus infections (%)
Weight - Average height (inches)
Weight - Average weight (pounds)
Weight - Average BMI
Weight - People that are obese (%)
Weight - People that ever were obese (%)
Weight - People trying to lose weight (%)
54,865 91.1% Hispanic 2,661 4.4% White alone 2,097 3.5% Asian alone 503 0.8% Black alone 196 0.3% American Indian alone 167 0.3% Two or more races 63 0.1% Other race alone 6 0.01% Native Hawaiian and Other
The City-Data.com crime index weighs serious crimes and violent crimes more heavily. Higher means more crime, U.S. average is 246.1. It adjusts for the number of visitors and daily workers commuting into cities.
- means the value is smaller than the state average.
- means the value is about the same as the state average.
- means the value is bigger than the state average.
- means the value is much bigger than the state average.
Crime rate in Pico Rivera detailed stats: murders, rapes, robberies, assaults, burglaries, thefts, arson Officers per 1,000 residents here:
0.02California average:
1.98
Latest news from Pico Rivera, CA collected exclusively by city-data.com from local newspapers, TV, and radio stations
Ancestries: American (3.6%).
Current Local Time:
Land area: 8.30 square miles.
Population density: 7,206 people per square mile (high).
18,155 residents are foreign born (27.2% Latin America ).
This city:
30.1%California:
26.5%
Median real estate property taxes paid for housing units with mortgages in 2022: $4,498 (0.7%)Median real estate property taxes paid for housing units with no mortgage in 2022: $2,518 (0.4%)
Nearest city with pop. 200,000+: Southwest San Gabriel Valley, CA (5.4 miles
Nearest city with pop. 1,000,000+: Los Angeles, CA
Nearest cities:
Latitude: 33.99 N, Longitude: 118.09 W
Daytime population change due to commuting: -10,739 (-17.8%)Workers who live and work in this city: 5,437 (18.8%)
Property values in Pico Rivera, CA
Single-family new house construction building permits:
2022: 53 buildings , average cost: $84,1002021: 48 buildings , average cost: $78,1002020: 39 buildings , average cost: $54,0002019: 13 buildings , average cost: $230,0002018: 13 buildings , average cost: $230,2002017: 12 buildings , average cost: $229,8002016: 2 buildings , average cost: $235,3002015: 4 buildings , average cost: $235,3002014: 4 buildings , average cost: $235,3002013: 3 buildings , average cost: $258,1002012: 3 buildings , average cost: $262,3002011: 1 building , cost: $337,9002010: 9 buildings , average cost: $157,7002009: 1 building , cost: $78,1002008: 3 buildings , average cost: $290,6002007: 48 buildings , average cost: $171,9002006: 3 buildings , average cost: $111,3002005: 8 buildings , average cost: $223,4002004: 3 buildings , average cost: $263,3002003: 17 buildings , average cost: $183,6002002: 79 buildings , average cost: $96,8002001: 42 buildings , average cost: $143,8002000: 4 buildings , average cost: $117,6001999: 71 buildings , average cost: $144,7001998: 133 buildings , average cost: $143,1001997: 59 buildings , average cost: $112,000Unemployment in December 2023:
Population change in the 1990s: +4,159 (+7.0%).
Most common occupations in Pico Rivera, CA (%)
Both Males Females
Other production occupations, including supervisors (6.5%)
Driver/sales workers and truck drivers (6.2%)
Material recording, scheduling, dispatching, and distributing workers (4.6%)
Other office and administrative support workers, including supervisors (4.4%)
Laborers and material movers, hand (3.8%)
Building and grounds cleaning and maintenance occupations (3.4%)
Other sales and related occupations, including supervisors (3.2%)
Driver/sales workers and truck drivers (10.6%)
Other production occupations, including supervisors (8.3%)
Material recording, scheduling, dispatching, and distributing workers (5.9%)
Laborers and material movers, hand (4.9%)
Metal workers and plastic workers (4.8%)
Electrical equipment mechanics and other installation, maintenance, and repair workers, including supervisors (4.3%)
Building and grounds cleaning and maintenance occupations (3.9%)
Other office and administrative support workers, including supervisors (7.7%)
Secretaries and administrative assistants (5.5%)
Cashiers (5.0%)
Textile, apparel, and furnishings workers (4.6%)
Other production occupations, including supervisors (4.3%)
Information and record clerks, except customer service representatives (4.2%)
Other teachers, instructors, education, training, and library occupations (4.1%)
Earthquake activity:
Pico Rivera-area historical earthquake activity is significantly above California state average. It is 7017% greater than the overall U.S. average. On 7/21/1952 at 11:52:14, a magnitude 7.7 (7.7 UK, Class: Major, Intensity: VIII - XII) earthquake occurred 87.1 miles away from Pico Rivera center, causing $50,000,000 total damage On 6/28/1992 at 11:57:34, a magnitude 7.6 (6.2 MB, 7.6 MS, 7.3 MW, Depth: 0.7 mi) earthquake occurred 90.2 miles away from the city center, causing 3 deaths ( 1 shaking deaths, 2 other deaths) and 400 injuries, causing $100,000,000 total damage and $40,000,000 insured lossesOn 10/16/1999 at 09:46:44, a magnitude 7.4 (6.3 MB, 7.4 MS, 7.2 MW, 7.3 ML) earthquake occurred 101.3 miles away from the city center On 11/4/1927 at 13:51:53, a magnitude 7.5 (7.5 UK) earthquake occurred 179.6 miles away from the city center On 1/17/1994 at 12:30:55, a magnitude 6.8 (6.4 MB, 6.8 MS, 6.7 MW, Depth: 11.4 mi, Class: Strong, Intensity: VII - IX) earthquake occurred 30.1 miles away from the city center, causing 60 deaths ( 60 shaking deaths) and 7000 injuriesOn 4/21/1918 at 22:32:30, a magnitude 6.8 (6.8 UK) earthquake occurred 39.2 miles away from the city center Magnitude types: body-wave magnitude (MB), local magnitude (ML), surface-wave magnitude (MS), moment magnitude (MW) Natural disasters: The number of natural disasters in Los Angeles County (57) is a lot greater than the US average (15).Major Disasters (Presidential) Declared: 27Emergencies Declared: 3Fires: 37, Floods: 16, Storms: 9, Winter Storms: 6, Landslides: 5, Mudslides: 5, Earthquakes: 3, Freeze: 1, Heavy Rain: 1, Hurricane: 1, Snow: 1, Tornado: 1, Wind: 1, Other: 1 (Note: some incidents may be assigned to more than one category). Hospitals and medical centers in Pico Rivera: PICO RIVERA COMMUNITY HOSPITAL (5216 S ROSEMEAD BLVD) COLONIAL GARDENS NURSING HOME (7246 S. ROSEMEAD BLVD.)
EL RANCHO VISTA HEALTH CARE CENTER (8925 MINES AVENUE)
PICO RIVERA HEALTH CARE CENTER (9140 VERNER STREET)
RIVIERA HEALTHCARE CENTER (8203 TELEGRAPH RD)
Amtrak stations near Pico Rivera: 10 miles: LOS ANGELES (800 N. ALAMEDA ST.) Services: ticket office, fully wheelchair accessible, enclosed waiting area, public restrooms, public payphones, snack bar, free short-term parking, paid long-term parking, car rental agency, taxi stand, public transit connection.
12 miles: PASADENA (150 S. ROBLES AVE.) - Bus Station Services: fully wheelchair accessible, enclosed waiting area, public restrooms, public payphones, full-service food facilities, paid short-term parking, paid long-term parking, taxi stand, public transit connection.
13 miles: FULLERTON (120 E. SANTA FE AVE.) Services: ticket office, fully wheelchair accessible, enclosed waiting area, public restrooms, public payphones, full-service food facilities, free short-term parking, paid long-term parking, taxi stand, public transit connection.
College/University in Pico Rivera: David's Academy of Beauty Full-time enrollment: 256; Location: 8652 E. Whittier Blvd; Private, for-profit; Website: davidsacademyofbeauty.com/)
Colleges/universities with over 2000 students nearest to Pico Rivera:
Rio Hondo College (about 4 miles; Whittier, CA ; Full-time enrollment: 9,610)
East Los Angeles College (about 5 miles; Monterey Park, CA ; FT enrollment: 17,297)
California State University-Los Angeles (about 8 miles; Los Angeles, CA ; FT enrollment: 17,545)
Biola University (about 8 miles; La Mirada, CA ; FT enrollment: 5,325)
Cerritos College (about 8 miles; Norwalk, CA ; FT enrollment: 13,090)
Hacienda La Puente Adult Education (about 8 miles; La Puente, CA ; FT enrollment: 2,750)
ICDC College (about 8 miles; Huntington Park, CA ; FT enrollment: 2,621)
Public high schools in Pico Rivera:
Private high school in Pico Rivera: ARMENIAN MESROBIAN SCHOOL Students: 156, Location: 8420 BEVERLY RD, Grades: PK-12)
Biggest public elementary/middle schools in Pico Rivera: RIVERA MIDDLE Students: 978, Location: 7200 CITRONELL AVE., Grades: 6-8)NORTH PARK MIDDLE Students: 790, Location: 4450 S. DURFEE AVE., Grades: 6-8)RIVERA ELEMENTARY Students: 453, Location: 7250 CITRONELL ST., Grades: KG-5)SOUTH RANCHITO ELEMENTARY Students: 430, Location: 5241 S. PASSONS BLVD., Grades: KG-5)ALICE M. BIRNEY ELEMENTARY Students: 415, Location: 8501 ORANGE AVE., Grades: KG-5)LAWRENCE T. MAGEE ELEMENTARY Students: 390, Location: 8200 SERAPIS AVE., Grades: KG-5)NORTH RANCHITO ELEMENTARY Students: 362, Location: 8837 E. OLYMPIC BLVD., Grades: KG-5)RIO VISTA ELEMENTARY Students: 326, Location: 8809 COFFMAN-PICO RD., Grades: KG-5)VALENCIA ELEMENTARY Students: 290, Location: 9241 E. COSGROVE ST., Grades: KG-5)MONTEBELLO GARDENS ELEMENTARY Students: 148, Location: 4700 PINE ST., Grades: KG-5)Private elementary/middle schools in Pico Rivera: ST HILARY ELEMENTARY SCHOOL Students: 243, Location: 5401 CITRONELL AVE, Grades: KG-8)
ST MARIANNE SCHOOL Students: 217, Location: 7911 BUHMAN AVE, Grades: KG-8)
See full list of schools located in Pico Rivera
Notable locations in Pico Rivera: (A) , Pico Rivera Sports Arena (B) , Rivera Branch County of Los Angeles Public Library (C) , Pico Rivera Branch County of Los Angeles Public Library (D) , Pico Rivera Sheriffs Station (E) , Los Angeles County Fire Department Station 103 (F) , Los Angeles County Fire Department Station 40 (G) , Los Angeles County Fire Department Station 25 (H) . Display/hide their locations on the map
Shopping Center: (1) . Display/hide its location on the map
Churches in Pico Rivera include: (A) , First Bilingual Baptist Church (B) , Church of Jesus Christ of Latter Day Saints (C) , Shia Ithnaasheri Islamic Center (D) , Peace Lutheran Church (E) , Rivera Bapitst Church (F) , Pico First Baptist Church (G) , Pico Rivera Bible Church (H) , Rivera First Baptist Church (I) . Display/hide their locations on the map
Creek: (A) . Display/hide its location on the map
Parks in Pico Rivera include: (1) , Rio Hondo Park (2) , Rivera Park (3) , William A Smith Park (4) , Pico Rivera Bicentennial Park (5) , Streamland Park (6) . Display/hide their locations on the map
Hotel:
Birthplace of: Jennifer Syme - Actress, Dennis Morrison - Football player.
Los Angeles County has a predicted average indoor radon screening level between 2 and 4 pCi/L (pico curies per liter) - Moderate Potential Average household size: This city:
3.8 peopleCalifornia:
2.9 people
Percentage of family households: This city:
82.4%Whole state:
68.7%
Percentage of households with unmarried partners: This city:
6.8%Whole state:
7.2%
Likely homosexual households (counted as self-reported same-sex unmarried-partner households)
Lesbian couples: 0.3% of all households Gay men: 0.2% of all households
People in group quarters in Pico Rivera in 2010:
415 people in nursing facilities/skilled-nursing facilities
28 people in group homes intended for adults
11 people in other noninstitutional facilities
People in group quarters in Pico Rivera in 2000:
335 people in nursing homes
10 people in homes or halfway houses for drug/alcohol abuse
5 people in religious group quarters
Banks with branches in Pico Rivera (2011 data):
JPMorgan Chase Bank, National Association: East Slauson Branch, Pico Rivera Washington Street Bankin, Pico Rivera Branch. Info updated 2011/11/10: Bank assets: $1,811,678.0 mil, Deposits: $1,190,738.0 mil, headquarters in Columbus, OH, positive income , International Specialization, 5577 total offices , Holding Company: Jpmorgan Chase & Co.
Pacific Western Bank: Pico Rivera Branch at 8810 East Whittier Boulevard, branch established on 1980/11/13. Info updated 2011/03/14: Bank assets: $5,513.1 mil, Deposits: $4,614.5 mil, headquarters in Los Angeles, CA, positive income , Commercial Lending Specialization, 78 total offices , Holding Company: Capgen Capital Group Ii Lp
Bank of America, National Association: Pico Rivera Branch (Instore Gigante at 9100 Whittier Boulevard, branch established on 2001/05/16. Info updated 2009/11/18: Bank assets: $1,451,969.3 mil, Deposits: $1,077,176.8 mil, headquarters in Charlotte, NC, positive income , 5782 total offices , Holding Company: Bank Of America Corporation
Preferred Bank: Pico Rivera Branch at 7004 Rosemead Blvd, branch established on 2008/12/30. Info updated 2009/03/03: Bank assets: $1,309.8 mil, Deposits: $1,118.0 mil, headquarters in Los Angeles, CA, positive income , Commercial Lending Specialization, 10 total offices
Wells Fargo Bank, National Association: Pico Rivera Branch at 8737 Washington Boulevard, branch established on 1956/11/19. Info updated 2011/04/05: Bank assets: $1,161,490.0 mil, Deposits: $905,653.0 mil, headquarters in Sioux Falls, SD, positive income , 6395 total offices , Holding Company: Wells Fargo & Company
Bank of the West: Pico Rivera Branch at 9001 East Whittier Boulevard, branch established on 1966/07/18. Info updated 2009/11/16: Bank assets: $62,408.3 mil, Deposits: $43,995.2 mil, headquarters in San Francisco, CA, positive income , 647 total offices , Holding Company: Bnp Paribas
For population 15 years and over in Pico Rivera:
Never married: 41.9%Now married: 43.5%Separated: 1.7%Widowed: 5.2%Divorced: 7.6% For population 25 years and over in Pico Rivera:
High school or higher: 71.7%Bachelor's degree or higher: 14.5%Graduate or professional degree: 3.8%Unemployed: 7.2%Mean travel time to work (commute): 26.6 minutes
Education Gini index (Inequality in education) Here:
19.4California average:
15.5
Religion statistics for Pico Rivera, CA (based on Los Angeles County data)
Religion Adherents Congregations Catholic 3,542,994 275 Evangelical Protestant 814,611 3,249 Other 451,594 1,023 Mainline Protestant 229,056 860 Black Protestant 112,338 290 Orthodox 63,517 76 None 4,604,495 -
Source: Clifford Grammich, Kirk Hadaway, Richard Houseal, Dale E.Jones, Alexei Krindatch, Richie Stanley and Richard H.Taylor. 2012. 2010 U.S.Religion Census: Religious Congregations & Membership Study. Association of Statisticians of American Religious Bodies. Jones, Dale E., et al. 2002. Congregations and Membership in the United States 2000. Nashville, TN: Glenmary Research Center. Graphs represent county-level data
Food Environment Statistics: Number of grocery stores : 2,084Los Angeles County :
2.12 / 10,000 pop.California :
2.14 / 10,000 pop.
Number of supercenters and club stores : 32Los Angeles County :
0.03 / 10,000 pop.California :
0.04 / 10,000 pop.
Number of convenience stores (no gas) : 567Los Angeles County :
0.58 / 10,000 pop.California :
0.62 / 10,000 pop.
Number of convenience stores (with gas) : 1,206Here :
1.23 / 10,000 pop.California :
1.49 / 10,000 pop.
Number of full-service restaurants : 7,008Here :
7.15 / 10,000 pop.State :
7.42 / 10,000 pop.
Adult diabetes rate : Los Angeles County :
7.5%State :
7.3%
Adult obesity rate : This county :
20.4%State :
21.3%
Low-income preschool obesity rate : Los Angeles County :
18.6%California :
17.9%
Health and Nutrition: Healthy diet rate : Pico Rivera:
46.9%California:
49.4%
Average overall health of teeth and gums : Pico Rivera:
45.8%State:
48.0%
Average BMI : Pico Rivera:
28.6California:
28.1
People feeling badly about themselves : Pico Rivera:
22.2%State:
20.2%
People not drinking alcohol at all : Pico Rivera:
12.1%California:
11.2%
Average hours sleeping at night : Pico Rivera:
6.8California:
6.8
Overweight people : Pico Rivera:
32.8%State:
31.5%
General health condition : This city:
53.1%California:
56.4%
Average condition of hearing : This city:
81.3%California:
80.9%
More about Health and Nutrition of Pico Rivera, CA Residents
Local government employment and payroll (March 2022)
Function
Full-time employees
Monthly full-time payroll
Average yearly full-time wage
Part-time employees
Monthly part-time payroll
Streets and Highways
63 $432,180 $82,320 14 $48,314 Parks and Recreation
23 $180,926 $94,396 90 $120,044 Water Supply
22 $215,425 $117,505 1 $221 Other Government Administration
15 $144,323 $115,458 6 $5,895 Financial Administration
14 $93,141 $79,835 0 $0 Housing and Community Development (Local)
4 $27,230 $81,690 0 $0
Totals for Government
141 $1,093,225 $93,040 111 $174,474
Pico Rivera government finances - Expenditure in 2017 (per resident):
Construction - Regular Highways: $16,902,000 ($282.73)
Parks and Recreation: $1,052,000 ($17.60)Housing and Community Development: $1,014,000 ($16.96)Central Staff Services: $782,000 ($13.08)Water Utilities: $30,000 ($0.50)Current Operations - Central Staff Services: $13,870,000 ($232.01)
Police Protection: $12,288,000 ($205.55)Regular Highways: $9,107,000 ($152.34)Parks and Recreation: $8,173,000 ($136.72)Housing and Community Development: $5,706,000 ($95.45)Water Utilities: $5,094,000 ($85.21)Financial Administration: $5,067,000 ($84.76)Protective Inspection and Regulation - Other: $17,000 ($0.28)Solid Waste Management: $1,000 ($0.02)General - Interest on Debt: $656,000 ($10.97)
Other Capital Outlay - General - Other: $1,994,000 ($33.36)
Financial Administration: $21,000 ($0.35)Housing and Community Development: $5,000 ($0.08)Water Utilities - Interest on Debt: $2,449,000 ($40.97)
Pico Rivera government finances - Revenue in 2017 (per resident):
Charges - Other: $2,653,000 ($44.38)
Parks and Recreation: $2,269,000 ($37.96)Regular Highways: $714,000 ($11.94)Housing and Community Development: $305,000 ($5.10)Federal Intergovernmental - Other: $5,611,000 ($93.86)
Housing and Community Development: $547,000 ($9.15)Local Intergovernmental - Water Utilities: $1,079,000 ($18.05)
Other: $61,000 ($1.02)Miscellaneous - Interest Earnings: $2,365,000 ($39.56)
Fines and Forfeits: $959,000 ($16.04)General Revenue - Other: $271,000 ($4.53)Rents: $19,000 ($0.32)Donations From Private Sources: $12,000 ($0.20)Special Assessments: $1,000 ($0.02)Revenue - Water Utilities: $8,819,000 ($147.52)
State Intergovernmental - Other: $4,067,000 ($68.03)
Highways: $1,213,000 ($20.29)General Local Government Support: $22,000 ($0.37)Tax - General Sales and Gross Receipts: $10,541,000 ($176.33)
Property: $10,410,000 ($174.14)Other: $8,800,000 ($147.20)Public Utilities Sales: $4,858,000 ($81.26)Occupation and Business License - Other: $1,210,000 ($20.24)Other License: $702,000 ($11.74)Other Selective Sales: $422,000 ($7.06)Documentary and Stock Transfer: $160,000 ($2.68)
Pico Rivera government finances - Debt in 2017 (per resident):
Long Term Debt - Beginning Outstanding - Unspecified Public Purpose: $72,615,000 ($1214.68)
Outstanding Unspecified Public Purpose: $69,390,000 ($1160.74)Retired Unspecified Public Purpose: $3,225,000 ($53.95)
Pico Rivera government finances - Cash and Securities in 2017 (per resident):
Bond Funds - Cash and Securities: $854,000 ($14.29)
Other Funds - Cash and Securities: $73,021,000 ($1221.48)
2.98% of this county's 2021 resident taxpayers lived in other counties in 2020 ($81,235 average adjusted gross income )
Here:
2.98%California average:
5.19%
0.01% of residents moved from foreign countries ($155 average AGI )Los Angeles County:
0.01%California average:
0.03%
Top counties from which taxpayers relocated into this county between 2020 and 2021:
4.68% of this county's 2020 resident taxpayers moved to other counties in 2021 ($97,324 average adjusted gross income )
Here:
4.68%California average:
6.14%
0.01% of residents moved to foreign countries ($196 average AGI )Los Angeles County:
0.01%California average:
0.02%
Top counties to which taxpayers relocated from this county between 2020 and 2021:
Businesses in Pico Rivera, CA
Name Count Name Count
7-Eleven 2 Kroger 2 99 Cents Only Stores 1 LA Fitness 1 AutoZone 2 Little Caesars Pizza 1 Baskin-Robbins 2 Lowe's 1 Blockbuster 1 Marshalls 1 Burger King 1 McDonald's 4 CVS 2 Nike 1 Carl\s Jr. 1 Panda Express 2 Chuck E. Cheese's 1 Payless 2 Circle K 1 Pizza Hut 1 Cold Stone Creamery 1 RadioShack 2 Dairy Queen 1 Rite Aid 1 Dennys 1 Sprint Nextel 1 Domino's Pizza 2 Staples 1 Econo Lodge 1 Starbucks 2 El Pollo Loco 2 T-Mobile 6 FedEx 4 Taco Bell 2 GNC 1 Target 1 GameStop 1 U-Haul 1 H&R Block 3 UPS 3 Haworth 1 Verizon Wireless 1 Home Depot 1 Walgreens 1 Howard Johnson 1 Walmart 1 KFC 2 Wendy's 1
Strongest AM radio stations in Pico Rivera:
KTNQ (1020 AM; 50 kW; LOS ANGELES, CA; Owner: KTNQ-AM LICENSE CORP.)
KFI (640 AM; 50 kW; LOS ANGELES, CA; Owner: CAPSTAR TX LIMITED PARTNERSHIP)
KXTA (1150 AM; 50 kW; LOS ANGELES, CA; Owner: CITICASTERS LICENSES, L.P.)
KLAC (570 AM; 50 kW; LOS ANGELES, CA; Owner: AMFM RADIO LICENSES, L.L.C.)
KFWB (980 AM; 50 kW; LOS ANGELES, CA; Owner: INFINITY BROADCASTING OPERATIONS, INC.)
KMPC (1540 AM; 50 kW; LOS ANGELES, CA; Owner: ROSE CITY RADIO CORPORATION)
KDIS (1110 AM; 50 kW; PASADENA, CA; Owner: ABC,INC.)
KXMX (1190 AM; 25 kW; ANAHEIM, CA; Owner: NEW INSPIRATION BROADCASTING COMPANY)
KBLA (1580 AM; 50 kW; SANTA MONICA, CA)
KNX (1070 AM; 50 kW; LOS ANGELES, CA; Owner: INFINITY BROADCASTING OPERATIONS, INC.)
KRLA (870 AM; 20 kW; GLENDALE, CA; Owner: NEW INSPIRATION BROADCASTING COMPANY)
KSPN (710 AM; 50 kW; LOS ANGELES, CA; Owner: KABC-AM RADIO, INC.)
KPLS (830 AM; 50 kW; ORANGE, CA; Owner: CRN LICENSES, LLC)
Strongest FM radio stations in Pico Rivera:
KZLA-FM (93.9 FM; LOS ANGELES, CA; Owner: EMMIS RADIO LICENSE CORPORATION)
KPWR (105.9 FM; LOS ANGELES, CA; Owner: EMMIS RADIO LICENSE CORPORATION)
KLSX (97.1 FM; LOS ANGELES, CA; Owner: INFINITY BROADCASTING OPERATIONS, INC.)
KUSC (91.5 FM; LOS ANGELES, CA; Owner: UNIVERSITY OF SOUTHERN CALIFORNIA)
KKLA-FM (99.5 FM; LOS ANGELES, CA; Owner: NEW INSPIRATION BROADCASTING CO., INC.)
KCBS-FM (93.1 FM; LOS ANGELES, CA; Owner: INFINITY BROADCASTING OPERATIONS, INC.)
KSCA (101.9 FM; GLENDALE, CA; Owner: HBC LICENSE CORPORATION)
KLOS (95.5 FM; LOS ANGELES, CA; Owner: KLOS-FM RADIO, INC.)
KOST (103.5 FM; LOS ANGELES, CA; Owner: CAPSTAR TX LIMITED PARTNERSHIP)
K212FA (90.3 FM; TEMPLE CITY, CA; Owner: EDUCATIONAL MEDIA FOUNDATION)
KIIS-FM (102.7 FM; LOS ANGELES, CA; Owner: CITICASTERS LICENSES, L.P.)
KLVE (107.5 FM; LOS ANGELES, CA; Owner: KLVE-FM LICENSE CORP.)
KRTH-FM (101.1 FM; LOS ANGELES, CA; Owner: INFINITY BROADCASTING OPERATIONS, INC.)
KPCC (89.3 FM; PASADENA, CA; Owner: PASADENA AREA COMMUNITY COLLEGE DISTRICT)
KHHT (92.3 FM; LOS ANGELES, CA; Owner: AMFM RADIO LICENSES, L.L.C.)
KBIG-FM (104.3 FM; LOS ANGELES, CA; Owner: AMFM RADIO LICENSES, L.L.C.)
KTWV (94.7 FM; LOS ANGELES, CA; Owner: INFINITY BROADCASTING OPERATIONS, INC.)
KMZT-FM (105.1 FM; LOS ANGELES, CA; Owner: MOUNT WILSON FM BROADCASTERS, INC.)
KPFK (90.7 FM; LOS ANGELES, CA; Owner: PACIFICA FOUNDATION, INC)
K216EM (91.1 FM; ARCADIA, CA; Owner: LIFE ON THE WAY COMMUNICATIONS, INC.)
TV broadcast stations around Pico Rivera:
KCBS-TV (Channel 2; LOS ANGELES, CA; Owner: CBS BROADCASTING INC.)
KTRO-LP (Channel 50; LANCASTER, CA; Owner: ROBERT D. ADELMAN)
KTLA-TV (Channel 5; LOS ANGELES, CA; Owner: KTLA INC.)
KABC-TV (Channel 7; LOS ANGELES, CA; Owner: ABC HOLDING COMPANY, INC.)
KCAL-TV (Channel 9; LOS ANGELES, CA; Owner: VIACOM TELEVISION STATIONS GROUP OF LOS ANGELES LLC)
KNBC (Channel 4; LOS ANGELES, CA; Owner: NBC SUBSIDIARY (KNBC-TV), INC.)
KMEX-TV (Channel 34; LOS ANGELES, CA; Owner: KMEX LICENSE PARTNERSHIP, G.P.)
KAZA-TV (Channel 54; AVALON, CA; Owner: PAPPAS SOUTHERN CALIFORNIA LICENSE LLC)
KHIZ (Channel 64; BARSTOW, CA; Owner: SUNBELT TELEVISION, INC.)
KSCI (Channel 18; LONG BEACH, CA; Owner: KSLS, INC.)
KDOC-TV (Channel 56; ANAHEIM, CA; Owner: GOLDEN ORANGE BROADCASTING CO., INC.)
KOCE-TV (Channel 50; HUNTINGTON BEACH, CA; Owner: BD. OF TRUSTEES, COAST COMMUNITY COLLEGE DIST.)
KXLA (Channel 44; RANCHO PALOS VERDES, CA; Owner: RANCHO PALOS VERDES BROADCASTERS, INC.)
KCET (Channel 28; LOS ANGELES, CA; Owner: COMMUNITY TELEVISION OF SOUTHERN CALIFORNIA)
KFTR (Channel 46; ONTARIO, CA; Owner: TELEFUTURA LOS ANGELES LLC)
KTTV (Channel 11; LOS ANGELES, CA; Owner: FOX TELEVISION STATIONS, INC.)
KWHY-TV (Channel 22; LOS ANGELES, CA; Owner: TELEMUNDO OF LOS ANGELES LICENSE CORPORATION)
KVEA (Channel 52; CORONA, CA; Owner: ESTRELLA LICENSE CORPORATION)
KCOP-TV (Channel 13; LOS ANGELES, CA; Owner: FOX TELEVISION STATIONS, INC.)
KTBN-TV (Channel 40; SANTA ANA, CA; Owner: TRINITY BROADCASTING NETWORK, INC.)
KSFV-LP (Channel 26; SAN FERNANDO VALLEY, CA; Owner: VENTURE TECHNOLOGIES GROUP, LLC)
KLCS (Channel 58; LOS ANGELES, CA; Owner: LOS ANGELES UNIFIED SCHOOL DISTRICT)
National Bridge Inventory (NBI) Statistics 32 Number of bridges604ft / 184m Total length $35,169,000 Total costs1,679,627 Total average daily traffic159,238 Total average daily truck traffic
New bridges - historical statistics
1 1920-1929 3 1930-1939 2 1940-1949 11 1950-1959 10 1960-1969 1 1970-1979 2 2000-2009 2 2010-2019
See full National Bridge Inventory statistics for Pico Rivera, CA
FCC Registered Antenna Towers: 6
Dale R Smith, Pio Pico Womand Club 2ca32439 (Lat: 33.989694 Lon: -118.086778), Type: 16.8, Overall height: 16.8 m, Registrant: Mobilitie Investments Ii, LLC, Pm@mobilitie.Com, , Newpo-rt Beach, Phone: (949) 515-1500 Dale R Smith, Pio Pico Womand Club 2ca32439 (Lat: 33.989694 Lon: -118.086778), Type: 16.8, Overall height: 16.8 m, Registrant: Mobilitie Investments Ii, LLC, Pm@mobilitie.Com, , Newpo-rt Beach, Phone: (949) 515-1500 Edward G Roach, Pio Pico Womand Club 2ca32439 (Lat: 33.989694 Lon: -118.086778), Type: 16.8, Overall height: 16.8 m, Registrant: Sba Monarch Towers Ii, LLC, Eroach@sbasite.Com, , Boca -Raton, Phone: (561) 995-7670 Edward G Roach, Pio Pico Womand Club 2ca32439 (Lat: 33.989694 Lon: -118.086778), Type: 16.8, Structure height: 06037 m, Overall height: 16.8 m, Registrant: Sba Monarch Towers Ii, LLC, Eroach@sbasite.Com, , Boca -Raton, Phone: (561) 995-7670 4500 Rosemead (Lat: 34.009722 Lon: -118.080000), Type: 20.1, Overall height: 18.3 m, Registrant: Pacific Bell Mobile Services, Pleas-anton, Phone: (510) 227-3059 6630 Rosemead Blvd (Lat: 33.984167 Lon: -118.095556), Type: 13.7, Overall height: 13.1 m, Registrant: Pacific Bell Mobile Services, Pleas-anton, Phone: (510) 227-3059 FCC Registered Broadcast Land Mobile Towers: 25 (
See the full list of FCC Registered Broadcast Land Mobile Towers in Pico Rivera, CA )
FCC Registered Microwave Towers: 38 (
See the full list of FCC Registered Microwave Towers in this town )
FCC Registered Amateur Radio Licenses: 121 (
See the full list of FCC Registered Amateur Radio Licenses in Pico Rivera )
FAA Registered Aircraft: 8 (
See the full list of FAA Registered Aircraft in Pico Rivera )
Home Mortgage Disclosure Act Aggregated Statistics For Year 2009(Based on 10 full and 4 partial tracts) A) FHA, FSA/RHS & VA B) Conventional C) Refinancings D) Home Improvement Loans E) Loans on Dwellings For 5+ Families F) Non-occupant Loans on G) Loans On Manufactured Number Average Value Number Average Value Number Average Value Number Average Value Number Average Value Number Average Value Number Average Value
LOANS ORIGINATED 272 $266,459 109 $216,331 533 $214,644 36 $142,589 2 $347,500 34 $184,428 2 $22,875 APPLICATIONS APPROVED, NOT ACCEPTED 32 $256,169 22 $334,080 84 $226,840 9 $65,629 0 $0 10 $186,305 1 $47,480 APPLICATIONS DENIED 53 $286,402 16 $204,461 325 $251,196 44 $106,148 0 $0 31 $190,114 3 $32,513 APPLICATIONS WITHDRAWN 51 $265,364 24 $196,035 159 $239,855 16 $142,294 1 $299,000 13 $194,188 1 $78,550 FILES CLOSED FOR INCOMPLETENESS 15 $278,062 6 $250,785 62 $263,315 1 $65,000 0 $0 3 $178,333 1 $56,110
Aggregated Statistics For Year 2008(Based on 10 full and 4 partial tracts) A) FHA, FSA/RHS & VA B) Conventional C) Refinancings D) Home Improvement Loans E) Loans on Dwellings For 5+ Families F) Non-occupant Loans on G) Loans On Manufactured Number Average Value Number Average Value Number Average Value Number Average Value Number Average Value Number Average Value Number Average Value
LOANS ORIGINATED 98 $311,986 196 $264,737 537 $252,054 85 $122,451 1 $2,283,000 48 $208,854 2 $31,735 APPLICATIONS APPROVED, NOT ACCEPTED 14 $327,144 45 $264,659 180 $274,564 20 $101,355 0 $0 7 $349,737 3 $114,307 APPLICATIONS DENIED 30 $329,556 76 $294,218 549 $303,573 82 $115,273 3 $376,333 36 $263,027 18 $41,968 APPLICATIONS WITHDRAWN 25 $311,539 47 $274,610 164 $275,552 22 $128,690 3 $2,846,000 13 $200,842 1 $68,190 FILES CLOSED FOR INCOMPLETENESS 8 $290,308 16 $295,596 61 $304,543 13 $164,341 0 $0 2 $119,500 0 $0
Aggregated Statistics For Year 2007(Based on 10 full and 4 partial tracts) A) FHA, FSA/RHS & VA B) Conventional C) Refinancings D) Home Improvement Loans E) Loans on Dwellings For 5+ Families F) Non-occupant Loans on G) Loans On Manufactured Number Average Value Number Average Value Number Average Value Number Average Value Number Average Value Number Average Value Number Average Value
LOANS ORIGINATED 2 $342,715 319 $298,087 1,321 $291,623 237 $195,247 4 $486,395 92 $277,690 9 $102,008 APPLICATIONS APPROVED, NOT ACCEPTED 0 $0 142 $296,231 354 $305,631 46 $173,817 0 $0 24 $273,202 9 $96,827 APPLICATIONS DENIED 1 $330,000 239 $330,620 1,084 $321,859 235 $162,571 0 $0 66 $294,033 19 $64,266 APPLICATIONS WITHDRAWN 0 $0 89 $290,546 464 $318,350 61 $222,332 2 $592,500 25 $293,690 0 $0 FILES CLOSED FOR INCOMPLETENESS 0 $0 37 $310,713 151 $333,791 12 $268,322 1 $840,000 6 $287,765 0 $0
Aggregated Statistics For Year 2006(Based on 10 full and 4 partial tracts) A) FHA, FSA/RHS & VA B) Conventional C) Refinancings D) Home Improvement Loans E) Loans on Dwellings For 5+ Families F) Non-occupant Loans on G) Loans On Manufactured Number Average Value Number Average Value Number Average Value Number Average Value Number Average Value Number Average Value Number Average Value
LOANS ORIGINATED 0 $0 825 $266,734 1,937 $285,354 360 $179,906 8 $4,165,985 172 $250,737 7 $60,556 APPLICATIONS APPROVED, NOT ACCEPTED 0 $0 185 $256,234 419 $293,400 80 $189,697 0 $0 32 $256,698 11 $53,408 APPLICATIONS DENIED 0 $0 393 $273,778 998 $315,116 258 $187,372 0 $0 43 $299,277 16 $69,981 APPLICATIONS WITHDRAWN 2 $339,500 171 $277,079 637 $293,403 88 $190,490 0 $0 29 $238,392 0 $0 FILES CLOSED FOR INCOMPLETENESS 0 $0 48 $281,750 164 $312,180 18 $236,273 0 $0 6 $274,020 0 $0
Aggregated Statistics For Year 2005(Based on 10 full and 4 partial tracts) A) FHA, FSA/RHS & VA B) Conventional C) Refinancings D) Home Improvement Loans E) Loans on Dwellings For 5+ Families F) Non-occupant Loans on G) Loans On Manufactured Number Average Value Number Average Value Number Average Value Number Average Value Number Average Value Number Average Value Number Average Value
LOANS ORIGINATED 2 $309,515 991 $246,851 2,288 $252,224 324 $173,283 8 $4,040,619 175 $228,535 6 $135,937 APPLICATIONS APPROVED, NOT ACCEPTED 0 $0 233 $238,653 440 $235,792 58 $122,989 1 $300,170 26 $255,108 13 $75,556 APPLICATIONS DENIED 1 $233,000 344 $248,824 994 $268,458 188 $145,635 1 $4,163,000 68 $254,636 18 $104,133 APPLICATIONS WITHDRAWN 0 $0 259 $240,575 820 $257,713 106 $181,915 0 $0 43 $227,802 2 $215,080 FILES CLOSED FOR INCOMPLETENESS 0 $0 36 $269,834 234 $278,436 21 $186,184 1 $2,500,000 10 $302,700 0 $0
Aggregated Statistics For Year 2004(Based on 10 full and 4 partial tracts) A) FHA, FSA/RHS & VA B) Conventional C) Refinancings D) Home Improvement Loans E) Loans on Dwellings For 5+ Families F) Non-occupant Loans on G) Loans On Manufactured Number Average Value Number Average Value Number Average Value Number Average Value Number Average Value Number Average Value Number Average Value
LOANS ORIGINATED 18 $265,517 993 $197,540 2,434 $203,641 344 $141,852 9 $917,076 147 $179,433 6 $95,530 APPLICATIONS APPROVED, NOT ACCEPTED 0 $0 200 $215,692 522 $201,572 56 $129,856 0 $0 36 $211,789 3 $44,410 APPLICATIONS DENIED 1 $246,000 276 $201,428 1,062 $213,069 234 $134,568 1 $10,059,000 53 $193,918 11 $52,934 APPLICATIONS WITHDRAWN 3 $274,137 161 $204,289 902 $204,628 92 $130,469 0 $0 29 $181,286 0 $0 FILES CLOSED FOR INCOMPLETENESS 1 $264,000 39 $188,624 180 $199,161 21 $93,704 0 $0 10 $139,441 0 $0
Aggregated Statistics For Year 2003(Based on 10 full and 4 partial tracts) A) FHA, FSA/RHS & VA B) Conventional C) Refinancings D) Home Improvement Loans E) Loans on Dwellings For 5+ Families F) Non-occupant Loans on Number Average Value Number Average Value Number Average Value Number Average Value Number Average Value Number Average Value
LOANS ORIGINATED 87 $221,883 658 $169,019 3,467 $161,283 117 $65,916 8 $1,709,022 212 $150,973 APPLICATIONS APPROVED, NOT ACCEPTED 7 $210,859 131 $180,493 595 $167,068 31 $61,317 0 $0 51 $170,097 APPLICATIONS DENIED 19 $221,424 207 $160,968 1,177 $160,966 133 $36,920 0 $0 58 $166,292 APPLICATIONS WITHDRAWN 23 $191,464 101 $151,388 935 $170,856 49 $77,419 0 $0 27 $142,324 FILES CLOSED FOR INCOMPLETENESS 7 $184,296 35 $209,755 200 $164,891 9 $41,183 2 $5,692,500 7 $138,250
Aggregated Statistics For Year 2002(Based on 8 full and 4 partial tracts) A) FHA, FSA/RHS & VA B) Conventional C) Refinancings D) Home Improvement Loans E) Loans on Dwellings For 5+ Families F) Non-occupant Loans on Number Average Value Number Average Value Number Average Value Number Average Value Number Average Value Number Average Value
LOANS ORIGINATED 133 $190,379 494 $155,022 1,798 $145,228 85 $38,480 5 $2,599,180 83 $123,486 APPLICATIONS APPROVED, NOT ACCEPTED 20 $174,642 69 $166,946 306 $145,223 18 $34,866 1 $208,000 14 $140,006 APPLICATIONS DENIED 28 $192,275 119 $144,241 704 $143,580 89 $36,888 1 $712,140 28 $137,119 APPLICATIONS WITHDRAWN 22 $189,088 64 $150,281 650 $156,638 51 $42,950 1 $667,250 19 $136,397 FILES CLOSED FOR INCOMPLETENESS 3 $203,123 31 $162,702 196 $148,854 2 $12,050 0 $0 4 $150,790
Aggregated Statistics For Year 2001(Based on 8 full and 4 partial tracts) A) FHA, FSA/RHS & VA B) Conventional C) Refinancings D) Home Improvement Loans E) Loans on Dwellings For 5+ Families F) Non-occupant Loans on Number Average Value Number Average Value Number Average Value Number Average Value Number Average Value Number Average Value
LOANS ORIGINATED 199 $171,374 357 $123,185 1,264 $133,848 58 $35,334 6 $1,322,057 108 $132,862 APPLICATIONS APPROVED, NOT ACCEPTED 14 $176,456 64 $131,785 210 $132,451 12 $29,397 1 $1,200,000 11 $129,308 APPLICATIONS DENIED 30 $175,838 112 $115,018 757 $128,823 93 $22,671 0 $0 23 $107,091 APPLICATIONS WITHDRAWN 36 $158,126 61 $122,668 486 $143,950 48 $26,488 1 $1,600,000 20 $135,706 FILES CLOSED FOR INCOMPLETENESS 14 $160,676 17 $151,039 137 $138,577 4 $18,688 2 $2,810,000 8 $133,361
Aggregated Statistics For Year 2000(Based on 8 full and 4 partial tracts) A) FHA, FSA/RHS & VA B) Conventional C) Refinancings D) Home Improvement Loans E) Loans on Dwellings For 5+ Families F) Non-occupant Loans on Number Average Value Number Average Value Number Average Value Number Average Value Number Average Value Number Average Value
LOANS ORIGINATED 210 $155,676 242 $114,257 396 $156,426 72 $34,388 5 $983,800 34 $114,069 APPLICATIONS APPROVED, NOT ACCEPTED 19 $157,298 53 $107,867 93 $113,182 45 $23,575 0 $0 13 $93,861 APPLICATIONS DENIED 31 $146,567 89 $121,388 383 $101,724 96 $27,544 2 $132,125 16 $92,421 APPLICATIONS WITHDRAWN 48 $159,216 39 $101,770 186 $100,119 20 $21,666 1 $259,000 8 $147,964 FILES CLOSED FOR INCOMPLETENESS 10 $141,868 21 $145,924 101 $138,460 5 $25,676 0 $0 7 $117,573
Aggregated Statistics For Year 1999(Based on 8 full and 3 partial tracts) A) FHA, FSA/RHS & VA B) Conventional C) Refinancings D) Home Improvement Loans E) Loans on Dwellings For 5+ Families F) Non-occupant Loans on Number Average Value Number Average Value Number Average Value Number Average Value Number Average Value Number Average Value
LOANS ORIGINATED 338 $146,320 292 $151,529 703 $110,247 111 $17,033 5 $421,468 60 $97,750 APPLICATIONS APPROVED, NOT ACCEPTED 30 $142,211 51 $133,103 180 $115,354 45 $23,854 2 $139,995 9 $71,759 APPLICATIONS DENIED 56 $142,169 114 $116,849 494 $107,118 126 $21,319 4 $429,058 25 $90,853 APPLICATIONS WITHDRAWN 38 $147,707 62 $131,238 256 $109,931 14 $34,110 1 $153,000 10 $98,254 FILES CLOSED FOR INCOMPLETENESS 7 $169,621 19 $149,700 144 $123,477 7 $26,040 1 $1,500,000 6 $130,080
Detailed mortgage data for all 14 tracts in Pico Rivera, CA
Private Mortgage Insurance Companies Aggregated Statistics For Year 2009(Based on 9 full and 4 partial tracts) A) Conventional B) Refinancings Number Average Value Number Average Value
LOANS ORIGINATED 25 $252,037 3 $301,963 APPLICATIONS APPROVED, NOT ACCEPTED 7 $265,017 2 $441,000 APPLICATIONS DENIED 1 $209,760 3 $295,643 APPLICATIONS WITHDRAWN 4 $326,378 1 $224,000 FILES CLOSED FOR INCOMPLETENESS 3 $329,333 1 $390,000
Aggregated Statistics For Year 2008(Based on 10 full and 4 partial tracts) A) Conventional B) Refinancings C) Non-occupant Loans on Number Average Value Number Average Value Number Average Value
LOANS ORIGINATED 96 $323,426 25 $360,740 0 $0 APPLICATIONS APPROVED, NOT ACCEPTED 51 $351,120 41 $399,012 3 $349,300 APPLICATIONS DENIED 26 $326,683 12 $340,068 8 $328,512 APPLICATIONS WITHDRAWN 5 $317,402 4 $372,452 0 $0 FILES CLOSED FOR INCOMPLETENESS 4 $345,815 1 $459,700 0 $0
Aggregated Statistics For Year 2007(Based on 10 full and 4 partial tracts) A) Conventional B) Refinancings C) Non-occupant Loans on Number Average Value Number Average Value Number Average Value
LOANS ORIGINATED 39 $415,366 39 $432,180 0 $0 APPLICATIONS APPROVED, NOT ACCEPTED 9 $459,876 22 $431,480 1 $383,000 APPLICATIONS DENIED 3 $475,303 8 $453,375 2 $458,000 APPLICATIONS WITHDRAWN 2 $472,500 7 $469,506 0 $0 FILES CLOSED FOR INCOMPLETENESS 0 $0 0 $0 0 $0
Aggregated Statistics For Year 2006(Based on 9 full and 4 partial tracts) A) Conventional B) Refinancings C) Non-occupant Loans on Number Average Value Number Average Value Number Average Value
LOANS ORIGINATED 9 $419,030 21 $433,432 2 $426,065 APPLICATIONS APPROVED, NOT ACCEPTED 1 $473,900 12 $389,985 0 $0 APPLICATIONS DENIED 0 $0 1 $508,120 0 $0 APPLICATIONS WITHDRAWN 2 $441,065 6 $411,755 0 $0 FILES CLOSED FOR INCOMPLETENESS 0 $0 0 $0 0 $0
Aggregated Statistics For Year 2005(Based on 10 full and 4 partial tracts) A) Conventional B) Refinancings C) Non-occupant Loans on Number Average Value Number Average Value Number Average Value
LOANS ORIGINATED 21 $355,609 29 $361,565 2 $380,160 APPLICATIONS APPROVED, NOT ACCEPTED 5 $290,206 7 $267,177 1 $351,000 APPLICATIONS DENIED 0 $0 1 $435,900 0 $0 APPLICATIONS WITHDRAWN 1 $164,000 4 $384,195 1 $164,000 FILES CLOSED FOR INCOMPLETENESS 0 $0 0 $0 0 $0
Aggregated Statistics For Year 2004(Based on 10 full and 4 partial tracts) A) Conventional B) Refinancings C) Non-occupant Loans on Number Average Value Number Average Value Number Average Value
LOANS ORIGINATED 57 $286,217 38 $264,393 2 $256,505 APPLICATIONS APPROVED, NOT ACCEPTED 21 $262,651 22 $232,038 2 $234,000 APPLICATIONS DENIED 0 $0 0 $0 0 $0 APPLICATIONS WITHDRAWN 11 $284,894 3 $246,000 1 $171,000 FILES CLOSED FOR INCOMPLETENESS 1 $170,000 1 $254,690 0 $0
Aggregated Statistics For Year 2003(Based on 10 full and 4 partial tracts) A) Conventional B) Refinancings C) Non-occupant Loans on Number Average Value Number Average Value Number Average Value
LOANS ORIGINATED 150 $227,364 113 $207,316 4 $191,615 APPLICATIONS APPROVED, NOT ACCEPTED 33 $217,998 35 $191,603 0 $0 APPLICATIONS DENIED 3 $214,023 0 $0 0 $0 APPLICATIONS WITHDRAWN 1 $227,000 10 $195,381 1 $135,000 FILES CLOSED FOR INCOMPLETENESS 0 $0 0 $0 0 $0
Aggregated Statistics For Year 2002(Based on 8 full and 4 partial tracts) A) Conventional B) Refinancings C) Non-occupant Loans on Number Average Value Number Average Value Number Average Value
LOANS ORIGINATED 160 $197,160 108 $181,112 4 $169,672 APPLICATIONS APPROVED, NOT ACCEPTED 24 $188,584 56 $174,559 1 $169,000 APPLICATIONS DENIED 2 $182,500 2 $173,920 0 $0 APPLICATIONS WITHDRAWN 8 $168,488 7 $170,147 0 $0 FILES CLOSED FOR INCOMPLETENESS 1 $161,000 0 $0 0 $0
Aggregated Statistics For Year 2001(Based on 8 full and 4 partial tracts) A) Conventional B) Refinancings C) Non-occupant Loans on Number Average Value Number Average Value Number Average Value
LOANS ORIGINATED 124 $163,275 108 $166,390 4 $141,220 APPLICATIONS APPROVED, NOT ACCEPTED 27 $152,141 26 $176,907 3 $134,000 APPLICATIONS DENIED 7 $159,764 9 $159,031 1 $120,000 APPLICATIONS WITHDRAWN 6 $170,480 8 $177,182 0 $0 FILES CLOSED FOR INCOMPLETENESS 0 $0 1 $130,980 0 $0
Aggregated Statistics For Year 2000(Based on 8 full and 4 partial tracts) A) Conventional B) Refinancings C) Non-occupant Loans on Number Average Value Number Average Value Number Average Value
LOANS ORIGINATED 75 $162,918 57 $153,889 3 $127,047 APPLICATIONS APPROVED, NOT ACCEPTED 18 $160,421 21 $144,047 0 $0 APPLICATIONS DENIED 7 $149,050 2 $163,255 0 $0 APPLICATIONS WITHDRAWN 2 $149,770 1 $134,000 0 $0 FILES CLOSED FOR INCOMPLETENESS 0 $0 0 $0 0 $0
Aggregated Statistics For Year 1999(Based on 8 full and 3 partial tracts) A) Conventional B) Refinancings C) Non-occupant Loans on Number Average Value Number Average Value Number Average Value
LOANS ORIGINATED 133 $175,482 123 $143,208 1 $78,000 APPLICATIONS APPROVED, NOT ACCEPTED 17 $176,822 47 $145,211 2 $132,500 APPLICATIONS DENIED 8 $201,359 6 $144,772 0 $0 APPLICATIONS WITHDRAWN 4 $138,150 4 $124,282 0 $0 FILES CLOSED FOR INCOMPLETENESS 1 $229,200 5 $141,766 0 $0
Fire-safe hotels and motels in Pico Rivera, California:
Americas Best Value Inn, 7222 Rosemead Blvd, Pico Rivera, California 90660 Phone: (562) 949-6648, Fax: (562) 942-7807
Econo Lodge, 8477 Telegraph Rd, Pico Rivera, California 90660 Phone: (562) 869-9588
Howard Johnson Inn & Suites, 9515 W Whittier, Pico Rivera, California 90660 Phone: (562) 699-2600, Fax: (562) 699-9193
All 3 fire-safe hotels and motels in Pico Rivera, California
Most common first names in Pico Rivera, CA among deceased individuals Name Count Lived (average)
Maria 252 78.0 years Mary 238 78.1 years John 192 73.0 years Robert 159 71.5 years Jose 152 73.6 years William 147 73.3 years Frank 121 72.2 years Manuel 113 74.6 years George 104 72.4 years James 103 72.5 years
Most common last names in Pico Rivera, CA among deceased individuals Last name Count Lived (average)
Garcia 183 73.1 years Martinez 162 72.7 years Rodriguez 123 74.3 years Hernandez 113 71.8 years Lopez 111 71.0 years Gonzales 102 72.8 years Gonzalez 75 73.6 years Perez 74 74.7 years Ramirez 73 75.2 years Sanchez 66 70.9 years
Pico Rivera compared to California state average:
Unemployed percentage below state average. Black race population percentage significantly below state average. Hispanic race population percentage above state average. Length of stay since moving in significantly above state average. House age above state average. Percentage of population with a bachelor's degree or higher below state average. Pico Rivera on our top lists :
#3 on the list of "Top 101 cities with largest percentage of males in occupations: transportation occupations (population 50,000+)"
#8 on the list of "Top 101 cities with the smallest house values disparities (population 50,000+)"
#12 on the list of "Top 101 cities with largest percentage of females in industries: wholesale trade (population 50,000+)"
#15 on the list of "Top 100 low-educated but high-earning cities (pop. 50,000+)"
#18 on the list of "Top 101 cities with largest percentage of males in industries: wholesale trade (population 50,000+)"
#18 on the list of "Top 100 least racially diverse cities (pop. 50,000+)"
#27 on the list of "Top 101 cities with the least people having Master's or Doctorate degrees (population 50,000+)"
#28 on the list of "Top 101 cities with largest percentage of males in industries: transportation and warehousing (population 50,000+)"
#28 on the list of "Top 100 least-educated cities (pop. 50,000+)"
#31 on the list of "Top 101 cities with the most cars per house, population 50,000+"
#32 on the list of "Top 101 cities where residents moved in more then 10 years ago (10,000+ households)"
#34 on the list of "Top 101 cities with the highest ratio of murders to rapes between 2002 and 2012 (population 50,000+)"
#34 on the list of "Top 101 cities with the lowest percentage of English-only speaking households, population 50,000+"
#50 on the list of "Top 101 cities with largest percentage of females in occupations: material moving occupations (population 50,000+)"
#55 on the list of "Top 101 cities with the least people having professional degrees (population 50,000+)"
#59 on the list of "Top 101 cities with fewest building permits per 10,000 residents (population 50,000+)"
#60 on the list of "Top 101 cities with the lowest percentage of workers working at home, population 50,000+"
#75 on the list of "Top 101 cities with largest percentage of females in occupations: production occupations (population 50,000+)"
#76 on the list of "Top 101 cities with largest percentage of males in occupations: material moving occupations (population 50,000+)"
#78 on the list of "Top 101 cities with largest percentage of females in industries: manufacturing (population 50,000+)"
#1 on the list of "Top 101 counties with the most Evangelical Protestant congregations"
#1 on the list of "Top 101 counties with the most Mainline Protestant congregations"
#1 on the list of "Top 101 counties with the most Orthodox adherents"
#1 on the list of "Top 101 counties with the highest ground withdrawal of fresh water for public supply (pop. 50,000+)"
#1 on the list of "Top 101 counties with the most Catholic adherents (pop. 50,000+)"
Top Patent Applicants
Prashant Bhadri (17)
Lee Wa Wong (9)
Brian Halliwell (6)
Nicholas Flores (3)
Randy William Petak (3)
Henry F. Salazar (3)
Prashant R. Bhadri (2)
Hamlet Joe Avetisian, Sr. (2)
Frank Noriega (2)
Phillip Velasquez (2)
Total of 69 patent applications in 2008-2024.
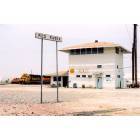
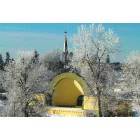
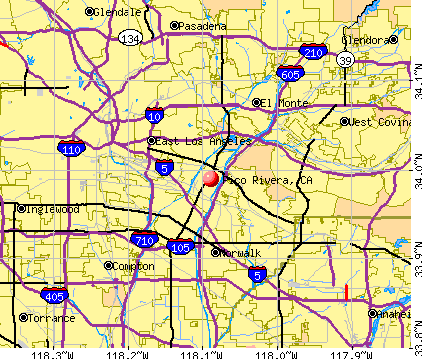


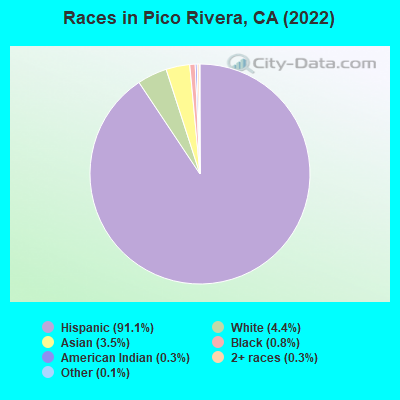

 Recent articles from our blog. Our writers, many of them Ph.D. graduates or candidates, create easy-to-read articles on a wide variety of topics.

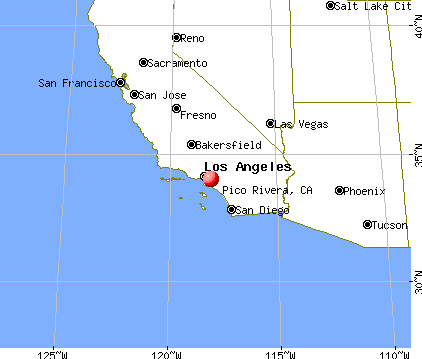
 , pop. 320,008).
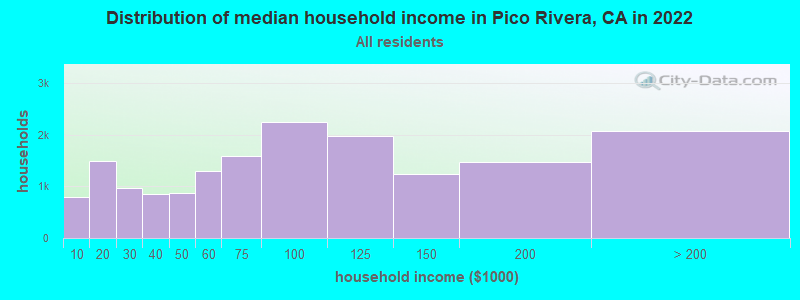
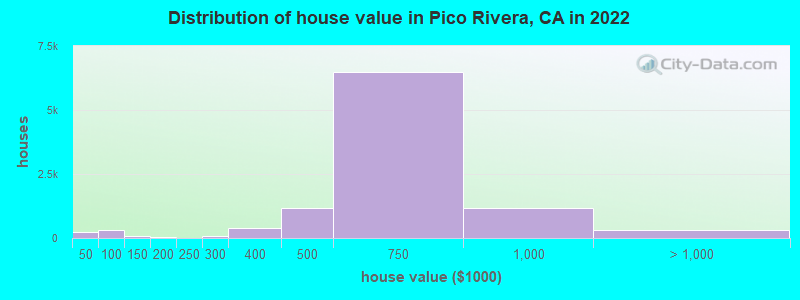
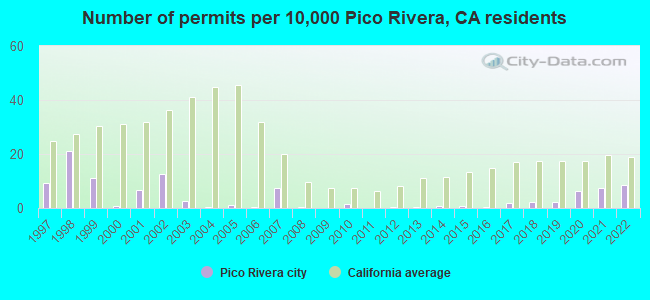
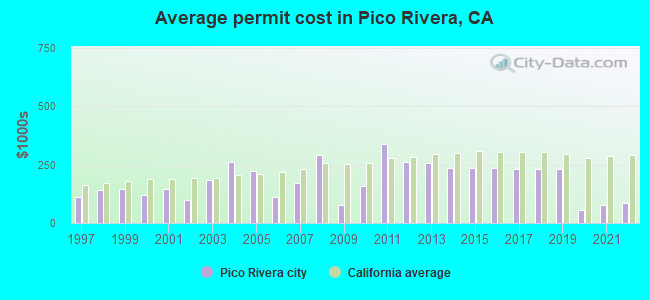
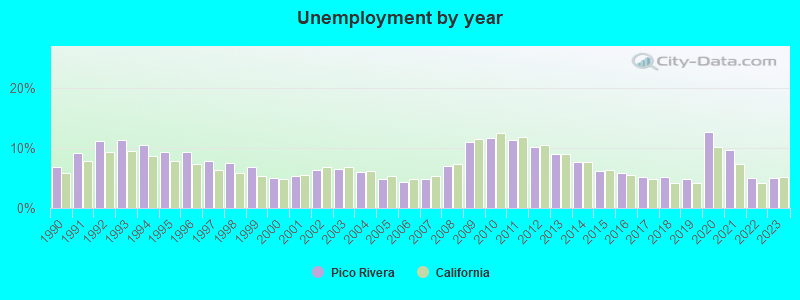
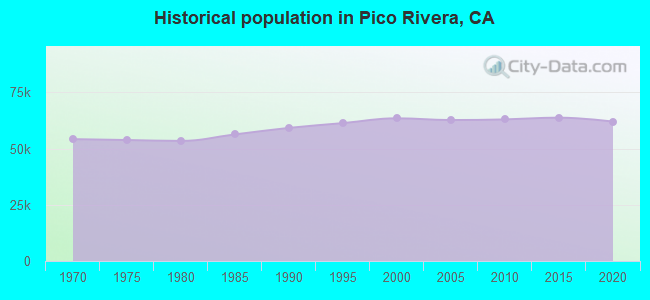
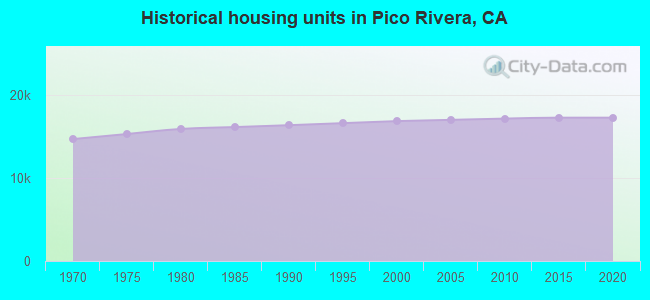
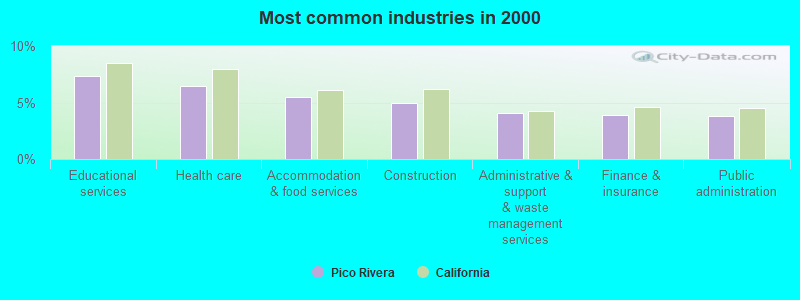
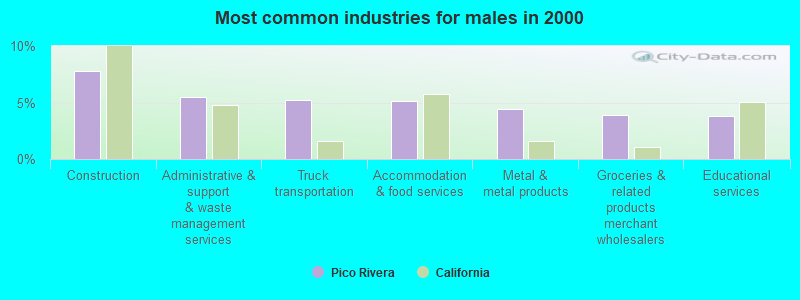
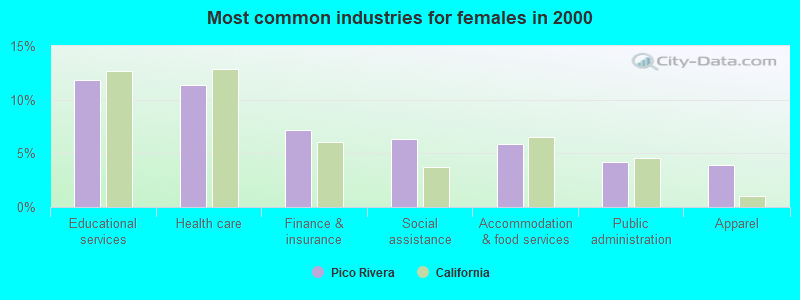
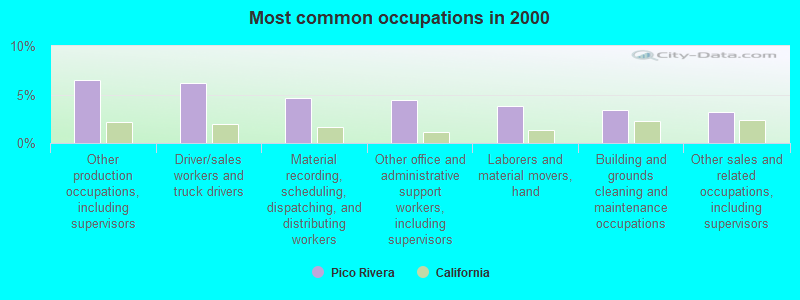
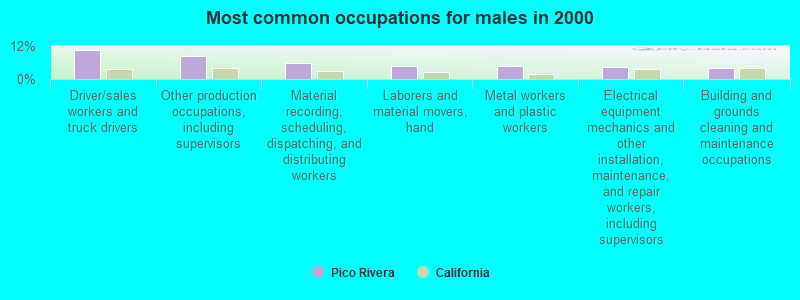
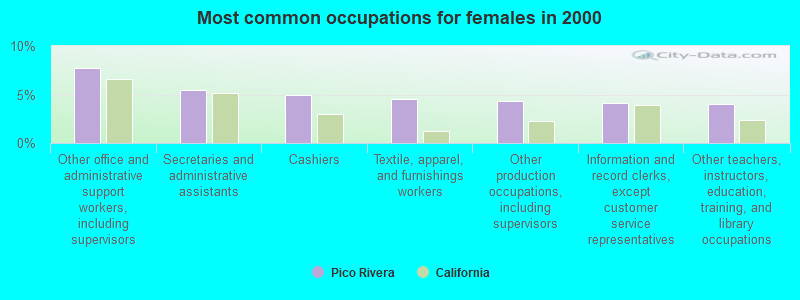
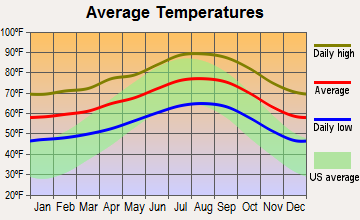
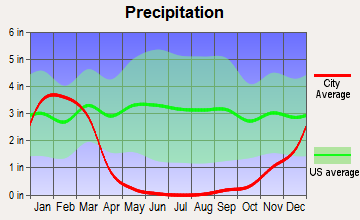
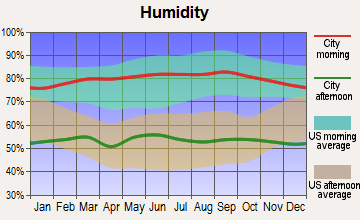
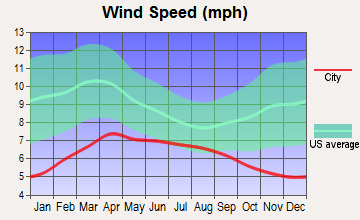
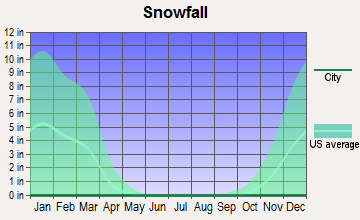
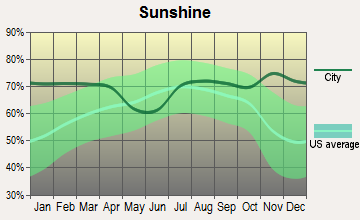
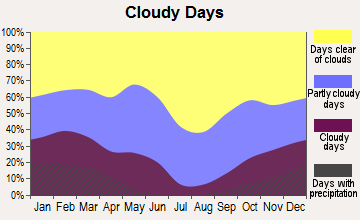


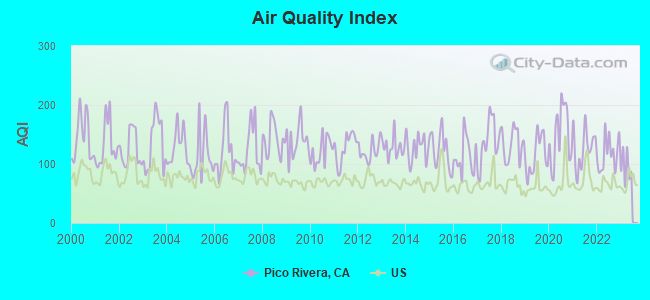
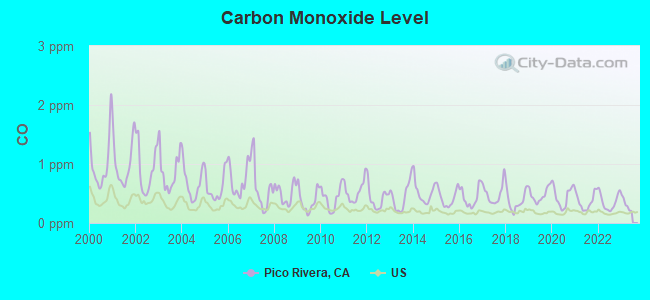
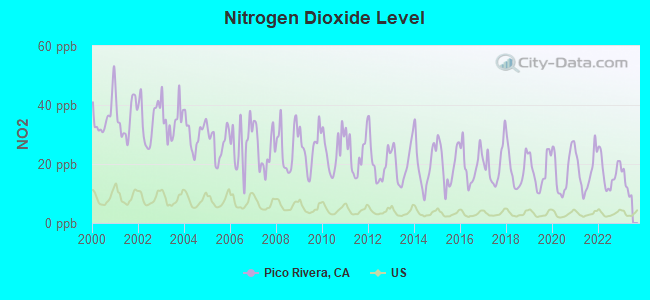
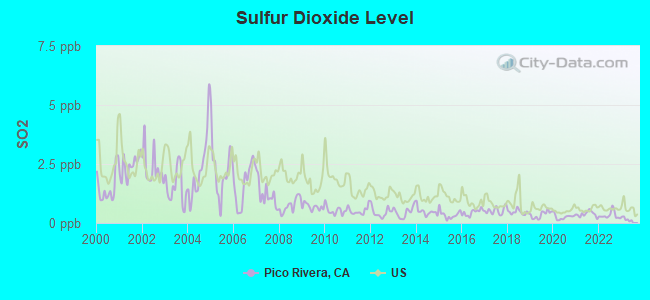
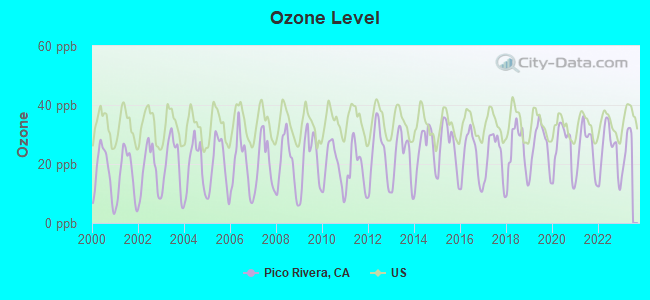
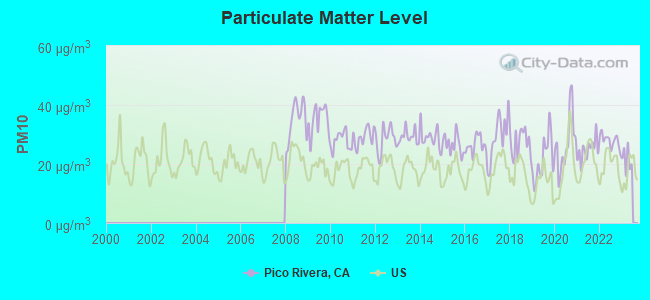
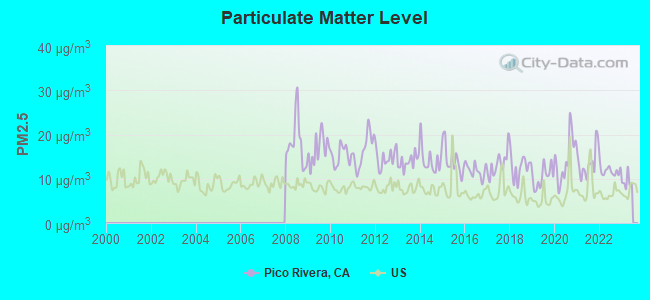
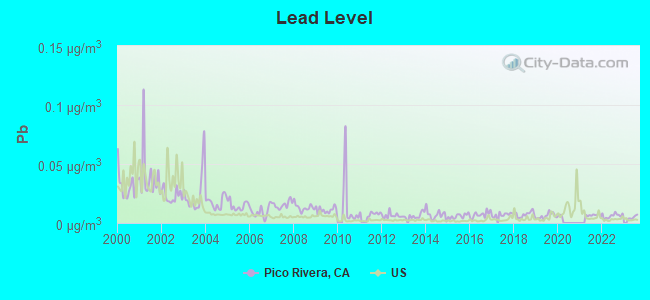
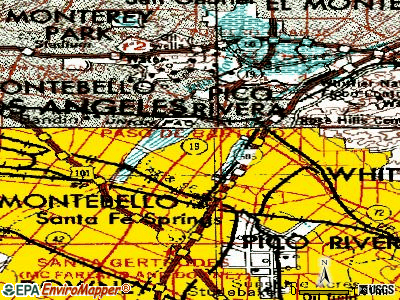
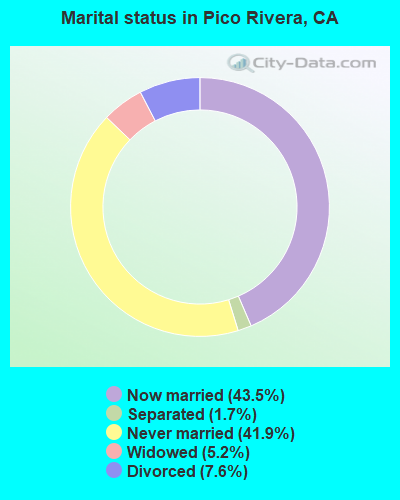
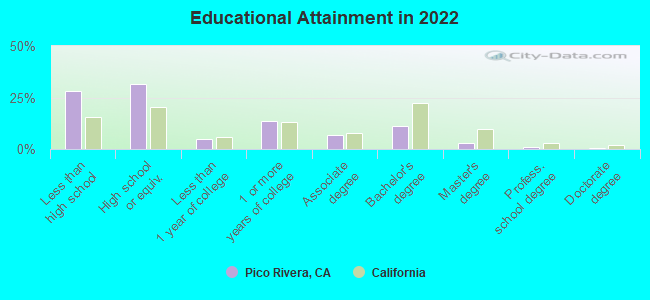
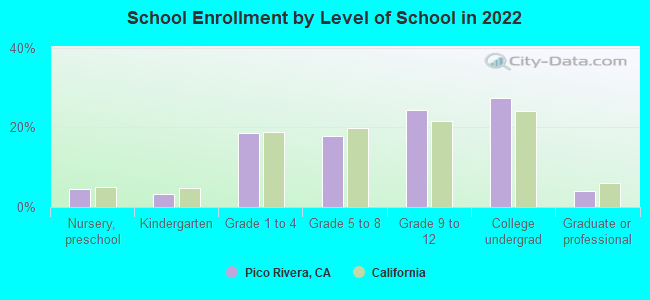
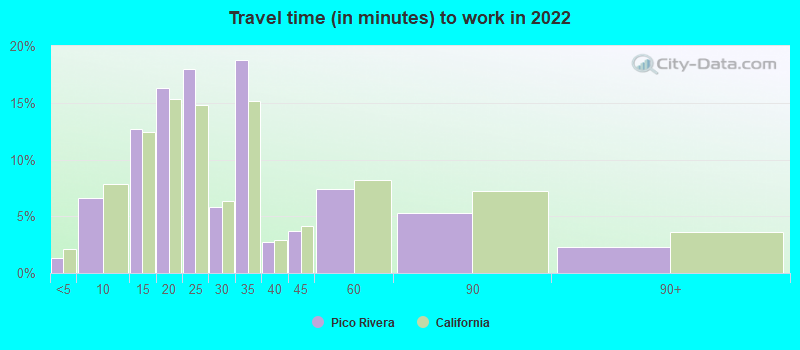
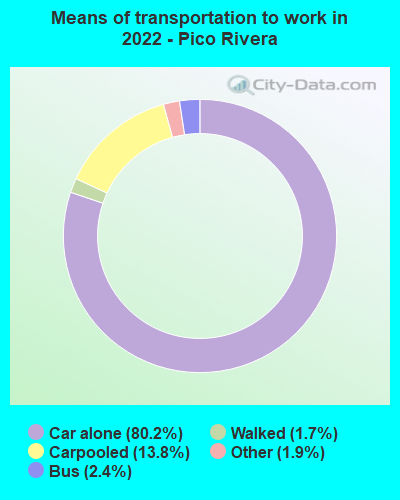


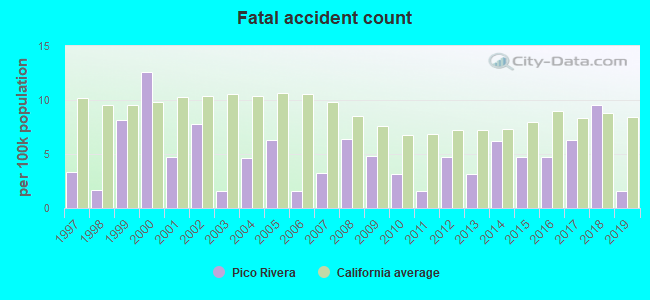
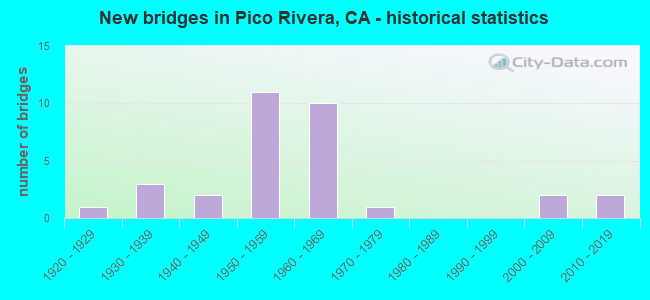
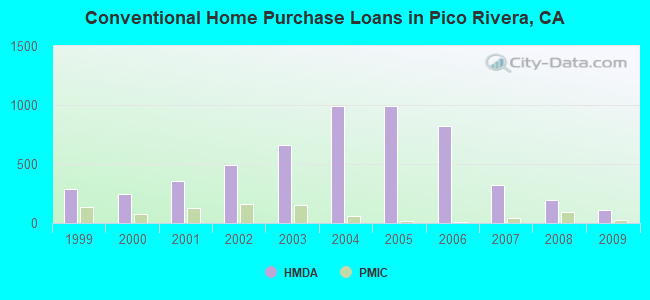
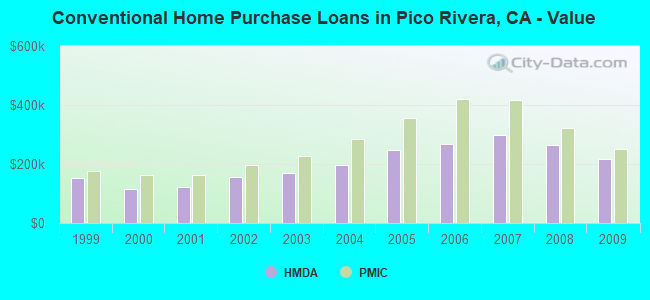
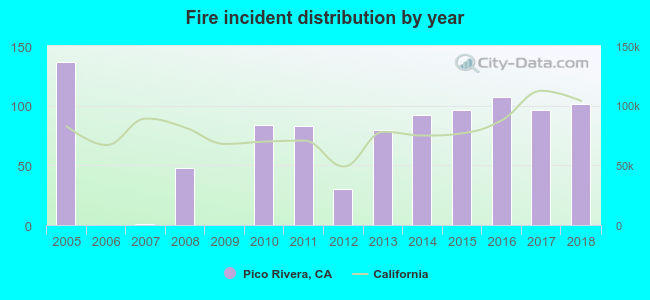 According to the data from the years 2005 - 2018 the average number of fire incidents per year is 68. The highest number of reported fire incidents - 137 took place in 2005, and the least - 0 in 2006. The data has a decreasing trend.
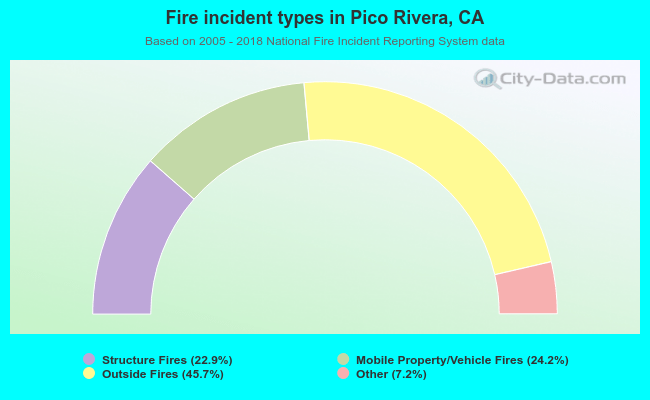 When looking into fire subcategories, the most reports belonged to: Outside Fires (45.7%), and Mobile Property/Vehicle Fires (24.2%).