Estimated zip code population in 2022: 31,453
Zip code population in 2010: 32,396
Zip code population in 2000: 32,143
Houses and condos: 9,014
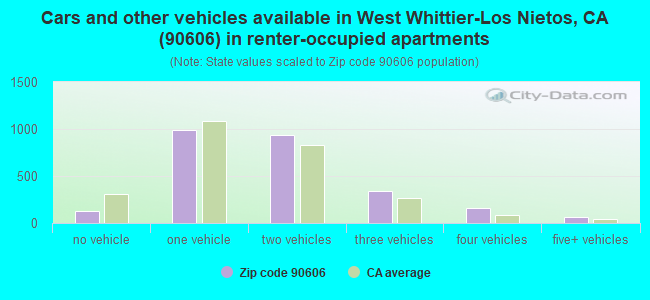
Renter-occupied apartments: 2,622
% of renters here:
30%State:
44%
March 2022 cost of living index in zip code 90606: 132.6
(high, U.S. average is 100)
Land area: 3.8
sq. mi.
Water area: 0.1
sq. mi.
Population density: 8,314 people per square mile (high).
OSM Map
General Map
Google Map
MSN Map
OSM Map
General Map
Google Map
MSN Map
OSM Map
General Map
Google Map
MSN Map
OSM Map
General Map
Google Map
MSN Map
Please wait while loading the map...
Real estate property taxes paid for housing units in 2022:
This zip code:
0.6% ($3,717)California:
0.7% ($4,831)
Median real estate property taxes paid for housing units with mortgages in 2022: $4,207 (0.6%)
Median real estate property taxes paid for housing units with no mortgage in 2022: $2,398 (0.4%)
Profiles of local businesses
Business Search - 14 Million verified businesses
Males: 15,518 Females: 15,934
For population 25 years and over in 90606:
High school or higher: 75.2%Bachelor's degree or higher: 17.4%Graduate or professional degree: 4.6%Unemployed: 3.5%Mean travel time to work (commute): 30.1 minutes
For population 15 years and over in 90606:
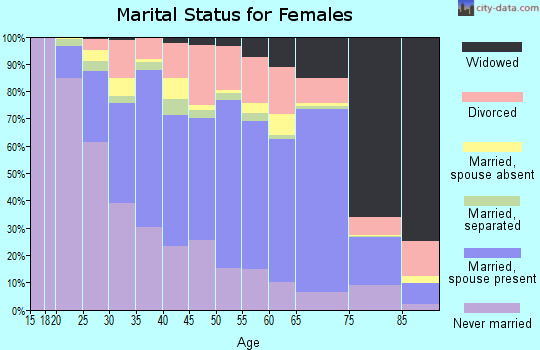
Never married: 39.7%Now married: 45.3%Separated: 2.1%Widowed: 5.5%Divorced: 7.4%
Zip code 90606 compared to state average:
Black race population percentage significantly below state average. Hispanic race population percentage above state average. Length of stay since moving in significantly above state average. House age above state average. Percentage of population with a bachelor's degree or higher below state average. 27,068 86.1% Hispanic or Latino 2,721 8.7% White 1,043 3.3% Asian 286 0.9% Black 180 0.6% Two or more races 73 0.2% American Indian 71 0.2% Some other race 8 0.03% Native Hawaiian and Other
Data:
Median household income ($)
Median household income (% change since 2000)
Household income diversity
Ratio of average income to average house value (%)
Ratio of average income to average rent
Median household income ($) - White
Median household income ($) - Black or African American
Median household income ($) - Asian
Median household income ($) - Hispanic or Latino
Median household income ($) - American Indian and Alaska Native
Median household income ($) - Multirace
Median household income ($) - Other Race
Median household income for houses/condos with a mortgage ($)
Median household income for apartments without a mortgage ($)
Races - White alone (%)
Races - White alone (% change since 2000)
Races - Black alone (%)
Races - Black alone (% change since 2000)
Races - American Indian alone (%)
Races - American Indian alone (% change since 2000)
Races - Asian alone (%)
Races - Asian alone (% change since 2000)
Races - Hispanic (%)
Races - Hispanic (% change since 2000)
Races - Native Hawaiian and Other Pacific Islander alone (%)
Races - Native Hawaiian and Other Pacific Islander alone (% change since 2000)
Races - Two or more races (%)
Races - Two or more races (% change since 2000)
Races - Other race alone (%)
Races - Other race alone (% change since 2000)
Racial diversity
Unemployment (%)
Unemployment (% change since 2000)
Unemployment (%) - White
Unemployment (%) - Black or African American
Unemployment (%) - Asian
Unemployment (%) - Hispanic or Latino
Unemployment (%) - American Indian and Alaska Native
Unemployment (%) - Multirace
Unemployment (%) - Other Race
Population density (people per square mile)
Population - Males (%)
Population - Females (%)
Population - Males (%) - White
Population - Males (%) - Black or African American
Population - Males (%) - Asian
Population - Males (%) - Hispanic or Latino
Population - Males (%) - American Indian and Alaska Native
Population - Males (%) - Multirace
Population - Males (%) - Other Race
Population - Females (%) - White
Population - Females (%) - Black or African American
Population - Females (%) - Asian
Population - Females (%) - Hispanic or Latino
Population - Females (%) - American Indian and Alaska Native
Population - Females (%) - Multirace
Population - Females (%) - Other Race
Coronavirus confirmed cases (Apr 27, 2024)
Deaths caused by coronavirus (Apr 27, 2024)
Coronavirus confirmed cases (per 100k population) (Apr 27, 2024)
Deaths caused by coronavirus (per 100k population) (Apr 27, 2024)
Daily increase in number of cases (Apr 27, 2024)
Weekly increase in number of cases (Apr 27, 2024)
Cases doubled (in days) (Apr 27, 2024)
Hospitalized patients (Apr 18, 2022)
Negative test results (Apr 18, 2022)
Total test results (Apr 18, 2022)
COVID Vaccine doses distributed (per 100k population) (Sep 19, 2023)
COVID Vaccine doses administered (per 100k population) (Sep 19, 2023)
COVID Vaccine doses distributed (Sep 19, 2023)
COVID Vaccine doses administered (Sep 19, 2023)
Likely homosexual households (%)
Likely homosexual households (% change since 2000)
Likely homosexual households - Lesbian couples (%)
Likely homosexual households - Lesbian couples (% change since 2000)
Likely homosexual households - Gay men (%)
Likely homosexual households - Gay men (% change since 2000)
Cost of living index
Median gross rent ($)
Median contract rent ($)
Median monthly housing costs ($)
Median house or condo value ($)
Median house or condo value ($ change since 2000)
Mean house or condo value by units in structure - 1, detached ($)
Mean house or condo value by units in structure - 1, attached ($)
Mean house or condo value by units in structure - 2 ($)
Mean house or condo value by units in structure by units in structure - 3 or 4 ($)
Mean house or condo value by units in structure - 5 or more ($)
Mean house or condo value by units in structure - Boat, RV, van, etc. ($)
Mean house or condo value by units in structure - Mobile home ($)
Median house or condo value ($) - White
Median house or condo value ($) - Black or African American
Median house or condo value ($) - Asian
Median house or condo value ($) - Hispanic or Latino
Median house or condo value ($) - American Indian and Alaska Native
Median house or condo value ($) - Multirace
Median house or condo value ($) - Other Race
Median resident age
Resident age diversity
Median resident age - Males
Median resident age - Females
Median resident age - White
Median resident age - Black or African American
Median resident age - Asian
Median resident age - Hispanic or Latino
Median resident age - American Indian and Alaska Native
Median resident age - Multirace
Median resident age - Other Race
Median resident age - Males - White
Median resident age - Males - Black or African American
Median resident age - Males - Asian
Median resident age - Males - Hispanic or Latino
Median resident age - Males - American Indian and Alaska Native
Median resident age - Males - Multirace
Median resident age - Males - Other Race
Median resident age - Females - White
Median resident age - Females - Black or African American
Median resident age - Females - Asian
Median resident age - Females - Hispanic or Latino
Median resident age - Females - American Indian and Alaska Native
Median resident age - Females - Multirace
Median resident age - Females - Other Race
Commute - mean travel time to work (minutes)
Travel time to work - Less than 5 minutes (%)
Travel time to work - Less than 5 minutes (% change since 2000)
Travel time to work - 5 to 9 minutes (%)
Travel time to work - 5 to 9 minutes (% change since 2000)
Travel time to work - 10 to 19 minutes (%)
Travel time to work - 10 to 19 minutes (% change since 2000)
Travel time to work - 20 to 29 minutes (%)
Travel time to work - 20 to 29 minutes (% change since 2000)
Travel time to work - 30 to 39 minutes (%)
Travel time to work - 30 to 39 minutes (% change since 2000)
Travel time to work - 40 to 59 minutes (%)
Travel time to work - 40 to 59 minutes (% change since 2000)
Travel time to work - 60 to 89 minutes (%)
Travel time to work - 60 to 89 minutes (% change since 2000)
Travel time to work - 90 or more minutes (%)
Travel time to work - 90 or more minutes (% change since 2000)
Marital status - Never married (%)
Marital status - Now married (%)
Marital status - Separated (%)
Marital status - Widowed (%)
Marital status - Divorced (%)
Median family income ($)
Median family income (% change since 2000)
Median non-family income ($)
Median non-family income (% change since 2000)
Median per capita income ($)
Median per capita income (% change since 2000)
Median family income ($) - White
Median family income ($) - Black or African American
Median family income ($) - Asian
Median family income ($) - Hispanic or Latino
Median family income ($) - American Indian and Alaska Native
Median family income ($) - Multirace
Median family income ($) - Other Race
Median year house/condo built
Median year apartment built
Year house built - Built 2005 or later (%)
Year house built - Built 2000 to 2004 (%)
Year house built - Built 1990 to 1999 (%)
Year house built - Built 1980 to 1989 (%)
Year house built - Built 1970 to 1979 (%)
Year house built - Built 1960 to 1969 (%)
Year house built - Built 1950 to 1959 (%)
Year house built - Built 1940 to 1949 (%)
Year house built - Built 1939 or earlier (%)
Average household size
Household density (households per square mile)
Average household size - White
Average household size - Black or African American
Average household size - Asian
Average household size - Hispanic or Latino
Average household size - American Indian and Alaska Native
Average household size - Multirace
Average household size - Other Race
Occupied housing units (%)
Vacant housing units (%)
Owner occupied housing units (%)
Renter occupied housing units (%)
Vacancy status - For rent (%)
Vacancy status - For sale only (%)
Vacancy status - Rented or sold, not occupied (%)
Vacancy status - For seasonal, recreational, or occasional use (%)
Vacancy status - For migrant workers (%)
Vacancy status - Other vacant (%)
Residents with income below the poverty level (%)
Residents with income below 50% of the poverty level (%)
Children below poverty level (%)
Poor families by family type - Married-couple family (%)
Poor families by family type - Male, no wife present (%)
Poor families by family type - Female, no husband present (%)
Poverty status for native-born residents (%)
Poverty status for foreign-born residents (%)
Poverty among high school graduates not in families (%)
Poverty among people who did not graduate high school not in families (%)
Residents with income below the poverty level (%) - White
Residents with income below the poverty level (%) - Black or African American
Residents with income below the poverty level (%) - Asian
Residents with income below the poverty level (%) - Hispanic or Latino
Residents with income below the poverty level (%) - American Indian and Alaska Native
Residents with income below the poverty level (%) - Multirace
Residents with income below the poverty level (%) - Other Race
Air pollution - Air Quality Index (AQI)
Air pollution - CO
Air pollution - NO2
Air pollution - SO2
Air pollution - Ozone
Air pollution - PM10
Air pollution - PM25
Air pollution - Pb
Crime - Murders per 100,000 population
Crime - Rapes per 100,000 population
Crime - Robberies per 100,000 population
Crime - Assaults per 100,000 population
Crime - Burglaries per 100,000 population
Crime - Thefts per 100,000 population
Crime - Auto thefts per 100,000 population
Crime - Arson per 100,000 population
Crime - City-data.com crime index
Crime - Violent crime index
Crime - Property crime index
Crime - Murders per 100,000 population (5 year average)
Crime - Rapes per 100,000 population (5 year average)
Crime - Robberies per 100,000 population (5 year average)
Crime - Assaults per 100,000 population (5 year average)
Crime - Burglaries per 100,000 population (5 year average)
Crime - Thefts per 100,000 population (5 year average)
Crime - Auto thefts per 100,000 population (5 year average)
Crime - Arson per 100,000 population (5 year average)
Crime - City-data.com crime index (5 year average)
Crime - Violent crime index (5 year average)
Crime - Property crime index (5 year average)
1996 Presidential Elections Results (%) - Democratic Party (Clinton)
1996 Presidential Elections Results (%) - Republican Party (Dole)
1996 Presidential Elections Results (%) - Other
2000 Presidential Elections Results (%) - Democratic Party (Gore)
2000 Presidential Elections Results (%) - Republican Party (Bush)
2000 Presidential Elections Results (%) - Other
2004 Presidential Elections Results (%) - Democratic Party (Kerry)
2004 Presidential Elections Results (%) - Republican Party (Bush)
2004 Presidential Elections Results (%) - Other
2008 Presidential Elections Results (%) - Democratic Party (Obama)
2008 Presidential Elections Results (%) - Republican Party (McCain)
2008 Presidential Elections Results (%) - Other
2012 Presidential Elections Results (%) - Democratic Party (Obama)
2012 Presidential Elections Results (%) - Republican Party (Romney)
2012 Presidential Elections Results (%) - Other
2016 Presidential Elections Results (%) - Democratic Party (Clinton)
2016 Presidential Elections Results (%) - Republican Party (Trump)
2016 Presidential Elections Results (%) - Other
2020 Presidential Elections Results (%) - Democratic Party (Biden)
2020 Presidential Elections Results (%) - Republican Party (Trump)
2020 Presidential Elections Results (%) - Other
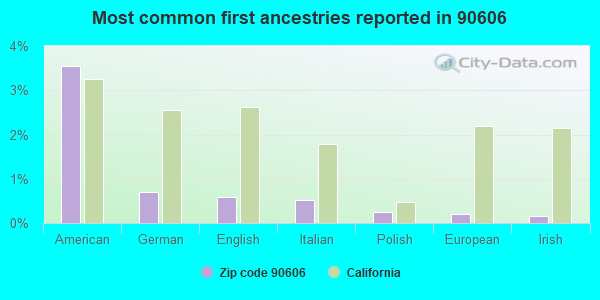
Ancestries Reported - Arab (%)
Ancestries Reported - Czech (%)
Ancestries Reported - Danish (%)
Ancestries Reported - Dutch (%)
Ancestries Reported - English (%)
Ancestries Reported - French (%)
Ancestries Reported - French Canadian (%)
Ancestries Reported - German (%)
Ancestries Reported - Greek (%)
Ancestries Reported - Hungarian (%)
Ancestries Reported - Irish (%)
Ancestries Reported - Italian (%)
Ancestries Reported - Lithuanian (%)
Ancestries Reported - Norwegian (%)
Ancestries Reported - Polish (%)
Ancestries Reported - Portuguese (%)
Ancestries Reported - Russian (%)
Ancestries Reported - Scotch-Irish (%)
Ancestries Reported - Scottish (%)
Ancestries Reported - Slovak (%)
Ancestries Reported - Subsaharan African (%)
Ancestries Reported - Swedish (%)
Ancestries Reported - Swiss (%)
Ancestries Reported - Ukrainian (%)
Ancestries Reported - United States (%)
Ancestries Reported - Welsh (%)
Ancestries Reported - West Indian (%)
Ancestries Reported - Other (%)
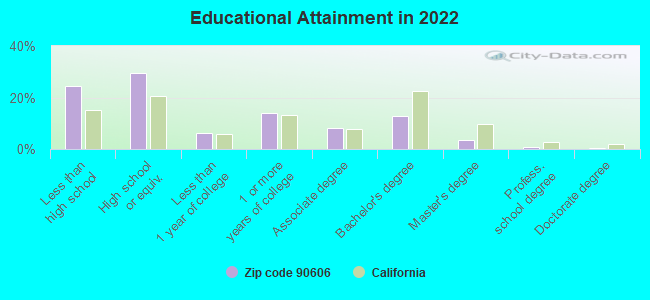
Educational Attainment - No schooling completed (%)
Educational Attainment - Less than high school (%)
Educational Attainment - High school or equivalent (%)
Educational Attainment - Less than 1 year of college (%)
Educational Attainment - 1 or more years of college (%)
Educational Attainment - Associate degree (%)
Educational Attainment - Bachelor's degree (%)
Educational Attainment - Master's degree (%)
Educational Attainment - Professional school degree (%)
Educational Attainment - Doctorate degree (%)
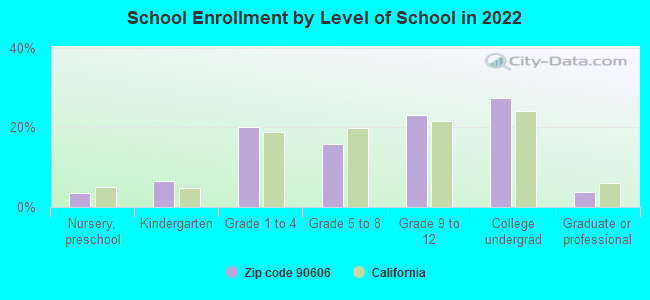
School Enrollment - Nursery, preschool (%)
School Enrollment - Kindergarten (%)
School Enrollment - Grade 1 to 4 (%)
School Enrollment - Grade 5 to 8 (%)
School Enrollment - Grade 9 to 12 (%)
School Enrollment - College undergrad (%)
School Enrollment - Graduate or professional (%)
School Enrollment - Not enrolled in school (%)
School enrollment - Public schools (%)
School enrollment - Private schools (%)
School enrollment - Not enrolled (%)
Median number of rooms in houses and condos
Median number of rooms in apartments
Housing units lacking complete plumbing facilities (%)
Housing units lacking complete kitchen facilities (%)
Density of houses
Urban houses (%)
Rural houses (%)
Households with people 60 years and over (%)
Households with people 65 years and over (%)
Households with people 75 years and over (%)
Households with one or more nonrelatives (%)
Households with no nonrelatives (%)
Population in households (%)
Family households (%)
Nonfamily households (%)
Population in families (%)
Family households with own children (%)
Median number of bedrooms in owner occupied houses
Mean number of bedrooms in owner occupied houses
Median number of bedrooms in renter occupied houses
Mean number of bedrooms in renter occupied houses
Median number of vehichles in owner occupied houses
Mean number of vehichles in owner occupied houses
Median number of vehichles in renter occupied houses
Mean number of vehichles in renter occupied houses
Mortgage status - with mortgage (%)
Mortgage status - with second mortgage (%)
Mortgage status - with home equity loan (%)
Mortgage status - with both second mortgage and home equity loan (%)
Mortgage status - without a mortgage (%)
Average family size
Average family size - White
Average family size - Black or African American
Average family size - Asian
Average family size - Hispanic or Latino
Average family size - American Indian and Alaska Native
Average family size - Multirace
Average family size - Other Race
Geographical mobility - Same house 1 year ago (%)
Geographical mobility - Moved within same county (%)
Geographical mobility - Moved from different county within same state (%)
Geographical mobility - Moved from different state (%)
Geographical mobility - Moved from abroad (%)
Place of birth - Born in state of residence (%)
Place of birth - Born in other state (%)
Place of birth - Native, outside of US (%)
Place of birth - Foreign born (%)
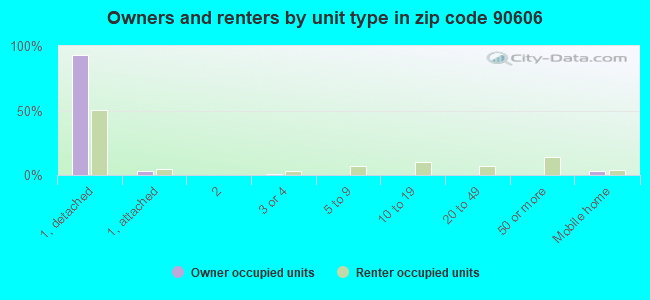
Housing units in structures - 1, detached (%)
Housing units in structures - 1, attached (%)
Housing units in structures - 2 (%)
Housing units in structures - 3 or 4 (%)
Housing units in structures - 5 to 9 (%)
Housing units in structures - 10 to 19 (%)
Housing units in structures - 20 to 49 (%)
Housing units in structures - 50 or more (%)
Housing units in structures - Mobile home (%)
Housing units in structures - Boat, RV, van, etc. (%)
House/condo owner moved in on average (years ago)
Renter moved in on average (years ago)
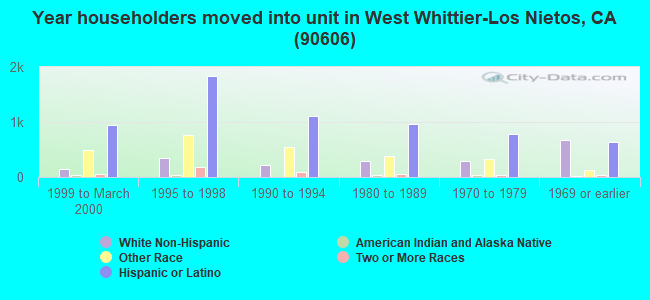
Year householder moved into unit - Moved in 1999 to March 2000 (%)
Year householder moved into unit - Moved in 1995 to 1998 (%)
Year householder moved into unit - Moved in 1990 to 1994 (%)
Year householder moved into unit - Moved in 1980 to 1989 (%)
Year householder moved into unit - Moved in 1970 to 1979 (%)
Year householder moved into unit - Moved in 1969 or earlier (%)
Means of transportation to work - Drove car alone (%)
Means of transportation to work - Carpooled (%)
Means of transportation to work - Public transportation (%)
Means of transportation to work - Bus or trolley bus (%)
Means of transportation to work - Streetcar or trolley car (%)
Means of transportation to work - Subway or elevated (%)
Means of transportation to work - Railroad (%)
Means of transportation to work - Ferryboat (%)
Means of transportation to work - Taxicab (%)
Means of transportation to work - Motorcycle (%)
Means of transportation to work - Bicycle (%)
Means of transportation to work - Walked (%)
Means of transportation to work - Other means (%)
Working at home (%)
Industry diversity
Most Common Industries - Agriculture, forestry, fishing and hunting, and mining (%)
Most Common Industries - Agriculture, forestry, fishing and hunting (%)
Most Common Industries - Mining, quarrying, and oil and gas extraction (%)
Most Common Industries - Construction (%)
Most Common Industries - Manufacturing (%)
Most Common Industries - Wholesale trade (%)
Most Common Industries - Retail trade (%)
Most Common Industries - Transportation and warehousing, and utilities (%)
Most Common Industries - Transportation and warehousing (%)
Most Common Industries - Utilities (%)
Most Common Industries - Information (%)
Most Common Industries - Finance and insurance, and real estate and rental and leasing (%)
Most Common Industries - Finance and insurance (%)
Most Common Industries - Real estate and rental and leasing (%)
Most Common Industries - Professional, scientific, and management, and administrative and waste management services (%)
Most Common Industries - Professional, scientific, and technical services (%)
Most Common Industries - Management of companies and enterprises (%)
Most Common Industries - Administrative and support and waste management services (%)
Most Common Industries - Educational services, and health care and social assistance (%)
Most Common Industries - Educational services (%)
Most Common Industries - Health care and social assistance (%)
Most Common Industries - Arts, entertainment, and recreation, and accommodation and food services (%)
Most Common Industries - Arts, entertainment, and recreation (%)
Most Common Industries - Accommodation and food services (%)
Most Common Industries - Other services, except public administration (%)
Most Common Industries - Public administration (%)
Occupation diversity
Most Common Occupations - Management, business, science, and arts occupations (%)
Most Common Occupations - Management, business, and financial occupations (%)
Most Common Occupations - Management occupations (%)
Most Common Occupations - Business and financial operations occupations (%)
Most Common Occupations - Computer, engineering, and science occupations (%)
Most Common Occupations - Computer and mathematical occupations (%)
Most Common Occupations - Architecture and engineering occupations (%)
Most Common Occupations - Life, physical, and social science occupations (%)
Most Common Occupations - Education, legal, community service, arts, and media occupations (%)
Most Common Occupations - Community and social service occupations (%)
Most Common Occupations - Legal occupations (%)
Most Common Occupations - Education, training, and library occupations (%)
Most Common Occupations - Arts, design, entertainment, sports, and media occupations (%)
Most Common Occupations - Healthcare practitioners and technical occupations (%)
Most Common Occupations - Health diagnosing and treating practitioners and other technical occupations (%)
Most Common Occupations - Health technologists and technicians (%)
Most Common Occupations - Service occupations (%)
Most Common Occupations - Healthcare support occupations (%)
Most Common Occupations - Protective service occupations (%)
Most Common Occupations - Fire fighting and prevention, and other protective service workers including supervisors (%)
Most Common Occupations - Law enforcement workers including supervisors (%)
Most Common Occupations - Food preparation and serving related occupations (%)
Most Common Occupations - Building and grounds cleaning and maintenance occupations (%)
Most Common Occupations - Personal care and service occupations (%)
Most Common Occupations - Sales and office occupations (%)
Most Common Occupations - Sales and related occupations (%)
Most Common Occupations - Office and administrative support occupations (%)
Most Common Occupations - Natural resources, construction, and maintenance occupations (%)
Most Common Occupations - Farming, fishing, and forestry occupations (%)
Most Common Occupations - Construction and extraction occupations (%)
Most Common Occupations - Installation, maintenance, and repair occupations (%)
Most Common Occupations - Production, transportation, and material moving occupations (%)
Most Common Occupations - Production occupations (%)
Most Common Occupations - Transportation occupations (%)
Most Common Occupations - Material moving occupations (%)
People in Group quarters - Institutionalized population (%)
People in Group quarters - Correctional institutions (%)
People in Group quarters - Federal prisons and detention centers (%)
People in Group quarters - Halfway houses (%)
People in Group quarters - Local jails and other confinement facilities (including police lockups) (%)
People in Group quarters - Military disciplinary barracks (%)
People in Group quarters - State prisons (%)
People in Group quarters - Other types of correctional institutions (%)
People in Group quarters - Nursing homes (%)
People in Group quarters - Hospitals/wards, hospices, and schools for the handicapped (%)
People in Group quarters - Hospitals/wards and hospices for chronically ill (%)
People in Group quarters - Hospices or homes for chronically ill (%)
People in Group quarters - Military hospitals or wards for chronically ill (%)
People in Group quarters - Other hospitals or wards for chronically ill (%)
People in Group quarters - Hospitals or wards for drug/alcohol abuse (%)
People in Group quarters - Mental (Psychiatric) hospitals or wards (%)
People in Group quarters - Schools, hospitals, or wards for the mentally retarded (%)
People in Group quarters - Schools, hospitals, or wards for the physically handicapped (%)
People in Group quarters - Institutions for the deaf (%)
People in Group quarters - Institutions for the blind (%)
People in Group quarters - Orthopedic wards and institutions for the physically handicapped (%)
People in Group quarters - Wards in general hospitals for patients who have no usual home elsewhere (%)
People in Group quarters - Wards in military hospitals for patients who have no usual home elsewhere (%)
People in Group quarters - Juvenile institutions (%)
People in Group quarters - Long-term care (%)
People in Group quarters - Homes for abused, dependent, and neglected children (%)
People in Group quarters - Residential treatment centers for emotionally disturbed children (%)
People in Group quarters - Training schools for juvenile delinquents (%)
People in Group quarters - Short-term care, detention or diagnostic centers for delinquent children (%)
People in Group quarters - Type of juvenile institution unknown (%)
People in Group quarters - Noninstitutionalized population (%)
People in Group quarters - College dormitories (includes college quarters off campus) (%)
People in Group quarters - Military quarters (%)
People in Group quarters - On base (%)
People in Group quarters - Barracks, unaccompanied personnel housing (UPH), (Enlisted/Officer), ;and similar group living quarters for military personnel (%)
People in Group quarters - Transient quarters for temporary residents (%)
People in Group quarters - Military ships (%)
People in Group quarters - Group homes (%)
People in Group quarters - Homes or halfway houses for drug/alcohol abuse (%)
People in Group quarters - Homes for the mentally ill (%)
People in Group quarters - Homes for the mentally retarded (%)
People in Group quarters - Homes for the physically handicapped (%)
People in Group quarters - Other group homes (%)
People in Group quarters - Religious group quarters (%)
People in Group quarters - Dormitories (%)
People in Group quarters - Agriculture workers' dormitories on farms (%)
People in Group quarters - Job Corps and vocational training facilities (%)
People in Group quarters - Other workers' dormitories (%)
People in Group quarters - Crews of maritime vessels (%)
People in Group quarters - Other nonhousehold living situations (%)
People in Group quarters - Other noninstitutional group quarters (%)
Residents speaking English at home (%)
Residents speaking English at home - Born in the United States (%)
Residents speaking English at home - Native, born elsewhere (%)
Residents speaking English at home - Foreign born (%)
Residents speaking Spanish at home (%)
Residents speaking Spanish at home - Born in the United States (%)
Residents speaking Spanish at home - Native, born elsewhere (%)
Residents speaking Spanish at home - Foreign born (%)
Residents speaking other language at home (%)
Residents speaking other language at home - Born in the United States (%)
Residents speaking other language at home - Native, born elsewhere (%)
Residents speaking other language at home - Foreign born (%)
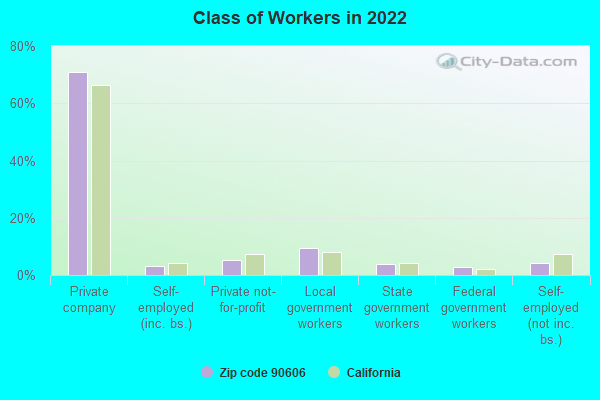
Class of Workers - Employee of private company (%)
Class of Workers - Self-employed in own incorporated business (%)
Class of Workers - Private not-for-profit wage and salary workers (%)
Class of Workers - Local government workers (%)
Class of Workers - State government workers (%)
Class of Workers - Federal government workers (%)
Class of Workers - Self-employed workers in own not incorporated business and Unpaid family workers (%)
House heating fuel used in houses and condos - Utility gas (%)
House heating fuel used in houses and condos - Bottled, tank, or LP gas (%)
House heating fuel used in houses and condos - Electricity (%)
House heating fuel used in houses and condos - Fuel oil, kerosene, etc. (%)
House heating fuel used in houses and condos - Coal or coke (%)
House heating fuel used in houses and condos - Wood (%)
House heating fuel used in houses and condos - Solar energy (%)
House heating fuel used in houses and condos - Other fuel (%)
House heating fuel used in houses and condos - No fuel used (%)
House heating fuel used in apartments - Utility gas (%)
House heating fuel used in apartments - Bottled, tank, or LP gas (%)
House heating fuel used in apartments - Electricity (%)
House heating fuel used in apartments - Fuel oil, kerosene, etc. (%)
House heating fuel used in apartments - Coal or coke (%)
House heating fuel used in apartments - Wood (%)
House heating fuel used in apartments - Solar energy (%)
House heating fuel used in apartments - Other fuel (%)
House heating fuel used in apartments - No fuel used (%)
Armed forces status - In Armed Forces (%)
Armed forces status - Civilian (%)
Armed forces status - Civilian - Veteran (%)
Armed forces status - Civilian - Nonveteran (%)
Fatal accidents locations in years 2005-2021
Fatal accidents locations in 2005
Fatal accidents locations in 2006
Fatal accidents locations in 2007
Fatal accidents locations in 2008
Fatal accidents locations in 2009
Fatal accidents locations in 2010
Fatal accidents locations in 2011
Fatal accidents locations in 2012
Fatal accidents locations in 2013
Fatal accidents locations in 2014
Fatal accidents locations in 2015
Fatal accidents locations in 2016
Fatal accidents locations in 2017
Fatal accidents locations in 2018
Fatal accidents locations in 2019
Fatal accidents locations in 2020
Fatal accidents locations in 2021
Alcohol use - People drinking some alcohol every month (%)
Alcohol use - People not drinking at all (%)
Alcohol use - Average days/month drinking alcohol
Alcohol use - Average drinks/week
Alcohol use - Average days/year people drink much
Audiometry - Average condition of hearing (%)
Audiometry - People that can hear a whisper from across a quiet room (%)
Audiometry - People that can hear normal voice from across a quiet room (%)
Audiometry - Ears ringing, roaring, buzzing (%)
Audiometry - Had a job exposure to loud noise (%)
Audiometry - Had off-work exposure to loud noise (%)
Blood Pressure & Cholesterol - Has high blood pressure (%)
Blood Pressure & Cholesterol - Checking blood pressure at home (%)
Blood Pressure & Cholesterol - Frequently checking blood cholesterol (%)
Blood Pressure & Cholesterol - Has high cholesterol level (%)
Consumer Behavior - Money monthly spent on food at supermarket/grocery store
Consumer Behavior - Money monthly spent on food at other stores
Consumer Behavior - Money monthly spent on eating out
Consumer Behavior - Money monthly spent on carryout/delivered foods
Consumer Behavior - Income spent on food at supermarket/grocery store (%)
Consumer Behavior - Income spent on food at other stores (%)
Consumer Behavior - Income spent on eating out (%)
Consumer Behavior - Income spent on carryout/delivered foods (%)
Current Health Status - General health condition (%)
Current Health Status - Blood donors (%)
Current Health Status - Has blood ever tested for HIV virus (%)
Current Health Status - Left-handed people (%)
Dermatology - People using sunscreen (%)
Diabetes - Diabetics (%)
Diabetes - Had a blood test for high blood sugar (%)
Diabetes - People taking insulin (%)
Diet Behavior & Nutrition - Diet health (%)
Diet Behavior & Nutrition - Milk product consumption (# of products/month)
Diet Behavior & Nutrition - Meals not home prepared (#/week)
Diet Behavior & Nutrition - Meals from fast food or pizza place (#/week)
Diet Behavior & Nutrition - Ready-to-eat foods (#/month)
Diet Behavior & Nutrition - Frozen meals/pizza (#/month)
Drug Use - People that ever used marijuana or hashish (%)
Drug Use - Ever used hard drugs (%)
Drug Use - Ever used any form of cocaine (%)
Drug Use - Ever used heroin (%)
Drug Use - Ever used methamphetamine (%)
Health Insurance - People covered by health insurance (%)
Kidney Conditions-Urology - Avg. # of times urinating at night
Medical Conditions - People with asthma (%)
Medical Conditions - People with anemia (%)
Medical Conditions - People with psoriasis (%)
Medical Conditions - People with overweight (%)
Medical Conditions - Elderly people having difficulties in thinking or remembering (%)
Medical Conditions - People who ever received blood transfusion (%)
Medical Conditions - People having trouble seeing even with glass/contacts (%)
Medical Conditions - People with arthritis (%)
Medical Conditions - People with gout (%)
Medical Conditions - People with congestive heart failure (%)
Medical Conditions - People with coronary heart disease (%)
Medical Conditions - People with angina pectoris (%)
Medical Conditions - People who ever had heart attack (%)
Medical Conditions - People who ever had stroke (%)
Medical Conditions - People with emphysema (%)
Medical Conditions - People with thyroid problem (%)
Medical Conditions - People with chronic bronchitis (%)
Medical Conditions - People with any liver condition (%)
Medical Conditions - People who ever had cancer or malignancy (%)
Mental Health - People who have little interest in doing things (%)
Mental Health - People feeling down, depressed, or hopeless (%)
Mental Health - People who have trouble sleeping or sleeping too much (%)
Mental Health - People feeling tired or having little energy (%)
Mental Health - People with poor appetite or overeating (%)
Mental Health - People feeling bad about themself (%)
Mental Health - People who have trouble concentrating on things (%)
Mental Health - People moving or speaking slowly or too fast (%)
Mental Health - People having thoughts they would be better off dead (%)
Oral Health - Average years since last visit a dentist
Oral Health - People embarrassed because of mouth (%)
Oral Health - People with gum disease (%)
Oral Health - General health of teeth and gums (%)
Oral Health - Average days a week using dental floss/device
Oral Health - Average days a week using mouthwash for dental problem
Oral Health - Average number of teeth
Pesticide Use - Households using pesticides to control insects (%)
Pesticide Use - Households using pesticides to kill weeds (%)
Physical Activity - People doing vigorous-intensity work activities (%)
Physical Activity - People doing moderate-intensity work activities (%)
Physical Activity - People walking or bicycling (%)
Physical Activity - People doing vigorous-intensity recreational activities (%)
Physical Activity - People doing moderate-intensity recreational activities (%)
Physical Activity - Average hours a day doing sedentary activities
Physical Activity - Average hours a day watching TV or videos
Physical Activity - Average hours a day using computer
Physical Functioning - People having limitations keeping them from working (%)
Physical Functioning - People limited in amount of work they can do (%)
Physical Functioning - People that need special equipment to walk (%)
Physical Functioning - People experiencing confusion/memory problems (%)
Physical Functioning - People requiring special healthcare equipment (%)
Prescription Medications - Average number of prescription medicines taking
Preventive Aspirin Use - Adults 40+ taking low-dose aspirin (%)
Reproductive Health - Vaginal deliveries (%)
Reproductive Health - Cesarean deliveries (%)
Reproductive Health - Deliveries resulted in a live birth (%)
Reproductive Health - Pregnancies resulted in a delivery (%)
Reproductive Health - Women breastfeeding newborns (%)
Reproductive Health - Women that had a hysterectomy (%)
Reproductive Health - Women that had both ovaries removed (%)
Reproductive Health - Women that have ever taken birth control pills (%)
Reproductive Health - Women taking birth control pills (%)
Reproductive Health - Women that have ever used Depo-Provera or injectables (%)
Reproductive Health - Women that have ever used female hormones (%)
Sexual Behavior - People 18+ that ever had sex (vaginal, anal, or oral) (%)
Sexual Behavior - Males 18+ that ever had vaginal sex with a woman (%)
Sexual Behavior - Males 18+ that ever performed oral sex on a woman (%)
Sexual Behavior - Males 18+ that ever had anal sex with a woman (%)
Sexual Behavior - Males 18+ that ever had any sex with a man (%)
Sexual Behavior - Females 18+ that ever had vaginal sex with a man (%)
Sexual Behavior - Females 18+ that ever performed oral sex on a man (%)
Sexual Behavior - Females 18+ that ever had anal sex with a man (%)
Sexual Behavior - Females 18+ that ever had any kind of sex with a woman (%)
Sexual Behavior - Average age people first had sex
Sexual Behavior - Average number of female sex partners in lifetime (males 18+)
Sexual Behavior - Average number of female vaginal sex partners in lifetime (males 18+)
Sexual Behavior - Average age people first performed oral sex on a woman (18+)
Sexual Behavior - Average number of woman performed oral sex on in lifetime (18+)
Sexual Behavior - Average number of male sex partners in lifetime (males 18+)
Sexual Behavior - Average number of male anal sex partners in lifetime (males 18+)
Sexual Behavior - Average age people first performed oral sex on a man (18+)
Sexual Behavior - Average number of male oral sex partners in lifetime (18+)
Sexual Behavior - People using protection when performing oral sex (%)
Sexual Behavior - Average number of times people have vaginal or anal sex a year
Sexual Behavior - People having sex without condom (%)
Sexual Behavior - Average number of male sex partners in lifetime (females 18+)
Sexual Behavior - Average number of male vaginal sex partners in lifetime (females 18+)
Sexual Behavior - Average number of female sex partners in lifetime (females 18+)
Sexual Behavior - Circumcised males 18+ (%)
Sleep Disorders - Average hours sleeping at night
Sleep Disorders - People that has trouble sleeping (%)
Smoking-Cigarette Use - People smoking cigarettes (%)
Taste & Smell - People 40+ having problems with smell (%)
Taste & Smell - People 40+ having problems with taste (%)
Taste & Smell - People 40+ that ever had wisdom teeth removed (%)
Taste & Smell - People 40+ that ever had tonsils teeth removed (%)
Taste & Smell - People 40+ that ever had a loss of consciousness because of a head injury (%)
Taste & Smell - People 40+ that ever had a broken nose or other serious injury to face or skull (%)
Taste & Smell - People 40+ that ever had two or more sinus infections (%)
Weight - Average height (inches)
Weight - Average weight (pounds)
Weight - Average BMI
Weight - People that are obese (%)
Weight - People that ever were obese (%)
Weight - People trying to lose weight (%)
100%
urban population.
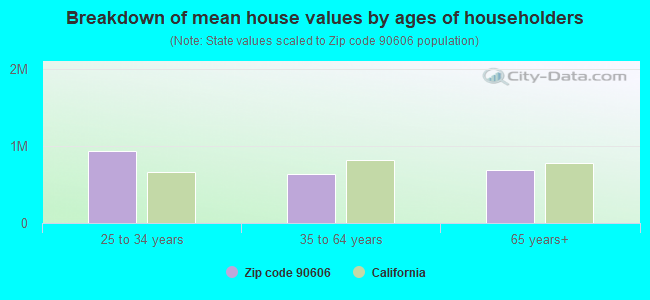
Estimated median house/condo value in 2022: $643,474
90606:
$643,474California:
$715,900
According to our research of California and other state lists, there were 36 registered sex offenders living in 90606 zip code as of April 27, 2024 . The ratio of all residents to sex offenders in zip code 90606 is 916 to 1.The ratio of registered sex offenders to all residents in this zip code is near the state average.
Median resident age: This zip code:
38.1 yearsCalifornia median age:
37.9 years
Average household size: This zip code:
3.5 peopleCalifornia:
2.8 people
Averages for the 2020 tax year for zip code 90606, filed in 2021:
Average Adjusted Gross Income (AGI) in 2020: $50,305 (Individual Income Tax Returns) Here:
$50,305State:
$95,910
Salary/wage: $48,869 (reported on 85.1% of returns )Here:
$48,869State:
$77,331
(% of AGI for various income ranges: 1219.2% for AGIs below $25k , 3983.7% for AGIs $25k-50k , 7378.4% for AGIs $50k-75k , 10878.0% for AGIs $75k-100k , 20707.0% for AGIs $100k-200k , 51738.3% for AGIs over 200k ) Taxable interest for individuals: $313 (reported on 27.9% of returns )This zip code:
$313California:
$2,294
(% of AGI for various income ranges: 5.6% for AGIs below $25k , 6.9% for AGIs $25k-50k , 14.0% for AGIs $50k-75k , 24.9% for AGIs $75k-100k , 39.7% for AGIs $100k-200k , 83.3% for AGIs over 200k ) Ordinary dividends: $1,621 (reported on 5.8% of returns )(% of AGI for various income ranges: 5.1% for AGIs below $25k , 4.0% for AGIs $25k-50k , 9.5% for AGIs $50k-75k , 20.7% for AGIs $75k-100k , 64.8% for AGIs $100k-200k , 245.0% for AGIs over 200k ) Net capital gain/loss in AGI: +$1,806 (reported on 6.6% of returns )Here:
+$1,806State:
+$49,306
(% of AGI for various income ranges: 1.6% for AGIs below $25k , 1.5% for AGIs $25k-50k , 13.5% for AGIs $50k-75k , 24.5% for AGIs $75k-100k , 104.8% for AGIs $100k-200k , 448.3% for AGIs over 200k ) Profit/loss from business: +$6,547 (reported on 14.8% of returns )Here:
+$6,547State:
+$15,671
(% of AGI for various income ranges: 164.7% for AGIs below $25k , 104.5% for AGIs $25k-50k , 100.3% for AGIs $50k-75k , 138.3% for AGIs $75k-100k , 187.6% for AGIs $100k-200k , 1201.7% for AGIs over 200k ) Taxable individual retirement arrangement distribution: $12,667 (reported on 3.4% of returns )90606:
$12,667California:
$23,505
(% of AGI for various income ranges: 24.3% for AGIs below $25k , 30.7% for AGIs $25k-50k , 60.0% for AGIs $50k-75k , 133.7% for AGIs $75k-100k , 247.8% for AGIs $100k-200k ) Total itemized deductions: $27,665 (reported on 14.3% of returns )Here:
$27,665State:
$39,517
(% of AGI for various income ranges: 60.7% for AGIs below $25k , 209.5% for AGIs $25k-50k , 715.9% for AGIs $50k-75k , 1381.0% for AGIs $75k-100k , 2410.7% for AGIs $100k-200k , 5245.0% for AGIs over 200k ) Charity contributions: $4,296 (reported on 12.0% of returns )(% of AGI for various income ranges: 3.6% for AGIs below $25k , 26.8% for AGIs $25k-50k , 85.7% for AGIs $50k-75k , 155.0% for AGIs $75k-100k , 333.8% for AGIs $100k-200k , 1213.3% for AGIs over 200k ) Taxes paid: $8,520 (reported on 14.3% of returns )(% of AGI for various income ranges: 13.3% for AGIs below $25k , 52.6% for AGIs $25k-50k , 224.8% for AGIs $50k-75k , 449.9% for AGIs $75k-100k , 788.7% for AGIs $100k-200k , 1360.0% for AGIs over 200k ) Earned income credit: $2,051 (reported on 17.0% of returns )(% of AGI for various income ranges: 91.5% for AGIs below $25k , 62.7% for AGIs $25k-50k , 0.6% for AGIs $50k-75k ) Percentage of individuals using paid preparers for their 2020 taxes: 91.9%(% for various income ranges: 91.2% for AGIs below $25k , 92.8% for AGIs $25k-50k , 91.8% for AGIs $50k-75k , 92.1% for AGIs $75k-100k , 91.6% for AGIs $100k-200k , 93.3% for AGIs over 200k )
Averages for the 2012 tax year for zip code 90606, filed in 2013:
Average Adjusted Gross Income (AGI) in 2012: $40,525 (Individual Income Tax Returns) Here:
$40,525State:
$72,726
Salary/wage: $39,610 (reported on 86.9% of returns )Here:
$39,610State:
$59,079
(% of AGI for various income ranges: 76.7% for AGIs below $25k , 86.8% for AGIs $25k-50k , 87.0% for AGIs $50k-75k , 85.7% for AGIs $75k-100k , 89.0% for AGIs $100k-200k , 58.5% for AGIs over 200k ) Taxable interest for individuals: $300 (reported on 25.7% of returns )This zip code:
$300California:
$2,146
(% of AGI for various income ranges: 0.3% for AGIs below $25k , 0.2% for AGIs $25k-50k , 0.2% for AGIs $50k-75k , 0.2% for AGIs $75k-100k , 0.1% for AGIs $100k-200k , 0.2% for AGIs over 200k ) Ordinary dividends: $1,307 (reported on 5.4% of returns )(% of AGI for various income ranges: 0.2% for AGIs below $25k , 0.1% for AGIs $25k-50k , 0.1% for AGIs $50k-75k , 0.1% for AGIs $75k-100k , 0.3% for AGIs $100k-200k ) Profit/loss from business: +$8,585 (reported on 13.3% of returns )Here:
+$8,585State:
+$17,064
(% of AGI for various income ranges: 10.7% for AGIs below $25k , 2.4% for AGIs $25k-50k , 1.2% for AGIs $50k-75k , 1.3% for AGIs $75k-100k , 1.2% for AGIs $100k-200k ) Taxable individual retirement arrangement distribution: $12,955 (reported on 3.9% of returns )90606:
$12,955California:
$19,557
(% of AGI for various income ranges: 1.2% for AGIs below $25k , 0.9% for AGIs $25k-50k , 0.9% for AGIs $50k-75k , 1.6% for AGIs $75k-100k , 2.0% for AGIs $100k-200k ) Total itemized deductions: $21,354 (31% of AGI, reported on 31.8% of returns )Here:
$21,354State:
$34,004
Here:
30.5% of AGIState:
22.7% of AGI
(% of AGI for various income ranges: 8.2% for AGIs below $25k , 13.0% for AGIs $25k-50k , 19.4% for AGIs $50k-75k , 22.0% for AGIs $75k-100k , 20.7% for AGIs $100k-200k , 15.1% for AGIs over 200k ) Charity contributions: $2,149 (reported on 26.8% of returns )(% of AGI for various income ranges: 0.4% for AGIs below $25k , 1.1% for AGIs $25k-50k , 1.6% for AGIs $50k-75k , 2.0% for AGIs $75k-100k , 1.9% for AGIs $100k-200k , 1.5% for AGIs over 200k ) Taxes paid: $6,079 (reported on 31.8% of returns )90606:
$6,079State:
$14,448
(% of AGI for various income ranges: 1.6% for AGIs below $25k , 2.9% for AGIs $25k-50k , 5.2% for AGIs $50k-75k , 6.6% for AGIs $75k-100k , 7.1% for AGIs $100k-200k , 7.6% for AGIs over 200k ) Earned income credit: $2,309 (reported on 24.0% of returns )(% of AGI for various income ranges: 7.3% for AGIs below $25k , 1.3% for AGIs $25k-50k ) Percentage of individuals using paid preparers for their 2012 taxes: 73.9%(% for various income ranges: 69.9% for AGIs below $25k , 75.1% for AGIs $25k-50k , 76.6% for AGIs $50k-75k , 80.2% for AGIs $75k-100k , 80.5% for AGIs $100k-200k , 100.0% for AGIs over 200k )
Averages for the 2004 tax year for zip code 90606, filed in 2005:
Average Adjusted Gross Income (AGI) in 2004: $35,706 (Individual Income Tax Returns) Here:
$35,706State:
$58,600
Salary/wage: $35,228 (reported on 89.0% of returns )Here:
$35,228State:
$49,455
(% of AGI for various income ranges: 95.7% for AGIs below $10k , 81.5% for AGIs $10k-25k , 90.2% for AGIs $25k-50k , 90.2% for AGIs $50k-75k , 91.5% for AGIs $75k-100k , 78.5% for AGIs over 100k ) Taxable interest for individuals: $563 (reported on 33.2% of returns )This zip code:
$563California:
$2,365
(% of AGI for various income ranges: 2.2% for AGIs below $10k , 0.8% for AGIs $10k-25k , 0.4% for AGIs $25k-50k , 0.5% for AGIs $50k-75k , 0.3% for AGIs $75k-100k , 0.6% for AGIs over 100k ) Taxable dividends: $1,187 (reported on 8.0% of returns )(% of AGI for various income ranges: 0.8% for AGIs below $10k , 0.3% for AGIs $10k-25k , 0.1% for AGIs $25k-50k , 0.2% for AGIs $50k-75k , 0.2% for AGIs $75k-100k , 0.6% for AGIs over 100k ) Net capital gain/loss: +$6,313 (reported on 6.0% of returns )Here:
+$6,313State:
+$23,418
(% of AGI for various income ranges: -0.4% for AGIs below $10k , -0.0% for AGIs $10k-25k , 0.1% for AGIs $25k-50k , 0.3% for AGIs $50k-75k , 0.6% for AGIs $75k-100k , 7.1% for AGIs over 100k ) Profit/loss from business: +$7,908 (reported on 12.6% of returns )Here:
+$7,908State:
+$16,826
(% of AGI for various income ranges: 9.8% for AGIs below $10k , 6.8% for AGIs $10k-25k , 2.3% for AGIs $25k-50k , 1.6% for AGIs $50k-75k , 1.8% for AGIs $75k-100k , 1.8% for AGIs over 100k ) IRA payment deduction: $2,399 (reported on 1.3% of returns )90606:
$2,399California:
$3,192
(% of AGI for various income ranges: 0.1% for AGIs $10k-25k , 0.1% for AGIs $25k-50k , 0.1% for AGIs $50k-75k , 0.1% for AGIs $75k-100k ) Self-employed pension: $6,000 (reported on 0.1% of returns )Here:
$6,000California:
$17,688
Total itemized deductions: $19,530 (34% of AGI, reported on 36.2% of returns )Here:
$19,530State:
$28,113
Here:
33.6% of AGIState:
25.3% of AGI
(% of AGI for various income ranges: 11.5% for AGIs below $10k , 9.8% for AGIs $10k-25k , 18.4% for AGIs $25k-50k , 24.3% for AGIs $50k-75k , 24.8% for AGIs $75k-100k , 20.5% for AGIs over 100k ) Charity contributions deductions: $2,123 (4% of AGI, reported on 32.2% of returns )Here:
3.5% of AGIState:
3.3% of AGI
(% of AGI for various income ranges: 0.5% for AGIs below $10k , 0.7% for AGIs $10k-25k , 1.6% for AGIs $25k-50k , 2.3% for AGIs $50k-75k , 2.6% for AGIs $75k-100k , 2.5% for AGIs over 100k ) Total tax: $3,489 (reported on 68.5% of returns )90606:
$3,489State:
$10,761
(% of AGI for various income ranges: 3.0% for AGIs below $10k , 3.5% for AGIs $10k-25k , 5.1% for AGIs $25k-50k , 6.7% for AGIs $50k-75k , 8.1% for AGIs $75k-100k , 13.2% for AGIs over 100k ) Earned income credit: $1,831 (reported on 21.0% of returns )Percentage of individuals using paid preparers for their 2004 taxes: 74.9%(% for various income ranges: 66.9% for AGIs below $10k , 74.3% for AGIs $10k-25k , 76.4% for AGIs $25k-50k , 79.0% for AGIs $50k-75k , 78.3% for AGIs $75k-100k , 80.9% for AGIs over 100k )
Estimated median household income in 2022: This zip code:
$86,262California:
$91,551
Nearest zip codes: 90660 ,
90670 ,
90602 ,
90601 ,
90605 ,
90240 .
Whittier Zip Code Map
Percentage of family households: This zip code:
48.8%California:
46.8%
Percentage of households with unmarried partners: This zip code:
6.1%California:
48.1%
Likely homosexual households (counted as self-reported same-sex unmarried-partner households)
Lesbian couples: 0.0% of all households Gay men: 0.1% of all households
Household received Food Stamps/SNAP in the past 12 months: 1,050Household did not receive Food Stamps/SNAP in the past 12 months: 7,731
Women who had a birth in the past 12 months: 256 (177 now married , 79 unmarried) Women who did not have a birth in the past 12 months: 7,296 (2,778 now married , 4,522 unmarried)
Housing units in zip code 90606 with a mortgage: 4,188 (336
second mortgage , 8
home equity loan , 291
both second mortgage and home equity loan )
Houses without a mortgage: 18
Median monthly owner costs for units with a mortgage: $2,339
Median monthly owner costs for units without a mortgage: $521
Residents with income below the poverty level in 2022:
This zip code:
12.1%Whole state:
12.2%
Residents with income below 50% of the poverty level in 2022:
This zip code:
6.4%Whole state:
6.2%
Median number of rooms in houses and condos: Median number of rooms in apartments:
Year house built (houses)
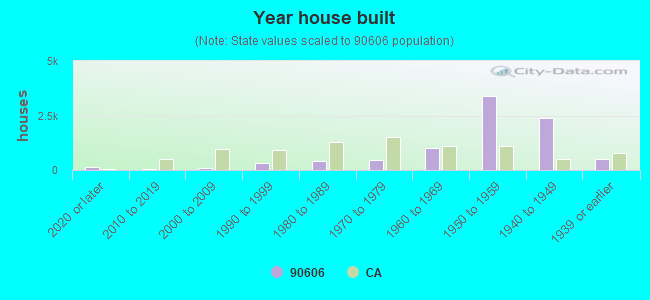
118 2020 or later43 2010 to 2019103 2000 to 2009334 1990 to 1999407 1980 to 1989440 1970 to 19791,004 1960 to 19693,402 1950 to 19592,366 1940 to 1949500 1939 or earlier
Zip code 90606 household income distribution in 2022 533 Less than $10,000237 $10,000 to $14,999132 $15,000 to $19,999192 $20,000 to $24,999183 $25,000 to $29,999297 $30,000 to $34,999231 $35,000 to $39,999376 $40,000 to $44,999303 $45,000 to $49,999475 $50,000 to $59,999856 $60,000 to $74,9991,252 $75,000 to $99,9991,160 $100,000 to $124,999817 $125,000 to $149,999987 $150,000 to $199,999766 $200,000 or moreEstimate of home value of owner-occupied houses/condos in 2022 in zip code 90606 40 Less than $10,00018 $10,000 to $14,99910 $15,000 to $19,99913 $20,000 to $24,9994 $35,000 to $39,99911 $40,000 to $49,99930 $50,000 to $59,99939 $60,000 to $69,99934 $70,000 to $79,99949 $80,000 to $89,99910 $90,000 to $99,9997 $100,000 to $124,9999 $125,000 to $149,99921 $150,000 to $174,99927 $200,000 to $249,99938 $250,000 to $299,999182 $300,000 to $399,999936 $400,000 to $499,9993,780 $500,000 to $749,999671 $750,000 to $999,99993 $1,000,000 to $1,499,99927 $1,500,000 to $1,999,999Rent paid by renters in 2022 in zip code 90606 13 $100 to $14915 $200 to $24975 $250 to $2994 $300 to $34912 $350 to $3992 $550 to $59924 $650 to $69935 $700 to $74914 $750 to $79951 $800 to $89953 $900 to $999319 $1,000 to $1,249456 $1,250 to $1,499651 $1,500 to $1,999534 $2,000 to $2,49956 $2,500 to $2,999129 $3,000 to $3,499136 No cash rent
Median gross rent in 2022: $1,792.
Median price asked for vacant for-sale houses and condos in 2022: $609,460.
Estimated median house (or condo) value in 2022 for: White Non-Hispanic householders: $628,347Black or African American householders: $835,468American Indian or Alaska Native householders: $591,887Asian householders: $788,536Some other race householders: $658,600Two or more races householders: $659,376Hispanic or Latino householders: $650,455Estimated median house or condo value in 2022: $643,474
90606:
$643,474California:
$715,900
Lower value quartile - upper value quartile: $539,417 - $757,570
Mean price in 2022: Detached houses: $675,522Here:
$675,522State:
$988,808
Townhouses or other attached units: $461,064Here:
$461,064State:
$838,546
In 5-or-more-unit structures: $1,644,041Here:
$1,644,041State:
$730,996
Mobile homes: $232,666Here:
$232,666State:
$184,506
Housing units in structures:
One, detached: 7,168One, attached: 307Two: 73 or 4: 1355 to 9: 18810 to 19: 25920 to 49: 21450 or more: 416Mobile homes: 308Unemployment : 3.5%
Means of transportation to work in zip code 90606 72.1% 10,341 Drove a car alone10.7% 1,541 Carpooled1.7% 239 Bus or trolley bus0.3% 46 Streetcar or trolley car0.2% 24 Taxi0.3% 43 Motorcycle1.2% 165 Walked1.1% 156 Other means11.2% 1,608 Worked at homeTravel time to work (commute) in zip code 90606 119 Less than 5 minutes903 5 to 9 minutes1,265 10 to 14 minutes1,287 15 to 19 minutes1,379 20 to 24 minutes937 25 to 29 minutes2,553 30 to 34 minutes841 35 to 39 minutes435 40 to 44 minutes1,141 45 to 59 minutes1,137 60 to 89 minutes525 90 or more minutes
Neighborhoods in zip code 90606: Percentage of zip code residents living and working in this county: 87.1%
Household type by relationship:
Households: 31,453
Male householders: 4,238 (776 living alone ), Female householders: 4,564 (875 living alone )4,659 spouses (4,595 opposite-sex spouses ), 694 unmarried partners , (694 opposite-sex unmarried partners ), 10,848 children (10,200 natural , 88 adopted , 554 stepchildren ), 1,553 grandchildren , 583 brothers or sisters , 1,437 parents , 91 foster children , 1,346 other relatives , 888 non-relatives In group quarters: 403 (-1 institutionalized population )
Size of family households: 1,756 2-persons , 1,436 3-persons , 1,327 4-persons , 1,131 5-persons , 561 6-persons , 680 7-or-more-persons
Size of nonfamily households: 1,651 1-person , 161 2-persons , 6 3-persons , 7 4-persons , 19 5-persons
3,608 married couples with children. single-parent households (484 men , 1,090 women ).
36.7% of residents of 90606 zip code speak English at home. of residents speak Spanish at home (72% very well, 10% well, 11% not well, 7% not at all ).of residents speak other Indo-European language at home (71% very well, 29% well ).of residents speak Asian or Pacific Island language at home (69% very well, 24% well, 6% not well ).of residents speak other language at home (15% very well, 53% well, 32% not well ).
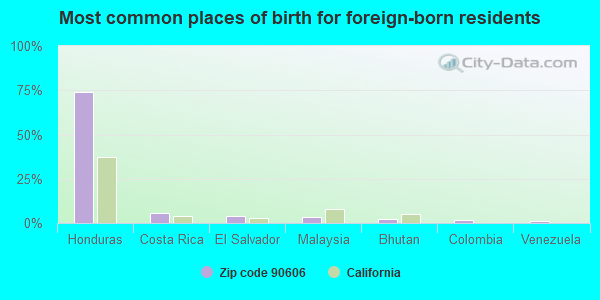
Foreign born population: 7,995 (25.4%)
(59.5%
of them are naturalized citizens )
This zip code:
25.4%Whole state:
26.7%
74% Honduras 5% Costa Rica 4% El Salvador 3% Malaysia 2% Bhutan 2% Colombia 1% Venezuela 4% American 1% German 1% English 1% Italian 0% Polish 0% European 0% Irish
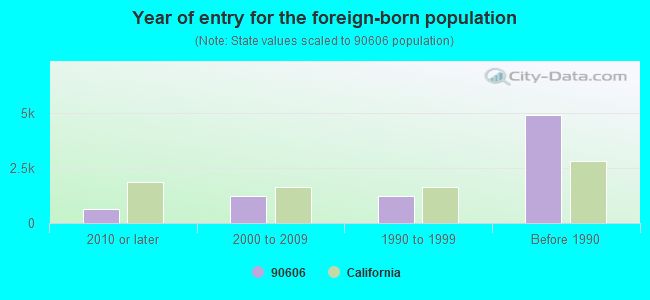
Year of entry for the foreign-born population
620 2010 or later 1,201 2000 to 2009 1,202 1990 to 1999 4,887 Before 1990
There are
131 Medical Specialists in Zip Code 90606 .
Major facilities with environmental interests located in this zip code:
FIRESTONE STORE #2798 (11230 E WASHINGTON BLVD in WHITTIER, CA)
STATE MASTER (California - Hazardous Waste Tracking) - HAZARDOU WASTE PROGRAM Small Quantity Generators, between 100 kg and 1000 kg of hazardous waste/month (Resource Conservation and Recovery Act (tracking hazardous waste)) - notification STATE MASTER (California - Used Oil Recycling System ) - USED OIL RECYCLING Organizations: FIRESTONE TIRE CO (CONTACT/OWNER)
Alternative names: FIRESTONE STORE #27EE
ADA S NELSON ELEMENTARY SCHOOL (8140 SOUTH VICKI DR in WHITTIER, CA)
(Geographic Names Information System) (National Center for Education Statistics) - STATE ID-6020077 Organizations: LOS NIETOS ELEMENTARY (SCHOOL DISTRICT)
Alternative names: NELSON (ADA S.) ELEMENTARY
AEOLIAN ELEMENTARY SCHOOL (11600 AEOLIAN ST in WHITTIER, CA)
(Geographic Names Information System) (National Center for Education Statistics) - STATE ID-6020085 Organizations: LOS NIETOS ELEMENTARY (SCHOOL DISTRICT)
EASTMAN KODAK CO REGL M& D CTR (12100 RIVERA ROAD in WHITTIER, CA)
STATE MASTER (California - Hazardous Waste Tracking) - HAZARDOU WASTE PROGRAM Small Quantity Generators, between 100 kg and 1000 kg of hazardous waste/month (Resource Conservation and Recovery Act (tracking hazardous waste))
EASTERN COMMUNITY DAY (5777 S. LOCKHEED in WHITTIER, CA)
(National Center for Education Statistics) - STATE ID-1996180 Organizations: LOS ANGELES CO. OFFICE OF EDUCATION (SCHOOL DISTRICT)
EDWARDS (KATHERINE) MIDDLE (6812 S. NORWALK BLVD. in WHITTIER, CA)
(National Center for Education Statistics) - STATE ID-6023659 Organizations: WHITTIER CITY ELEMENTARY (SCHOOL DISTRICT)
LOS NIETOS MIDDLE (11425 E. RIVERA ROAD in LOS NIETOS, CA)
(National Center for Education Statistics) - STATE ID-6020093 Organizations: LOS NIETOS ELEMENTARY (SCHOOL DISTRICT)
EASTERN TOOLS & EQUIPMENT (12220 RIVIERA ROAD, SUITE B in WHITTIER, CA)
(Integrated Compliance Information System) - ICIS-WF-2002-1004, FORMAL ENFORCEMENT ACTION
EXXONMOBIL OIL CORP. (11253 WHITTIER BLVD in WHITTIER, CA)
HAZARDOUS WASTE BIENNIAL REPORTER (Resource Conservation and Recovery Act (tracking hazardous waste)) Large Quantity Generators, more that 1000 kg of hazardous waste/month (Resource Conservation and Recovery Act (tracking hazardous waste)) Organizations: EXXONMOBIL OIL CORPORATION (CONTACT/OWNER)
EXXONMOBIL OIL CORP. (8441 PIONEER BLVD in WHITTIER, CA)
HAZARDOUS WASTE BIENNIAL REPORTER (Resource Conservation and Recovery Act (tracking hazardous waste)) Large Quantity Generators, more that 1000 kg of hazardous waste/month (Resource Conservation and Recovery Act (tracking hazardous waste)) Organizations: EXXONMOBIL OIL CORPORATION (CONTACT/OWNER)
GRAPHIC DIES (11822 E WASHINGTON BLVD in WHITTIER, CA)
(Resource Conservation and Recovery Act (tracking hazardous waste)) Organizations: BUSHAW LOREN (CONTACT/OWNER)
APEX (11655 E WASHINGTON in WHITTIER, CA)
Small Quantity Generators, between 100 kg and 1000 kg of hazardous waste/month (Resource Conservation and Recovery Act (tracking hazardous waste)) - notification Organizations: LGG FAMILY TRUST (CONTACT/OWNER)
FALCON AUTO DELIVERY INC (12115 E RIVERA RD in WHITTIER, CA)
Small Quantity Generators, between 100 kg and 1000 kg of hazardous waste/month (Resource Conservation and Recovery Act (tracking hazardous waste))
Housing units lacking complete plumbing facilities: 0.2%
Housing units lacking complete kitchen facilities: 0.7%
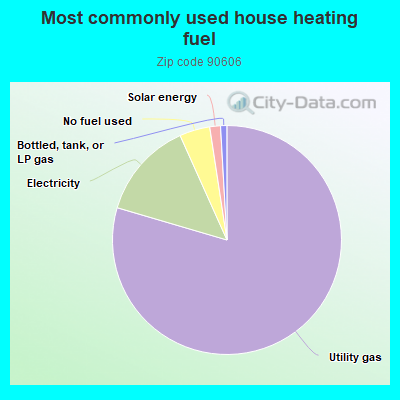
79.4% Utility gas 13.7% Electricity 4.3% No fuel used 1.5% Solar energy 0.9% Bottled, tank, or LP gas
Population in 1990: 30,185. Population change in the 1990s: +1,958 (+6.5%).
Place of birth for U.S.-born residents:
This state: 22,101Northeast: 181Midwest: 402South: 485West: 225
61% of the 90606 zip code residents lived in the same house 5 years ago.
Out of people who lived in different houses, 87% lived in this county.
Out of people who lived in different counties, 50% lived in California.
95% of the 90606 zip code residents lived in the same house 1 year ago.
Out of people who lived in different houses, 84% moved from this county.
Out of people who lived in different houses, 8% moved from different county within same state.
Out of people who lived in different houses, 8% moved from different state.
Out of people who lived in different houses, 3% moved from abroad.
Private vs. public school enrollment:
Students in private schools in grades 1 to 8 (elementary and middle school): 245
Here:
9.4%California:
10.5%
Students in private schools in grades 9 to 12 (high school): 24
Students in private undergraduate colleges: 445
Here:
22.3%California:
15.9%
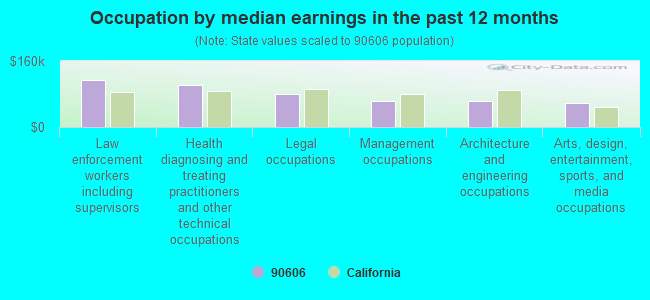
Occupation by median earnings in the past 12 months ($)
114,644 Law enforcement workers including supervisors 102,308 Health diagnosing and treating practitioners and other technical occupations 79,258 Legal occupations 64,073 Management occupations 63,124 Architecture and engineering occupations 58,939 Arts, design, entertainment, sports, and media occupations
Companies with federal contracts located in this zip code:
APPLIED POWER TECHNOLOGIES CORPORATION (12403 SALUSON AVE SUITE B in WHITTIER, CA; small business) employees , $300000 revenue : $13,822 in 2 contracts from 2002 to 2004
$7,668 with Bureau of Prisoners/Federal Prison System for . Signed on 2004-12-16. Completion date: 2004-12-31.
with Navy for Maintenance, Repair and Rebuilding of Equipment -- Electrical and Electronic Equipment Components. Signed on 2002-10-18. Completion date: 2002-12-02.
COMPU-AIRE INC (8167 BYRON RD in WHITTIER, CA; small business) in 2 contracts in 2001
$0 with Army for Air Conditioning Equipment. Signed on 2001-04-26. Completion date: 2001-09-30.
, same as above. Signed on 2001-04-26. Completion date: 2001-09-30.
Top industries in this zip code by the number of employees in 2005:
Health Care and Social Assistance: General Medical and Surgical Hospitals (over 1000 employees: 1 establishment)Accommodation and Food Services: Limited-Service Restaurants (50-99: 1, 20-49: 10, 10-19: 4, 5-9: 6, 1-4: 4)Administrative and Support and Waste Management and Remediation Services: Security Guards and Patrol Services (100-249: 1, 5-9: 1)Administrative and Support and Waste Management and Remediation Services: Janitorial Services (100-249: 1, 1-4: 3)Construction: Plumbing, Heating, and Air-Conditioning Contractors (100-249: 1, 1-4: 3)Accommodation and Food Services: Full-Service Restaurants (20-49: 4, 10-19: 2, 1-4: 2)Wholesale Trade: Photographic Equipment and Supplies Merchant Wholesalers (100-249: 1)Health Care and Social Assistance: Continuing Care Retirement Communities (100-249: 1)
People in group quarters in 2010:
202 people in nursing facilities/skilled-nursing facilities
23 people in group homes intended for adults
13 people in other noninstitutional facilities
8 people in workers' group living quarters and job corps centers
People in group quarters in 2000:
748 people in unknown juvenile institutions
178 people in nursing homes
56 people in other noninstitutional group quarters
18 people in hospitals/wards and hospices for chronically ill
18 people in other hospitals or wards for chronically ill
12 people in homes for the mentally retarded
3 people in religious group quarters
Fatal accident statistics in 2014:
Fatal accident count: 2Vehicles involved in fatal accidents: 3Fatal accidents caused by drunken drivers: 1Fatalities: 2Persons involved in fatal accidents: 3Pedestrians involved in fatal accidents: 1
Fatal accident statistics in 2013:
Fatal accident count: 4Vehicles involved in fatal accidents: 7Fatal accidents caused by drunken drivers: 1Fatalities: 5Persons involved in fatal accidents: 10Pedestrians involved in fatal accidents: 2
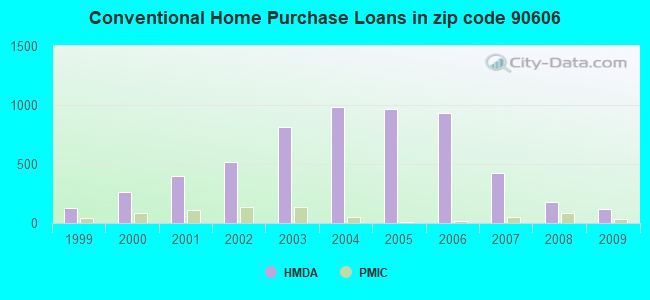
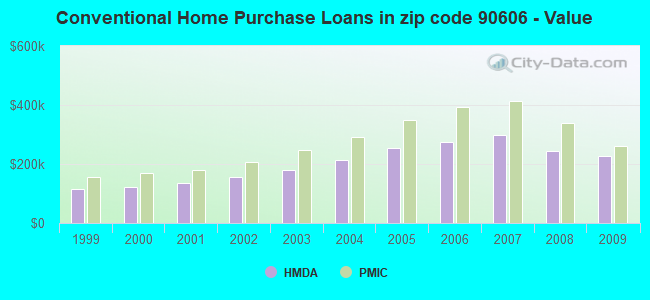
Home Mortgage Disclosure Act Aggregated Statistics For Year 2009(Based on 6 full and 10 partial tracts) A) FHA, FSA/RHS & VA B) Conventional C) Refinancings D) Home Improvement Loans E) Loans on Dwellings For 5+ Families F) Non-occupant Loans on G) Loans On Manufactured Number Average Value Number Average Value Number Average Value Number Average Value Number Average Value Number Average Value Number Average Value
LOANS ORIGINATED 299 $282,484 120 $226,552 702 $230,736 36 $129,396 2 $2,708,185 55 $191,528 0 $0 APPLICATIONS APPROVED, NOT ACCEPTED 40 $290,804 20 $213,732 92 $241,733 14 $83,469 0 $0 11 $203,030 2 $26,815 APPLICATIONS DENIED 58 $287,662 27 $242,234 388 $262,186 36 $121,316 0 $0 24 $271,168 2 $47,945 APPLICATIONS WITHDRAWN 36 $292,453 38 $241,336 201 $262,931 19 $142,714 0 $0 19 $240,773 0 $0 FILES CLOSED FOR INCOMPLETENESS 13 $310,718 11 $162,887 81 $270,068 2 $132,230 0 $0 11 $153,183 0 $0
Aggregated Statistics For Year 2008(Based on 6 full and 10 partial tracts) A) FHA, FSA/RHS & VA B) Conventional C) Refinancings D) Home Improvement Loans E) Loans on Dwellings For 5+ Families F) Non-occupant Loans on G) Loans On Manufactured Number Average Value Number Average Value Number Average Value Number Average Value Number Average Value Number Average Value Number Average Value
LOANS ORIGINATED 139 $333,382 177 $244,045 536 $260,146 68 $130,568 4 $598,268 63 $235,945 11 $48,435 APPLICATIONS APPROVED, NOT ACCEPTED 10 $336,517 61 $246,124 198 $295,383 26 $134,360 0 $0 21 $303,087 14 $109,016 APPLICATIONS DENIED 37 $356,643 88 $301,752 562 $305,862 96 $132,786 0 $0 34 $268,776 8 $52,061 APPLICATIONS WITHDRAWN 20 $315,088 44 $322,086 177 $279,565 27 $118,506 0 $0 11 $231,675 0 $0 FILES CLOSED FOR INCOMPLETENESS 9 $423,990 12 $341,246 72 $321,148 2 $236,725 0 $0 7 $299,019 0 $0
Aggregated Statistics For Year 2007(Based on 6 full and 10 partial tracts) A) FHA, FSA/RHS & VA B) Conventional C) Refinancings D) Home Improvement Loans E) Loans on Dwellings For 5+ Families F) Non-occupant Loans on G) Loans On Manufactured Number Average Value Number Average Value Number Average Value Number Average Value Number Average Value Number Average Value Number Average Value
LOANS ORIGINATED 1 $240,890 427 $297,060 1,411 $296,540 254 $184,135 7 $1,068,226 129 $313,364 12 $68,768 APPLICATIONS APPROVED, NOT ACCEPTED 0 $0 135 $278,158 394 $293,241 51 $157,737 0 $0 38 $284,602 16 $72,994 APPLICATIONS DENIED 2 $434,980 269 $293,148 1,074 $336,391 247 $170,469 0 $0 92 $304,755 17 $50,328 APPLICATIONS WITHDRAWN 2 $480,240 115 $311,770 402 $318,851 63 $292,810 0 $0 28 $315,048 0 $0 FILES CLOSED FOR INCOMPLETENESS 0 $0 35 $354,896 163 $345,667 6 $95,497 0 $0 4 $266,190 0 $0
Aggregated Statistics For Year 2006(Based on 6 full and 10 partial tracts) A) FHA, FSA/RHS & VA B) Conventional C) Refinancings D) Home Improvement Loans E) Loans on Dwellings For 5+ Families F) Non-occupant Loans on G) Loans On Manufactured Number Average Value Number Average Value Number Average Value Number Average Value Number Average Value Number Average Value Number Average Value
LOANS ORIGINATED 1 $197,470 930 $274,875 2,106 $295,379 349 $204,575 13 $1,019,268 179 $256,669 0 $0 APPLICATIONS APPROVED, NOT ACCEPTED 0 $0 204 $260,639 501 $299,914 75 $176,111 0 $0 40 $292,466 2 $41,450 APPLICATIONS DENIED 0 $0 376 $278,948 1,094 $322,956 301 $166,312 9 $724,633 73 $311,762 15 $196,531 APPLICATIONS WITHDRAWN 2 $221,460 175 $273,087 788 $318,061 127 $204,479 3 $1,183,333 64 $243,232 2 $253,545 FILES CLOSED FOR INCOMPLETENESS 2 $221,460 41 $294,980 148 $328,006 25 $170,872 0 $0 3 $280,350 0 $0
Aggregated Statistics For Year 2005(Based on 6 full and 10 partial tracts) A) FHA, FSA/RHS & VA B) Conventional C) Refinancings D) Home Improvement Loans E) Loans on Dwellings For 5+ Families F) Non-occupant Loans on G) Loans On Manufactured Number Average Value Number Average Value Number Average Value Number Average Value Number Average Value Number Average Value Number Average Value
LOANS ORIGINATED 2 $156,995 969 $253,315 2,496 $265,734 366 $156,372 7 $2,765,834 186 $231,572 9 $131,780 APPLICATIONS APPROVED, NOT ACCEPTED 0 $0 165 $254,379 479 $248,451 79 $142,818 1 $268,300 39 $250,173 6 $53,993 APPLICATIONS DENIED 1 $215,180 343 $242,639 971 $276,052 255 $139,024 0 $0 85 $265,679 9 $53,443 APPLICATIONS WITHDRAWN 0 $0 183 $251,269 876 $257,989 120 $197,036 0 $0 49 $240,580 0 $0 FILES CLOSED FOR INCOMPLETENESS 0 $0 60 $223,181 240 $272,241 23 $144,204 0 $0 13 $187,383 0 $0
Aggregated Statistics For Year 2004(Based on 6 full and 10 partial tracts) A) FHA, FSA/RHS & VA B) Conventional C) Refinancings D) Home Improvement Loans E) Loans on Dwellings For 5+ Families F) Non-occupant Loans on G) Loans On Manufactured Number Average Value Number Average Value Number Average Value Number Average Value Number Average Value Number Average Value Number Average Value
LOANS ORIGINATED 13 $286,700 987 $212,646 2,675 $219,520 353 $146,803 14 $1,532,488 226 $207,263 4 $32,432 APPLICATIONS APPROVED, NOT ACCEPTED 2 $237,845 173 $224,272 500 $209,236 85 $127,127 0 $0 34 $189,907 2 $46,065 APPLICATIONS DENIED 0 $0 268 $216,851 1,002 $222,500 232 $130,583 0 $0 74 $209,873 2 $94,370 APPLICATIONS WITHDRAWN 2 $195,640 156 $230,226 1,069 $217,506 109 $132,577 2 $397,620 54 $218,710 0 $0 FILES CLOSED FOR INCOMPLETENESS 2 $197,625 35 $207,295 199 $219,182 41 $126,654 0 $0 11 $236,789 0 $0
Aggregated Statistics For Year 2003(Based on 6 full and 10 partial tracts) A) FHA, FSA/RHS & VA B) Conventional C) Refinancings D) Home Improvement Loans E) Loans on Dwellings For 5+ Families F) Non-occupant Loans on Number Average Value Number Average Value Number Average Value Number Average Value Number Average Value Number Average Value
LOANS ORIGINATED 79 $240,736 812 $180,655 3,772 $170,874 161 $55,019 24 $1,080,814 233 $157,700 APPLICATIONS APPROVED, NOT ACCEPTED 2 $327,320 129 $212,468 604 $171,502 46 $89,822 0 $0 65 $175,157 APPLICATIONS DENIED 12 $217,295 181 $170,082 1,024 $168,216 133 $47,781 0 $0 56 $184,582 APPLICATIONS WITHDRAWN 19 $225,868 112 $202,743 998 $230,737 63 $59,851 0 $0 37 $157,659 FILES CLOSED FOR INCOMPLETENESS 5 $222,774 26 $225,386 215 $171,902 14 $49,382 0 $0 13 $130,171
Aggregated Statistics For Year 2002(Based on 2 full and 10 partial tracts) A) FHA, FSA/RHS & VA B) Conventional C) Refinancings D) Home Improvement Loans E) Loans on Dwellings For 5+ Families F) Non-occupant Loans on Number Average Value Number Average Value Number Average Value Number Average Value Number Average Value Number Average Value
LOANS ORIGINATED 148 $211,210 516 $154,240 2,017 $157,560 87 $38,156 6 $1,170,210 126 $142,446 APPLICATIONS APPROVED, NOT ACCEPTED 13 $184,524 64 $190,837 325 $147,745 35 $24,656 1 $88,540 12 $134,228 APPLICATIONS DENIED 11 $154,837 84 $146,055 663 $153,042 80 $50,420 0 $0 25 $152,019 APPLICATIONS WITHDRAWN 20 $181,126 65 $142,638 666 $163,137 48 $55,241 0 $0 20 $130,762 FILES CLOSED FOR INCOMPLETENESS 11 $190,605 18 $214,190 182 $173,030 2 $60,105 2 $456,320 3 $91,253
Aggregated Statistics For Year 2001(Based on 2 full and 10 partial tracts) A) FHA, FSA/RHS & VA B) Conventional C) Refinancings D) Home Improvement Loans E) Loans on Dwellings For 5+ Families F) Non-occupant Loans on Number Average Value Number Average Value Number Average Value Number Average Value Number Average Value Number Average Value
LOANS ORIGINATED 263 $186,857 398 $133,924 1,353 $142,779 75 $25,603 10 $609,245 102 $142,475 APPLICATIONS APPROVED, NOT ACCEPTED 11 $187,733 49 $120,183 237 $135,028 18 $25,853 0 $0 14 $133,998 APPLICATIONS DENIED 48 $186,005 101 $129,525 699 $133,098 82 $27,626 1 $1,311,030 41 $122,788 APPLICATIONS WITHDRAWN 30 $173,111 61 $140,592 511 $146,019 57 $31,085 0 $0 24 $145,525 FILES CLOSED FOR INCOMPLETENESS 15 $181,827 13 $162,896 126 $144,459 2 $59,585 1 $804,900 8 $149,921
Aggregated Statistics For Year 2000(Based on 2 full and 10 partial tracts) A) FHA, FSA/RHS & VA B) Conventional C) Refinancings D) Home Improvement Loans E) Loans on Dwellings For 5+ Families F) Non-occupant Loans on Number Average Value Number Average Value Number Average Value Number Average Value Number Average Value Number Average Value
LOANS ORIGINATED 188 $168,045 259 $122,113 434 $111,313 67 $30,640 13 $506,060 46 $107,973 APPLICATIONS APPROVED, NOT ACCEPTED 15 $171,103 27 $133,819 123 $117,537 56 $24,899 0 $0 6 $130,127 APPLICATIONS DENIED 40 $182,038 108 $112,354 350 $120,878 83 $23,715 1 $422,840 16 $126,944 APPLICATIONS WITHDRAWN 30 $165,132 59 $119,803 174 $102,774 21 $22,874 0 $0 7 $133,300 FILES CLOSED FOR INCOMPLETENESS 6 $192,290 8 $178,494 98 $136,143 2 $33,580 0 $0 6 $155,153
Aggregated Statistics For Year 1999(Based on 2 full and 5 partial tracts) A) FHA, FSA/RHS & VA B) Conventional C) Refinancings D) Home Improvement Loans E) Loans on Dwellings For 5+ Families F) Non-occupant Loans on Number Average Value Number Average Value Number Average Value Number Average Value Number Average Value Number Average Value
LOANS ORIGINATED 176 $152,733 127 $115,118 397 $115,396 66 $16,357 10 $722,988 39 $98,609 APPLICATIONS APPROVED, NOT ACCEPTED 9 $149,941 17 $114,185 94 $110,250 32 $25,316 0 $0 9 $81,399 APPLICATIONS DENIED 26 $152,334 50 $121,457 253 $107,079 49 $23,329 1 $215,580 13 $85,737 APPLICATIONS WITHDRAWN 28 $141,552 34 $108,502 165 $114,788 10 $16,669 0 $0 10 $103,877 FILES CLOSED FOR INCOMPLETENESS 5 $124,320 9 $81,171 86 $127,394 2 $34,770 2 $917,155 3 $91,000
Private Mortgage Insurance Companies Aggregated Statistics For Year 2009(Based on 6 full and 10 partial tracts) A) Conventional B) Refinancings Number Average Value Number Average Value
LOANS ORIGINATED 38 $261,815 5 $278,692 APPLICATIONS APPROVED, NOT ACCEPTED 18 $306,034 2 $314,430 APPLICATIONS DENIED 10 $377,913 1 $313,480 APPLICATIONS WITHDRAWN 0 $0 0 $0 FILES CLOSED FOR INCOMPLETENESS 2 $275,965 0 $0
Aggregated Statistics For Year 2008(Based on 6 full and 10 partial tracts) A) Conventional B) Refinancings C) Non-occupant Loans on Number Average Value Number Average Value Number Average Value
LOANS ORIGINATED 86 $340,257 35 $396,564 2 $275,560 APPLICATIONS APPROVED, NOT ACCEPTED 58 $367,401 34 $421,871 4 $364,525 APPLICATIONS DENIED 25 $327,385 15 $323,451 14 $323,710 APPLICATIONS WITHDRAWN 3 $303,997 5 $324,236 1 $175,430 FILES CLOSED FOR INCOMPLETENESS 4 $401,060 0 $0 0 $0
Aggregated Statistics For Year 2007(Based on 6 full and 10 partial tracts) A) Conventional B) Refinancings C) Non-occupant Loans on Number Average Value Number Average Value Number Average Value
LOANS ORIGINATED 50 $414,625 35 $441,136 0 $0 APPLICATIONS APPROVED, NOT ACCEPTED 8 $467,876 16 $420,162 0 $0 APPLICATIONS DENIED 2 $366,640 10 $423,206 2 $402,205 APPLICATIONS WITHDRAWN 0 $0 5 $495,620 0 $0 FILES CLOSED FOR INCOMPLETENESS 2 $366,640 2 $402,205 0 $0
Aggregated Statistics For Year 2006(Based on 6 full and 10 partial tracts) A) Conventional B) Refinancings C) Non-occupant Loans on Number Average Value Number Average Value Number Average Value
LOANS ORIGINATED 13 $393,545 26 $434,933 1 $177,080 APPLICATIONS APPROVED, NOT ACCEPTED 1 $281,270 7 $392,007 0 $0 APPLICATIONS DENIED 4 $491,585 2 $449,775 0 $0 APPLICATIONS WITHDRAWN 0 $0 0 $0 0 $0 FILES CLOSED FOR INCOMPLETENESS 0 $0 0 $0 0 $0
Aggregated Statistics For Year 2005(Based on 4 full and 10 partial tracts) A) Conventional B) Refinancings C) Non-occupant Loans on Number Average Value Number Average Value Number Average Value
LOANS ORIGINATED 8 $350,622 29 $372,487 0 $0 APPLICATIONS APPROVED, NOT ACCEPTED 6 $376,720 13 $331,375 2 $313,845 APPLICATIONS DENIED 0 $0 0 $0 0 $0 APPLICATIONS WITHDRAWN 0 $0 2 $389,210 0 $0 FILES CLOSED FOR INCOMPLETENESS 0 $0 0 $0 0 $0
Aggregated Statistics For Year 2004(Based on 4 full and 10 partial tracts) A) Conventional B) Refinancings C) Non-occupant Loans on Number Average Value Number Average Value Number Average Value
LOANS ORIGINATED 54 $290,123 28 $273,962 5 $255,260 APPLICATIONS APPROVED, NOT ACCEPTED 31 $261,518 15 $220,653 3 $210,613 APPLICATIONS DENIED 2 $297,850 2 $334,675 0 $0 APPLICATIONS WITHDRAWN 6 $217,888 0 $0 0 $0 FILES CLOSED FOR INCOMPLETENESS 0 $0 2 $59,970 0 $0
Aggregated Statistics For Year 2003(Based on 6 full and 10 partial tracts) A) Conventional B) Refinancings C) Non-occupant Loans on Number Average Value Number Average Value Number Average Value
LOANS ORIGINATED 139 $246,786 108 $213,352 2 $184,260 APPLICATIONS APPROVED, NOT ACCEPTED 50 $205,923 32 $217,282 2 $208,745 APPLICATIONS DENIED 1 $139,520 2 $207,560 0 $0 APPLICATIONS WITHDRAWN 7 $220,446 16 $241,028 2 $206,895 FILES CLOSED FOR INCOMPLETENESS 0 $0 0 $0 0 $0
Aggregated Statistics For Year 2002(Based on 2 full and 10 partial tracts) A) Conventional B) Refinancings C) Non-occupant Loans on Number Average Value Number Average Value Number Average Value
LOANS ORIGINATED 132 $206,206 123 $200,480 5 $178,938 APPLICATIONS APPROVED, NOT ACCEPTED 24 $198,247 45 $193,102 2 $152,295 APPLICATIONS DENIED 1 $245,780 0 $0 0 $0 APPLICATIONS WITHDRAWN 2 $230,475 6 $221,750 0 $0 FILES CLOSED FOR INCOMPLETENESS 0 $0 0 $0 0 $0
Aggregated Statistics For Year 2001(Based on 2 full and 10 partial tracts) A) Conventional B) Refinancings C) Non-occupant Loans on Number Average Value Number Average Value Number Average Value
LOANS ORIGINATED 111 $180,564 119 $173,361 0 $0 APPLICATIONS APPROVED, NOT ACCEPTED 38 $165,907 61 $168,224 4 $207,922 APPLICATIONS DENIED 4 $180,770 13 $195,455 0 $0 APPLICATIONS WITHDRAWN 2 $233,025 1 $102,770 0 $0 FILES CLOSED FOR INCOMPLETENESS 0 $0 2 $182,165 0 $0
Aggregated Statistics For Year 2000(Based on 2 full and 10 partial tracts) A) Conventional B) Refinancings C) Non-occupant Loans on Number Average Value Number Average Value Number Average Value
LOANS ORIGINATED 87 $167,876 48 $149,221 4 $116,812 APPLICATIONS APPROVED, NOT ACCEPTED 17 $153,806 24 $159,606 1 $51,510 APPLICATIONS DENIED 4 $152,570 15 $174,547 0 $0 APPLICATIONS WITHDRAWN 1 $137,890 2 $164,520 0 $0 FILES CLOSED FOR INCOMPLETENESS 0 $0 0 $0 0 $0
Aggregated Statistics For Year 1999(Based on 2 full and 5 partial tracts) A) Conventional B) Refinancings C) Non-occupant Loans on Number Average Value Number Average Value Number Average Value
LOANS ORIGINATED 41 $157,575 72 $151,066 3 $141,687 APPLICATIONS APPROVED, NOT ACCEPTED 6 $148,458 17 $146,859 0 $0 APPLICATIONS DENIED 4 $152,330 2 $184,695 0 $0 APPLICATIONS WITHDRAWN 1 $186,030 5 $166,180 0 $0 FILES CLOSED FOR INCOMPLETENESS 2 $165,225 0 $0 0 $0
Most common first names in zip code 90606 among deceased individuals Name Count Lived (average)
Mary 128 77.9 years John 127 71.8 years William 105 74.1 years Robert 96 70.2 years Maria 81 80.2 years Charles 72 75.1 years George 72 74.3 years James 69 74.5 years Frank 67 75.2 years Joseph 58 76.3 years
Most common last names in zip code 90606 among deceased individuals Last name Count Lived (average)
Garcia 67 73.3 years Lopez 48 74.8 years Martinez 47 72.4 years Rodriguez 41 73.1 years Johnson 38 79.5 years Hernandez 36 70.7 years Sanchez 35 73.2 years Smith 35 75.5 years Gonzales 31 77.4 years Morales 28 74.4 years
Businesses in zip code 90606
Name Count Name Count
7-Eleven 3 Kroger 1 AT&T 1 McDonald's 1 Burger King 1 Motel 6 1 Carl\s Jr. 2 Nike 2 Dennys 1 Papa John's Pizza 1 El Pollo Loco 1 Rite Aid 1 Firestone Complete Auto Care 1 Starbucks 1 GNC 1 Taco Bell 1 Home Depot 1 U-Haul 1 IHOP 1 UPS 1 Jack In The Box 1 Vans 1 Jones New York 1 Verizon Wireless 2


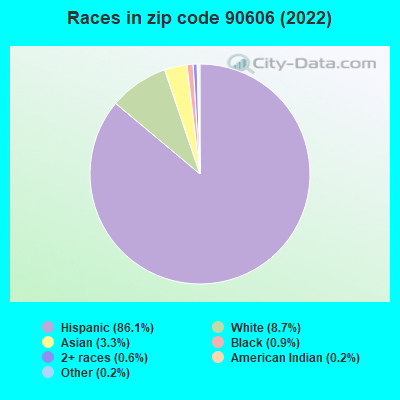


 Nearest zip codes: 90660, 90670, 90602, 90601, 90605, 90240.