Estimated zip code population in 2022: 41,083
Zip code population in 2010: 40,331
Zip code population in 2000: 38,180
Houses and condos: 11,581
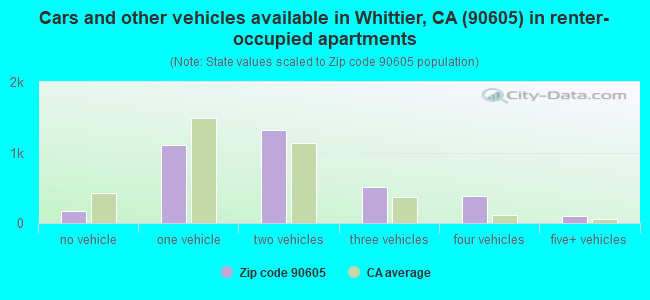
Renter-occupied apartments: 3,598
% of renters here:
32%State:
44%
March 2022 cost of living index in zip code 90605: 132.3
(high, U.S. average is 100)
Land area: 5.7
sq. mi.
Water area: 0.0
sq. mi.
Population density: 7,269 people per square mile (high).
OSM Map
General Map
Google Map
MSN Map
OSM Map
General Map
Google Map
MSN Map
OSM Map
General Map
Google Map
MSN Map
OSM Map
General Map
Google Map
MSN Map
Please wait while loading the map...
Real estate property taxes paid for housing units in 2022:
This zip code:
0.6% ($4,212)California:
0.7% ($4,831)
Median real estate property taxes paid for housing units with mortgages in 2022: $4,721 (0.7%)
Median real estate property taxes paid for housing units with no mortgage in 2022: $3,339 (0.5%)
Profiles of local businesses
Business Search - 14 Million verified businesses
Males: 20,681 Females: 20,401
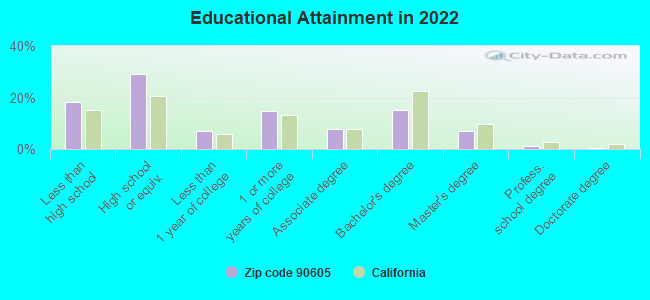
For population 25 years and over in 90605:
High school or higher: 81.4%Bachelor's degree or higher: 23.3%Graduate or professional degree: 8.4%Unemployed: 4.4%Mean travel time to work (commute): 32.3 minutes
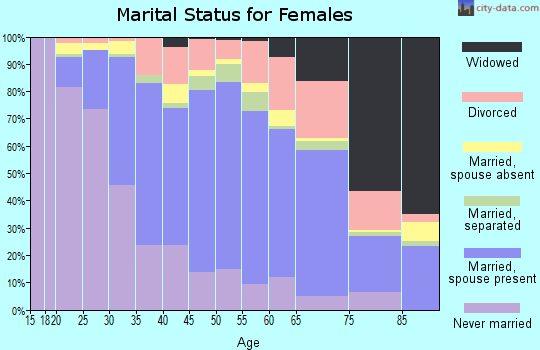
For population 15 years and over in 90605:
Never married: 39.3%Now married: 47.8%Separated: 1.6%Widowed: 4.2%Divorced: 7.1%
Zip code 90605 compared to state average:
Black race population percentage significantly below state average. Hispanic race population percentage above state average. Length of stay since moving in significantly above state average. Percentage of population with a bachelor's degree or higher below state average. 31,387 76.4% Hispanic or Latino 5,566 13.5% White 2,568 6.3% Asian 575 1.4% Some other race 389 0.9% Black 281 0.7% Two or more races 171 0.4% Native Hawaiian and Other 142 0.3% American Indian
Data:
Median household income ($)
Median household income (% change since 2000)
Household income diversity
Ratio of average income to average house value (%)
Ratio of average income to average rent
Median household income ($) - White
Median household income ($) - Black or African American
Median household income ($) - Asian
Median household income ($) - Hispanic or Latino
Median household income ($) - American Indian and Alaska Native
Median household income ($) - Multirace
Median household income ($) - Other Race
Median household income for houses/condos with a mortgage ($)
Median household income for apartments without a mortgage ($)
Races - White alone (%)
Races - White alone (% change since 2000)
Races - Black alone (%)
Races - Black alone (% change since 2000)
Races - American Indian alone (%)
Races - American Indian alone (% change since 2000)
Races - Asian alone (%)
Races - Asian alone (% change since 2000)
Races - Hispanic (%)
Races - Hispanic (% change since 2000)
Races - Native Hawaiian and Other Pacific Islander alone (%)
Races - Native Hawaiian and Other Pacific Islander alone (% change since 2000)
Races - Two or more races (%)
Races - Two or more races (% change since 2000)
Races - Other race alone (%)
Races - Other race alone (% change since 2000)
Racial diversity
Unemployment (%)
Unemployment (% change since 2000)
Unemployment (%) - White
Unemployment (%) - Black or African American
Unemployment (%) - Asian
Unemployment (%) - Hispanic or Latino
Unemployment (%) - American Indian and Alaska Native
Unemployment (%) - Multirace
Unemployment (%) - Other Race
Population density (people per square mile)
Population - Males (%)
Population - Females (%)
Population - Males (%) - White
Population - Males (%) - Black or African American
Population - Males (%) - Asian
Population - Males (%) - Hispanic or Latino
Population - Males (%) - American Indian and Alaska Native
Population - Males (%) - Multirace
Population - Males (%) - Other Race
Population - Females (%) - White
Population - Females (%) - Black or African American
Population - Females (%) - Asian
Population - Females (%) - Hispanic or Latino
Population - Females (%) - American Indian and Alaska Native
Population - Females (%) - Multirace
Population - Females (%) - Other Race
Coronavirus confirmed cases (Apr 27, 2024)
Deaths caused by coronavirus (Apr 27, 2024)
Coronavirus confirmed cases (per 100k population) (Apr 27, 2024)
Deaths caused by coronavirus (per 100k population) (Apr 27, 2024)
Daily increase in number of cases (Apr 27, 2024)
Weekly increase in number of cases (Apr 27, 2024)
Cases doubled (in days) (Apr 27, 2024)
Hospitalized patients (Apr 18, 2022)
Negative test results (Apr 18, 2022)
Total test results (Apr 18, 2022)
COVID Vaccine doses distributed (per 100k population) (Sep 19, 2023)
COVID Vaccine doses administered (per 100k population) (Sep 19, 2023)
COVID Vaccine doses distributed (Sep 19, 2023)
COVID Vaccine doses administered (Sep 19, 2023)
Likely homosexual households (%)
Likely homosexual households (% change since 2000)
Likely homosexual households - Lesbian couples (%)
Likely homosexual households - Lesbian couples (% change since 2000)
Likely homosexual households - Gay men (%)
Likely homosexual households - Gay men (% change since 2000)
Cost of living index
Median gross rent ($)
Median contract rent ($)
Median monthly housing costs ($)
Median house or condo value ($)
Median house or condo value ($ change since 2000)
Mean house or condo value by units in structure - 1, detached ($)
Mean house or condo value by units in structure - 1, attached ($)
Mean house or condo value by units in structure - 2 ($)
Mean house or condo value by units in structure by units in structure - 3 or 4 ($)
Mean house or condo value by units in structure - 5 or more ($)
Mean house or condo value by units in structure - Boat, RV, van, etc. ($)
Mean house or condo value by units in structure - Mobile home ($)
Median house or condo value ($) - White
Median house or condo value ($) - Black or African American
Median house or condo value ($) - Asian
Median house or condo value ($) - Hispanic or Latino
Median house or condo value ($) - American Indian and Alaska Native
Median house or condo value ($) - Multirace
Median house or condo value ($) - Other Race
Median resident age
Resident age diversity
Median resident age - Males
Median resident age - Females
Median resident age - White
Median resident age - Black or African American
Median resident age - Asian
Median resident age - Hispanic or Latino
Median resident age - American Indian and Alaska Native
Median resident age - Multirace
Median resident age - Other Race
Median resident age - Males - White
Median resident age - Males - Black or African American
Median resident age - Males - Asian
Median resident age - Males - Hispanic or Latino
Median resident age - Males - American Indian and Alaska Native
Median resident age - Males - Multirace
Median resident age - Males - Other Race
Median resident age - Females - White
Median resident age - Females - Black or African American
Median resident age - Females - Asian
Median resident age - Females - Hispanic or Latino
Median resident age - Females - American Indian and Alaska Native
Median resident age - Females - Multirace
Median resident age - Females - Other Race
Commute - mean travel time to work (minutes)
Travel time to work - Less than 5 minutes (%)
Travel time to work - Less than 5 minutes (% change since 2000)
Travel time to work - 5 to 9 minutes (%)
Travel time to work - 5 to 9 minutes (% change since 2000)
Travel time to work - 10 to 19 minutes (%)
Travel time to work - 10 to 19 minutes (% change since 2000)
Travel time to work - 20 to 29 minutes (%)
Travel time to work - 20 to 29 minutes (% change since 2000)
Travel time to work - 30 to 39 minutes (%)
Travel time to work - 30 to 39 minutes (% change since 2000)
Travel time to work - 40 to 59 minutes (%)
Travel time to work - 40 to 59 minutes (% change since 2000)
Travel time to work - 60 to 89 minutes (%)
Travel time to work - 60 to 89 minutes (% change since 2000)
Travel time to work - 90 or more minutes (%)
Travel time to work - 90 or more minutes (% change since 2000)
Marital status - Never married (%)
Marital status - Now married (%)
Marital status - Separated (%)
Marital status - Widowed (%)
Marital status - Divorced (%)
Median family income ($)
Median family income (% change since 2000)
Median non-family income ($)
Median non-family income (% change since 2000)
Median per capita income ($)
Median per capita income (% change since 2000)
Median family income ($) - White
Median family income ($) - Black or African American
Median family income ($) - Asian
Median family income ($) - Hispanic or Latino
Median family income ($) - American Indian and Alaska Native
Median family income ($) - Multirace
Median family income ($) - Other Race
Median year house/condo built
Median year apartment built
Year house built - Built 2005 or later (%)
Year house built - Built 2000 to 2004 (%)
Year house built - Built 1990 to 1999 (%)
Year house built - Built 1980 to 1989 (%)
Year house built - Built 1970 to 1979 (%)
Year house built - Built 1960 to 1969 (%)
Year house built - Built 1950 to 1959 (%)
Year house built - Built 1940 to 1949 (%)
Year house built - Built 1939 or earlier (%)
Average household size
Household density (households per square mile)
Average household size - White
Average household size - Black or African American
Average household size - Asian
Average household size - Hispanic or Latino
Average household size - American Indian and Alaska Native
Average household size - Multirace
Average household size - Other Race
Occupied housing units (%)
Vacant housing units (%)
Owner occupied housing units (%)
Renter occupied housing units (%)
Vacancy status - For rent (%)
Vacancy status - For sale only (%)
Vacancy status - Rented or sold, not occupied (%)
Vacancy status - For seasonal, recreational, or occasional use (%)
Vacancy status - For migrant workers (%)
Vacancy status - Other vacant (%)
Residents with income below the poverty level (%)
Residents with income below 50% of the poverty level (%)
Children below poverty level (%)
Poor families by family type - Married-couple family (%)
Poor families by family type - Male, no wife present (%)
Poor families by family type - Female, no husband present (%)
Poverty status for native-born residents (%)
Poverty status for foreign-born residents (%)
Poverty among high school graduates not in families (%)
Poverty among people who did not graduate high school not in families (%)
Residents with income below the poverty level (%) - White
Residents with income below the poverty level (%) - Black or African American
Residents with income below the poverty level (%) - Asian
Residents with income below the poverty level (%) - Hispanic or Latino
Residents with income below the poverty level (%) - American Indian and Alaska Native
Residents with income below the poverty level (%) - Multirace
Residents with income below the poverty level (%) - Other Race
Air pollution - Air Quality Index (AQI)
Air pollution - CO
Air pollution - NO2
Air pollution - SO2
Air pollution - Ozone
Air pollution - PM10
Air pollution - PM25
Air pollution - Pb
Crime - Murders per 100,000 population
Crime - Rapes per 100,000 population
Crime - Robberies per 100,000 population
Crime - Assaults per 100,000 population
Crime - Burglaries per 100,000 population
Crime - Thefts per 100,000 population
Crime - Auto thefts per 100,000 population
Crime - Arson per 100,000 population
Crime - City-data.com crime index
Crime - Violent crime index
Crime - Property crime index
Crime - Murders per 100,000 population (5 year average)
Crime - Rapes per 100,000 population (5 year average)
Crime - Robberies per 100,000 population (5 year average)
Crime - Assaults per 100,000 population (5 year average)
Crime - Burglaries per 100,000 population (5 year average)
Crime - Thefts per 100,000 population (5 year average)
Crime - Auto thefts per 100,000 population (5 year average)
Crime - Arson per 100,000 population (5 year average)
Crime - City-data.com crime index (5 year average)
Crime - Violent crime index (5 year average)
Crime - Property crime index (5 year average)
1996 Presidential Elections Results (%) - Democratic Party (Clinton)
1996 Presidential Elections Results (%) - Republican Party (Dole)
1996 Presidential Elections Results (%) - Other
2000 Presidential Elections Results (%) - Democratic Party (Gore)
2000 Presidential Elections Results (%) - Republican Party (Bush)
2000 Presidential Elections Results (%) - Other
2004 Presidential Elections Results (%) - Democratic Party (Kerry)
2004 Presidential Elections Results (%) - Republican Party (Bush)
2004 Presidential Elections Results (%) - Other
2008 Presidential Elections Results (%) - Democratic Party (Obama)
2008 Presidential Elections Results (%) - Republican Party (McCain)
2008 Presidential Elections Results (%) - Other
2012 Presidential Elections Results (%) - Democratic Party (Obama)
2012 Presidential Elections Results (%) - Republican Party (Romney)
2012 Presidential Elections Results (%) - Other
2016 Presidential Elections Results (%) - Democratic Party (Clinton)
2016 Presidential Elections Results (%) - Republican Party (Trump)
2016 Presidential Elections Results (%) - Other
2020 Presidential Elections Results (%) - Democratic Party (Biden)
2020 Presidential Elections Results (%) - Republican Party (Trump)
2020 Presidential Elections Results (%) - Other
Ancestries Reported - Arab (%)
Ancestries Reported - Czech (%)
Ancestries Reported - Danish (%)
Ancestries Reported - Dutch (%)
Ancestries Reported - English (%)
Ancestries Reported - French (%)
Ancestries Reported - French Canadian (%)
Ancestries Reported - German (%)
Ancestries Reported - Greek (%)
Ancestries Reported - Hungarian (%)
Ancestries Reported - Irish (%)
Ancestries Reported - Italian (%)
Ancestries Reported - Lithuanian (%)
Ancestries Reported - Norwegian (%)
Ancestries Reported - Polish (%)
Ancestries Reported - Portuguese (%)
Ancestries Reported - Russian (%)
Ancestries Reported - Scotch-Irish (%)
Ancestries Reported - Scottish (%)
Ancestries Reported - Slovak (%)
Ancestries Reported - Subsaharan African (%)
Ancestries Reported - Swedish (%)
Ancestries Reported - Swiss (%)
Ancestries Reported - Ukrainian (%)
Ancestries Reported - United States (%)
Ancestries Reported - Welsh (%)
Ancestries Reported - West Indian (%)
Ancestries Reported - Other (%)
Educational Attainment - No schooling completed (%)
Educational Attainment - Less than high school (%)
Educational Attainment - High school or equivalent (%)
Educational Attainment - Less than 1 year of college (%)
Educational Attainment - 1 or more years of college (%)
Educational Attainment - Associate degree (%)
Educational Attainment - Bachelor's degree (%)
Educational Attainment - Master's degree (%)
Educational Attainment - Professional school degree (%)
Educational Attainment - Doctorate degree (%)
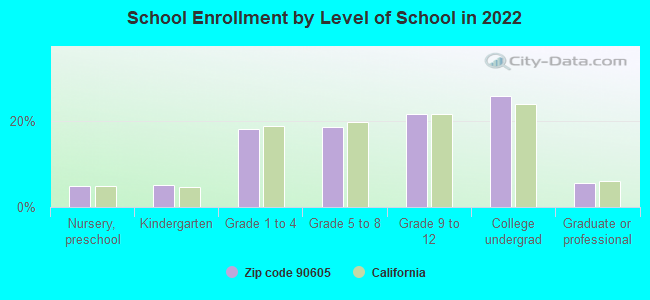
School Enrollment - Nursery, preschool (%)
School Enrollment - Kindergarten (%)
School Enrollment - Grade 1 to 4 (%)
School Enrollment - Grade 5 to 8 (%)
School Enrollment - Grade 9 to 12 (%)
School Enrollment - College undergrad (%)
School Enrollment - Graduate or professional (%)
School Enrollment - Not enrolled in school (%)
School enrollment - Public schools (%)
School enrollment - Private schools (%)
School enrollment - Not enrolled (%)
Median number of rooms in houses and condos
Median number of rooms in apartments
Housing units lacking complete plumbing facilities (%)
Housing units lacking complete kitchen facilities (%)
Density of houses
Urban houses (%)
Rural houses (%)
Households with people 60 years and over (%)
Households with people 65 years and over (%)
Households with people 75 years and over (%)
Households with one or more nonrelatives (%)
Households with no nonrelatives (%)
Population in households (%)
Family households (%)
Nonfamily households (%)
Population in families (%)
Family households with own children (%)
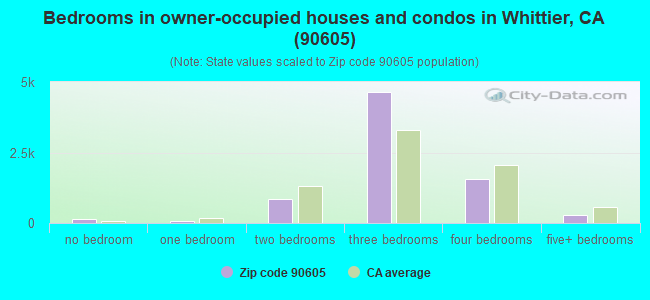
Median number of bedrooms in owner occupied houses
Mean number of bedrooms in owner occupied houses
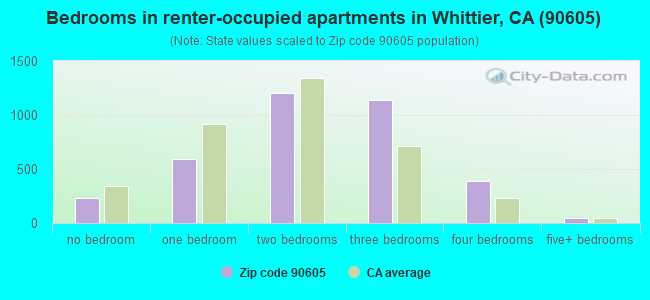
Median number of bedrooms in renter occupied houses
Mean number of bedrooms in renter occupied houses
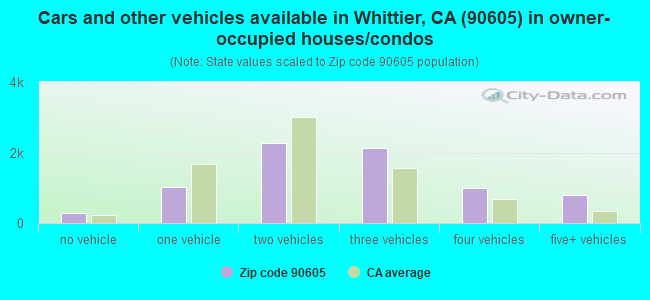
Median number of vehichles in owner occupied houses
Mean number of vehichles in owner occupied houses
Median number of vehichles in renter occupied houses
Mean number of vehichles in renter occupied houses
Mortgage status - with mortgage (%)
Mortgage status - with second mortgage (%)
Mortgage status - with home equity loan (%)
Mortgage status - with both second mortgage and home equity loan (%)
Mortgage status - without a mortgage (%)
Average family size
Average family size - White
Average family size - Black or African American
Average family size - Asian
Average family size - Hispanic or Latino
Average family size - American Indian and Alaska Native
Average family size - Multirace
Average family size - Other Race
Geographical mobility - Same house 1 year ago (%)
Geographical mobility - Moved within same county (%)
Geographical mobility - Moved from different county within same state (%)
Geographical mobility - Moved from different state (%)
Geographical mobility - Moved from abroad (%)
Place of birth - Born in state of residence (%)
Place of birth - Born in other state (%)
Place of birth - Native, outside of US (%)
Place of birth - Foreign born (%)
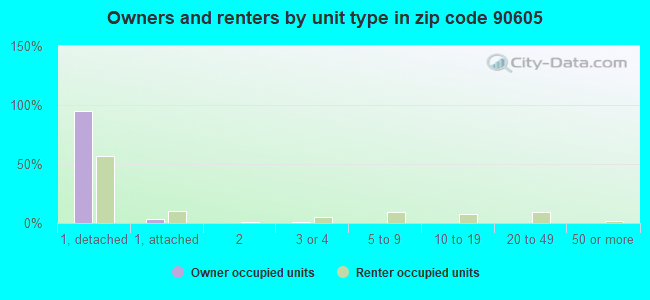
Housing units in structures - 1, detached (%)
Housing units in structures - 1, attached (%)
Housing units in structures - 2 (%)
Housing units in structures - 3 or 4 (%)
Housing units in structures - 5 to 9 (%)
Housing units in structures - 10 to 19 (%)
Housing units in structures - 20 to 49 (%)
Housing units in structures - 50 or more (%)
Housing units in structures - Mobile home (%)
Housing units in structures - Boat, RV, van, etc. (%)
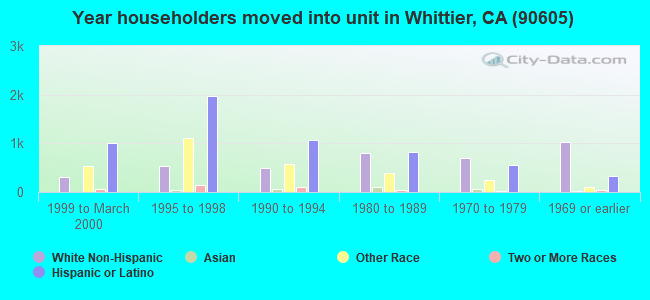
House/condo owner moved in on average (years ago)
Renter moved in on average (years ago)
Year householder moved into unit - Moved in 1999 to March 2000 (%)
Year householder moved into unit - Moved in 1995 to 1998 (%)
Year householder moved into unit - Moved in 1990 to 1994 (%)
Year householder moved into unit - Moved in 1980 to 1989 (%)
Year householder moved into unit - Moved in 1970 to 1979 (%)
Year householder moved into unit - Moved in 1969 or earlier (%)
Means of transportation to work - Drove car alone (%)
Means of transportation to work - Carpooled (%)
Means of transportation to work - Public transportation (%)
Means of transportation to work - Bus or trolley bus (%)
Means of transportation to work - Streetcar or trolley car (%)
Means of transportation to work - Subway or elevated (%)
Means of transportation to work - Railroad (%)
Means of transportation to work - Ferryboat (%)
Means of transportation to work - Taxicab (%)
Means of transportation to work - Motorcycle (%)
Means of transportation to work - Bicycle (%)
Means of transportation to work - Walked (%)
Means of transportation to work - Other means (%)
Working at home (%)
Industry diversity
Most Common Industries - Agriculture, forestry, fishing and hunting, and mining (%)
Most Common Industries - Agriculture, forestry, fishing and hunting (%)
Most Common Industries - Mining, quarrying, and oil and gas extraction (%)
Most Common Industries - Construction (%)
Most Common Industries - Manufacturing (%)
Most Common Industries - Wholesale trade (%)
Most Common Industries - Retail trade (%)
Most Common Industries - Transportation and warehousing, and utilities (%)
Most Common Industries - Transportation and warehousing (%)
Most Common Industries - Utilities (%)
Most Common Industries - Information (%)
Most Common Industries - Finance and insurance, and real estate and rental and leasing (%)
Most Common Industries - Finance and insurance (%)
Most Common Industries - Real estate and rental and leasing (%)
Most Common Industries - Professional, scientific, and management, and administrative and waste management services (%)
Most Common Industries - Professional, scientific, and technical services (%)
Most Common Industries - Management of companies and enterprises (%)
Most Common Industries - Administrative and support and waste management services (%)
Most Common Industries - Educational services, and health care and social assistance (%)
Most Common Industries - Educational services (%)
Most Common Industries - Health care and social assistance (%)
Most Common Industries - Arts, entertainment, and recreation, and accommodation and food services (%)
Most Common Industries - Arts, entertainment, and recreation (%)
Most Common Industries - Accommodation and food services (%)
Most Common Industries - Other services, except public administration (%)
Most Common Industries - Public administration (%)
Occupation diversity
Most Common Occupations - Management, business, science, and arts occupations (%)
Most Common Occupations - Management, business, and financial occupations (%)
Most Common Occupations - Management occupations (%)
Most Common Occupations - Business and financial operations occupations (%)
Most Common Occupations - Computer, engineering, and science occupations (%)
Most Common Occupations - Computer and mathematical occupations (%)
Most Common Occupations - Architecture and engineering occupations (%)
Most Common Occupations - Life, physical, and social science occupations (%)
Most Common Occupations - Education, legal, community service, arts, and media occupations (%)
Most Common Occupations - Community and social service occupations (%)
Most Common Occupations - Legal occupations (%)
Most Common Occupations - Education, training, and library occupations (%)
Most Common Occupations - Arts, design, entertainment, sports, and media occupations (%)
Most Common Occupations - Healthcare practitioners and technical occupations (%)
Most Common Occupations - Health diagnosing and treating practitioners and other technical occupations (%)
Most Common Occupations - Health technologists and technicians (%)
Most Common Occupations - Service occupations (%)
Most Common Occupations - Healthcare support occupations (%)
Most Common Occupations - Protective service occupations (%)
Most Common Occupations - Fire fighting and prevention, and other protective service workers including supervisors (%)
Most Common Occupations - Law enforcement workers including supervisors (%)
Most Common Occupations - Food preparation and serving related occupations (%)
Most Common Occupations - Building and grounds cleaning and maintenance occupations (%)
Most Common Occupations - Personal care and service occupations (%)
Most Common Occupations - Sales and office occupations (%)
Most Common Occupations - Sales and related occupations (%)
Most Common Occupations - Office and administrative support occupations (%)
Most Common Occupations - Natural resources, construction, and maintenance occupations (%)
Most Common Occupations - Farming, fishing, and forestry occupations (%)
Most Common Occupations - Construction and extraction occupations (%)
Most Common Occupations - Installation, maintenance, and repair occupations (%)
Most Common Occupations - Production, transportation, and material moving occupations (%)
Most Common Occupations - Production occupations (%)
Most Common Occupations - Transportation occupations (%)
Most Common Occupations - Material moving occupations (%)
People in Group quarters - Institutionalized population (%)
People in Group quarters - Correctional institutions (%)
People in Group quarters - Federal prisons and detention centers (%)
People in Group quarters - Halfway houses (%)
People in Group quarters - Local jails and other confinement facilities (including police lockups) (%)
People in Group quarters - Military disciplinary barracks (%)
People in Group quarters - State prisons (%)
People in Group quarters - Other types of correctional institutions (%)
People in Group quarters - Nursing homes (%)
People in Group quarters - Hospitals/wards, hospices, and schools for the handicapped (%)
People in Group quarters - Hospitals/wards and hospices for chronically ill (%)
People in Group quarters - Hospices or homes for chronically ill (%)
People in Group quarters - Military hospitals or wards for chronically ill (%)
People in Group quarters - Other hospitals or wards for chronically ill (%)
People in Group quarters - Hospitals or wards for drug/alcohol abuse (%)
People in Group quarters - Mental (Psychiatric) hospitals or wards (%)
People in Group quarters - Schools, hospitals, or wards for the mentally retarded (%)
People in Group quarters - Schools, hospitals, or wards for the physically handicapped (%)
People in Group quarters - Institutions for the deaf (%)
People in Group quarters - Institutions for the blind (%)
People in Group quarters - Orthopedic wards and institutions for the physically handicapped (%)
People in Group quarters - Wards in general hospitals for patients who have no usual home elsewhere (%)
People in Group quarters - Wards in military hospitals for patients who have no usual home elsewhere (%)
People in Group quarters - Juvenile institutions (%)
People in Group quarters - Long-term care (%)
People in Group quarters - Homes for abused, dependent, and neglected children (%)
People in Group quarters - Residential treatment centers for emotionally disturbed children (%)
People in Group quarters - Training schools for juvenile delinquents (%)
People in Group quarters - Short-term care, detention or diagnostic centers for delinquent children (%)
People in Group quarters - Type of juvenile institution unknown (%)
People in Group quarters - Noninstitutionalized population (%)
People in Group quarters - College dormitories (includes college quarters off campus) (%)
People in Group quarters - Military quarters (%)
People in Group quarters - On base (%)
People in Group quarters - Barracks, unaccompanied personnel housing (UPH), (Enlisted/Officer), ;and similar group living quarters for military personnel (%)
People in Group quarters - Transient quarters for temporary residents (%)
People in Group quarters - Military ships (%)
People in Group quarters - Group homes (%)
People in Group quarters - Homes or halfway houses for drug/alcohol abuse (%)
People in Group quarters - Homes for the mentally ill (%)
People in Group quarters - Homes for the mentally retarded (%)
People in Group quarters - Homes for the physically handicapped (%)
People in Group quarters - Other group homes (%)
People in Group quarters - Religious group quarters (%)
People in Group quarters - Dormitories (%)
People in Group quarters - Agriculture workers' dormitories on farms (%)
People in Group quarters - Job Corps and vocational training facilities (%)
People in Group quarters - Other workers' dormitories (%)
People in Group quarters - Crews of maritime vessels (%)
People in Group quarters - Other nonhousehold living situations (%)
People in Group quarters - Other noninstitutional group quarters (%)
Residents speaking English at home (%)
Residents speaking English at home - Born in the United States (%)
Residents speaking English at home - Native, born elsewhere (%)
Residents speaking English at home - Foreign born (%)
Residents speaking Spanish at home (%)
Residents speaking Spanish at home - Born in the United States (%)
Residents speaking Spanish at home - Native, born elsewhere (%)
Residents speaking Spanish at home - Foreign born (%)
Residents speaking other language at home (%)
Residents speaking other language at home - Born in the United States (%)
Residents speaking other language at home - Native, born elsewhere (%)
Residents speaking other language at home - Foreign born (%)
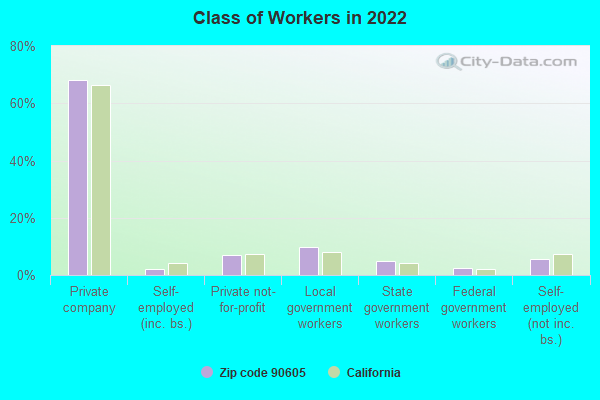
Class of Workers - Employee of private company (%)
Class of Workers - Self-employed in own incorporated business (%)
Class of Workers - Private not-for-profit wage and salary workers (%)
Class of Workers - Local government workers (%)
Class of Workers - State government workers (%)
Class of Workers - Federal government workers (%)
Class of Workers - Self-employed workers in own not incorporated business and Unpaid family workers (%)
House heating fuel used in houses and condos - Utility gas (%)
House heating fuel used in houses and condos - Bottled, tank, or LP gas (%)
House heating fuel used in houses and condos - Electricity (%)
House heating fuel used in houses and condos - Fuel oil, kerosene, etc. (%)
House heating fuel used in houses and condos - Coal or coke (%)
House heating fuel used in houses and condos - Wood (%)
House heating fuel used in houses and condos - Solar energy (%)
House heating fuel used in houses and condos - Other fuel (%)
House heating fuel used in houses and condos - No fuel used (%)
House heating fuel used in apartments - Utility gas (%)
House heating fuel used in apartments - Bottled, tank, or LP gas (%)
House heating fuel used in apartments - Electricity (%)
House heating fuel used in apartments - Fuel oil, kerosene, etc. (%)
House heating fuel used in apartments - Coal or coke (%)
House heating fuel used in apartments - Wood (%)
House heating fuel used in apartments - Solar energy (%)
House heating fuel used in apartments - Other fuel (%)
House heating fuel used in apartments - No fuel used (%)
Armed forces status - In Armed Forces (%)
Armed forces status - Civilian (%)
Armed forces status - Civilian - Veteran (%)
Armed forces status - Civilian - Nonveteran (%)
Fatal accidents locations in years 2005-2021
Fatal accidents locations in 2005
Fatal accidents locations in 2006
Fatal accidents locations in 2007
Fatal accidents locations in 2008
Fatal accidents locations in 2009
Fatal accidents locations in 2010
Fatal accidents locations in 2011
Fatal accidents locations in 2012
Fatal accidents locations in 2013
Fatal accidents locations in 2014
Fatal accidents locations in 2015
Fatal accidents locations in 2016
Fatal accidents locations in 2017
Fatal accidents locations in 2018
Fatal accidents locations in 2019
Fatal accidents locations in 2020
Fatal accidents locations in 2021
Alcohol use - People drinking some alcohol every month (%)
Alcohol use - People not drinking at all (%)
Alcohol use - Average days/month drinking alcohol
Alcohol use - Average drinks/week
Alcohol use - Average days/year people drink much
Audiometry - Average condition of hearing (%)
Audiometry - People that can hear a whisper from across a quiet room (%)
Audiometry - People that can hear normal voice from across a quiet room (%)
Audiometry - Ears ringing, roaring, buzzing (%)
Audiometry - Had a job exposure to loud noise (%)
Audiometry - Had off-work exposure to loud noise (%)
Blood Pressure & Cholesterol - Has high blood pressure (%)
Blood Pressure & Cholesterol - Checking blood pressure at home (%)
Blood Pressure & Cholesterol - Frequently checking blood cholesterol (%)
Blood Pressure & Cholesterol - Has high cholesterol level (%)
Consumer Behavior - Money monthly spent on food at supermarket/grocery store
Consumer Behavior - Money monthly spent on food at other stores
Consumer Behavior - Money monthly spent on eating out
Consumer Behavior - Money monthly spent on carryout/delivered foods
Consumer Behavior - Income spent on food at supermarket/grocery store (%)
Consumer Behavior - Income spent on food at other stores (%)
Consumer Behavior - Income spent on eating out (%)
Consumer Behavior - Income spent on carryout/delivered foods (%)
Current Health Status - General health condition (%)
Current Health Status - Blood donors (%)
Current Health Status - Has blood ever tested for HIV virus (%)
Current Health Status - Left-handed people (%)
Dermatology - People using sunscreen (%)
Diabetes - Diabetics (%)
Diabetes - Had a blood test for high blood sugar (%)
Diabetes - People taking insulin (%)
Diet Behavior & Nutrition - Diet health (%)
Diet Behavior & Nutrition - Milk product consumption (# of products/month)
Diet Behavior & Nutrition - Meals not home prepared (#/week)
Diet Behavior & Nutrition - Meals from fast food or pizza place (#/week)
Diet Behavior & Nutrition - Ready-to-eat foods (#/month)
Diet Behavior & Nutrition - Frozen meals/pizza (#/month)
Drug Use - People that ever used marijuana or hashish (%)
Drug Use - Ever used hard drugs (%)
Drug Use - Ever used any form of cocaine (%)
Drug Use - Ever used heroin (%)
Drug Use - Ever used methamphetamine (%)
Health Insurance - People covered by health insurance (%)
Kidney Conditions-Urology - Avg. # of times urinating at night
Medical Conditions - People with asthma (%)
Medical Conditions - People with anemia (%)
Medical Conditions - People with psoriasis (%)
Medical Conditions - People with overweight (%)
Medical Conditions - Elderly people having difficulties in thinking or remembering (%)
Medical Conditions - People who ever received blood transfusion (%)
Medical Conditions - People having trouble seeing even with glass/contacts (%)
Medical Conditions - People with arthritis (%)
Medical Conditions - People with gout (%)
Medical Conditions - People with congestive heart failure (%)
Medical Conditions - People with coronary heart disease (%)
Medical Conditions - People with angina pectoris (%)
Medical Conditions - People who ever had heart attack (%)
Medical Conditions - People who ever had stroke (%)
Medical Conditions - People with emphysema (%)
Medical Conditions - People with thyroid problem (%)
Medical Conditions - People with chronic bronchitis (%)
Medical Conditions - People with any liver condition (%)
Medical Conditions - People who ever had cancer or malignancy (%)
Mental Health - People who have little interest in doing things (%)
Mental Health - People feeling down, depressed, or hopeless (%)
Mental Health - People who have trouble sleeping or sleeping too much (%)
Mental Health - People feeling tired or having little energy (%)
Mental Health - People with poor appetite or overeating (%)
Mental Health - People feeling bad about themself (%)
Mental Health - People who have trouble concentrating on things (%)
Mental Health - People moving or speaking slowly or too fast (%)
Mental Health - People having thoughts they would be better off dead (%)
Oral Health - Average years since last visit a dentist
Oral Health - People embarrassed because of mouth (%)
Oral Health - People with gum disease (%)
Oral Health - General health of teeth and gums (%)
Oral Health - Average days a week using dental floss/device
Oral Health - Average days a week using mouthwash for dental problem
Oral Health - Average number of teeth
Pesticide Use - Households using pesticides to control insects (%)
Pesticide Use - Households using pesticides to kill weeds (%)
Physical Activity - People doing vigorous-intensity work activities (%)
Physical Activity - People doing moderate-intensity work activities (%)
Physical Activity - People walking or bicycling (%)
Physical Activity - People doing vigorous-intensity recreational activities (%)
Physical Activity - People doing moderate-intensity recreational activities (%)
Physical Activity - Average hours a day doing sedentary activities
Physical Activity - Average hours a day watching TV or videos
Physical Activity - Average hours a day using computer
Physical Functioning - People having limitations keeping them from working (%)
Physical Functioning - People limited in amount of work they can do (%)
Physical Functioning - People that need special equipment to walk (%)
Physical Functioning - People experiencing confusion/memory problems (%)
Physical Functioning - People requiring special healthcare equipment (%)
Prescription Medications - Average number of prescription medicines taking
Preventive Aspirin Use - Adults 40+ taking low-dose aspirin (%)
Reproductive Health - Vaginal deliveries (%)
Reproductive Health - Cesarean deliveries (%)
Reproductive Health - Deliveries resulted in a live birth (%)
Reproductive Health - Pregnancies resulted in a delivery (%)
Reproductive Health - Women breastfeeding newborns (%)
Reproductive Health - Women that had a hysterectomy (%)
Reproductive Health - Women that had both ovaries removed (%)
Reproductive Health - Women that have ever taken birth control pills (%)
Reproductive Health - Women taking birth control pills (%)
Reproductive Health - Women that have ever used Depo-Provera or injectables (%)
Reproductive Health - Women that have ever used female hormones (%)
Sexual Behavior - People 18+ that ever had sex (vaginal, anal, or oral) (%)
Sexual Behavior - Males 18+ that ever had vaginal sex with a woman (%)
Sexual Behavior - Males 18+ that ever performed oral sex on a woman (%)
Sexual Behavior - Males 18+ that ever had anal sex with a woman (%)
Sexual Behavior - Males 18+ that ever had any sex with a man (%)
Sexual Behavior - Females 18+ that ever had vaginal sex with a man (%)
Sexual Behavior - Females 18+ that ever performed oral sex on a man (%)
Sexual Behavior - Females 18+ that ever had anal sex with a man (%)
Sexual Behavior - Females 18+ that ever had any kind of sex with a woman (%)
Sexual Behavior - Average age people first had sex
Sexual Behavior - Average number of female sex partners in lifetime (males 18+)
Sexual Behavior - Average number of female vaginal sex partners in lifetime (males 18+)
Sexual Behavior - Average age people first performed oral sex on a woman (18+)
Sexual Behavior - Average number of woman performed oral sex on in lifetime (18+)
Sexual Behavior - Average number of male sex partners in lifetime (males 18+)
Sexual Behavior - Average number of male anal sex partners in lifetime (males 18+)
Sexual Behavior - Average age people first performed oral sex on a man (18+)
Sexual Behavior - Average number of male oral sex partners in lifetime (18+)
Sexual Behavior - People using protection when performing oral sex (%)
Sexual Behavior - Average number of times people have vaginal or anal sex a year
Sexual Behavior - People having sex without condom (%)
Sexual Behavior - Average number of male sex partners in lifetime (females 18+)
Sexual Behavior - Average number of male vaginal sex partners in lifetime (females 18+)
Sexual Behavior - Average number of female sex partners in lifetime (females 18+)
Sexual Behavior - Circumcised males 18+ (%)
Sleep Disorders - Average hours sleeping at night
Sleep Disorders - People that has trouble sleeping (%)
Smoking-Cigarette Use - People smoking cigarettes (%)
Taste & Smell - People 40+ having problems with smell (%)
Taste & Smell - People 40+ having problems with taste (%)
Taste & Smell - People 40+ that ever had wisdom teeth removed (%)
Taste & Smell - People 40+ that ever had tonsils teeth removed (%)
Taste & Smell - People 40+ that ever had a loss of consciousness because of a head injury (%)
Taste & Smell - People 40+ that ever had a broken nose or other serious injury to face or skull (%)
Taste & Smell - People 40+ that ever had two or more sinus infections (%)
Weight - Average height (inches)
Weight - Average weight (pounds)
Weight - Average BMI
Weight - People that are obese (%)
Weight - People that ever were obese (%)
Weight - People trying to lose weight (%)
100%
urban population.
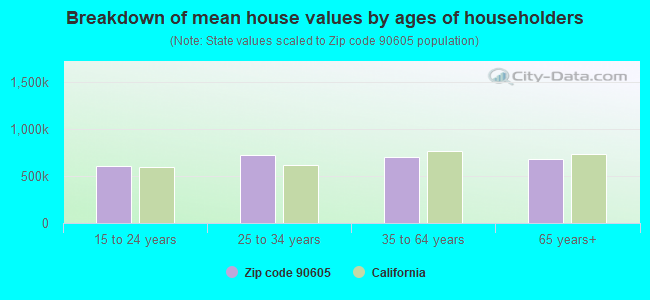
Estimated median house/condo value in 2022: $686,582
90605:
$686,582California:
$715,900
According to our research of California and other state lists, there were 28 registered sex offenders living in 90605 zip code as of April 27, 2024 . The ratio of all residents to sex offenders in zip code 90605 is 1,496 to 1.The ratio of registered sex offenders to all residents in this zip code is lower than the state average.
Median resident age: This zip code:
36.6 yearsCalifornia median age:
37.9 years
Average household size: This zip code:
3.7 peopleCalifornia:
2.8 people
Averages for the 2020 tax year for zip code 90605, filed in 2021:
Average Adjusted Gross Income (AGI) in 2020: $61,235 (Individual Income Tax Returns) Here:
$61,235State:
$95,910
Salary/wage: $53,987 (reported on 84.8% of returns )Here:
$53,987State:
$77,331
(% of AGI for various income ranges: 1270.4% for AGIs below $25k , 3979.8% for AGIs $25k-50k , 7525.4% for AGIs $50k-75k , 11160.6% for AGIs $75k-100k , 19791.5% for AGIs $100k-200k , 82569.3% for AGIs over 200k ) Taxable interest for individuals: $967 (reported on 29.6% of returns )This zip code:
$967California:
$2,294
(% of AGI for various income ranges: 8.0% for AGIs below $25k , 11.0% for AGIs $25k-50k , 20.3% for AGIs $50k-75k , 45.2% for AGIs $75k-100k , 84.7% for AGIs $100k-200k , 1842.0% for AGIs over 200k ) Ordinary dividends: $5,464 (reported on 8.7% of returns )(% of AGI for various income ranges: 6.9% for AGIs below $25k , 9.0% for AGIs $25k-50k , 34.8% for AGIs $50k-75k , 63.5% for AGIs $75k-100k , 131.5% for AGIs $100k-200k , 3646.0% for AGIs over 200k ) Net capital gain/loss in AGI: +$17,013 (reported on 9.3% of returns )Here:
+$17,013State:
+$49,306
(% of AGI for various income ranges: 2.8% for AGIs below $25k , 6.0% for AGIs $25k-50k , 25.1% for AGIs $50k-75k , 101.4% for AGIs $75k-100k , 282.9% for AGIs $100k-200k , 17114.7% for AGIs over 200k ) Profit/loss from business: +$10,140 (reported on 15.8% of returns )Here:
+$10,140State:
+$15,671
(% of AGI for various income ranges: 189.6% for AGIs below $25k , 146.6% for AGIs $25k-50k , 190.7% for AGIs $50k-75k , 251.6% for AGIs $75k-100k , 350.3% for AGIs $100k-200k , 3760.7% for AGIs over 200k ) Taxable individual retirement arrangement distribution: $19,100 (reported on 3.7% of returns )90605:
$19,100California:
$23,505
(% of AGI for various income ranges: 21.9% for AGIs below $25k , 36.0% for AGIs $25k-50k , 68.1% for AGIs $50k-75k , 151.2% for AGIs $75k-100k , 320.3% for AGIs $100k-200k , 2707.3% for AGIs over 200k ) Self-employed (Keogh) retirement plans: $60,150 (reported on 0.1% of returns )90605:
$60,150California:
$30,163
(% of AGI for various income ranges: 83.5% for AGIs $100k-200k ) Total itemized deductions: $32,382 (reported on 15.4% of returns )Here:
$32,382State:
$39,517
(% of AGI for various income ranges: 59.3% for AGIs below $25k , 190.1% for AGIs $25k-50k , 658.9% for AGIs $50k-75k , 1392.1% for AGIs $75k-100k , 2655.5% for AGIs $100k-200k , 14059.3% for AGIs over 200k ) Charity contributions: $7,004 (reported on 13.1% of returns )(% of AGI for various income ranges: 4.4% for AGIs below $25k , 19.7% for AGIs $25k-50k , 84.3% for AGIs $50k-75k , 160.0% for AGIs $75k-100k , 394.2% for AGIs $100k-200k , 5364.7% for AGIs over 200k ) Taxes paid: $8,928 (reported on 15.3% of returns )(% of AGI for various income ranges: 13.0% for AGIs below $25k , 53.6% for AGIs $25k-50k , 199.1% for AGIs $50k-75k , 444.7% for AGIs $75k-100k , 795.6% for AGIs $100k-200k , 2560.7% for AGIs over 200k ) Earned income credit: $2,089 (reported on 15.7% of returns )(% of AGI for various income ranges: 85.7% for AGIs below $25k , 65.4% for AGIs $25k-50k , 1.1% for AGIs $50k-75k ) Percentage of individuals using paid preparers for their 2020 taxes: 92.3%(% for various income ranges: 90.8% for AGIs below $25k , 92.6% for AGIs $25k-50k , 93.4% for AGIs $50k-75k , 92.3% for AGIs $75k-100k , 94.2% for AGIs $100k-200k , 93.3% for AGIs over 200k )
Averages for the 2012 tax year for zip code 90605, filed in 2013:
Average Adjusted Gross Income (AGI) in 2012: $50,457 (Individual Income Tax Returns) Here:
$50,457State:
$72,726
Salary/wage: $44,900 (reported on 86.8% of returns )Here:
$44,900State:
$59,079
(% of AGI for various income ranges: 78.4% for AGIs below $25k , 86.5% for AGIs $25k-50k , 86.5% for AGIs $50k-75k , 82.5% for AGIs $75k-100k , 81.8% for AGIs $100k-200k , 48.9% for AGIs over 200k ) Taxable interest for individuals: $1,044 (reported on 29.9% of returns )This zip code:
$1,044California:
$2,146
(% of AGI for various income ranges: 0.5% for AGIs below $25k , 0.4% for AGIs $25k-50k , 0.3% for AGIs $50k-75k , 0.4% for AGIs $75k-100k , 0.5% for AGIs $100k-200k , 1.4% for AGIs over 200k ) Ordinary dividends: $7,224 (reported on 8.9% of returns )(% of AGI for various income ranges: 0.5% for AGIs below $25k , 0.3% for AGIs $25k-50k , 0.5% for AGIs $50k-75k , 0.7% for AGIs $75k-100k , 0.7% for AGIs $100k-200k , 4.7% for AGIs over 200k ) Net capital gain/loss in AGI: +$5,568 (reported on 7.2% of returns )Here:
+$5,568State:
+$30,460
(% of AGI for various income ranges: 0.6% for AGIs $100k-200k , 3.6% for AGIs over 200k ) Profit/loss from business: +$13,705 (reported on 14.6% of returns )Here:
+$13,705State:
+$17,064
(% of AGI for various income ranges: 10.7% for AGIs below $25k , 4.1% for AGIs $25k-50k , 2.2% for AGIs $50k-75k , 2.2% for AGIs $75k-100k , 1.8% for AGIs $100k-200k , 5.3% for AGIs over 200k ) Taxable individual retirement arrangement distribution: $16,867 (reported on 4.8% of returns )90605:
$16,867California:
$19,557
(% of AGI for various income ranges: 1.2% for AGIs below $25k , 1.0% for AGIs $25k-50k , 1.5% for AGIs $50k-75k , 2.0% for AGIs $75k-100k , 2.2% for AGIs $100k-200k , 1.6% for AGIs over 200k ) Self-employment retirement plans: $26,525 (reported on 0.2% of returns )90605:
$26,525California:
$24,530
Total itemized deductions: $28,153 (29% of AGI, reported on 33.9% of returns )Here:
$28,153State:
$34,004
Here:
29.2% of AGIState:
22.7% of AGI
(% of AGI for various income ranges: 7.3% for AGIs below $25k , 13.4% for AGIs $25k-50k , 20.2% for AGIs $50k-75k , 22.2% for AGIs $75k-100k , 22.3% for AGIs $100k-200k , 24.1% for AGIs over 200k ) Charity contributions: $2,828 (reported on 28.7% of returns )(% of AGI for various income ranges: 0.4% for AGIs below $25k , 1.0% for AGIs $25k-50k , 1.8% for AGIs $50k-75k , 1.9% for AGIs $75k-100k , 2.1% for AGIs $100k-200k , 1.9% for AGIs over 200k ) Taxes paid: $9,109 (reported on 33.9% of returns )90605:
$9,109State:
$14,448
(% of AGI for various income ranges: 1.6% for AGIs below $25k , 3.1% for AGIs $25k-50k , 5.5% for AGIs $50k-75k , 6.8% for AGIs $75k-100k , 7.8% for AGIs $100k-200k , 10.0% for AGIs over 200k ) Earned income credit: $2,361 (reported on 22.4% of returns )(% of AGI for various income ranges: 7.1% for AGIs below $25k , 1.5% for AGIs $25k-50k ) Percentage of individuals using paid preparers for their 2012 taxes: 74.7%(% for various income ranges: 71.3% for AGIs below $25k , 75.7% for AGIs $25k-50k , 76.2% for AGIs $50k-75k , 77.3% for AGIs $75k-100k , 81.6% for AGIs $100k-200k , 82.4% for AGIs over 200k )
Averages for the 2004 tax year for zip code 90605, filed in 2005:
Average Adjusted Gross Income (AGI) in 2004: $45,353 (Individual Income Tax Returns) Here:
$45,353State:
$58,600
Salary/wage: $40,570 (reported on 87.7% of returns )Here:
$40,570State:
$49,455
(% of AGI for various income ranges: 116.3% for AGIs below $10k , 82.4% for AGIs $10k-25k , 88.3% for AGIs $25k-50k , 87.4% for AGIs $50k-75k , 87.5% for AGIs $75k-100k , 60.4% for AGIs over 100k ) Taxable interest for individuals: $1,798 (reported on 38.3% of returns )This zip code:
$1,798California:
$2,365
(% of AGI for various income ranges: 3.8% for AGIs below $10k , 1.1% for AGIs $10k-25k , 0.8% for AGIs $25k-50k , 0.9% for AGIs $50k-75k , 0.6% for AGIs $75k-100k , 2.8% for AGIs over 100k ) Taxable dividends: $3,746 (reported on 13.0% of returns )(% of AGI for various income ranges: 1.7% for AGIs below $10k , 0.6% for AGIs $10k-25k , 0.4% for AGIs $25k-50k , 0.5% for AGIs $50k-75k , 0.7% for AGIs $75k-100k , 2.1% for AGIs over 100k ) Net capital gain/loss: +$15,326 (reported on 9.6% of returns )Here:
+$15,326State:
+$23,418
(% of AGI for various income ranges: -1.4% for AGIs below $10k , 0.3% for AGIs $10k-25k , 0.2% for AGIs $25k-50k , 0.6% for AGIs $50k-75k , 0.8% for AGIs $75k-100k , 8.9% for AGIs over 100k ) Profit/loss from business: +$12,458 (reported on 14.0% of returns )Here:
+$12,458State:
+$16,826
(% of AGI for various income ranges: 16.0% for AGIs below $10k , 7.4% for AGIs $10k-25k , 3.3% for AGIs $25k-50k , 2.2% for AGIs $50k-75k , 2.0% for AGIs $75k-100k , 4.3% for AGIs over 100k ) IRA payment deduction: $3,088 (reported on 1.8% of returns )90605:
$3,088California:
$3,192
(% of AGI for various income ranges: 0.3% for AGIs below $10k , 0.1% for AGIs $10k-25k , 0.1% for AGIs $25k-50k , 0.1% for AGIs $50k-75k , 0.1% for AGIs $75k-100k , 0.1% for AGIs over 100k ) Self-employed pension: $18,258 (reported on 0.4% of returns )Here:
$18,258California:
$17,688
Total itemized deductions: $23,684 (29% of AGI, reported on 39.2% of returns )Here:
$23,684State:
$28,113
Here:
29.4% of AGIState:
25.3% of AGI
(% of AGI for various income ranges: 17.7% for AGIs below $10k , 11.5% for AGIs $10k-25k , 18.6% for AGIs $25k-50k , 24.7% for AGIs $50k-75k , 24.7% for AGIs $75k-100k , 20.4% for AGIs over 100k ) Charity contributions deductions: $2,919 (3% of AGI, reported on 35.0% of returns )Here:
3.5% of AGIState:
3.3% of AGI
(% of AGI for various income ranges: 0.7% for AGIs below $10k , 0.8% for AGIs $10k-25k , 1.7% for AGIs $25k-50k , 2.5% for AGIs $50k-75k , 2.7% for AGIs $75k-100k , 2.8% for AGIs over 100k ) Total tax: $6,502 (reported on 69.6% of returns )90605:
$6,502State:
$10,761
(% of AGI for various income ranges: 4.4% for AGIs below $10k , 3.5% for AGIs $10k-25k , 5.1% for AGIs $25k-50k , 6.8% for AGIs $50k-75k , 8.3% for AGIs $75k-100k , 18.0% for AGIs over 100k ) Earned income credit: $1,852 (reported on 19.4% of returns )Percentage of individuals using paid preparers for their 2004 taxes: 75.1%(% for various income ranges: 66.1% for AGIs below $10k , 73.9% for AGIs $10k-25k , 76.8% for AGIs $25k-50k , 78.0% for AGIs $50k-75k , 78.1% for AGIs $75k-100k , 83.9% for AGIs over 100k )
Estimated median household income in 2022: This zip code:
$93,837California:
$91,551
Nearest zip codes: 90602 ,
90604 ,
90603 ,
90670 ,
90606 ,
90638 .
Whittier Zip Code Map
Percentage of family households: This zip code:
54.9%California:
46.8%
Percentage of households with unmarried partners: This zip code:
4.4%California:
48.1%
Likely homosexual households (counted as self-reported same-sex unmarried-partner households)
Lesbian couples: 0.2% of all households Gay men: 0.1% of all households
Household received Food Stamps/SNAP in the past 12 months: 1,387Household did not receive Food Stamps/SNAP in the past 12 months: 9,715
Women who had a birth in the past 12 months: 506 (389 now married , 116 unmarried) Women who did not have a birth in the past 12 months: 9,556 (3,811 now married , 5,744 unmarried)
Housing units in zip code 90605 with a mortgage: 5,226 (419
second mortgage , 374
both second mortgage and home equity loan )
Houses without a mortgage: 88
Median monthly owner costs for units with a mortgage: $2,575
Median monthly owner costs for units without a mortgage: $538
Residents with income below the poverty level in 2022:
This zip code:
8.6%Whole state:
12.2%
Residents with income below 50% of the poverty level in 2022:
This zip code:
4.3%Whole state:
6.2%
Median number of rooms in houses and condos: Median number of rooms in apartments: Notable locations in this zip code not listed on our city pages
Click to draw/clear zip code borders Notable location: (A) . Display/hide its location on the map
Shopping Centers: (1) , Santa Fe Springs Plaza Shopping Center (2) . Display/hide their locations on the map
Churches in zip code 90605 include: (A) , South Whittier Christian Church (B) , Trinity United Methodist Church (C) , Life Tabernacle Apostolic Church (D) , East Whittier Christian Church (E) , Shepherd of the Hills Lutheran Church (F) , Whittier Seventh Day Adventist Church (G) , East Whittier Presbyterian Church (H) , College Avenue Church of the Nazarene (I) . Display/hide their locations on the map
Streams, rivers, and creeks: (A) , Arroyo Pescadero (B) , Tacobi Creek (C) . Display/hide their locations on the map
Parks in zip code 90605 include: (1) , Kennedy Park (2) , Michigan Park (3) , Laurel Park (4) . Display/hide their locations on the map
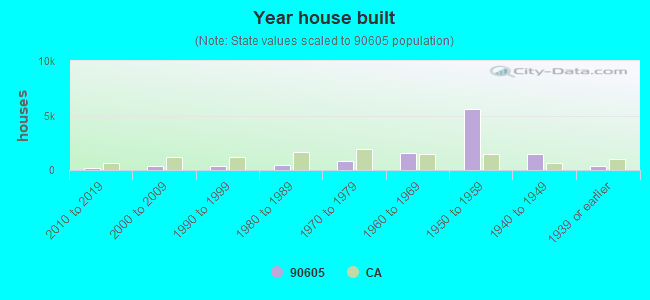
Year house built (houses)
0 2020 or later213 2010 to 2019345 2000 to 2009370 1990 to 1999424 1980 to 1989830 1970 to 19791,519 1960 to 19695,618 1950 to 19591,505 1940 to 1949399 1939 or earlier
Zip code 90605 household income distribution in 2022 438 Less than $10,000171 $10,000 to $14,999292 $15,000 to $19,999210 $20,000 to $24,999336 $25,000 to $29,999302 $30,000 to $34,999205 $35,000 to $39,999390 $40,000 to $44,999205 $45,000 to $49,999755 $50,000 to $59,999783 $60,000 to $74,9991,792 $75,000 to $99,9991,336 $100,000 to $124,999968 $125,000 to $149,9991,353 $150,000 to $199,9991,555 $200,000 or moreEstimate of home value of owner-occupied houses/condos in 2022 in zip code 90605 77 Less than $10,00026 $50,000 to $59,99949 $60,000 to $69,9996 $70,000 to $79,99913 $80,000 to $89,99988 $150,000 to $174,99932 $200,000 to $249,99956 $250,000 to $299,999146 $300,000 to $399,999736 $400,000 to $499,9994,459 $500,000 to $749,9991,176 $750,000 to $999,999520 $1,000,000 to $1,499,99984 $1,500,000 to $1,999,99958 $2,000,000 or moreRent paid by renters in 2022 in zip code 90605 19 $100 to $14997 $200 to $2499 $250 to $29920 $350 to $39921 $400 to $44910 $500 to $5498 $550 to $5996 $650 to $69915 $800 to $899121 $900 to $999745 $1,000 to $1,249287 $1,250 to $1,4991,227 $1,500 to $1,999576 $2,000 to $2,499230 $2,500 to $2,99961 $3,000 to $3,49963 $3,500 or more97 No cash rent
Median gross rent in 2022: $1,765.
Median price asked for vacant for-sale houses and condos in 2022: $1,117,460.
Estimated median house (or condo) value in 2022 for: White Non-Hispanic householders: $702,695Black or African American householders: $628,810American Indian or Alaska Native householders: $632,740Asian householders: $793,479Native Hawaiian and other Pacific Islander householders: $1,043,824Some other race householders: $666,931Two or more races householders: $681,866Hispanic or Latino householders: $674,398Estimated median house or condo value in 2022: $686,582
90605:
$686,582California:
$715,900
Lower value quartile - upper value quartile: $584,220 - $804,339
Mean price in 2022: Detached houses: $1,011,143Here:
$1,011,143State:
$988,808
Townhouses or other attached units: $453,521Here:
$453,521State:
$838,546
In 3-to-4-unit structures: $408,400Here:
$408,400State:
$824,253
In 5-or-more-unit structures: $3,413,777Here:
$3,413,777State:
$730,996
Mobile homes: $29,944Here:
$29,944State:
$184,506
Housing units in structures:
One, detached: 9,623One, attached: 634Two: 423 or 4: 2715 to 9: 31210 to 19: 25720 to 49: 33050 or more: 66Mobile homes: 20Unemployment : 4.4%
Means of transportation to work in zip code 90605 77.6% 14,927 Drove a car alone10.7% 2,065 Carpooled0.2% 47 Bus or trolley bus0.1% 16 Streetcar or trolley car0.1% 23 Subway or elevated0.1% 21 Railroad0.1% 21 Taxi0.0% 5 Motorcycle0.0% 7 Bicycle0.6% 123 Walked0.7% 140 Other means7.8% 1,502 Worked at homeTravel time to work (commute) in zip code 90605 347 Less than 5 minutes878 5 to 9 minutes1,538 10 to 14 minutes2,224 15 to 19 minutes2,026 20 to 24 minutes997 25 to 29 minutes2,387 30 to 34 minutes814 35 to 39 minutes906 40 to 44 minutes2,201 45 to 59 minutes2,168 60 to 89 minutes814 90 or more minutes
Neighborhoods in zip code 90605: Percentage of zip code residents living and working in this county: 82.2%
Household type by relationship:
Households: 41,083
Male householders: 5,627 (766 living alone ), Female householders: 5,483 (762 living alone )6,557 spouses (6,333 opposite-sex spouses ), 605 unmarried partners , (568 opposite-sex unmarried partners ), 13,911 children (13,516 natural , 67 adopted , 329 stepchildren ), 1,799 grandchildren , 899 brothers or sisters , 1,754 parents , 114 foster children , 2,664 other relatives , 1,073 non-relatives In group quarters: 410 (-1 institutionalized population )
Size of family households: 2,004 2-persons , 2,174 3-persons , 2,043 4-persons , 1,226 5-persons , 734 6-persons , 835 7-or-more-persons
Size of nonfamily households: 1,526 1-person , 355 2-persons , 9 3-persons , 79 4-persons , 27 5-persons
5,618 married couples with children. single-parent households (262 men , 924 women ).
43.0% of residents of 90605 zip code speak English at home. of residents speak Spanish at home (70% very well, 13% well, 10% not well, 7% not at all ).of residents speak other Indo-European language at home (74% very well, 13% well, 8% not well, 5% not at all ).of residents speak Asian or Pacific Island language at home (65% very well, 18% well, 8% not well, 9% not at all ).of residents speak other language at home (63% very well, 37% well ).
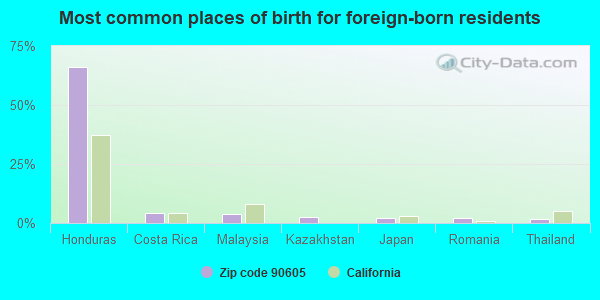
Foreign born population: 9,755 (23.7%)
(57.6%
of them are naturalized citizens )
This zip code:
23.7%Whole state:
26.7%
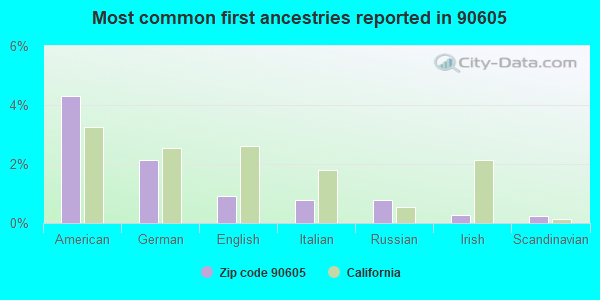
66% Honduras 4% Costa Rica 4% Malaysia 3% Kazakhstan 2% Japan 2% Romania 2% Thailand 4% American 2% German 1% English 1% Italian 1% Russian 0% Irish 0% Scandinavian
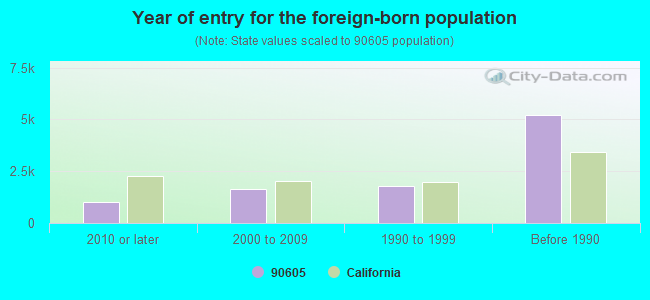
Year of entry for the foreign-born population
1,024 2010 or later 1,660 2000 to 2009 1,806 1990 to 1999 5,213 Before 1990
There are
146 Medical Specialists in Zip Code 90605 .
Major facilities with environmental interests located in this zip code:
LOMA VISTA ELEMENTARY SCHOOL (13463 E MEYER RD in WHITTIER, CA)
STATE MASTER (California - Hazardous Waste Tracking) - HAZARDOU WASTE PROGRAM (National Center for Education Statistics) - STATE ID-6022834 Large Quantity Generators, more that 1000 kg of hazardous waste/month (Resource Conservation and Recovery Act (tracking hazardous waste)) Organizations: ROBERT SPEARS (CONTACT/OPERATOR)
, SWUSD (CONTACT/OWNER)
, SOUTH WHITTIER ELEMENTARY (SCHOOL DISTRICT)
LOS ALTOS ELEMENTARY SCHOOL (12001 BONA VISTA LN in WHITTIER, CA)
STATE MASTER (California - Hazardous Waste Tracking) - HAZARDOU WASTE PROGRAM (National Center for Education Statistics) - STATE ID-6022842 Large Quantity Generators, more that 1000 kg of hazardous waste/month (Resource Conservation and Recovery Act (tracking hazardous waste)) Organizations: ROBERT SPEARS (CONTACT/OPERATOR)
, SWUSD (CONTACT/OWNER)
, SOUTH WHITTIER ELEMENTARY (SCHOOL DISTRICT)
CARMELA ELEMENTARY SCHOOL (13300 LAKELAND RD in WHITTIER, CA)
STATE MASTER (California - Hazardous Waste Tracking) - HAZARDOU WASTE PROGRAM (National Center for Education Statistics) - STATE ID-6022800 Large Quantity Generators, more that 1000 kg of hazardous waste/month (Resource Conservation and Recovery Act (tracking hazardous waste)) Organizations: ROBERT SPEARS (CONTACT/OPERATOR)
, SWUSD (CONTACT/OWNER)
, SOUTH WHITTIER ELEMENTARY (SCHOOL DISTRICT)
GOLDEN STATE LUBE CENTERS DBA JIFFY LUBE #360 (14180 LAMBERT ROAD in WHITTIER, CA)
STATE MASTER (California - Hazardous Waste Tracking) - HAZARDOU WASTE PROGRAM Small Quantity Generators, between 100 kg and 1000 kg of hazardous waste/month (Resource Conservation and Recovery Act (tracking hazardous waste)) - notification Organizations: TONY ORTEGA (CONTACT/OWNER)
Alternative names: JIFFY LUBE #5
A 1 CLEANERS (13739 LEFFING WELL RD in WHITTIER, CA)
STATE MASTER (California - Hazardous Waste Tracking) - HAZARDOU WASTE PROGRAM Small Quantity Generators, between 100 kg and 1000 kg of hazardous waste/month (Resource Conservation and Recovery Act (tracking hazardous waste)) - notification Organizations: KUN KIM JA (CONTACT/OWNER)
HARRIS OLDSMOBILE INC (13617 E WHITTIER BLVD in WHITTIER, CA)
STATE MASTER (California - Hazardous Waste Tracking) - HAZARDOU WASTE PROGRAM Small Quantity Generators, between 100 kg and 1000 kg of hazardous waste/month (Resource Conservation and Recovery Act (tracking hazardous waste)) Alternative names: DBA HARRIS BUICK-PONTIAC GMC
EAST WHITTIER MIDDLE (14421 E. WHITTIER BLVD. in WHITTIER, CA)
(National Center for Education Statistics) - STATE ID-6012991 Organizations: EAST WHITTIER CITY ELEMENTARY (SCHOOL DISTRICT)
FRONTIER HIGH (CONT.) (9401 S. PAINTER in WHITTIER, CA)
(National Center for Education Statistics) - STATE ID-1930338 Organizations: WHITTIER UNION HIGH (SCHOOL DISTRICT)
LA SERNA HIGH (15301 E. YOUNGWOOD DR. in WHITTIER, CA)
(National Center for Education Statistics) - STATE ID-1934868 Organizations: WHITTIER UNION HIGH (SCHOOL DISTRICT)
LAKE MARIE ELEMENTARY (10001 CARMENITA ROAD in WHITTIER, CA)
(National Center for Education Statistics) - STATE ID-6022826 Organizations: SOUTH WHITTIER ELEMENTARY (SCHOOL DISTRICT)
LAUREL ELEMENTARY (13550 LAMBERT ROAD in WHITTIER, CA)
(National Center for Education Statistics) - STATE ID-6013049 Organizations: EAST WHITTIER CITY ELEMENTARY (SCHOOL DISTRICT)
MULBERRY ELEMENTARY (14029 E. MULBERRY DR. in WHITTIER, CA)
(National Center for Education Statistics) - STATE ID-6013072 Organizations: EAST WHITTIER CITY ELEMENTARY (SCHOOL DISTRICT)
ELECTRO MAG (13211 IMPERIAL HIGHWAY in WHITTIER, CA)
CRITERIA AND HAZARDOUS AIR POLLUTANT INVENTORY (Inventory of air pollution sources) (Resource Conservation and Recovery Act (tracking hazardous waste)) Business SIC classification: ELECTRONIC COMPONENTSOrganizations: NEUBAUER FAMILY TRUST (CONTACT/OWNER)
Alternative names: AEROSPACE DESIGN ELECTRO MAG
Housing units lacking complete plumbing facilities: 0.2%
Housing units lacking complete kitchen facilities: 1.1%
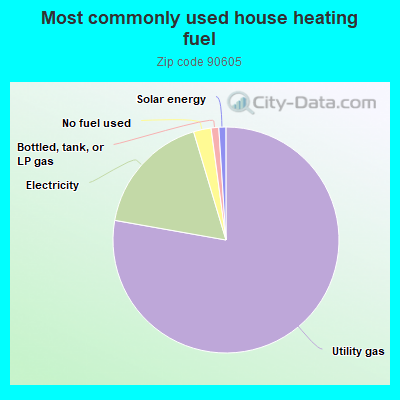
77.4% Utility gas 17.5% Electricity 2.5% No fuel used 1.1% Bottled, tank, or LP gas 1.0% Solar energy
Population in 1990: 34,035. Population change in the 1990s: +4,145 (+12.2%).
Place of birth for U.S.-born residents:
This state: 29,238Northeast: 420Midwest: 545South: 612West: 448
61% of the 90605 zip code residents lived in the same house 5 years ago.
Out of people who lived in different houses, 87% lived in this county.
Out of people who lived in different counties, 50% lived in California.
97% of the 90605 zip code residents lived in the same house 1 year ago.
Out of people who lived in different houses, 85% moved from this county.
Out of people who lived in different houses, 12% moved from different county within same state.
Out of people who lived in different houses, 3% moved from different state.
Out of people who lived in different houses, 10% moved from abroad.
Private vs. public school enrollment:
Students in private schools in grades 1 to 8 (elementary and middle school): 252
Here:
6.6%California:
10.5%
Students in private schools in grades 9 to 12 (high school): 78
Students in private undergraduate colleges: 443
Here:
16.4%California:
15.9%
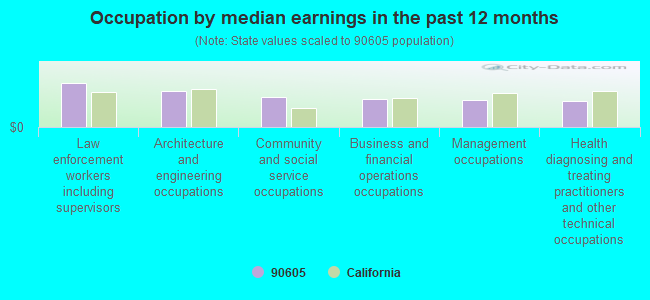
Occupation by median earnings in the past 12 months ($)
112,487 Law enforcement workers including supervisors 91,221 Architecture and engineering occupations 75,755 Community and social service occupations 70,949 Business and financial operations occupations 70,255 Management occupations 67,486 Health diagnosing and treating practitioners and other technical occupations
Top industries in this zip code by the number of employees in 2005:
Accommodation and Food Services: Full-Service Restaurants (100-249 employees: 1 establishment, 50-99 employees: 4 establishments, 20-49 employees: 3 establishments, 10-19 employees: 3 establishments, 5-9 employees: 5 establishments, 1-4 employees: 6 establishments)Administrative and Support and Waste Management and Remediation Services: Temporary Help Services (100-249: 3, 50-99: 1)Accommodation and Food Services: Limited-Service Restaurants (50-99: 1, 20-49: 8, 10-19: 6, 5-9: 2, 1-4: 4)Arts, Entertainment, and Recreation: Golf Courses and Country Clubs (100-249: 1)Accommodation and Food Services: Snack and Nonalcoholic Beverage Bars (50-99: 1, 20-49: 1, 5-9: 4, 1-4: 1)Health Care and Social Assistance: Other Individual and Family Services (50-99: 1, 10-19: 2)Other Services (except Public Administration): Beauty Salons (20-49: 2, 10-19: 1, 5-9: 2, 1-4: 3)
People in group quarters in 2010:
106 people in in-patient hospice facilities
55 people in group homes intended for adults
52 people in residential treatment centers for adults
25 people in other noninstitutional facilities
16 people in workers' group living quarters and job corps centers
5 people in emergency and transitional shelters (with sleeping facilities) for people experiencing homelessness
People in group quarters in 2000:
66 people in homes or halfway houses for drug/alcohol abuse
57 people in other noninstitutional group quarters
53 people in homes for the mentally retarded
24 people in homes for the mentally ill
Fatal accident statistics in 2014:
Fatal accident count: 1Vehicles involved in fatal accidents: 1Fatal accidents caused by drunken drivers: 1Fatalities: 1Persons involved in fatal accidents: 1Pedestrians involved in fatal accidents: 1
Fatal accident statistics in 2013:
Fatal accident count: 2Vehicles involved in fatal accidents: 3Fatal accidents caused by drunken drivers: 0Fatalities: 2Persons involved in fatal accidents: 3Pedestrians involved in fatal accidents: 1
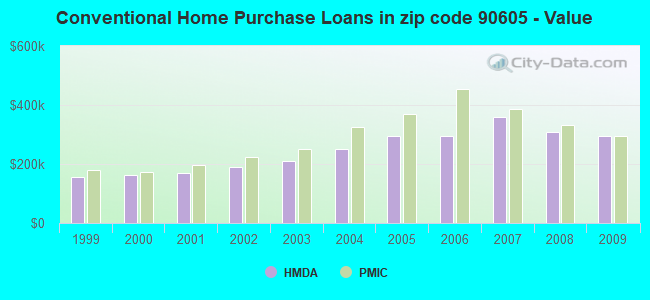
Home Mortgage Disclosure Act Aggregated Statistics For Year 2009(Based on 7 full and 10 partial tracts) A) FHA, FSA/RHS & VA B) Conventional C) Refinancings D) Home Improvement Loans E) Loans on Dwellings For 5+ Families F) Non-occupant Loans on G) Loans On Manufactured Number Average Value Number Average Value Number Average Value Number Average Value Number Average Value Number Average Value Number Average Value
LOANS ORIGINATED 278 $307,380 165 $294,820 806 $276,961 54 $192,944 5 $772,364 48 $193,249 0 $0 APPLICATIONS APPROVED, NOT ACCEPTED 37 $300,336 17 $411,588 99 $289,865 10 $71,275 0 $0 5 $380,062 0 $0 APPLICATIONS DENIED 80 $295,800 53 $340,889 405 $301,393 30 $141,087 3 $1,181,787 27 $173,553 4 $126,622 APPLICATIONS WITHDRAWN 39 $315,410 26 $197,072 146 $314,256 23 $174,029 1 $4,629,300 11 $178,104 0 $0 FILES CLOSED FOR INCOMPLETENESS 15 $298,035 19 $262,166 76 $322,118 15 $231,078 0 $0 3 $156,633 0 $0
Aggregated Statistics For Year 2008(Based on 7 full and 10 partial tracts) A) FHA, FSA/RHS & VA B) Conventional C) Refinancings D) Home Improvement Loans E) Loans on Dwellings For 5+ Families F) Non-occupant Loans on G) Loans On Manufactured Number Average Value Number Average Value Number Average Value Number Average Value Number Average Value Number Average Value Number Average Value
LOANS ORIGINATED 135 $339,127 216 $307,559 614 $295,138 79 $153,312 5 $2,738,912 81 $269,724 3 $66,037 APPLICATIONS APPROVED, NOT ACCEPTED 8 $348,424 66 $375,880 184 $298,389 33 $119,698 2 $1,277,680 19 $290,233 3 $53,403 APPLICATIONS DENIED 35 $348,309 107 $327,056 552 $348,802 92 $164,236 5 $904,496 44 $278,127 0 $0 APPLICATIONS WITHDRAWN 18 $323,138 35 $243,961 146 $326,355 25 $185,817 1 $1,815,260 24 $247,111 0 $0 FILES CLOSED FOR INCOMPLETENESS 8 $286,032 20 $295,834 72 $364,695 9 $149,226 0 $0 11 $290,700 0 $0
Aggregated Statistics For Year 2007(Based on 7 full and 10 partial tracts) A) FHA, FSA/RHS & VA B) Conventional C) Refinancings D) Home Improvement Loans E) Loans on Dwellings For 5+ Families F) Non-occupant Loans on G) Loans On Manufactured Number Average Value Number Average Value Number Average Value Number Average Value Number Average Value Number Average Value Number Average Value
LOANS ORIGINATED 2 $358,100 412 $360,597 1,456 $329,756 232 $184,980 10 $1,517,196 146 $306,532 3 $36,713 APPLICATIONS APPROVED, NOT ACCEPTED 0 $0 143 $277,510 437 $346,816 45 $278,027 0 $0 46 $335,444 9 $92,218 APPLICATIONS DENIED 0 $0 352 $378,471 1,044 $359,392 188 $140,620 2 $3,098,760 66 $365,957 15 $106,232 APPLICATIONS WITHDRAWN 0 $0 134 $351,911 436 $361,516 50 $223,856 4 $879,775 28 $310,050 0 $0 FILES CLOSED FOR INCOMPLETENESS 0 $0 38 $311,656 138 $391,979 17 $243,394 0 $0 11 $299,595 0 $0
Aggregated Statistics For Year 2006(Based on 7 full and 10 partial tracts) B) Conventional C) Refinancings D) Home Improvement Loans E) Loans on Dwellings For 5+ Families F) Non-occupant Loans on G) Loans On Manufactured Number Average Value Number Average Value Number Average Value Number Average Value Number Average Value Number Average Value
LOANS ORIGINATED 981 $294,188 2,036 $328,016 391 $200,855 8 $897,369 173 $308,967 6 $52,595 APPLICATIONS APPROVED, NOT ACCEPTED 180 $284,270 446 $342,840 69 $236,048 0 $0 40 $372,530 3 $65,973 APPLICATIONS DENIED 400 $305,972 887 $365,245 236 $195,011 6 $729,843 44 $365,186 6 $228,022 APPLICATIONS WITHDRAWN 194 $311,962 672 $331,453 110 $222,549 0 $0 42 $356,002 3 $339,143 FILES CLOSED FOR INCOMPLETENESS 48 $347,752 186 $315,649 10 $190,261 0 $0 22 $304,874 0 $0
Aggregated Statistics For Year 2005(Based on 7 full and 10 partial tracts) B) Conventional C) Refinancings D) Home Improvement Loans E) Loans on Dwellings For 5+ Families F) Non-occupant Loans on G) Loans On Manufactured Number Average Value Number Average Value Number Average Value Number Average Value Number Average Value Number Average Value
LOANS ORIGINATED 1,091 $293,370 2,502 $298,365 384 $200,770 9 $763,046 224 $258,917 0 $0 APPLICATIONS APPROVED, NOT ACCEPTED 237 $278,302 461 $279,488 53 $164,875 0 $0 53 $275,824 12 $124,853 APPLICATIONS DENIED 326 $284,196 861 $307,593 184 $177,940 1 $1,850,000 71 $296,695 14 $108,934 APPLICATIONS WITHDRAWN 204 $282,408 779 $294,896 93 $264,783 0 $0 72 $252,793 1 $266,950 FILES CLOSED FOR INCOMPLETENESS 42 $269,172 189 $294,638 19 $248,849 0 $0 13 $238,587 4 $291,930
Aggregated Statistics For Year 2004(Based on 7 full and 10 partial tracts) A) FHA, FSA/RHS & VA B) Conventional C) Refinancings D) Home Improvement Loans E) Loans on Dwellings For 5+ Families F) Non-occupant Loans on G) Loans On Manufactured Number Average Value Number Average Value Number Average Value Number Average Value Number Average Value Number Average Value Number Average Value
LOANS ORIGINATED 8 $282,595 1,104 $250,502 2,729 $243,418 351 $156,568 7 $992,653 203 $236,755 0 $0 APPLICATIONS APPROVED, NOT ACCEPTED 0 $0 231 $262,055 519 $242,209 64 $123,986 0 $0 50 $227,631 4 $52,822 APPLICATIONS DENIED 1 $231,710 306 $250,594 927 $244,289 158 $169,746 2 $340,955 65 $220,344 4 $41,902 APPLICATIONS WITHDRAWN 5 $284,524 146 $268,751 882 $228,808 84 $124,713 0 $0 36 $281,492 0 $0 FILES CLOSED FOR INCOMPLETENESS 2 $243,610 41 $229,291 192 $250,748 19 $155,658 0 $0 5 $247,466 1 $195,860
Aggregated Statistics For Year 2003(Based on 7 full and 10 partial tracts) A) FHA, FSA/RHS & VA B) Conventional C) Refinancings D) Home Improvement Loans E) Loans on Dwellings For 5+ Families F) Non-occupant Loans on Number Average Value Number Average Value Number Average Value Number Average Value Number Average Value Number Average Value
LOANS ORIGINATED 90 $237,095 1,000 $211,091 4,324 $198,767 125 $56,286 17 $1,118,634 263 $167,192 APPLICATIONS APPROVED, NOT ACCEPTED 6 $205,022 154 $210,693 642 $190,445 45 $71,877 0 $0 64 $192,249 APPLICATIONS DENIED 21 $237,665 231 $196,795 1,144 $194,358 82 $41,292 3 $400,130 77 $184,892 APPLICATIONS WITHDRAWN 19 $243,471 150 $197,593 1,108 $194,812 34 $76,272 0 $0 29 $148,698 FILES CLOSED FOR INCOMPLETENESS 4 $215,745 31 $326,651 197 $218,951 10 $65,743 0 $0 14 $181,900
Aggregated Statistics For Year 2002(Based on 7 full and 10 partial tracts) A) FHA, FSA/RHS & VA B) Conventional C) Refinancings D) Home Improvement Loans E) Loans on Dwellings For 5+ Families F) Non-occupant Loans on Number Average Value Number Average Value Number Average Value Number Average Value Number Average Value Number Average Value
LOANS ORIGINATED 162 $203,047 708 $188,801 2,798 $182,218 79 $43,081 11 $480,835 150 $134,586 APPLICATIONS APPROVED, NOT ACCEPTED 13 $181,546 79 $190,005 400 $173,281 31 $28,300 0 $0 37 $140,624 APPLICATIONS DENIED 24 $205,700 129 $157,553 788 $170,683 58 $33,246 2 $442,680 41 $159,149 APPLICATIONS WITHDRAWN 26 $191,038 124 $163,970 743 $177,193 47 $34,959 0 $0 23 $187,171 FILES CLOSED FOR INCOMPLETENESS 5 $203,132 40 $194,937 260 $178,126 1 $25,000 0 $0 8 $114,099
Aggregated Statistics For Year 2001(Based on 7 full and 10 partial tracts) A) FHA, FSA/RHS & VA B) Conventional C) Refinancings D) Home Improvement Loans E) Loans on Dwellings For 5+ Families F) Non-occupant Loans on Number Average Value Number Average Value Number Average Value Number Average Value Number Average Value Number Average Value
LOANS ORIGINATED 296 $176,531 632 $168,127 1,877 $165,498 106 $45,213 8 $819,579 129 $153,276 APPLICATIONS APPROVED, NOT ACCEPTED 31 $191,525 87 $170,343 257 $162,206 26 $48,596 0 $0 13 $95,181 APPLICATIONS DENIED 43 $192,755 134 $156,454 646 $160,523 101 $29,793 0 $0 30 $153,803 APPLICATIONS WITHDRAWN 54 $176,249 80 $164,647 661 $163,657 63 $47,967 1 $158,000 14 $201,082 FILES CLOSED FOR INCOMPLETENESS 6 $208,053 25 $190,711 176 $158,496 7 $14,806 0 $0 10 $235,719
Aggregated Statistics For Year 2000(Based on 7 full and 10 partial tracts) A) FHA, FSA/RHS & VA B) Conventional C) Refinancings D) Home Improvement Loans E) Loans on Dwellings For 5+ Families F) Non-occupant Loans on Number Average Value Number Average Value Number Average Value Number Average Value Number Average Value Number Average Value
LOANS ORIGINATED 315 $163,461 454 $163,412 486 $129,562 118 $36,497 15 $973,223 50 $116,780 APPLICATIONS APPROVED, NOT ACCEPTED 23 $172,250 54 $166,209 105 $130,413 50 $29,860 0 $0 9 $87,247 APPLICATIONS DENIED 30 $187,808 124 $162,754 354 $125,234 107 $30,805 2 $1,021,755 25 $105,240 APPLICATIONS WITHDRAWN 43 $163,720 66 $164,888 199 $114,142 12 $23,548 0 $0 13 $112,905 FILES CLOSED FOR INCOMPLETENESS 13 $164,372 13 $125,803 100 $172,172 3 $32,273 2 $619,010 1 $88,630
Aggregated Statistics For Year 1999(Based on 3 full and 7 partial tracts) A) FHA, FSA/RHS & VA B) Conventional C) Refinancings D) Home Improvement Loans E) Loans on Dwellings For 5+ Families F) Non-occupant Loans on Number Average Value Number Average Value Number Average Value Number Average Value Number Average Value Number Average Value
LOANS ORIGINATED 164 $155,639 216 $154,860 528 $141,453 71 $26,086 7 $308,317 52 $107,730 APPLICATIONS APPROVED, NOT ACCEPTED 5 $171,206 20 $218,671 106 $145,151 26 $29,604 0 $0 3 $180,267 APPLICATIONS DENIED 34 $150,100 55 $144,285 292 $131,405 61 $19,036 1 $150,000 11 $132,422 APPLICATIONS WITHDRAWN 26 $156,507 42 $142,173 169 $127,995 14 $18,049 0 $0 8 $104,629 FILES CLOSED FOR INCOMPLETENESS 5 $172,554 13 $139,387 76 $139,116 0 $0 1 $3,824,100 0 $0
Private Mortgage Insurance Companies Aggregated Statistics For Year 2009(Based on 7 full and 10 partial tracts) A) Conventional B) Refinancings Number Average Value Number Average Value
LOANS ORIGINATED 31 $295,332 8 $274,275 APPLICATIONS APPROVED, NOT ACCEPTED 11 $325,211 12 $342,293 APPLICATIONS DENIED 3 $203,817 5 $292,262 APPLICATIONS WITHDRAWN 3 $233,673 1 $314,000 FILES CLOSED FOR INCOMPLETENESS 4 $275,388 0 $0
Aggregated Statistics For Year 2008(Based on 7 full and 10 partial tracts) A) Conventional B) Refinancings C) Non-occupant Loans on Number Average Value Number Average Value Number Average Value
LOANS ORIGINATED 90 $333,576 29 $372,699 4 $261,850 APPLICATIONS APPROVED, NOT ACCEPTED 33 $386,776 44 $425,024 4 $309,532 APPLICATIONS DENIED 19 $355,264 18 $387,637 3 $282,657 APPLICATIONS WITHDRAWN 3 $325,553 9 $372,212 2 $343,505 FILES CLOSED FOR INCOMPLETENESS 3 $386,253 6 $367,732 4 $462,152
Aggregated Statistics For Year 2007(Based on 7 full and 10 partial tracts) A) Conventional B) Refinancings C) Non-occupant Loans on Number Average Value Number Average Value Number Average Value
LOANS ORIGINATED 33 $387,276 30 $445,796 2 $314,495 APPLICATIONS APPROVED, NOT ACCEPTED 8 $448,229 21 $462,685 0 $0 APPLICATIONS DENIED 2 $404,350 4 $358,770 0 $0 APPLICATIONS WITHDRAWN 9 $454,254 7 $402,940 4 $455,270 FILES CLOSED FOR INCOMPLETENESS 0 $0 1 $480,000 0 $0
Aggregated Statistics For Year 2006(Based on 7 full and 10 partial tracts) A) Conventional B) Refinancings C) Non-occupant Loans on Number Average Value Number Average Value Number Average Value
LOANS ORIGINATED 12 $455,597 25 $426,445 0 $0 APPLICATIONS APPROVED, NOT ACCEPTED 2 $221,420 8 $397,834 0 $0 APPLICATIONS DENIED 0 $0 1 $450,000 0 $0 APPLICATIONS WITHDRAWN 0 $0 2 $425,585 1 $475,170 FILES CLOSED FOR INCOMPLETENESS 0 $0 0 $0 0 $0
Aggregated Statistics For Year 2005(Based on 7 full and 8 partial tracts) A) Conventional B) Refinancings C) Non-occupant Loans on Number Average Value Number Average Value Number Average Value
LOANS ORIGINATED 31 $369,108 28 $352,359 1 $480,510 APPLICATIONS APPROVED, NOT ACCEPTED 5 $356,104 7 $369,543 2 $418,330 APPLICATIONS DENIED 2 $503,195 2 $402,950 0 $0 APPLICATIONS WITHDRAWN 0 $0 0 $0 0 $0 FILES CLOSED FOR INCOMPLETENESS 0 $0 0 $0 0 $0
Aggregated Statistics For Year 2004(Based on 7 full and 10 partial tracts) A) Conventional B) Refinancings C) Non-occupant Loans on Number Average Value Number Average Value Number Average Value
LOANS ORIGINATED 55 $326,164 42 $298,674 0 $0 APPLICATIONS APPROVED, NOT ACCEPTED 9 $351,104 38 $267,320 0 $0 APPLICATIONS DENIED 3 $284,557 1 $391,000 1 $168,150 APPLICATIONS WITHDRAWN 8 $356,612 5 $249,340 0 $0 FILES CLOSED FOR INCOMPLETENESS 0 $0 0 $0 0 $0
Aggregated Statistics For Year 2003(Based on 7 full and 10 partial tracts) A) Conventional B) Refinancings C) Non-occupant Loans on Number Average Value Number Average Value Number Average Value
LOANS ORIGINATED 133 $252,370 123 $219,785 6 $221,507 APPLICATIONS APPROVED, NOT ACCEPTED 14 $250,466 51 $212,102 4 $234,812 APPLICATIONS DENIED 2 $208,270 3 $196,803 2 $184,705 APPLICATIONS WITHDRAWN 6 $246,357 11 $189,953 3 $235,720 FILES CLOSED FOR INCOMPLETENESS 1 $256,000 1 $178,000 0 $0
Aggregated Statistics For Year 2002(Based on 7 full and 10 partial tracts) A) Conventional B) Refinancings C) Non-occupant Loans on Number Average Value Number Average Value Number Average Value
LOANS ORIGINATED 175 $223,827 124 $202,830 5 $190,286 APPLICATIONS APPROVED, NOT ACCEPTED 25 $204,635 41 $194,833 2 $193,495 APPLICATIONS DENIED 4 $226,370 3 $174,087 1 $268,020 APPLICATIONS WITHDRAWN 6 $191,647 8 $173,091 3 $154,507 FILES CLOSED FOR INCOMPLETENESS 0 $0 1 $308,620 0 $0
Aggregated Statistics For Year 2001(Based on 7 full and 10 partial tracts) A) Conventional B) Refinancings C) Non-occupant Loans on Number Average Value Number Average Value Number Average Value
LOANS ORIGINATED 166 $196,544 117 $182,447 5 $181,260 APPLICATIONS APPROVED, NOT ACCEPTED 44 $199,697 27 $177,518 0 $0 APPLICATIONS DENIED 11 $202,124 14 $172,941 1 $268,020 APPLICATIONS WITHDRAWN 4 $177,475 11 $190,973 0 $0 FILES CLOSED FOR INCOMPLETENESS 0 $0 0 $0 0 $0
Aggregated Statistics For Year 2000(Based on 7 full and 10 partial tracts) A) Conventional B) Refinancings C) Non-occupant Loans on Number Average Value Number Average Value Number Average Value
LOANS ORIGINATED 131 $174,024 44 $167,180 2 $202,405 APPLICATIONS APPROVED, NOT ACCEPTED 20 $175,538 18 $196,802 2 $202,405 APPLICATIONS DENIED 11 $153,695 7 $142,664 0 $0 APPLICATIONS WITHDRAWN 7 $198,241 2 $152,620 4 $202,405 FILES CLOSED FOR INCOMPLETENESS 1 $119,000 1 $176,190 1 $119,000
Aggregated Statistics For Year 1999(Based on 3 full and 7 partial tracts) A) Conventional B) Refinancings C) Non-occupant Loans on Number Average Value Number Average Value Number Average Value
LOANS ORIGINATED 55 $180,181 80 $156,482 2 $187,110 APPLICATIONS APPROVED, NOT ACCEPTED 5 $144,736 16 $163,660 0 $0 APPLICATIONS DENIED 6 $200,237 8 $163,015 1 $169,520 APPLICATIONS WITHDRAWN 3 $191,817 4 $158,180 0 $0 FILES CLOSED FOR INCOMPLETENESS 0 $0 1 $125,160 0 $0
Most common first names in zip code 90605 among deceased individuals Name Count Lived (average)
William 141 75.2 years Mary 137 79.1 years John 128 72.4 years Robert 120 71.6 years Charles 95 73.2 years James 93 73.8 years George 74 75.2 years Helen 71 76.2 years Frank 64 72.6 years Maria 64 75.8 years
Most common last names in zip code 90605 among deceased individuals Last name Count Lived (average)
Smith 53 77.5 years Johnson 39 74.3 years Brown 39 72.8 years Garcia 35 72.5 years Miller 35 73.2 years Lopez 30 75.9 years Martinez 30 69.9 years Rodriguez 28 71.7 years Martin 28 75.0 years Thompson 24 76.5 years
Businesses in zip code 90605
Name Count Name Count
7-Eleven 2 Little Caesars Pizza 1 Arby's 1 McDonald's 1 AutoZone 1 Nike 3 Avenue 1 Olive Garden 1 Baja Fresh Mexican Grill 1 Panda Express 1 Baskin-Robbins 1 Papa John's Pizza 1 Blockbuster 1 Payless 1 El Pollo Loco 2 Pizza Hut 1 Famous Footwear 1 RadioShack 1 FedEx 3 Staples 1 GNC 1 Starbucks 1 GameStop 1 T.J.Maxx 1 H&R Block 2 Toyota 1 Honda 1 U-Haul 1 Jack In The Box 2 UPS 3 Jones New York 1 Walgreens 1 Kroger 2


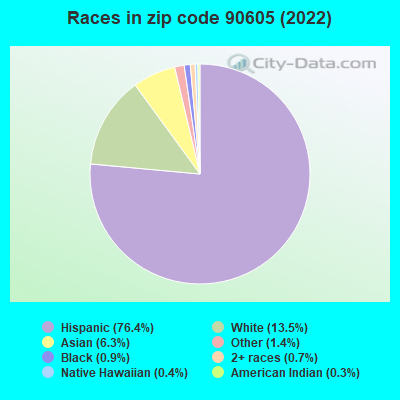


 Nearest zip codes: 90602, 90604, 90603, 90670, 90606, 90638.