Estimated zip code population in 2022: 45,786 Zip code population in 2010: 49,012 Zip code population in 2000: 47,548
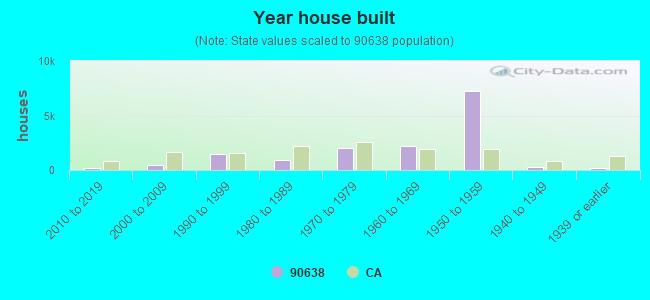
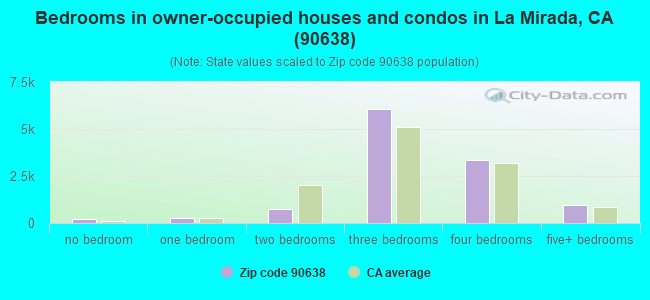
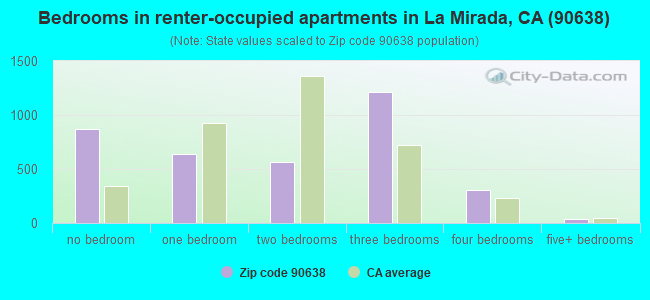
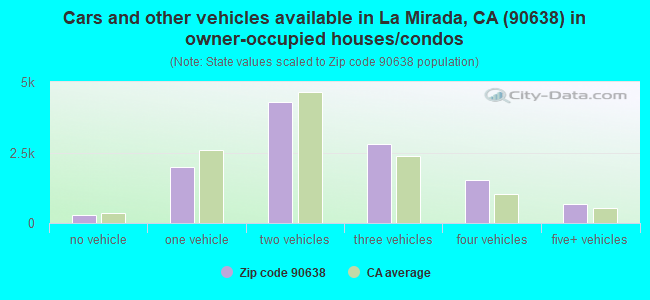
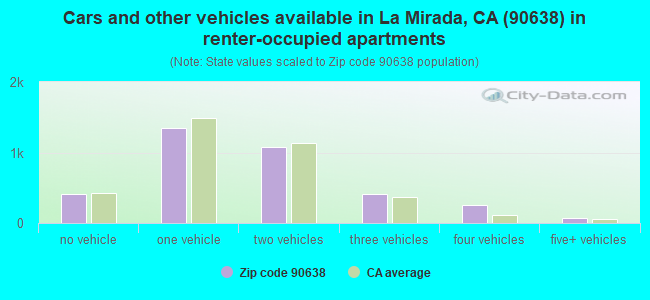
Houses and condos: 15,469 Renter-occupied apartments: 3,594
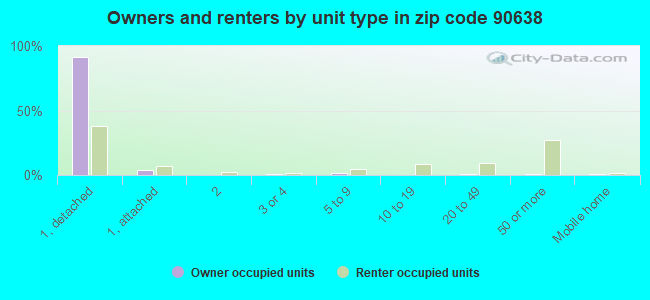
% of renters here:
24%
State:
44%
March 2022 cost of living index in zip code 90638: 133.0 (high, U.S. average is 100)
Land area: 7.9 sq. mi. Water area: 0.0 sq. mi.
Population density: 5,808 people per square mile
(average).
OSM Map
General Map
Google Map
MSN Map
OSM Map
General Map
Google Map
MSN Map
OSM Map
General Map
Google Map
MSN Map
OSM Map
General Map
Google Map
MSN Map
Please wait while loading the map...
Real estate property taxes paid for housing units in 2022:
This zip code:
0.7% ($5,223)
California:
0.7% ($4,831)
Median real estate property taxes paid for housing units with mortgages in 2022: $5,879 (0.8%) Median real estate property taxes paid for housing units with no mortgage in 2022: $3,886 (0.5%)
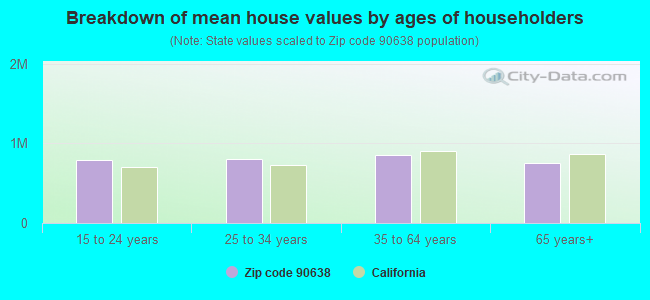
Estimated median house/condo value in 2022: $767,261
90638:
$767,261
California:
$715,900
According to our research of California and other state lists, there were 36 registered sex offenders living in 90638 zip code as of April 27, 2024. The ratio of all residents to sex offenders in zip code 90638 is 1,405 to 1. The ratio of registered sex offenders to all residents in this zip code is lower than the state average.
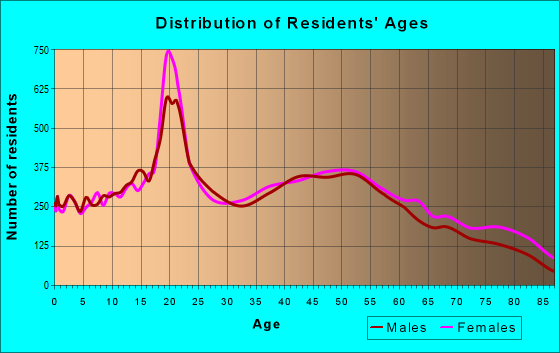
Median resident age:
This zip code:
43.7 years
California median age:
37.9 years
Average household size:
This zip code:
3.0 people
California:
2.8 people
Averages for the 2020 tax year for zip code 90638, filed in 2021:
Average Adjusted Gross Income (AGI) in 2020: $74,141 (Individual Income Tax Returns)
Here:
$74,141
State:
$95,910
Salary/wage: $68,165 (reported on 80.4% of returns)
Here:
$68,165
State:
$77,331
(% of AGI for various income ranges: 1152.4% for AGIs below $25k, 3681.5% for AGIs $25k-50k, 7124.7% for AGIs $50k-75k, 10660.1% for AGIs $75k-100k, 20969.2% for AGIs $100k-200k, 65442.0% for AGIs over 200k)
Taxable interest for individuals: $1,062 (reported on 42.0% of returns)
This zip code:
$1,062
California:
$2,294
(% of AGI for various income ranges: 24.0% for AGIs below $25k, 35.3% for AGIs $25k-50k, 63.7% for AGIs $50k-75k, 55.9% for AGIs $75k-100k, 124.9% for AGIs $100k-200k, 699.0% for AGIs over 200k)
Ordinary dividends: $4,007 (reported on 18.0% of returns)
Here:
$4,007
State:
$10,949
(% of AGI for various income ranges: 21.4% for AGIs below $25k, 36.9% for AGIs $25k-50k, 86.4% for AGIs $50k-75k, 92.8% for AGIs $75k-100k, 168.6% for AGIs $100k-200k, 1783.5% for AGIs over 200k)
Net capital gain/loss in AGI: +$11,584 (reported on 18.3% of returns)
Here:
+$11,584
State:
+$49,306
(% of AGI for various income ranges: 8.1% for AGIs below $25k, 30.8% for AGIs $25k-50k, 61.0% for AGIs $50k-75k, 132.2% for AGIs $75k-100k, 372.9% for AGIs $100k-200k, 8753.5% for AGIs over 200k)
Profit/loss from business: +$9,967 (reported on 16.2% of returns)
Here:
+$9,967
State:
+$15,671
(% of AGI for various income ranges: 136.9% for AGIs below $25k, 201.8% for AGIs $25k-50k, 252.9% for AGIs $50k-75k, 204.7% for AGIs $75k-100k, 387.1% for AGIs $100k-200k, 1588.8% for AGIs over 200k)
Taxable individual retirement arrangement distribution: $18,290 (reported on 7.9% of returns)
90638:
$18,290
California:
$23,505
(% of AGI for various income ranges: 60.1% for AGIs below $25k, 108.7% for AGIs $25k-50k, 217.0% for AGIs $50k-75k, 337.3% for AGIs $75k-100k, 467.7% for AGIs $100k-200k, 1436.0% for AGIs over 200k)
Self-employed (Keogh) retirement plans: $17,088 (reported on 0.3% of returns)
90638:
$17,088
California:
$30,163
(% of AGI for various income ranges: 5.2% for AGIs $25k-50k, 16.0% for AGIs $100k-200k, 197.8% for AGIs over 200k)
Total itemized deductions: $31,921 (reported on 21.1% of returns)
Here:
$31,921
State:
$39,517
(% of AGI for various income ranges: 106.5% for AGIs below $25k, 241.1% for AGIs $25k-50k, 808.6% for AGIs $50k-75k, 1506.1% for AGIs $75k-100k, 2777.2% for AGIs $100k-200k, 8699.5% for AGIs over 200k)
Charity contributions: $6,831 (reported on 18.3% of returns)
Here:
$6,831
State:
$12,598
(% of AGI for various income ranges: 6.6% for AGIs below $25k, 29.1% for AGIs $25k-50k, 93.1% for AGIs $50k-75k, 204.7% for AGIs $75k-100k, 474.8% for AGIs $100k-200k, 2720.2% for AGIs over 200k)
Taxes paid: $9,047 (reported on 21.1% of returns)
90638:
$9,047
State:
$8,807
(% of AGI for various income ranges: 22.6% for AGIs below $25k, 62.2% for AGIs $25k-50k, 229.0% for AGIs $50k-75k, 464.1% for AGIs $75k-100k, 856.1% for AGIs $100k-200k, 2038.8% for AGIs over 200k)
Earned income credit: $1,627 (reported on 10.0% of returns)
Here:
$1,627
State:
$2,074
(% of AGI for various income ranges: 50.0% for AGIs below $25k, 45.5% for AGIs $25k-50k, 0.7% for AGIs $50k-75k)
Percentage of individuals using paid preparers for their 2020 taxes: 92.8%
Here:
93%
State:
92%
(% for various income ranges: 91.9% for AGIs below $25k, 93.0% for AGIs $25k-50k, 93.2% for AGIs $50k-75k, 93.3% for AGIs $75k-100k, 93.3% for AGIs $100k-200k, 93.0% for AGIs over 200k)
Averages for the 2012 tax year for zip code 90638, filed in 2013:
Average Adjusted Gross Income (AGI) in 2012: $61,642 (Individual Income Tax Returns)
Here:
$61,642
State:
$72,726
Salary/wage: $57,092 (reported on 81.6% of returns)
Here:
$57,092
State:
$59,079
(% of AGI for various income ranges: 70.3% for AGIs below $25k, 75.3% for AGIs $25k-50k, 77.6% for AGIs $50k-75k, 78.6% for AGIs $75k-100k, 83.5% for AGIs $100k-200k, 54.7% for AGIs over 200k)
Taxable interest for individuals: $853 (reported on 42.9% of returns)
This zip code:
$853
California:
$2,146
(% of AGI for various income ranges: 1.4% for AGIs below $25k, 0.7% for AGIs $25k-50k, 0.6% for AGIs $50k-75k, 0.5% for AGIs $75k-100k, 0.4% for AGIs $100k-200k, 0.7% for AGIs over 200k)
Ordinary dividends: $3,353 (reported on 17.1% of returns)
Here:
$3,353
State:
$9,308
(% of AGI for various income ranges: 1.5% for AGIs below $25k, 0.9% for AGIs $25k-50k, 0.9% for AGIs $50k-75k, 0.8% for AGIs $75k-100k, 0.7% for AGIs $100k-200k, 1.5% for AGIs over 200k)
Net capital gain/loss in AGI: +$4,407 (reported on 14.4% of returns)
Here:
+$4,407
State:
+$30,460
(% of AGI for various income ranges: 0.2% for AGIs $50k-75k, 0.2% for AGIs $75k-100k, 0.9% for AGIs $100k-200k, 4.4% for AGIs over 200k)
Profit/loss from business: +$11,645 (reported on 16.1% of returns)
Here:
+$11,645
State:
+$17,064
(% of AGI for various income ranges: 9.9% for AGIs below $25k, 5.5% for AGIs $25k-50k, 2.8% for AGIs $50k-75k, 2.3% for AGIs $75k-100k, 1.5% for AGIs $100k-200k, 2.5% for AGIs over 200k)
Taxable individual retirement arrangement distribution: $14,432 (reported on 9.7% of returns)
90638:
$14,432
California:
$19,557
(% of AGI for various income ranges: 3.4% for AGIs below $25k, 2.7% for AGIs $25k-50k, 2.4% for AGIs $50k-75k, 2.6% for AGIs $75k-100k, 1.8% for AGIs $100k-200k, 2.0% for AGIs over 200k)
Self-employment retirement plans: $16,571 (reported on 0.3% of returns)
90638:
$16,571
California:
$24,530
Total itemized deductions: $26,879 (27% of AGI, reported on 44.8% of returns)
Here:
$26,879
State:
$34,004
Here:
26.6% of AGI
State:
22.7% of AGI
(% of AGI for various income ranges: 12.5% for AGIs below $25k, 15.3% for AGIs $25k-50k, 20.7% for AGIs $50k-75k, 22.0% for AGIs $75k-100k, 22.0% for AGIs $100k-200k, 16.9% for AGIs over 200k)
Charity contributions: $3,542 (reported on 39.0% of returns)
Here:
$3,542
State:
$4,659
(% of AGI for various income ranges: 0.9% for AGIs below $25k, 1.6% for AGIs $25k-50k, 2.2% for AGIs $50k-75k, 2.5% for AGIs $75k-100k, 2.6% for AGIs $100k-200k, 2.3% for AGIs over 200k)
Taxes paid: $8,900 (reported on 44.7% of returns)
90638:
$8,900
State:
$14,448
(% of AGI for various income ranges: 2.5% for AGIs below $25k, 3.4% for AGIs $25k-50k, 5.6% for AGIs $50k-75k, 6.6% for AGIs $75k-100k, 7.9% for AGIs $100k-200k, 8.0% for AGIs over 200k)
Earned income credit: $1,854 (reported on 13.2% of returns)
Here:
$1,854
State:
$2,286
(% of AGI for various income ranges: 4.3% for AGIs below $25k, 0.8% for AGIs $25k-50k)
Percentage of individuals using paid preparers for their 2012 taxes: 67.4%
Here:
67%
State:
64%
(% for various income ranges: 60.2% for AGIs below $25k, 67.0% for AGIs $25k-50k, 71.4% for AGIs $50k-75k, 73.5% for AGIs $75k-100k, 73.4% for AGIs $100k-200k, 79.6% for AGIs over 200k)
Averages for the 2004 tax year for zip code 90638, filed in 2005:
Average Adjusted Gross Income (AGI) in 2004: $50,675 (Individual Income Tax Returns)
Here:
$50,675
State:
$58,600
Salary/wage: $48,431 (reported on 82.0% of returns)
Here:
$48,431
State:
$49,455
(% of AGI for various income ranges: 118.3% for AGIs below $10k, 70.6% for AGIs $10k-25k, 78.6% for AGIs $25k-50k, 81.1% for AGIs $50k-75k, 84.9% for AGIs $75k-100k, 73.9% for AGIs over 100k)
Taxable interest for individuals: $1,212 (reported on 53.5% of returns)
This zip code:
$1,212
California:
$2,365
(% of AGI for various income ranges: 6.9% for AGIs below $10k, 2.7% for AGIs $10k-25k, 1.3% for AGIs $25k-50k, 1.0% for AGIs $50k-75k, 1.1% for AGIs $75k-100k, 1.1% for AGIs over 100k)
Taxable dividends: $1,985 (reported on 22.0% of returns)
Here:
$1,985
State:
$4,746
(% of AGI for various income ranges: 3.7% for AGIs below $10k, 1.6% for AGIs $10k-25k, 0.8% for AGIs $25k-50k, 0.7% for AGIs $50k-75k, 0.5% for AGIs $75k-100k, 0.9% for AGIs over 100k)
Net capital gain/loss: +$7,333 (reported on 18.1% of returns)
Here:
+$7,333
State:
+$23,418
(% of AGI for various income ranges: -2.7% for AGIs below $10k, 0.0% for AGIs $10k-25k, 0.3% for AGIs $25k-50k, 0.3% for AGIs $50k-75k, 0.8% for AGIs $75k-100k, 6.4% for AGIs over 100k)
Profit/loss from business: +$14,499 (reported on 16.7% of returns)
Here:
+$14,499
State:
+$16,826
(% of AGI for various income ranges: 9.9% for AGIs below $10k, 7.6% for AGIs $10k-25k, 5.4% for AGIs $25k-50k, 3.4% for AGIs $50k-75k, 3.0% for AGIs $75k-100k, 5.3% for AGIs over 100k)
IRA payment deduction: $3,375 (reported on 3.0% of returns)
90638:
$3,375
California:
$3,192
(% of AGI for various income ranges: 0.4% for AGIs below $10k, 0.2% for AGIs $10k-25k, 0.3% for AGIs $25k-50k, 0.2% for AGIs $50k-75k, 0.2% for AGIs $75k-100k, 0.2% for AGIs over 100k)
Self-employed pension: $14,510 (reported on 0.8% of returns)
Here:
$14,510
California:
$17,688
(% of AGI for various income ranges: 0.1% for AGIs $25k-50k, 0.1% for AGIs $50k-75k, 0.1% for AGIs $75k-100k, 0.4% for AGIs over 100k)
Total itemized deductions: $23,538 (30% of AGI, reported on 48.4% of returns)
Here:
$23,538
State:
$28,113
Here:
29.6% of AGI
State:
25.3% of AGI
(% of AGI for various income ranges: 20.3% for AGIs below $10k, 14.9% for AGIs $10k-25k, 20.6% for AGIs $25k-50k, 25.2% for AGIs $50k-75k, 26.1% for AGIs $75k-100k, 21.7% for AGIs over 100k)
Charity contributions deductions: $3,234 (4% of AGI, reported on 44.5% of returns)
Here:
$3,234
State:
$3,923
Here:
3.9% of AGI
State:
3.3% of AGI
(% of AGI for various income ranges: 1.0% for AGIs below $10k, 1.5% for AGIs $10k-25k, 2.4% for AGIs $25k-50k, 3.0% for AGIs $50k-75k, 3.2% for AGIs $75k-100k, 3.1% for AGIs over 100k)
Total tax: $6,353 (reported on 79.4% of returns)
90638:
$6,353
State:
$10,761
(% of AGI for various income ranges: 4.6% for AGIs below $10k, 4.4% for AGIs $10k-25k, 6.7% for AGIs $25k-50k, 7.8% for AGIs $50k-75k, 8.5% for AGIs $75k-100k, 14.5% for AGIs over 100k)
Earned income credit: $1,506 (reported on 9.8% of returns)
Here:
$1,506
State:
$1,763
Percentage of individuals using paid preparers for their 2004 taxes: 68.5%
Here:
69%
State:
66%
(% for various income ranges: 56.8% for AGIs below $10k, 66.0% for AGIs $10k-25k, 69.5% for AGIs $25k-50k, 73.7% for AGIs $50k-75k, 73.6% for AGIs $75k-100k, 75.2% for AGIs over 100k)
Likely homosexual households (counted as self-reported same-sex unmarried-partner households)
Lesbian couples: 0.0% of all households
Gay men: 0.7% of all households
Household received Food Stamps/SNAP in the past 12 months: 1,010 Household did not receive Food Stamps/SNAP in the past 12 months: 13,963
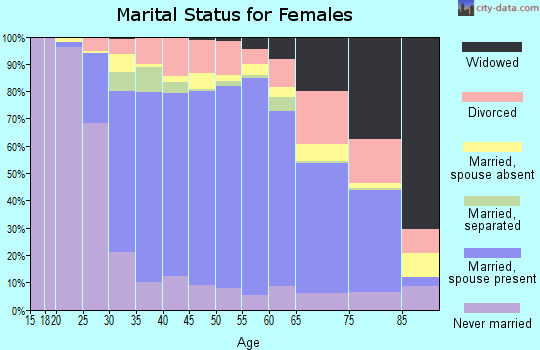
Women who had a birth in the past 12 months: 403 (329 now married, 72 unmarried) Women who did not have a birth in the past 12 months: 9,201 (3,719 now married, 5,478 unmarried)
Housing units in zip code 90638 with a mortgage: 7,739 (741 second mortgage, 31 home equity loan, 607 both second mortgage and home equity loan) Houses without a mortgage: 67
Median monthly owner costs for units with a mortgage: $2,735 Median monthly owner costs for units without a mortgage: $708
Residents with income below the poverty level in 2022:
This zip code:
6.1%
Whole state:
12.2%
Residents with income below 50% of the poverty level in 2022:
This zip code:
3.2%
Whole state:
6.2%
Median number of rooms in houses and condos:
Here:
6.0
State:
6.0
Median number of rooms in apartments:
Here:
4.1
State:
3.9
Notable locations in this zip code not listed on our city pages
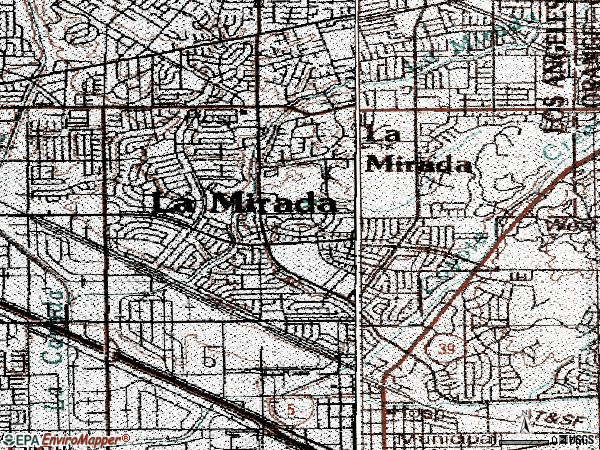
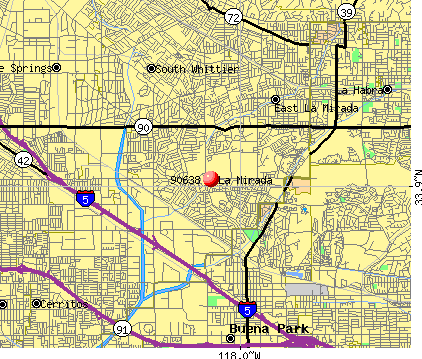
Notable locations in zip code 90638: La Mirada County Golf Course (A), La Mirada City Hall (B), La Mirada Branch County of Los Angeles Public Library (C), La Mirada Theatre For The Performing Arts (D), Los Angeles County Fire Department Station 49 (E). Display/hide their locations on the map
Shopping Centers: La Mirada Towne Center Shopping Center (1), Home Depot Shopping Center (2), Mirada West Shopping Center (3), Green Hills Plaza Shopping Center (4), Crossroad Shopping Center (5). Display/hide their locations on the map
Churches in zip code 90638 include: Prince of Peace Lutheran Church (A), Trinity Reformed Baptist Church (B), Saint Paul of the Cross Church (C), Mount Olive Lutheran Church (D), Church of Jesus Christ of Latter Day Saints (E), Foursquare Church of La Mirada (F), First Baptist Church (G), Calvary Orthodox Presbyterian CHurch (H), Christian Church of La Mirada (I). Display/hide their locations on the map
Parks in zip code 90638 include: Behringer Park (1), Frontier Park (2), La Mirada Park (3), Neff Park (4), Olive Lawn Memorial Park (5), Windermere Park (6), La Mirada Creek Park (7). Display/hide their locations on the map
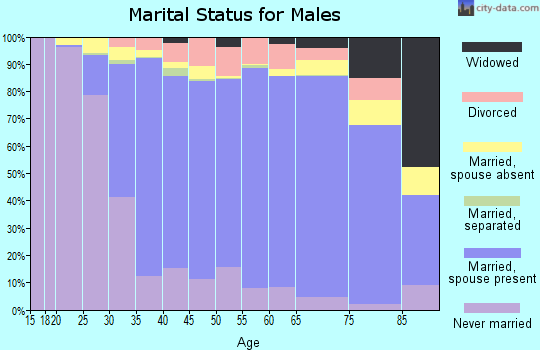
5,689 married couples with children.
1,681 single-parent households (858 men, 823 women).
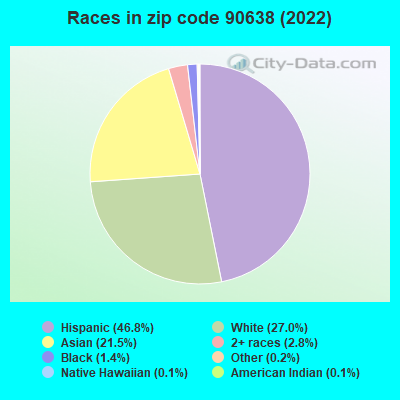
55.9% of residents of 90638 zip code speak English at home.
25.3% of residents speak Spanish at home (66% very well, 20% well, 12% not well, 2% not at all).
2.2% of residents speak other Indo-European language at home (73% very well, 26% well, 1% not at all).
16.7% of residents speak Asian or Pacific Island language at home (43% very well, 29% well, 26% not well, 3% not at all).
0.3% of residents speak other language at home (93% very well, 7% well).
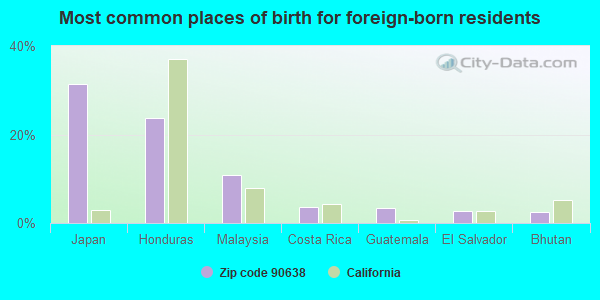
Foreign born population: 12,535 (27.4%) (73.7% of them are naturalized citizens)
This zip code:
27.4%
Whole state:
26.7%
31%Japan
24%Honduras
11%Malaysia
4%Costa Rica
3%Guatemala
3%El Salvador
3%Bhutan
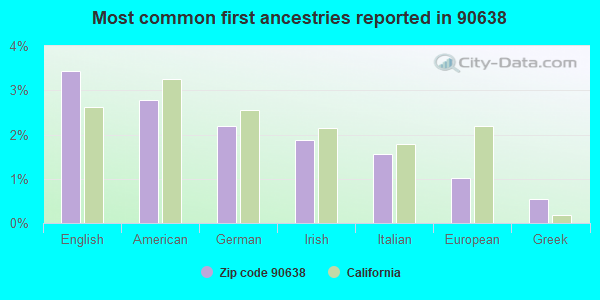
3%English
3%American
2%German
2%Irish
2%Italian
1%European
1%Greek
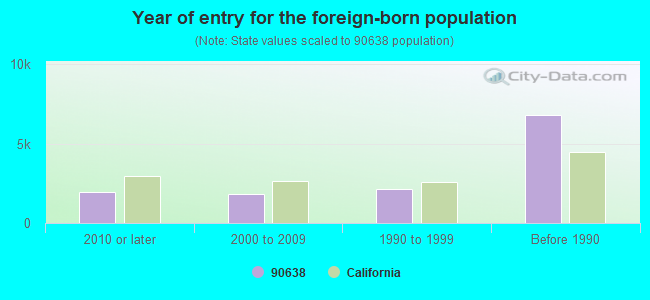
Year of entry for the foreign-born population
1,9312010 or later
1,8512000 to 2009
2,1191990 to 1999
6,807Before 1990
Major facilities with environmental interests located in this zip code:
AMADA MANUFACTURING AMERICA INCORPORATED (14646 NORTHAM ST. in LA MIRADA, CA)
AIR MINOR (AIRS/AFS) STATE MASTER (California - Hazardous Waste Tracking) - HAZARDOU WASTE PROGRAM FORMAL ENFORCEMENT ACTION (Integrated Compliance Information System) COMPLIANCE ACTIVITY (Tracking inspections of insecticide, fungicide, and rodenticide, and toxic substances) CRITERIA AND HAZARDOUS AIR POLLUTANT INVENTORY (Inventory of air pollution sources) HAZARDOUS WASTE BIENNIAL REPORTER (Resource Conservation and Recovery Act (tracking hazardous waste)) Large Quantity Generators, more that 1000 kg of hazardous waste/month (Resource Conservation and Recovery Act (tracking hazardous waste)) TRI REPORTER (Tracking of toxic chemicals releasing facilities) Business SIC classification: MACHINE TOOLS, METAL FORMING TYPES; METALWORKING MACHINERY Business NAICS classification: OTHER METALWORKING MACHINERY MANUFACTURING. Alternative names: U S SONOIKE CO INC
CATALINA FURNITURE COMPANY INCORPORATED (16930 VALLEY VIEW AVE. in LA MIRADA, CA)
ENFORCEMENT/COMPLIANCE ACTIVITY (Integrated Compliance Information System) - ICIS-09-1998-0108, FORMAL ENFORCEMENT ACTION (Integrated Compliance Information System) - ICIS-09-1998-0108, FORMAL ENFORCEMENT ACTION CRITERIA AND HAZARDOUS AIR POLLUTANT INVENTORY (Inventory of air pollution sources) TRI REPORTER (Tracking of toxic chemicals releasing facilities) Business SIC classification: WOOD HOUSEHOLD FURNITURE, EXCEPT UPHOLSTERED
HAYES LEMMERZ CORPORATION (14500 FIRESTONE BOULEVARD in LA MIRADA, CA)
STATE MASTER (California - Hazardous Waste Tracking) - HAZARDOU WASTE PROGRAM CRITERIA AND HAZARDOUS AIR POLLUTANT INVENTORY (Inventory of air pollution sources) HAZARDOUS WASTE BIENNIAL REPORTER (Resource Conservation and Recovery Act (tracking hazardous waste)) Large Quantity Generators, more that 1000 kg of hazardous waste/month (Resource Conservation and Recovery Act (tracking hazardous waste)) - notification TRI REPORTER (Tracking of toxic chemicals releasing facilities) Business SIC classification: MOTOR VEHICLE PARTS AND ACCESSORIES Organizations: HAYES LEMMERZ INTERNATIONAL INC. (CONTACT/OPERATOR)
, HAYS LEMMERZ INTERNATIONAL INC. (CONTACT/OWNER)
Alternative names: HAYES LEMMERZ INTL INC, HAYES-LEMMERZ INTL. CA. INC.
BABCOCK INC (14930 E ALONDRA AVE in LA MIRADA, CA)
STATE MASTER (California - Hazardous Waste Tracking) - HAZARDOU WASTE PROGRAM CRITERIA AND HAZARDOUS AIR POLLUTANT INVENTORY (Inventory of air pollution sources) HAZARDOUS WASTE BIENNIAL REPORTER (Resource Conservation and Recovery Act (tracking hazardous waste)) Large Quantity Generators, more that 1000 kg of hazardous waste/month (Resource Conservation and Recovery Act (tracking hazardous waste)) TRI REPORTER (Tracking of toxic chemicals releasing facilities) Business SIC classification: POWER, DISTRIBUTION, AND SPECIALTY TRANSFORMERS; ELECTRICAL INDUSTRIAL APPARATUS; ELECTRONIC COILS, TRANSFORMERS, AND OTHER INDUCTORS; ELECTRICAL MACHINERY, EQUIPMENT, AND SUPPLIES Business NAICS classification: RELAY AND INDUSTRIAL CONTROL MANUFACTURING.
EQUILON ENTERPRISES LLC (14220 FIRESTONE BLVD in LA MIRADA, CA) . Federal Facility
STATE MASTER (California - Hazardous Waste Tracking) - HAZARDOU WASTE PROGRAM Large Quantity Generators, more that 1000 kg of hazardous waste/month (Resource Conservation and Recovery Act (tracking hazardous waste)) Organizations: SHELL OIL PRODUCTS US (CONTACT/OPERATOR)
, EQUILON ENTERPRISES LLC DBA SHELL OIL PR (CONTACT/OWNER)
Alternative names: TEXACO SERVICE STATION
G I TRUCKING CO (14727 ALONDRA BLVD in LA MIRADA, CA)
STATE MASTER (California - Hazardous Waste Tracking) - HAZARDOU WASTE PROGRAM Small Quantity Generators, between 100 kg and 1000 kg of hazardous waste/month (Resource Conservation and Recovery Act (tracking hazardous waste)) - notification TRANSPORTER (Resource Conservation and Recovery Act (tracking hazardous waste)) - notification Organizations: GI TRUCKING CO (CONTACT/OWNER)
ELEGANT CLEANERS (15741 E IMPERIAL HWY in LA MIRADA, CA)
STATE MASTER (California - Hazardous Waste Tracking) - HAZARDOU WASTE PROGRAM Small Quantity Generators, between 100 kg and 1000 kg of hazardous waste/month (Resource Conservation and Recovery Act (tracking hazardous waste)) - notification Organizations: PATEL SUNIL (CONTACT/OWNER)
O I BROCKWAY PLASTICS INC (16050 CANARY AVE in LA MIRADA, CA)
STATE MASTER (California - Hazardous Waste Tracking) - HAZARDOU WASTE PROGRAM Small Quantity Generators, between 100 kg and 1000 kg of hazardous waste/month (Resource Conservation and Recovery Act (tracking hazardous waste)) - notification Organizations: BROCKWAY, INC (CONTACT/OWNER)
Alternative names: OWENS BROCKWAY PLASTIC PRODUCTS INC
CHEVRON USA NORTHAM STATION (16301 TROJAN WAY in LA MIRADA, CA)
STATE MASTER (California - Hazardous Waste Tracking) - HAZARDOU WASTE PROGRAM CRITERIA AND HAZARDOUS AIR POLLUTANT INVENTORY (Inventory of air pollution sources) Small Quantity Generators, between 100 kg and 1000 kg of hazardous waste/month (Resource Conservation and Recovery Act (tracking hazardous waste)) Business SIC classification: PETROLEUM BULK STATIONS AND TERMINALS Alternative names: CHEVRON USA INC NORTHAM STA
CHEVRON USA INC MURPHY TANK FARM (BEACH BLVD & IMPERIAL HWY in LA MIRADA, CA)
STATE MASTER (California - Hazardous Waste Tracking) - HAZARDOU WASTE PROGRAM Small Quantity Generators, between 100 kg and 1000 kg of hazardous waste/month (Resource Conservation and Recovery Act (tracking hazardous waste)) Alternative names: CHEVRON PIPE LINE COMPANY
CHEVRON 95868 (14240 E FIRESTONE BLVD in LA MIRADA, CA) . Federal Facility
STATE MASTER (California - Hazardous Waste Tracking) - HAZARDOU WASTE PROGRAM Small Quantity Generators, between 100 kg and 1000 kg of hazardous waste/month (Resource Conservation and Recovery Act (tracking hazardous waste)) - notification Organizations: CHEVRON USA PRODUCTS CO (CONTACT/OWNER)
Alternative names: CHEVRON STATION 9 5868
LA MIRADA CITY OF (15515 PHOEBE in LA MIRADA, CA)
STATE MASTER (California - Hazardous Waste Tracking) - HAZARDOU WASTE PROGRAM Small Quantity Generators, between 100 kg and 1000 kg of hazardous waste/month (Resource Conservation and Recovery Act (tracking hazardous waste)) - notification Organizations: CITY OF LA MIRADA (CONTACT/OWNER)
AMADA AMERICA INC (14921 E NORTHAM ST in LA MIRADA, CA)
STATE MASTER (California - Hazardous Waste Tracking) - HAZARDOU WASTE PROGRAM Small Quantity Generators, between 100 kg and 1000 kg of hazardous waste/month (Resource Conservation and Recovery Act (tracking hazardous waste)) - notification Alternative names: AMADA ENGINEERING AND SVC
Housing units lacking complete plumbing facilities: 0.4% Housing units lacking complete kitchen facilities: 2.2%
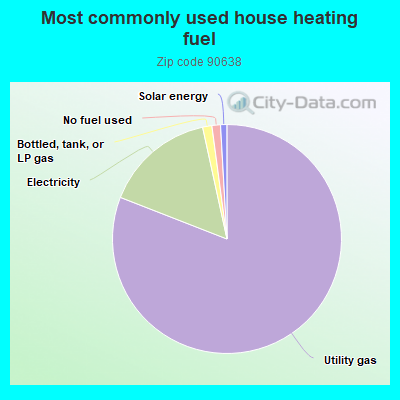
80.6%Utility gas
15.6%Electricity
1.3%Bottled, tank, or LP gas
1.2%No fuel used
0.9%Solar energy
Population in 1990: 40,452. Population change in the 1990s: +7,096 (+17.5%).
Place of birth for U.S.-born residents:
This state: 27,936
Northeast: 952
Midwest: 1,578
South: 1,464
West: 958
62% of the 90638 zip code residents lived in the same house 5 years ago. Out of people who lived in different houses, 67% lived in this county. Out of people who lived in different counties, 50% lived in California.
93% of the 90638 zip code residents lived in the same house 1 year ago. Out of people who lived in different houses, 58% moved from this county. Out of people who lived in different houses, 31% moved from different county within same state. Out of people who lived in different houses, 5% moved from different state. Out of people who lived in different houses, 9% moved from abroad.
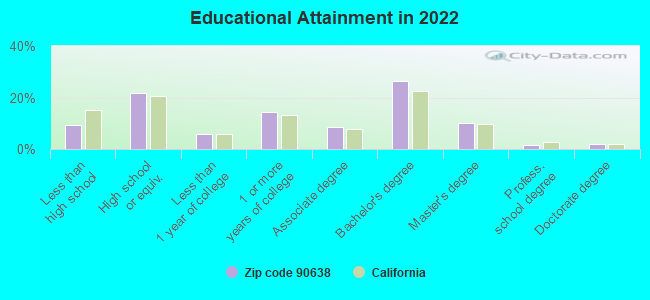
Private vs. public school enrollment:
Students in private schools in grades 1 to 8 (elementary and middle school): 888
Here:
21.3%
California:
10.5%
Students in private schools in grades 9 to 12 (high school): 197
Here:
8.1%
California:
8.5%
Students in private undergraduate colleges: 441
Here:
14.7%
California:
15.9%
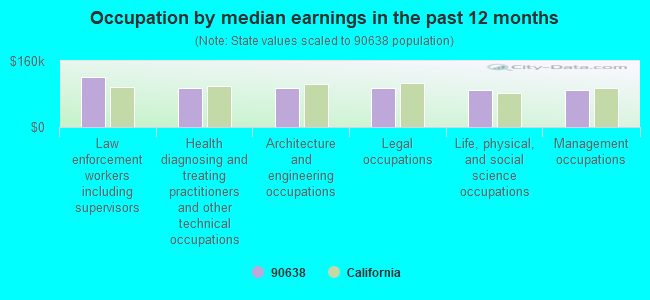
Occupation by median earnings in the past 12 months ($)
121,274Law enforcement workers including supervisors
95,436Health diagnosing and treating practitioners and other technical occupations
93,976Architecture and engineering occupations
93,753Legal occupations
90,635Life, physical, and social science occupations
88,976Management occupations
Companies with biggest federal contracts located in this zip code (LA MIRADA, CA):
U S FOODSERVICE, INC (15155 NORTHAM ST) : $122,547,331 in 3533 contractsfrom 1999 to 2006
Contracts for Dairy Foods and Eggs, Composite Food Packages, Radar Equipment, Airborne, Condiments and Related Products, and moreby Defense Logistics Agency, Army, Department of Veterans Affairs, Bureau of Prisoners/Federal Prison System, and others Signed by year:2000: $12,315,397; 2001: $21,652,951; 2002: $14,053,927; 2003: $3,873,514; 2004: $24,115,640; 2005: $30,983,211; 2006: $11,821,079.
Biggest contracts:
$1,847,195 with Defense Logistics Agency for Dairy Foods and Eggs. Signed on 2005-12-02. Completion date: 2005-12-30.
$956,760, same as above.Signed on 2005-12-12. Completion date: 2006-01-10.
$849,013, same as above.Signed on 2004-03-03. Completion date: 2004-03-03.
$808,751, same as above.Signed on 2005-01-10. Completion date: 2005-01-19.
PANACEA, INC (14700 FIRESTONE BLVD., SUI; small business) : $13,146,501 in 126 contractsfrom 2000 to 2006
Contracts for Operation of Government-Owned Facilities -- Restoration of real property, Other Architect and Engineering Services, Construction of Structures and Facilities -- Other Non-Building Facilities, Architect - Engineer Services (including landscaping, interior layout, and designing), and moreby Army, U.S. Army Corps of Engineers - civil program financing only, Bureau of Prisoners/Federal Prison System Signed by year:2000: $3,679,232; 2001: $3,218,586; 2002: $2,255,353; 2003: $1,083,023; 2004: $3,192,456; 2005: -$938,909; 2006: $656,760.
Biggest contracts:
$1,123,309 with Army for Operation of Government-Owned Facilities -- Restoration of real property. Signed on 2004-06-24. Completion date: 2005-04-29.
$806,400 with U.S. Army Corps of Engineers - civil program financing only for Other Architect and Engineering Services. Signed on 2001-04-18. Completion date: 2002-11-27.
$767,800 with U.S. Army Corps of Engineers - civil program financing only for Construction of Structures and Facilities -- Other Non-Building Facilities. Signed on 2000-09-30. Completion date: 2000-09-30.
$739,586 with U.S. Army Corps of Engineers - civil program financing only for Architect - Engineer Services (including landscaping, interior layout, and designing). Signed on 2002-09-25. Completion date: 2002-11-27.
ZEBRA EQUIPMENT, INC GROUP (14480 ALONDRA BLVD; small business) : $12,786,199 in 132 contractsfrom 2000 to 2006
Contracts for Cranes and Crane-Shovels, Miscellaneous Special Industry Machinery, Truck and Tractor Attachments, Miscellaneous Construction Equipment, and moreby Department of Defense, ENERGY, Department of, National Park Service, Air Force, and others Signed by year:2000: $3,036,193; 2001: $2,724,280; 2002: $3,210,318; 2003: $1,863,566; 2004: $1,485,184; 2005: $345,493; 2006: $121,165.
Biggest contracts:
$1,277,185 with Department of Defense for Cranes and Crane-Shovels. Signed on 2000-09-22. Completion date: 2000-12-31.
$674,687 with ENERGY, Department of for Miscellaneous Special Industry Machinery. Signed on 2003-09-15. Completion date: 2004-05-15.
$477,000 with ENERGY, Department of for Truck and Tractor Attachments. Signed on 2000-09-15. Completion date: 2001-03-15.
$423,000 with ENERGY, Department of for Miscellaneous Construction Equipment. Signed on 2002-09-15. Completion date: 2003-07-15.
BABCOCK INC (14930 ALONDRA BLVD; small business) : $3,530,744 in 73 contractsfrom 2000 to 2006
Contracts for Relays and Solenoids, Converters, Electrical, Nonrotating, Circuit Breakers, Optoelectronic Devices and Associated Hardware, and moreby Defense Logistics Agency, Navy Signed by year:2000: $42,287; 2001: $393,000; 2002: $861,147; 2003: $202,099; 2004: $561,415; 2005: $784,384; 2006: $686,412.
Biggest contracts:
$401,795 with Defense Logistics Agency for Relays and Solenoids. Signed on 2002-06-07. Completion date: 2002-12-06.
$281,200, same as above.Signed on 2001-04-03. Completion date: 2002-02-24.
$243,000 with Navy for Converters, Electrical, Nonrotating. Signed on 2006-03-24. Completion date: 2007-03-26.
$121,905 with Defense Logistics Agency for Relays and Solenoids. Signed on 2004-07-30. Completion date: 2005-05-06.
SEKAI ELECTRONICS INC (14600 INDUSTRY CIR; small business) : $2,853,377 in 36 contractsfrom 2000 to 2006
Contracts for Video Recording and Reproducing Equipment, Cameras, Motion Picture, Guns, through 30 mm, Radio and Television Communication Equipment, Airborne, and moreby Department of Defense, Navy, Army, Air Force, and others Signed by year:2000: $1,176,740; 2001: $109,720; 2002: $180,803; 2003: $493,352; 2004: $248,383; 2005: $594,419; 2006: $49,960.
Biggest contracts:
$406,320 with Department of Defense for Video Recording and Reproducing Equipment. Signed on 2000-04-04. Completion date: 2000-10-27.
$406,320, same as above.Signed on 2000-04-04. Completion date: 2000-11-21.
$355,553 with Navy for Video Recording and Reproducing Equipment. Signed on 2005-03-14. Completion date: 2005-04-14.
$260,000, same as above.Signed on 2003-03-31. Completion date: 2003-08-31.
GOLD COAST CRANE SERVICE 1 (14480 ALONDRA BLVD; small business) : $300,797 in 2 contractsin 2005
$283,297 with Navy for Lease or Rental of Equipment -- Materials Handling Equipment. Signed on 2005-03-03. Completion date: 2005-03-20.
$17,500, same as above.Signed on 2005-03-24. Completion date: 2005-03-20.
ELECTRO-MODULE INC (14930 ALONDRA BLVD; small business) : $259,883 in 6 contractsfrom 2004 to 2006
Contracts for Converters, Electrical, Nonrotating, Valves, Nonpowered by Navy Signed by year:2000: $0; 2001: $0; 2002: $0; 2003: $0; 2004: $62,500; 2005: $195,772; 2006: $1,611.
Biggest contracts:
$79,500 with Navy for Converters, Electrical, Nonrotating. Signed on 2005-03-30. Completion date: 2005-11-30.
$78,393, same as above.Signed on 2005-03-30. Completion date: 2005-11-30.
$47,500, same as above.Signed on 2004-11-10. Completion date: 2005-02-28.
$37,879, same as above.Signed on 2005-04-06. Completion date: 2005-11-30.
METALSOFT INC (14921 EAST NORTHAM ST; small business) : $150,670 in 11 contractsfrom 2004 to 2006
Contracts for Physical Properties Testing and Inspection, Maintenance, Repair and Rebuilding of Equipment -- Metalworking Machinery, ADP Software, by Army, Navy, NASA Signed by year:2000: $0; 2001: $0; 2002: $0; 2003: $0; 2004: $40,370; 2005: $93,300; 2006: $17,000.
Biggest contracts:
$85,000 with Army for Physical Properties Testing and Inspection. Signed on 2005-08-26. Completion date: 2005-09-29.
$17,000 with Army for Maintenance, Repair and Rebuilding of Equipment -- Metalworking Machinery. Signed on 2006-02-22. Completion date: 2007-02-22.
$17,000 with Army for Maintenance, Repair and Rebuilding of Equipment -- Metalworking Machinery. Taking place in TX. Signed on 2005-02-22. Completion date: 2006-02-25.
$17,000, same as above.Signed on 2004-01-27. Completion date: 2005-01-25.
SOLID STATE DEVICES INC (14701 FIRESTONE BLVD; small business) : $142,161 in 10 contractsfrom 2003 to 2006
Contracts for Semiconductor Devices and Associated Hardware by Army Signed by year:2000: $0; 2001: $0; 2002: $0; 2003: $11,711; 2004: $98,150; 2005: $19,000; 2006: $13,300.
Biggest contracts:
$42,000 with Army for Semiconductor Devices and Associated Hardware. Signed on 2004-02-10. Completion date: 2004-05-10.
$19,000, same as above.Signed on 2005-06-13. Completion date: 2005-08-22.
$13,300, same as above.Signed on 2006-05-02. Completion date: 2006-08-08.
$11,711, same as above.Signed on 2003-11-21. Completion date: 2003-12-05.
RELIANCE STEEL & ALUMINUM CO (15090 NORTHAM ST; small business) : $47,818 in 5 contractsfrom 2002 to 2005
Contracts for Plate, Sheet, Strip, Foil; and Leaf, Plate, Sheet, Strip, and Foil; Nonferrous Base Metal, Bars and Rods, Hose and Flexible Tubing by Navy, Army, Air Force Signed by year:2000: $0; 2001: $0; 2002: $17,190; 2003: $20,301; 2004: $0; 2005: $10,327; 2006: $0.
Biggest contracts:
$20,301 with Navy for Plate, Sheet, Strip, Foil; and Leaf. Signed on 2003-09-30. Completion date: 2003-10-30.
$13,950 with Army for Plate, Sheet, Strip, and Foil; Nonferrous Base Metal. Taking place in TN. Signed on 2002-01-30. Completion date: 2002-03-06.
$10,327 with Air Force for Bars and Rods. Signed on 2005-12-30. Completion date: 2006-03-01.
$3,240 with Army for Hose and Flexible Tubing. Signed on 2002-03-14. Completion date: 2002-03-20.
Top industries in this zip code by the number of employees in 2005:
Administrative and Support and Waste Management and Remediation Services: Employment Placement Agencies (over 1000 employees: 1 establishment, 5-9 employees: 1 establishment, 1-4 employees: 1 establishment)


 Nearest zip codes: 90604, 90621, 90603, 90605, 92833, 90620.