Estimated zip code population in 2022: 52,360 Zip code population in 2010: 51,767 Zip code population in 2000: 46,099
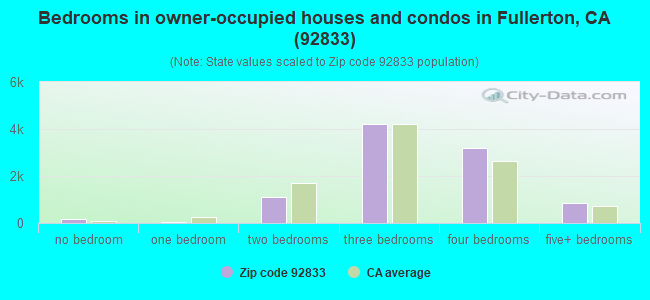
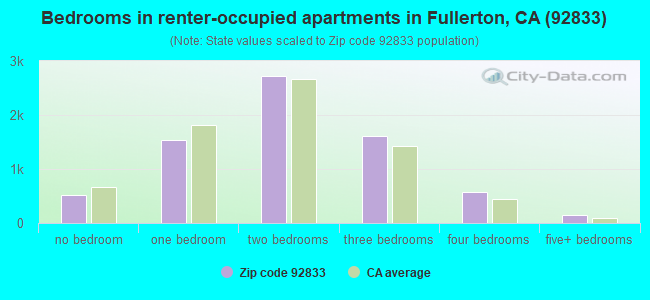
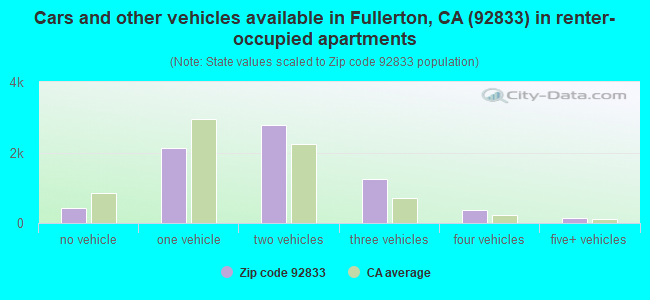
Houses and condos: 17,199 Renter-occupied apartments: 7,126
% of renters here:
43%
State:
44%
March 2022 cost of living index in zip code 92833: 86.9 (less than average, U.S. average is 100)
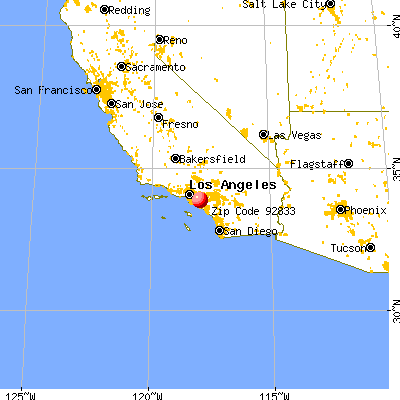
Land area: 7.3 sq. mi. Water area: 0.0 sq. mi.
Population density: 7,168 people per square mile
(high).
OSM Map
General Map
Google Map
MSN Map
OSM Map
General Map
Google Map
MSN Map
OSM Map
General Map
Google Map
MSN Map
OSM Map
General Map
Google Map
MSN Map
Please wait while loading the map...
Real estate property taxes paid for housing units in 2022:
This zip code:
0.7% ($5,654)
California:
0.7% ($4,831)
Median real estate property taxes paid for housing units with mortgages in 2022: $6,291 (0.8%) Median real estate property taxes paid for housing units with no mortgage in 2022: $3,222 (0.4%)
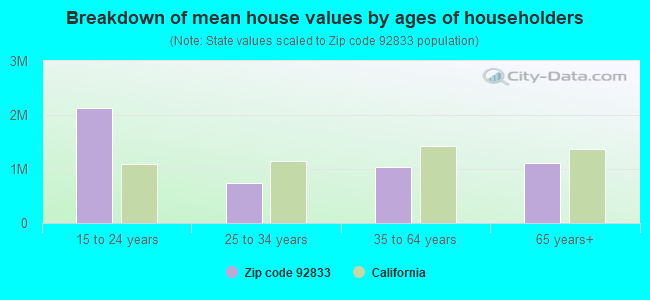
Estimated median house/condo value in 2022: $821,987
92833:
$821,987
California:
$715,900
According to our research of California and other state lists, there were 36 registered sex offenders living in 92833 zip code as of April 27, 2024. The ratio of all residents to sex offenders in zip code 92833 is 1,500 to 1. The ratio of registered sex offenders to all residents in this zip code is lower than the state average.
Median resident age:
This zip code:
37.4 years
California median age:
37.9 years
Average household size:
This zip code:
3.1 people
California:
2.8 people
Averages for the 2020 tax year for zip code 92833, filed in 2021:
Average Adjusted Gross Income (AGI) in 2020: $73,648 (Individual Income Tax Returns)
Here:
$73,648
State:
$95,910
Salary/wage: $63,738 (reported on 81.5% of returns)
Here:
$63,738
State:
$77,331
(% of AGI for various income ranges: 1182.7% for AGIs below $25k, 3860.9% for AGIs $25k-50k, 7378.4% for AGIs $50k-75k, 11458.4% for AGIs $75k-100k, 21022.2% for AGIs $100k-200k, 71094.9% for AGIs over 200k)
Taxable interest for individuals: $1,633 (reported on 36.1% of returns)
This zip code:
$1,633
California:
$2,294
(% of AGI for various income ranges: 23.7% for AGIs below $25k, 33.8% for AGIs $25k-50k, 45.0% for AGIs $50k-75k, 79.2% for AGIs $75k-100k, 163.0% for AGIs $100k-200k, 1447.4% for AGIs over 200k)
Ordinary dividends: $4,260 (reported on 18.3% of returns)
Here:
$4,260
State:
$10,949
(% of AGI for various income ranges: 15.9% for AGIs below $25k, 27.9% for AGIs $25k-50k, 57.8% for AGIs $50k-75k, 93.5% for AGIs $75k-100k, 238.5% for AGIs $100k-200k, 2189.4% for AGIs over 200k)
Net capital gain/loss in AGI: +$14,692 (reported on 18.8% of returns)
Here:
+$14,692
State:
+$49,306
(% of AGI for various income ranges: 13.3% for AGIs below $25k, 25.8% for AGIs $25k-50k, 81.2% for AGIs $50k-75k, 177.4% for AGIs $75k-100k, 534.4% for AGIs $100k-200k, 11203.4% for AGIs over 200k)
Profit/loss from business: +$10,637 (reported on 18.8% of returns)
Here:
+$10,637
State:
+$15,671
(% of AGI for various income ranges: 186.4% for AGIs below $25k, 238.2% for AGIs $25k-50k, 257.0% for AGIs $50k-75k, 330.2% for AGIs $75k-100k, 642.5% for AGIs $100k-200k, 1526.0% for AGIs over 200k)
Taxable individual retirement arrangement distribution: $25,884 (reported on 5.9% of returns)
92833:
$25,884
California:
$23,505
(% of AGI for various income ranges: 31.5% for AGIs below $25k, 65.4% for AGIs $25k-50k, 177.3% for AGIs $50k-75k, 249.1% for AGIs $75k-100k, 715.5% for AGIs $100k-200k, 2572.6% for AGIs over 200k)
Self-employed (Keogh) retirement plans: $31,811 (reported on 0.4% of returns)
92833:
$31,811
California:
$30,163
(% of AGI for various income ranges: 30.1% for AGIs $100k-200k, 484.3% for AGIs over 200k)
Total itemized deductions: $33,064 (reported on 16.4% of returns)
Here:
$33,064
State:
$39,517
(% of AGI for various income ranges: 71.8% for AGIs below $25k, 220.4% for AGIs $25k-50k, 606.3% for AGIs $50k-75k, 1213.8% for AGIs $75k-100k, 2683.7% for AGIs $100k-200k, 8412.6% for AGIs over 200k)
Charity contributions: $7,506 (reported on 13.8% of returns)
Here:
$7,506
State:
$12,598
(% of AGI for various income ranges: 4.0% for AGIs below $25k, 25.5% for AGIs $25k-50k, 84.1% for AGIs $50k-75k, 163.5% for AGIs $75k-100k, 475.4% for AGIs $100k-200k, 2395.1% for AGIs over 200k)
Taxes paid: $8,966 (reported on 16.4% of returns)
92833:
$8,966
State:
$8,807
(% of AGI for various income ranges: 15.7% for AGIs below $25k, 60.0% for AGIs $25k-50k, 167.2% for AGIs $50k-75k, 369.0% for AGIs $75k-100k, 780.5% for AGIs $100k-200k, 1951.7% for AGIs over 200k)
Earned income credit: $1,959 (reported on 13.8% of returns)
Here:
$1,959
State:
$2,074
(% of AGI for various income ranges: 75.5% for AGIs below $25k, 66.1% for AGIs $25k-50k, 1.5% for AGIs $50k-75k)
Percentage of individuals using paid preparers for their 2020 taxes: 93.3%
Here:
93%
State:
92%
(% for various income ranges: 92.2% for AGIs below $25k, 93.5% for AGIs $25k-50k, 93.8% for AGIs $50k-75k, 93.4% for AGIs $75k-100k, 94.1% for AGIs $100k-200k, 94.3% for AGIs over 200k)
Averages for the 2012 tax year for zip code 92833, filed in 2013:
Average Adjusted Gross Income (AGI) in 2012: $59,947 (Individual Income Tax Returns)
Here:
$59,947
State:
$72,726
Salary/wage: $53,175 (reported on 82.6% of returns)
Here:
$53,175
State:
$59,079
(% of AGI for various income ranges: 75.6% for AGIs below $25k, 81.1% for AGIs $25k-50k, 79.5% for AGIs $50k-75k, 79.5% for AGIs $75k-100k, 78.4% for AGIs $100k-200k, 53.7% for AGIs over 200k)
Taxable interest for individuals: $1,147 (reported on 36.8% of returns)
This zip code:
$1,147
California:
$2,146
(% of AGI for various income ranges: 0.9% for AGIs below $25k, 0.5% for AGIs $25k-50k, 0.6% for AGIs $50k-75k, 0.6% for AGIs $75k-100k, 0.6% for AGIs $100k-200k, 1.0% for AGIs over 200k)
Ordinary dividends: $3,937 (reported on 15.5% of returns)
Here:
$3,937
State:
$9,308
(% of AGI for various income ranges: 1.0% for AGIs below $25k, 0.6% for AGIs $25k-50k, 0.8% for AGIs $50k-75k, 0.8% for AGIs $75k-100k, 0.9% for AGIs $100k-200k, 1.7% for AGIs over 200k)
Net capital gain/loss in AGI: +$4,355 (reported on 13.6% of returns)
Here:
+$4,355
State:
+$30,460
(% of AGI for various income ranges: 0.2% for AGIs $50k-75k, 0.4% for AGIs $75k-100k, 0.5% for AGIs $100k-200k, 3.6% for AGIs over 200k)
Profit/loss from business: +$15,594 (reported on 19.4% of returns)
Here:
+$15,594
State:
+$17,064
(% of AGI for various income ranges: 14.8% for AGIs below $25k, 7.6% for AGIs $25k-50k, 4.3% for AGIs $50k-75k, 3.1% for AGIs $75k-100k, 3.2% for AGIs $100k-200k, 3.9% for AGIs over 200k)
Taxable individual retirement arrangement distribution: $18,793 (reported on 7.4% of returns)
92833:
$18,793
California:
$19,557
(% of AGI for various income ranges: 2.1% for AGIs below $25k, 1.8% for AGIs $25k-50k, 2.3% for AGIs $50k-75k, 2.4% for AGIs $75k-100k, 2.9% for AGIs $100k-200k, 2.0% for AGIs over 200k)
Self-employment retirement plans: $27,136 (reported on 0.5% of returns)
92833:
$27,136
California:
$24,530
(% of AGI for various income ranges: 0.1% for AGIs $50k-75k, 0.1% for AGIs $100k-200k, 0.8% for AGIs over 200k)
Total itemized deductions: $28,691 (26% of AGI, reported on 37.4% of returns)
Here:
$28,691
State:
$34,004
Here:
25.9% of AGI
State:
22.7% of AGI
(% of AGI for various income ranges: 10.6% for AGIs below $25k, 13.4% for AGIs $25k-50k, 18.4% for AGIs $50k-75k, 20.1% for AGIs $75k-100k, 21.0% for AGIs $100k-200k, 17.8% for AGIs over 200k)
Charity contributions: $4,249 (reported on 31.3% of returns)
Here:
$4,249
State:
$4,659
(% of AGI for various income ranges: 0.7% for AGIs below $25k, 1.2% for AGIs $25k-50k, 2.1% for AGIs $50k-75k, 2.2% for AGIs $75k-100k, 2.7% for AGIs $100k-200k, 2.9% for AGIs over 200k)
Taxes paid: $10,440 (reported on 37.3% of returns)
92833:
$10,440
State:
$14,448
(% of AGI for various income ranges: 2.1% for AGIs below $25k, 3.2% for AGIs $25k-50k, 5.0% for AGIs $50k-75k, 6.4% for AGIs $75k-100k, 7.9% for AGIs $100k-200k, 9.4% for AGIs over 200k)
Earned income credit: $2,207 (reported on 18.9% of returns)
Here:
$2,207
State:
$2,286
(% of AGI for various income ranges: 6.4% for AGIs below $25k, 1.3% for AGIs $25k-50k)
Percentage of individuals using paid preparers for their 2012 taxes: 69.4%
Here:
69%
State:
64%
(% for various income ranges: 67.1% for AGIs below $25k, 71.6% for AGIs $25k-50k, 70.4% for AGIs $50k-75k, 70.9% for AGIs $75k-100k, 68.7% for AGIs $100k-200k, 75.0% for AGIs over 200k)
Averages for the 2004 tax year for zip code 92833, filed in 2005:
Average Adjusted Gross Income (AGI) in 2004: $50,881 (Individual Income Tax Returns)
Here:
$50,881
State:
$58,600
Salary/wage: $46,059 (reported on 83.4% of returns)
Here:
$46,059
State:
$49,455
(% of AGI for various income ranges: 111.8% for AGIs below $10k, 77.7% for AGIs $10k-25k, 82.2% for AGIs $25k-50k, 80.4% for AGIs $50k-75k, 81.8% for AGIs $75k-100k, 66.6% for AGIs over 100k)
Taxable interest for individuals: $1,427 (reported on 46.7% of returns)
This zip code:
$1,427
California:
$2,365
(% of AGI for various income ranges: 5.9% for AGIs below $10k, 1.6% for AGIs $10k-25k, 1.0% for AGIs $25k-50k, 1.2% for AGIs $50k-75k, 1.0% for AGIs $75k-100k, 1.4% for AGIs over 100k)
Taxable dividends: $2,136 (reported on 19.2% of returns)
Here:
$2,136
State:
$4,746
(% of AGI for various income ranges: 2.7% for AGIs below $10k, 0.9% for AGIs $10k-25k, 0.6% for AGIs $25k-50k, 0.6% for AGIs $50k-75k, 0.7% for AGIs $75k-100k, 0.9% for AGIs over 100k)
Net capital gain/loss: +$11,962 (reported on 16.9% of returns)
Here:
+$11,962
State:
+$23,418
(% of AGI for various income ranges: -4.1% for AGIs below $10k, -0.0% for AGIs $10k-25k, 0.1% for AGIs $25k-50k, 0.5% for AGIs $50k-75k, 0.5% for AGIs $75k-100k, 9.4% for AGIs over 100k)
Profit/loss from business: +$16,710 (reported on 19.3% of returns)
Here:
+$16,710
State:
+$16,826
(% of AGI for various income ranges: 13.9% for AGIs below $10k, 11.6% for AGIs $10k-25k, 7.6% for AGIs $25k-50k, 6.2% for AGIs $50k-75k, 4.8% for AGIs $75k-100k, 5.2% for AGIs over 100k)
IRA payment deduction: $3,562 (reported on 3.3% of returns)
92833:
$3,562
California:
$3,192
(% of AGI for various income ranges: 0.2% for AGIs below $10k, 0.2% for AGIs $10k-25k, 0.3% for AGIs $25k-50k, 0.3% for AGIs $50k-75k, 0.3% for AGIs $75k-100k, 0.2% for AGIs over 100k)
Self-employed pension: $16,310 (reported on 0.9% of returns)
Here:
$16,310
California:
$17,688
(% of AGI for various income ranges: 0.1% for AGIs $10k-25k, 0.1% for AGIs $25k-50k, 0.1% for AGIs $50k-75k, 0.2% for AGIs $75k-100k, 0.5% for AGIs over 100k)
Total itemized deductions: $25,457 (29% of AGI, reported on 42.6% of returns)
Here:
$25,457
State:
$28,113
Here:
29.4% of AGI
State:
25.3% of AGI
(% of AGI for various income ranges: 20.5% for AGIs below $10k, 14.0% for AGIs $10k-25k, 18.9% for AGIs $25k-50k, 24.7% for AGIs $50k-75k, 24.3% for AGIs $75k-100k, 21.3% for AGIs over 100k)
Charity contributions deductions: $3,553 (4% of AGI, reported on 37.0% of returns)
Here:
$3,553
State:
$3,923
Here:
3.9% of AGI
State:
3.3% of AGI
(% of AGI for various income ranges: 1.1% for AGIs below $10k, 1.0% for AGIs $10k-25k, 1.8% for AGIs $25k-50k, 2.9% for AGIs $50k-75k, 3.0% for AGIs $75k-100k, 3.0% for AGIs over 100k)
Total tax: $7,338 (reported on 75.8% of returns)
92833:
$7,338
State:
$10,761
(% of AGI for various income ranges: 5.0% for AGIs below $10k, 4.6% for AGIs $10k-25k, 6.4% for AGIs $25k-50k, 8.1% for AGIs $50k-75k, 9.5% for AGIs $75k-100k, 16.1% for AGIs over 100k)
Earned income credit: $1,707 (reported on 14.6% of returns)
Here:
$1,707
State:
$1,763
Percentage of individuals using paid preparers for their 2004 taxes: 69.1%
Here:
69%
State:
66%
(% for various income ranges: 60.8% for AGIs below $10k, 69.7% for AGIs $10k-25k, 69.7% for AGIs $25k-50k, 72.9% for AGIs $50k-75k, 72.0% for AGIs $75k-100k, 71.7% for AGIs over 100k)
Likely homosexual households (counted as self-reported same-sex unmarried-partner households)
Lesbian couples: 0.1% of all households
Gay men: 0.2% of all households
Household received Food Stamps/SNAP in the past 12 months: 2,056 Household did not receive Food Stamps/SNAP in the past 12 months: 14,619
Women who had a birth in the past 12 months: 607 (497 now married, 108 unmarried) Women who did not have a birth in the past 12 months: 11,717 (5,020 now married, 6,681 unmarried)
Housing units in zip code 92833 with a mortgage: 6,752 (687 second mortgage, 61 home equity loan, 537 both second mortgage and home equity loan) Houses without a mortgage: 154
Median monthly owner costs for units with a mortgage: $2,967 Median monthly owner costs for units without a mortgage: $720
Residents with income below the poverty level in 2022:
This zip code:
10.3%
Whole state:
12.2%
Residents with income below 50% of the poverty level in 2022:
This zip code:
5.4%
Whole state:
6.2%
Median number of rooms in houses and condos:
Here:
6.1
State:
6.0
Median number of rooms in apartments:
Here:
4.1
State:
3.9
Notable locations in this zip code not listed on our city pages
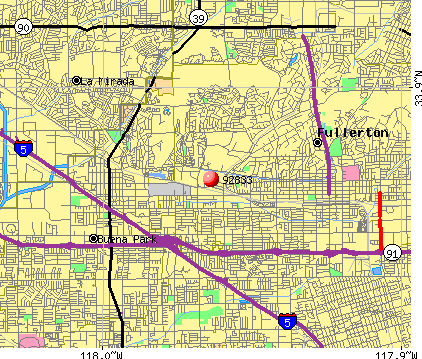
Notable locations in zip code 92833: Hunt Public Library (A), Muckenthaler Cultural Center (B), Orange County Fire Authority Station 41 (C), Fullerton Fire Department Station 6 (D), Fullerton Fire Department Station 2 (E). Display/hide their locations on the map
Shopping Centers: Sunrise Valley Shopping Center (1), Camino Del Sol Shopping Center (2), West Fullerton Shopping Center (3). Display/hide their locations on the map
Churches in zip code 92833 include: Spiritual Rock Church (A), First Korean Baptist Church (B), Grace Bible Chapel (C), New Wine Church (D), Orangethorpe Christian Church (E), Saint Luke Lutheran Church (F), Saint Philips Church (G), True Love Lutheran Church (H), West Fullerton Baptist Church (I). Display/hide their locations on the map
Parks in zip code 92833 include: Adlena Park (1), Simpson Park (2), Coyote Hills Park (3), Edward White Park (4), Emery Park (5), Fern Drive Park (6), Roger Chaffee Park (7), Virgil Grissom Park (8), West Coyote Hills Tree Park (9). Display/hide their locations on the map
7,963 married couples with children.
2,025 single-parent households (691 men, 1,334 women).
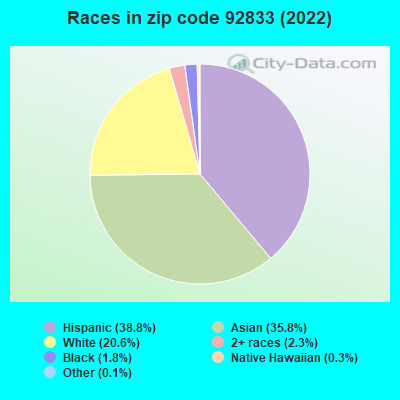
45.1% of residents of 92833 zip code speak English at home.
24.0% of residents speak Spanish at home (64% very well, 17% well, 14% not well, 5% not at all).
2.5% of residents speak other Indo-European language at home (60% very well, 28% well, 11% not well, 1% not at all).
27.5% of residents speak Asian or Pacific Island language at home (45% very well, 31% well, 22% not well, 2% not at all).
0.8% of residents speak other language at home (85% very well, 3% well, 11% not well).
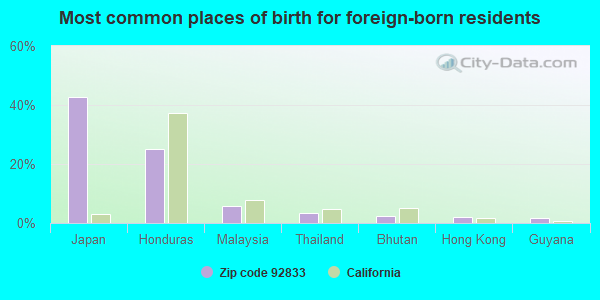
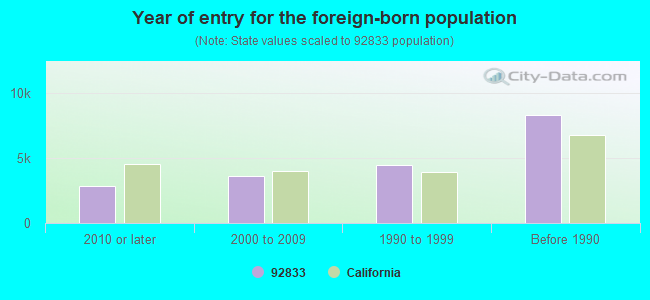
Foreign born population: 19,110 (36.5%) (63.0% of them are naturalized citizens)
Major facilities with environmental interests located in this zip code:
GUARDIAN INDUSTRIES CORPORATION (1901 RAYMER AVE in FULLERTON, CA)
AIR MAJOR (AIRS/AFS) STATE MASTER (California - Hazardous Waste Tracking) - HAZARDOU WASTE PROGRAM CRITERIA AND HAZARDOUS AIR POLLUTANT INVENTORY (Inventory of air pollution sources) HAZARDOUS WASTE BIENNIAL REPORTER (Resource Conservation and Recovery Act (tracking hazardous waste)) Large Quantity Generators, more that 1000 kg of hazardous waste/month (Resource Conservation and Recovery Act (tracking hazardous waste)) Business SIC and NAICS classification: FLAT GLASS
HUGHES AIRCRAFT COMPANY (651 NORTH GILBERT AVENUE in FULLERTON, CA)
STATE MASTER (California - Hazardous Waste Tracking) - HAZARDOU WASTE PROGRAM HAZARDOUS WASTE BIENNIAL REPORTER (Resource Conservation and Recovery Act (tracking hazardous waste)) Large Quantity Generators, more that 1000 kg of hazardous waste/month (Resource Conservation and Recovery Act (tracking hazardous waste)) - notification Organizations: RAYTHEON CO (CONTACT/OWNER)
Alternative names: RAYTHEON SYSTEMS CO
FULLERTON DIESEL ELECTRIC (1889 W COMMONWEALTH AVE STE P in FULLERTON, CA) . Federal Facility
STATE MASTER (California - Hazardous Waste Tracking) - HAZARDOU WASTE PROGRAM Small Quantity Generators, between 100 kg and 1000 kg of hazardous waste/month (Resource Conservation and Recovery Act (tracking hazardous waste)) - notification Small Quantity Generators, between 100 kg and 1000 kg of hazardous waste/month (Resource Conservation and Recovery Act (tracking hazardous waste)) - notification Organizations: DOUG KEMMLING (CONTACT/OWNER)
FULLERTON DODGE (1110 W ORANGETHROPE AVENUE in FULLERTON, CA)
STATE MASTER (California - Hazardous Waste Tracking) - HAZARDOU WASTE PROGRAM Small Quantity Generators, between 100 kg and 1000 kg of hazardous waste/month (Resource Conservation and Recovery Act (tracking hazardous waste)) - notification Organizations: CHRYSLER CORP (CONTACT/OWNER)
G&L MUSICAL PRODUCTS (2548 E FENDER AVE in FULLERTON, CA)
STATE MASTER (California - Hazardous Waste Tracking) - HAZARDOU WASTE PROGRAM Small Quantity Generators, between 100 kg and 1000 kg of hazardous waste/month (Resource Conservation and Recovery Act (tracking hazardous waste)) - notification Business NAICS classification: MUSICAL INSTRUMENT MANUFACTURING. Organizations: JOHN MCLAREN SR (CONTACT/OWNER)
Alternative names: G AND L MUSICAL INSTRUMENTS
MOREHOUSE INDUSTRIES INCORPORATED (1600 WEST COMMONWEALTH AVENUE in FULLERTON, CA)
STATE MASTER (California - Hazardous Waste Tracking) - HAZARDOU WASTE PROGRAM Small Quantity Generators, between 100 kg and 1000 kg of hazardous waste/month (Resource Conservation and Recovery Act (tracking hazardous waste)) Business NAICS classification: ALL OTHER INDUSTRIAL MACHINERY MANUFACTURING. Alternative names: MOREHOUSE-COWLES
FERN DRIVE ELEMENTARY (1400 W. FERN DR. in FULLERTON, CA)
(National Center for Education Statistics) - STATE ID-6028039 Organizations: FULLERTON ELEMENTARY (SCHOOL DISTRICT)
NICOLAS JUNIOR HIGH (1100 W. OLIVE AVE. in FULLERTON, CA)
(National Center for Education Statistics) - STATE ID-6028104 Organizations: FULLERTON ELEMENTARY (SCHOOL DISTRICT)
HUGHES AIRCRAFT COMPANY (1901 W MALVERN AVE in FULLERTON, CA)
COMPLIANCE ACTIVITY (Tracking inspections of insecticide, fungicide, and rodenticide, and toxic substances) CRITERIA AND HAZARDOUS AIR POLLUTANT INVENTORY (Inventory of air pollution sources) TSD (Resource Conservation and Recovery Act (tracking hazardous waste)) - notification TRI REPORTER (Tracking of toxic chemicals releasing facilities) Business SIC classification: ELECTROPLATING, PLATING, POLISHING, ANODIZING, AND COLORING; COMMUNICATIONS EQUIPMENT; PRINTED CIRCUIT BOARDS; ELECTRONIC COMPONENTS Alternative names: HUGHES AIRCRAFT CO. FULLERTON BUSINESS UNIT, HUGHES AIRCRAFT GROUND SYSTEMS GROUP, HUGHES AIRCRAFT GROUND SYST GROUP, HUGHES AIRCRFT
LORD LABEL AND MANUFACTURING COMPANY OF CA (531 AIRPARK DRIVE in FULLERTON, CA)
(Resource Conservation and Recovery Act (tracking hazardous waste)) Organizations: LORD LABEL AND MFG CO OF CA (CONTACT/OWNER)
FULLERTON AUTO REPAIR (516 NORTH GILBERT STREET in FULLERTON, CA)
Small Quantity Generators, between 100 kg and 1000 kg of hazardous waste/month (Resource Conservation and Recovery Act (tracking hazardous waste)) - notification Business NAICS classification: GENERAL AUTOMOTIVE REPAIR. Organizations: VARTAN GHARIBIAN (CONTACT/OWNER)
Alternative names: FULLERTON AUTO RPR
HUGHES AIRCRAFT CO (2011 RAYMER AVE in FULLERTON, CA)
Small Quantity Generators, between 100 kg and 1000 kg of hazardous waste/month (Resource Conservation and Recovery Act (tracking hazardous waste)) - notification
KENNEDY AUTO (1000 WEST WILLIAMSON in FULLERTON, CA)
Small Quantity Generators, between 100 kg and 1000 kg of hazardous waste/month (Resource Conservation and Recovery Act (tracking hazardous waste)) - notification Organizations: MARVIN L KENNEDY (CONTACT/OWNER)
Housing units lacking complete plumbing facilities: 0.3% Housing units lacking complete kitchen facilities: 2.3%
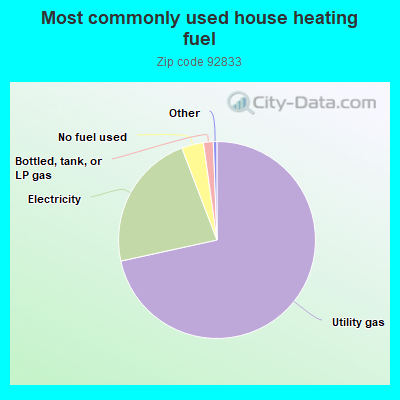
71.5%Utility gas
22.6%Electricity
3.6%No fuel used
1.6%Bottled, tank, or LP gas
Place of birth for U.S.-born residents:
This state: 27,969
Northeast: 1,126
Midwest: 2,012
South: 928
West: 813
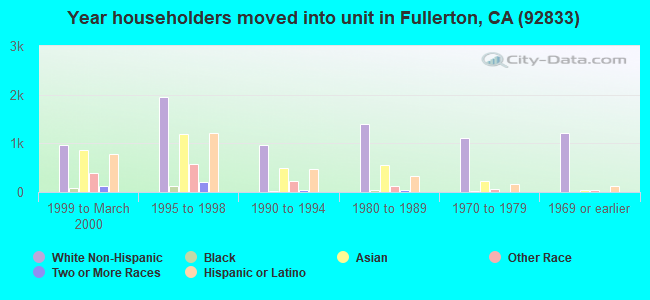
55% of the 92833 zip code residents lived in the same house 5 years ago. Out of people who lived in different houses, 68% lived in this county. Out of people who lived in different counties, 50% lived in California.
91% of the 92833 zip code residents lived in the same house 1 year ago. Out of people who lived in different houses, 58% moved from this county. Out of people who lived in different houses, 30% moved from different county within same state. Out of people who lived in different houses, 6% moved from different state. Out of people who lived in different houses, 7% moved from abroad.
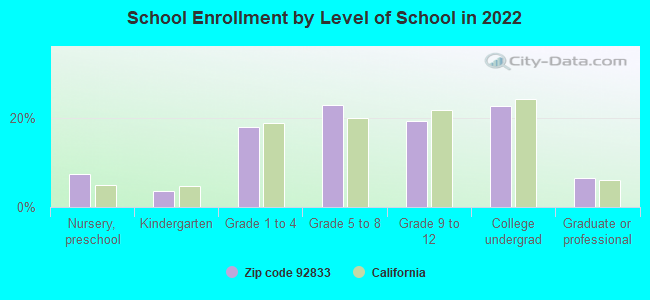
Private vs. public school enrollment:
Students in private schools in grades 1 to 8 (elementary and middle school): 358
Here:
6.4%
California:
10.5%
Students in private schools in grades 9 to 12 (high school): 123
Here:
4.6%
California:
8.5%
Students in private undergraduate colleges: 507
Here:
16.1%
California:
15.9%
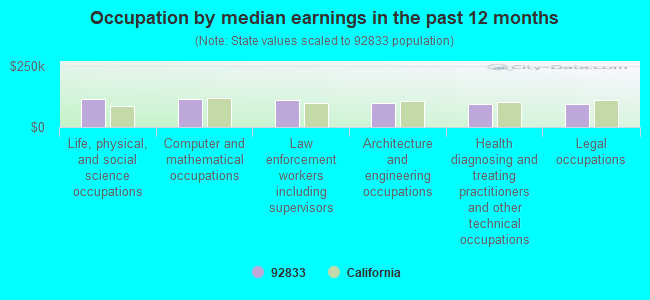
Occupation by median earnings in the past 12 months ($)
112,467Life, physical, and social science occupations
112,459Computer and mathematical occupations
109,679Law enforcement workers including supervisors
97,603Architecture and engineering occupations
94,781Health diagnosing and treating practitioners and other technical occupations
92,715Legal occupations
Companies with biggest federal contracts located in this zip code (FULLERTON, CA):
TREND WESTERN TECHNICAL CORP (4128 W COMMONWEALTH AVE; small business) : $170,777,075 in 199 contractsfrom 1999 to 2006
Contracts for Facilities Operations Support Services, Operation of Government-Owned Facilities -- Miscellaneous Buildings, Other Management Support Services, Other Vehicle Charter for Transportation of Things, and moreby Air Force Signed by year:2000: $16,339,708; 2001: $17,318,627; 2002: $34,254,106; 2003: $30,489,262; 2004: $25,678,135; 2005: $28,231,248; 2006: $2,549,676.
Biggest contracts:
$14,611,966 with Air Force for Facilities Operations Support Services. Taking place in TX. Signed on 2005-10-01. Completion date: 2006-09-30.
$13,086,186, same as above.Signed on 2004-10-01. Completion date: 2005-09-30.
$13,077,803, same as above.Signed on 2003-10-01. Completion date: 2004-09-30.
$11,532,273, same as above.Signed on 2002-10-01. Completion date: 2003-09-30.
CONAGRA GROCERY PRODUCTS COMPA (1645 W VALENCIA DR) : $148,210,387 in 44 contractsfrom 1999 to 2006
Contracts for Food Items For Resale, Fruits and Vegetables by Defense Commissary Agency, Department of Defense, Agricultural Marketing Service, Agricultural Marketing Service (disused code), and others Signed by year:2000: $9,753,897; 2001: $17,527,651; 2002: $28,995,452; 2003: $11,866,415; 2004: $40,124,626; 2005: $34,390,462; 2006: $200.
Biggest contracts:
$23,062,503 with Defense Commissary Agency for Food Items For Resale. Signed on 2004-10-01. Completion date: 2005-02-28.
$23,056,093, same as above.Signed on 2005-04-01. Completion date: 2005-08-31.
$15,931,385 with Department of Defense for Food Items For Resale. Signed on 2002-10-01. Completion date: 2003-05-31.
$11,025,111 with Defense Commissary Agency for Food Items For Resale. Signed on 2005-01-01. Completion date: 2005-03-31.
RAYTHEON COMPANY (1801 WEST HUGHES DRIVE) : $97,948,188 in 88 contractsfrom 2001 to 2006
Contracts for Radio Navigation Equipment, Except Airborne, Maintenance, Repair and Rebuilding of Equipment -- Communication, Detection, and Coherent Radiation Equipment, Other Professional Services, Aircraft Air Conditioning, Heating, and Pressurizing Equipment, and moreby Army, Federal Technology Service, Navy, Air Force, and others Signed by year:2000: $0; 2001: $1,299,645; 2002: $180,260; 2003: $3,756,115; 2004: $50,534,321; 2005: $10,674,753; 2006: $31,503,094.
Biggest contracts:
$15,190,700 with Army for Radio Navigation Equipment, Except Airborne. Signed on 2006-04-12. Completion date: 2010-12-31.
$11,562,525, same as above.Signed on 2003-07-24. Completion date: 2000-09-30.
$9,518,702, same as above.Signed on 2004-06-23. Completion date: 2000-09-30.
$9,334,962, same as above.Signed on 2004-02-12. Completion date: 2000-09-30.
RAYTHEON COMPANY (1901 W MLVERN 1801 HUGHES; small business) : $43,151,993 in 58 contractsfrom 1999 to 2005
Contracts for Guns, through 30 mm, Electronic Countermeasures, Counter-Countermeasures and Quick Reaction Capability Equipment, Video Recording and Reproducing Equipment, Filters and Networks, and moreby Navy, Defense Logistics Agency, Air Force, Army, and others Signed by year:2000: $28,853,302; 2001: $2,638,644; 2002: $3,995,101; 2003: $501,970; 2004: $0; 2005: $85,601; 2006: $0.
Biggest contracts:
$7,500,000 with Navy for Guns, through 30 mm. Signed on 2000-03-01. Completion date: 2000-06-30.
$5,071,478 with Navy for Electronic Countermeasures, Counter-Countermeasures and Quick Reaction Capability Equipment. Signed on 2000-01-18. Completion date: 1999-12-31.
$5,053,550 with Navy for Video Recording and Reproducing Equipment. Taking place in RI. Signed on 2000-03-28. Completion date: 2000-08-25.
$4,050,000 with Navy for Electronic Countermeasures, Counter-Countermeasures and Quick Reaction Capability Equipment. Signed on 2000-03-09. Completion date: 1999-12-31.
RAYTHEON COMPANY (INC) (1901 MALVERN AVE 618) : $8,219,496 in 50 contractsfrom 1999 to 2006
Contracts for Modification of Equipment -- Communication, Detection, and Coherent Radiation Equipment, Systems Engineering Services, Engineering and Technical Services, Other Research and Development -- Basic Research (R&D), and moreby Navy, Air Force, Army, Defense Logistics Agency, and others Signed by year:2000: $2,912,516; 2001: $2,844,000; 2002: $1,702,437; 2003: $0; 2004: -$290,161; 2005: $12,034; 2006: -$3,324.
Biggest contracts:
$1,554,169 with Navy for Modification of Equipment -- Communication, Detection, and Coherent Radiation Equipment. Taking place in VA. Signed on 2000-02-16. Completion date: 2000-04-30.
$1,210,000 with Navy for Systems Engineering Services. Signed on 2000-01-05. Completion date: 2000-09-30.
$1,044,700 with Air Force for Engineering and Technical Services. Signed on 2002-03-08. Completion date: 2002-09-30.
$745,000 with Navy for Systems Engineering Services. Signed on 2001-10-10. Completion date: 2002-09-30.
HYDRAFLOW (1881 W MALVERN AVE; small business) : $6,298,864 in 132 contractsfrom 1999 to 2006
Contracts for Hose and Flexible Tubing, Bakery and Cereal Products, Miscellaneous Electric Power and Distribution Equipment, Miscellaneous Items, and moreby Navy, Defense Logistics Agency Signed by year:2000: $1,011,354; 2001: $679,318; 2002: $1,181,242; 2003: $1,167,415; 2004: $398,174; 2005: $749,344; 2006: $546,892.
Biggest contracts:
$813,796 with Navy for Hose and Flexible Tubing. Signed on 2003-02-04. Completion date: 2003-12-05.
$357,295, same as above.Signed on 2002-03-15. Completion date: 2002-09-08.
$332,132 with Defense Logistics Agency for Hose and Flexible Tubing. Signed on 2001-12-07. Completion date: 2002-04-06.
$316,846 with Navy for Hose and Flexible Tubing. Signed on 2002-03-08. Completion date: 2002-09-30.
SITMATIC (1800 RAYMER AVE) : $2,562,589 in 90 contractsfrom 2000 to 2006
Contracts for Office Furniture, Miscellaneous Furniture and Fixtures, Medical and Surgical Instruments, Equipment, and Supplies, Maintenance, Repair or Alteration of Real Property -- Miscellaneous Buildings, and moreby Department of Veterans Affairs, Army, Air Force, Federal Supply Service, and others Signed by year:2000: $248,826; 2001: $522,000; 2002: $310,682; 2003: $292,302; 2004: $270,641; 2005: $579,922; 2006: $338,216.
Biggest contracts:
$447,000 with Department of Veterans Affairs for Office Furniture. Signed on 2001-01-15. Completion date: 2001-02-15.
$154,381, same as above.Signed on 2006-05-05. Completion date: 2006-08-02.
$150,000 with Department of Veterans Affairs for Office Furniture. Taking place in OH. Signed on 2004-03-11. Completion date: 2005-09-30.
$142,890 with Department of Veterans Affairs for Office Furniture. Signed on 2005-09-30. Completion date: 2006-12-24.
C M S CALIFORNIA MEDIA SERVICE (2009 W COMMONWEALTH AVE ST; small business) : $84,681 in 2 contractsfrom 2004 to 2005
$52,720 with Air Force for ADP Input/Output and Storage Devices. Taking place in TX. Signed on 2005-08-31. Completion date: 2005-09-23.
$31,961 with Navy for ADP Support Equipment. Signed on 2004-09-30. Completion date: 2004-10-31.
ADVANCED EQUIPMENT CORPORATION (2401 W COMMONWEALTH AVENU; small business)
$40,170 with Navy for Floor Coverings. Signed on 2000-10-12. Completion date: 2001-02-28.
BUCULEA, MARIN (2021 W COMMONWEALTH AVE S; small business) : $36,960 in 2 contractsin 2006
$31,999 with Navy for Maintenance, Repair or Alteration of Real Property -- Other Non-Building Facilities. Signed on 2006-01-30. Completion date: 2006-03-03.
$4,961, same as above.Signed on 2006-04-13. Completion date: 2006-03-03.
Top industries in this zip code by the number of employees in 2005:
2005 - 2018 National Fire Incident Reporting System (NFIRS) incidents
According to the data from the years 2005 - 2018 the average number of fire incidents per year is 44. The highest number of fire incidents - 75 took place in 2006, and the least - 8 in 2011. The data has a decreasing trend.
When looking into fire subcategories, the most incidents belonged to: Outside Fires (50.8%), and Structure Fires (25.4%).
Fire incident types reported to NFIRS in Zip Code 92833


 Nearest zip codes: 90621, 92832, 92801, 92835, 90638, 90620.


 According to the data from the years 2005 - 2018 the average number of fire incidents per year is 44. The highest number of fire incidents - 75 took place in 2006, and the least - 8 in 2011. The data has a decreasing trend.
 When looking into fire subcategories, the most incidents belonged to: Outside Fires (50.8%), and Structure Fires (25.4%).