Estimated zip code population in 2022: 26,465 Zip code population in 2010: 24,010 Zip code population in 2000: 21,144
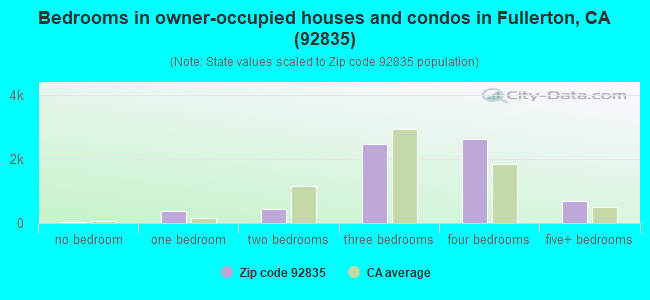
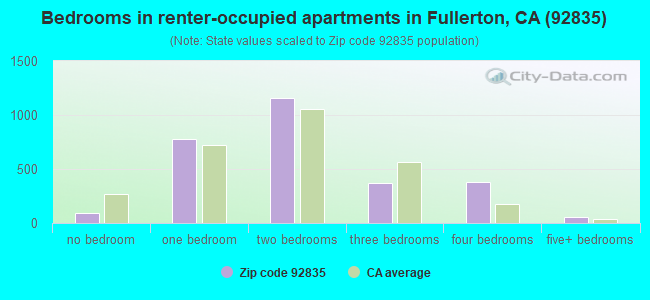
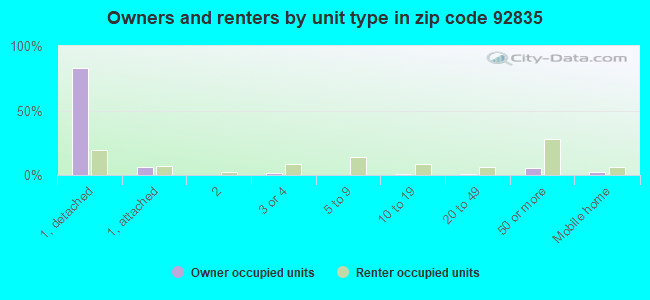
Houses and condos: 9,681 Renter-occupied apartments: 2,837
% of renters here:
30%
State:
44%
March 2022 cost of living index in zip code 92835: 87.2 (less than average, U.S. average is 100)
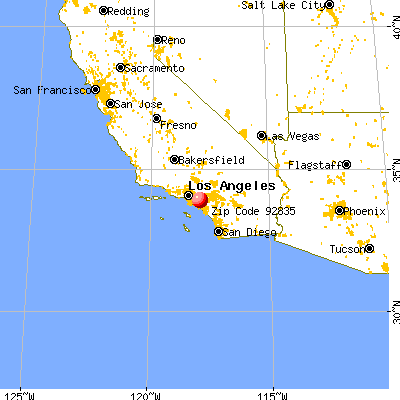
Land area: 6.0 sq. mi. Water area: 0.0 sq. mi.
Population density: 4,392 people per square mile
(average).
OSM Map
General Map
Google Map
MSN Map
OSM Map
General Map
Google Map
MSN Map
OSM Map
General Map
Google Map
MSN Map
OSM Map
General Map
Google Map
MSN Map
Please wait while loading the map...
Real estate property taxes paid for housing units in 2022:
This zip code:
0.6% ($6,459)
California:
0.7% ($4,831)
Median real estate property taxes paid for housing units with mortgages in 2022: $7,202 (0.7%) Median real estate property taxes paid for housing units with no mortgage in 2022: $4,531 (0.5%)
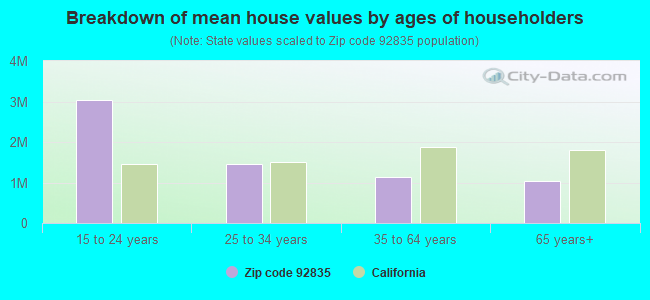
Estimated median house/condo value in 2022: $1,017,983
92835:
$1,017,983
California:
$715,900
According to our research of California and other state lists, there were 15 registered sex offenders living in 92835 zip code as of April 27, 2024. The ratio of all residents to sex offenders in zip code 92835 is 1,587 to 1. The ratio of registered sex offenders to all residents in this zip code is lower than the state average.
Median resident age:
This zip code:
43.2 years
California median age:
37.9 years
Average household size:
This zip code:
2.7 people
California:
2.8 people
Averages for the 2020 tax year for zip code 92835, filed in 2021:
Average Adjusted Gross Income (AGI) in 2020: $131,697 (Individual Income Tax Returns)
Here:
$131,697
State:
$95,910
Salary/wage: $100,771 (reported on 75.3% of returns)
Here:
$100,771
State:
$77,331
(% of AGI for various income ranges: 1150.0% for AGIs below $25k, 3863.8% for AGIs $25k-50k, 6854.5% for AGIs $50k-75k, 10297.7% for AGIs $75k-100k, 19035.3% for AGIs $100k-200k, 91853.1% for AGIs over 200k)
Taxable interest for individuals: $3,023 (reported on 52.6% of returns)
This zip code:
$3,023
California:
$2,294
(% of AGI for various income ranges: 46.4% for AGIs below $25k, 75.1% for AGIs $25k-50k, 130.1% for AGIs $50k-75k, 210.8% for AGIs $75k-100k, 370.6% for AGIs $100k-200k, 1964.4% for AGIs over 200k)
Ordinary dividends: $10,192 (reported on 35.7% of returns)
Here:
$10,192
State:
$10,949
(% of AGI for various income ranges: 61.0% for AGIs below $25k, 117.4% for AGIs $25k-50k, 223.4% for AGIs $50k-75k, 392.0% for AGIs $75k-100k, 737.9% for AGIs $100k-200k, 5260.2% for AGIs over 200k)
Net capital gain/loss in AGI: +$40,901 (reported on 33.9% of returns)
Here:
+$40,901
State:
+$49,306
(% of AGI for various income ranges: 14.7% for AGIs below $25k, 111.7% for AGIs $25k-50k, 161.9% for AGIs $50k-75k, 403.5% for AGIs $75k-100k, 857.0% for AGIs $100k-200k, 28601.5% for AGIs over 200k)
Profit/loss from business: +$19,443 (reported on 17.7% of returns)
Here:
+$19,443
State:
+$15,671
(% of AGI for various income ranges: 148.9% for AGIs below $25k, 208.6% for AGIs $25k-50k, 304.9% for AGIs $50k-75k, 442.8% for AGIs $75k-100k, 633.0% for AGIs $100k-200k, 4330.2% for AGIs over 200k)
Taxable individual retirement arrangement distribution: $29,194 (reported on 13.1% of returns)
92835:
$29,194
California:
$23,505
(% of AGI for various income ranges: 77.6% for AGIs below $25k, 195.9% for AGIs $25k-50k, 327.3% for AGIs $50k-75k, 784.2% for AGIs $75k-100k, 1403.9% for AGIs $100k-200k, 3229.8% for AGIs over 200k)
Self-employed (Keogh) retirement plans: $29,506 (reported on 1.3% of returns)
92835:
$29,506
California:
$30,163
(% of AGI for various income ranges: 22.1% for AGIs $25k-50k, 52.3% for AGIs $100k-200k, 699.6% for AGIs over 200k)
Total itemized deductions: $39,586 (reported on 28.6% of returns)
Here:
$39,586
State:
$39,517
(% of AGI for various income ranges: 237.4% for AGIs below $25k, 371.5% for AGIs $25k-50k, 806.9% for AGIs $50k-75k, 1827.7% for AGIs $75k-100k, 3501.2% for AGIs $100k-200k, 12539.6% for AGIs over 200k)
Charity contributions: $10,566 (reported on 25.2% of returns)
Here:
$10,566
State:
$12,598
(% of AGI for various income ranges: 10.8% for AGIs below $25k, 43.3% for AGIs $25k-50k, 107.1% for AGIs $50k-75k, 284.5% for AGIs $75k-100k, 620.3% for AGIs $100k-200k, 3989.6% for AGIs over 200k)
Taxes paid: $8,945 (reported on 28.5% of returns)
92835:
$8,945
State:
$8,807
(% of AGI for various income ranges: 39.7% for AGIs below $25k, 84.7% for AGIs $25k-50k, 194.6% for AGIs $50k-75k, 468.8% for AGIs $75k-100k, 922.4% for AGIs $100k-200k, 2471.3% for AGIs over 200k)
Earned income credit: $1,621 (reported on 7.0% of returns)
Here:
$1,621
State:
$2,074
(% of AGI for various income ranges: 47.8% for AGIs below $25k, 41.2% for AGIs $25k-50k)
Percentage of individuals using paid preparers for their 2020 taxes: 93.2%
Here:
93%
State:
92%
(% for various income ranges: 90.8% for AGIs below $25k, 93.2% for AGIs $25k-50k, 93.4% for AGIs $50k-75k, 93.3% for AGIs $75k-100k, 94.6% for AGIs $100k-200k, 94.7% for AGIs over 200k)
Averages for the 2012 tax year for zip code 92835, filed in 2013:
Average Adjusted Gross Income (AGI) in 2012: $105,364 (Individual Income Tax Returns)
Here:
$105,364
State:
$72,726
Salary/wage: $81,220 (reported on 75.7% of returns)
Here:
$81,220
State:
$59,079
(% of AGI for various income ranges: 69.4% for AGIs below $25k, 69.6% for AGIs $25k-50k, 65.1% for AGIs $50k-75k, 62.9% for AGIs $75k-100k, 68.5% for AGIs $100k-200k, 48.5% for AGIs over 200k)
Taxable interest for individuals: $2,595 (reported on 54.5% of returns)
This zip code:
$2,595
California:
$2,146
(% of AGI for various income ranges: 2.4% for AGIs below $25k, 1.9% for AGIs $25k-50k, 1.6% for AGIs $50k-75k, 1.3% for AGIs $75k-100k, 1.3% for AGIs $100k-200k, 1.2% for AGIs over 200k)
Ordinary dividends: $9,090 (reported on 34.0% of returns)
Here:
$9,090
State:
$9,308
(% of AGI for various income ranges: 3.3% for AGIs below $25k, 2.2% for AGIs $25k-50k, 2.3% for AGIs $50k-75k, 2.5% for AGIs $75k-100k, 2.5% for AGIs $100k-200k, 3.4% for AGIs over 200k)
Net capital gain/loss in AGI: +$17,989 (reported on 29.7% of returns)
Here:
+$17,989
State:
+$30,460
(% of AGI for various income ranges: 0.5% for AGIs $50k-75k, 1.0% for AGIs $75k-100k, 1.3% for AGIs $100k-200k, 9.7% for AGIs over 200k)
Profit/loss from business: +$28,220 (reported on 17.8% of returns)
Here:
+$28,220
State:
+$17,064
(% of AGI for various income ranges: 9.9% for AGIs below $25k, 5.5% for AGIs $25k-50k, 4.3% for AGIs $50k-75k, 5.9% for AGIs $75k-100k, 3.0% for AGIs $100k-200k, 5.2% for AGIs over 200k)
Taxable individual retirement arrangement distribution: $27,046 (reported on 16.3% of returns)
92835:
$27,046
California:
$19,557
(% of AGI for various income ranges: 4.4% for AGIs below $25k, 5.0% for AGIs $25k-50k, 4.7% for AGIs $50k-75k, 5.9% for AGIs $75k-100k, 5.0% for AGIs $100k-200k, 3.2% for AGIs over 200k)
Self-employment retirement plans: $24,244 (reported on 1.6% of returns)
92835:
$24,244
California:
$24,530
(% of AGI for various income ranges: 0.4% for AGIs $25k-50k, 0.3% for AGIs $100k-200k, 0.6% for AGIs over 200k)
Total itemized deductions: $39,535 (23% of AGI, reported on 53.2% of returns)
Here:
$39,535
State:
$34,004
Here:
23.3% of AGI
State:
22.7% of AGI
(% of AGI for various income ranges: 20.3% for AGIs below $25k, 18.1% for AGIs $25k-50k, 21.8% for AGIs $50k-75k, 22.8% for AGIs $75k-100k, 22.7% for AGIs $100k-200k, 17.8% for AGIs over 200k)
Charity contributions: $6,288 (reported on 46.5% of returns)
Here:
$6,288
State:
$4,659
(% of AGI for various income ranges: 1.2% for AGIs below $25k, 1.5% for AGIs $25k-50k, 2.4% for AGIs $50k-75k, 2.8% for AGIs $75k-100k, 2.9% for AGIs $100k-200k, 3.1% for AGIs over 200k)
Taxes paid: $16,486 (reported on 53.0% of returns)
92835:
$16,486
State:
$14,448
(% of AGI for various income ranges: 3.9% for AGIs below $25k, 3.9% for AGIs $25k-50k, 5.5% for AGIs $50k-75k, 6.9% for AGIs $75k-100k, 8.5% for AGIs $100k-200k, 9.7% for AGIs over 200k)
Earned income credit: $1,682 (reported on 8.6% of returns)
Here:
$1,682
State:
$2,286
(% of AGI for various income ranges: 3.3% for AGIs below $25k, 0.5% for AGIs $25k-50k)
Percentage of individuals using paid preparers for their 2012 taxes: 66.0%
Here:
66%
State:
64%
(% for various income ranges: 57.2% for AGIs below $25k, 62.2% for AGIs $25k-50k, 66.7% for AGIs $50k-75k, 70.9% for AGIs $75k-100k, 71.6% for AGIs $100k-200k, 79.8% for AGIs over 200k)
Averages for the 2004 tax year for zip code 92835, filed in 2005:
Average Adjusted Gross Income (AGI) in 2004: $86,505 (Individual Income Tax Returns)
Here:
$86,505
State:
$58,600
Salary/wage: $70,635 (reported on 77.0% of returns)
Here:
$70,635
State:
$49,455
(% of AGI for various income ranges: 359.8% for AGIs below $10k, 68.2% for AGIs $10k-25k, 71.3% for AGIs $25k-50k, 70.1% for AGIs $50k-75k, 68.2% for AGIs $75k-100k, 59.0% for AGIs over 100k)
Taxable interest for individuals: $3,331 (reported on 63.5% of returns)
This zip code:
$3,331
California:
$2,365
(% of AGI for various income ranges: 43.1% for AGIs below $10k, 5.0% for AGIs $10k-25k, 2.7% for AGIs $25k-50k, 2.4% for AGIs $50k-75k, 2.6% for AGIs $75k-100k, 2.2% for AGIs over 100k)
Taxable dividends: $5,910 (reported on 39.1% of returns)
Here:
$5,910
State:
$4,746
(% of AGI for various income ranges: 26.5% for AGIs below $10k, 3.7% for AGIs $10k-25k, 2.3% for AGIs $25k-50k, 2.2% for AGIs $50k-75k, 2.2% for AGIs $75k-100k, 2.7% for AGIs over 100k)
Net capital gain/loss: +$20,446 (reported on 34.9% of returns)
Here:
+$20,446
State:
+$23,418
(% of AGI for various income ranges: -16.5% for AGIs below $10k, 0.2% for AGIs $10k-25k, 0.9% for AGIs $25k-50k, 1.0% for AGIs $50k-75k, 1.7% for AGIs $75k-100k, 11.5% for AGIs over 100k)
Profit/loss from business: +$20,999 (reported on 18.2% of returns)
Here:
+$20,999
State:
+$16,826
(% of AGI for various income ranges: 22.9% for AGIs below $10k, 7.0% for AGIs $10k-25k, 6.9% for AGIs $25k-50k, 5.6% for AGIs $50k-75k, 4.4% for AGIs $75k-100k, 3.8% for AGIs over 100k)
IRA payment deduction: $3,903 (reported on 4.2% of returns)
92835:
$3,903
California:
$3,192
(% of AGI for various income ranges: 1.9% for AGIs below $10k, 0.3% for AGIs $10k-25k, 0.3% for AGIs $25k-50k, 0.3% for AGIs $50k-75k, 0.3% for AGIs $75k-100k, 0.1% for AGIs over 100k)
Self-employed pension: $16,461 (reported on 2.3% of returns)
Here:
$16,461
California:
$17,688
(% of AGI for various income ranges: 0.2% for AGIs $25k-50k, 0.3% for AGIs $50k-75k, 0.3% for AGIs $75k-100k, 0.5% for AGIs over 100k)
Total itemized deductions: $32,998 (24% of AGI, reported on 55.0% of returns)
Here:
$32,998
State:
$28,113
Here:
24.0% of AGI
State:
25.3% of AGI
(% of AGI for various income ranges: 91.9% for AGIs below $10k, 20.0% for AGIs $10k-25k, 22.7% for AGIs $25k-50k, 24.5% for AGIs $50k-75k, 26.7% for AGIs $75k-100k, 19.3% for AGIs over 100k)
Charity contributions deductions: $5,116 (4% of AGI, reported on 50.9% of returns)
Here:
$5,116
State:
$3,923
Here:
3.6% of AGI
State:
3.3% of AGI
(% of AGI for various income ranges: 5.1% for AGIs below $10k, 1.7% for AGIs $10k-25k, 2.4% for AGIs $25k-50k, 3.2% for AGIs $50k-75k, 3.2% for AGIs $75k-100k, 3.1% for AGIs over 100k)
Total tax: $16,005 (reported on 82.9% of returns)
92835:
$16,005
State:
$10,761
(% of AGI for various income ranges: 14.4% for AGIs below $10k, 4.8% for AGIs $10k-25k, 7.7% for AGIs $25k-50k, 9.3% for AGIs $50k-75k, 9.6% for AGIs $75k-100k, 18.4% for AGIs over 100k)
Earned income credit: $1,258 (reported on 5.9% of returns)
Here:
$1,258
State:
$1,763
Percentage of individuals using paid preparers for their 2004 taxes: 68.8%
Here:
69%
State:
66%
(% for various income ranges: 58.2% for AGIs below $10k, 64.1% for AGIs $10k-25k, 65.9% for AGIs $25k-50k, 71.1% for AGIs $50k-75k, 74.4% for AGIs $75k-100k, 77.3% for AGIs over 100k)
Likely homosexual households (counted as self-reported same-sex unmarried-partner households)
Lesbian couples: 0.1% of all households
Gay men: 0.0% of all households
Household received Food Stamps/SNAP in the past 12 months: 376 Household did not receive Food Stamps/SNAP in the past 12 months: 8,931
Women who had a birth in the past 12 months: 412 (242 now married, 170 unmarried) Women who did not have a birth in the past 12 months: 4,542 (2,108 now married, 2,420 unmarried)
Housing units in zip code 92835 with a mortgage: 4,613 (561 second mortgage, 8 home equity loan, 537 both second mortgage and home equity loan) Houses without a mortgage: 56
Median monthly owner costs for units with a mortgage: $3,529 Median monthly owner costs for units without a mortgage: $926
Residents with income below the poverty level in 2022:
This zip code:
5.5%
Whole state:
12.2%
Residents with income below 50% of the poverty level in 2022:
This zip code:
2.4%
Whole state:
6.2%
Median number of rooms in houses and condos:
Here:
6.5
State:
6.0
Median number of rooms in apartments:
Here:
4.0
State:
3.9
Notable locations in this zip code not listed on our city pages
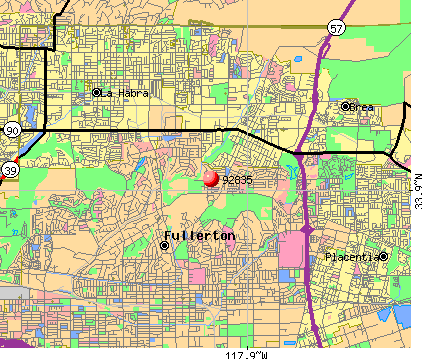
Notable locations in zip code 92835: Fullerton Municipal Golf Course (A), Loma Vista Mausoleum (B), Fullerton Fire Department Station 4 (C). Display/hide their locations on the map
Parks in zip code 92835 include: Hiltscher Park (1), San Juan Park (2), Beechwood Park (3), Brea Reservoir Park (4), Craig Regional Park (5), Hermosa School Park (6), Laguna Lake Park (7), Leonard Andrews Tennis Center (8), Rolling Hills Park (9). Display/hide their locations on the map
In group quarters: 697 (-1 institutionalized population)
Size of family households: 2,818 2-persons, 1,648 3-persons, 1,503 4-persons, 664 5-persons, 295 6-persons, 52 7-or-more-persons
Size of nonfamily households: 2,113 1-person, 291 2-persons, 77 3-persons
4,819 married couples with children.
808 single-parent households (197 men, 611 women).
67.0% of residents of 92835 zip code speak English at home.
12.8% of residents speak Spanish at home (73% very well, 7% well, 14% not well, 6% not at all).
3.4% of residents speak other Indo-European language at home (75% very well, 13% well, 12% not well).
15.1% of residents speak Asian or Pacific Island language at home (55% very well, 24% well, 17% not well, 4% not at all).
1.8% of residents speak other language at home (52% very well, 8% well, 35% not well, 4% not at all).
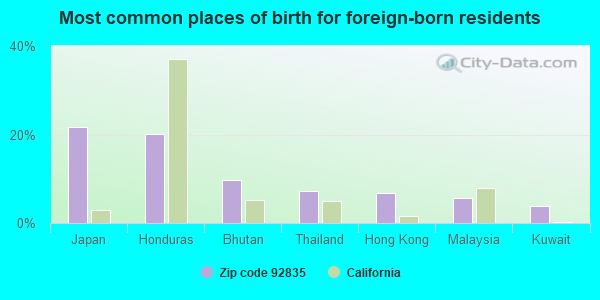
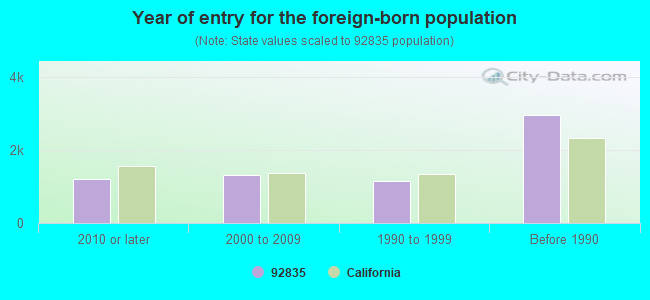
Foreign born population: 6,089 (23.0%) (74.0% of them are naturalized citizens)
Major facilities with environmental interests located in this zip code:
ADAMS RITE AEROSPACE INC (4141 N PALM in FULLERTON, CA)
STATE MASTER (California - Hazardous Waste Tracking) - HAZARDOU WASTE PROGRAM Small Quantity Generators, between 100 kg and 1000 kg of hazardous waste/month (Resource Conservation and Recovery Act (tracking hazardous waste)) - notification Organizations: Z M P INC (CONTACT/OWNER)
HERMOSA DRIVE ELEMENTARY (400 E. HERMOSA DR. in FULLERTON, CA)
(National Center for Education Statistics) - STATE ID-6028062 Organizations: FULLERTON ELEMENTARY (SCHOOL DISTRICT)
LAGUNA ROAD ELEMENTARY (300 LAGUNA ROAD in FULLERTON, CA)
(National Center for Education Statistics) - STATE ID-6028088 Organizations: FULLERTON ELEMENTARY (SCHOOL DISTRICT)
EXXON MOBIL OIL CORPORATION (2800 EAST IMPERIAL HIGHWAY in FULLERTON, CA)
Small Quantity Generators, between 100 kg and 1000 kg of hazardous waste/month (Resource Conservation and Recovery Act (tracking hazardous waste)) HAZARDOUS WASTE BIENNIAL REPORTER (Resource Conservation and Recovery Act (tracking hazardous waste)) Large Quantity Generators, more that 1000 kg of hazardous waste/month (Resource Conservation and Recovery Act (tracking hazardous waste)) Organizations: EXXONMOBIL OIL CORPORATION (CONTACT/OPERATOR)
Alternative names: MOBIL OIL CORP 793
CARAN PRECISION ENGINEERING AND MFG (4275 N PALM ST in FULLERTON, CA)
Large Quantity Generators, more that 1000 kg of hazardous waste/month (Resource Conservation and Recovery Act (tracking hazardous waste)) TRI REPORTER (Tracking of toxic chemicals releasing facilities) Business SIC classification: METAL STAMPINGS Business NAICS classification: METAL STAMPING. Organizations: BONITA PUENTE LLC (CONTACT/OWNER)
Alternative names: CARAN PRECISION ENGINEERING AND MANUFACT
C AND H CLEANERS (2231 HARBOR BLVD in FULLERTON, CA)
Large Quantity Generators, more that 1000 kg of hazardous waste/month (Resource Conservation and Recovery Act (tracking hazardous waste)) Organizations: SUNNY HILLS PLAZA LTD (CONTACT/OPERATOR)
FRAME N LENS OPTICAL INC (4201 BONITA PL in FULLERTON, CA)
Large Quantity Generators, more that 1000 kg of hazardous waste/month (Resource Conservation and Recovery Act (tracking hazardous waste)) - notification Organizations: ERIC J BODEN CEO PRES (CONTACT/OWNER)
FULLERTON BUSINESS CENTER (4010-4080 N PALM AVE in FULLERTON, CA)
Small Quantity Generators, between 100 kg and 1000 kg of hazardous waste/month (Resource Conservation and Recovery Act (tracking hazardous waste)) - notification
MERCURY CLEANERS (3012 BREA BLVD in FULLERTON, CA)
Small Quantity Generators, between 100 kg and 1000 kg of hazardous waste/month (Resource Conservation and Recovery Act (tracking hazardous waste)) - notification Organizations: ANTRANIE CHANTIAN (CONTACT/OWNER)
FULLERTON OUTPATIENT SURGERY MEDICAL CENTER (1835 SUNNYCREST DRIVE in FULLERTON, CA)
Small Quantity Generators, between 100 kg and 1000 kg of hazardous waste/month (Resource Conservation and Recovery Act (tracking hazardous waste)) - notification Organizations: FULLERTON OUTPATIENT SUR MED CT (CONTACT/OWNER)
Alternative names: FULLERTON OUTPATIENT SUR MED CT
MCCARRAN TREAT ENVIRONMENTAL (4020 NORTH PALM SUITE 204 in FULLERTON, CA)
TRANSPORTER (Resource Conservation and Recovery Act (tracking hazardous waste)) - notification Organizations: GARY HICKS (CONTACT/OWNER)
NALA BARRY LABS (408 WESTCHESTER PLACE in FULLERTON, CA)
COMPLIANCE ACTIVITY (Tracking inspections of insecticide, fungicide, and rodenticide, and toxic substances)
FULLERTON UNION HIGH SCHOOL DISTRICT (780 BEECHWOOD AVE in FULLERTON, CA)
COMPLIANCE ACTIVITY (Tracking inspections of insecticide, fungicide, and rodenticide, and toxic substances) Business SIC classification: ELEMENTARY AND SECONDARY SCHOOLS
Housing units lacking complete plumbing facilities: 0.1% Housing units lacking complete kitchen facilities: 2.6%
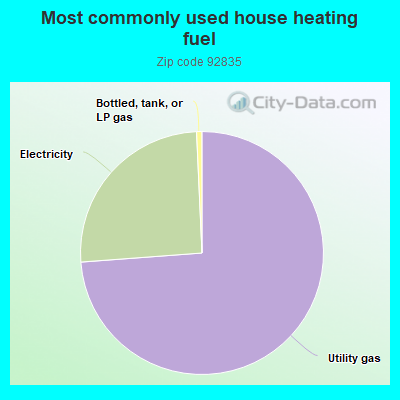
73.3%Utility gas
25.3%Electricity
0.7%Bottled, tank, or LP gas
Place of birth for U.S.-born residents:
This state: 14,812
Northeast: 1,462
Midwest: 1,786
South: 965
West: 704
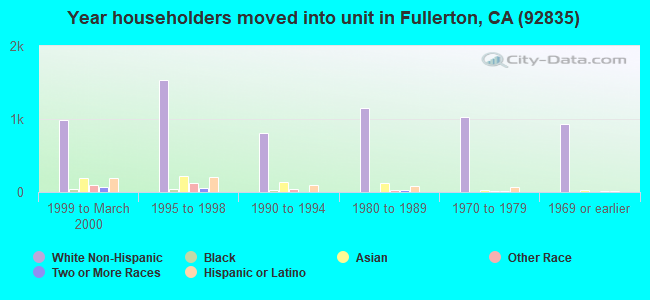
60% of the 92835 zip code residents lived in the same house 5 years ago. Out of people who lived in different houses, 64% lived in this county. Out of people who lived in different counties, 50% lived in California.
91% of the 92835 zip code residents lived in the same house 1 year ago. Out of people who lived in different houses, 65% moved from this county. Out of people who lived in different houses, 25% moved from different county within same state. Out of people who lived in different houses, 4% moved from different state. Out of people who lived in different houses, 6% moved from abroad.
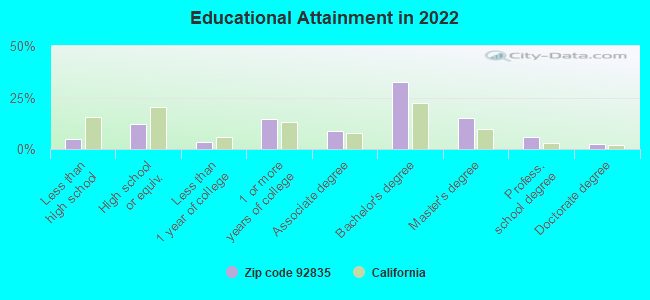
Private vs. public school enrollment:
Students in private schools in grades 1 to 8 (elementary and middle school): 1,166
Here:
38.2%
California:
10.5%
Students in private schools in grades 9 to 12 (high school): 156
Here:
14.8%
California:
8.5%
Students in private undergraduate colleges: 106
Here:
9.1%
California:
15.9%
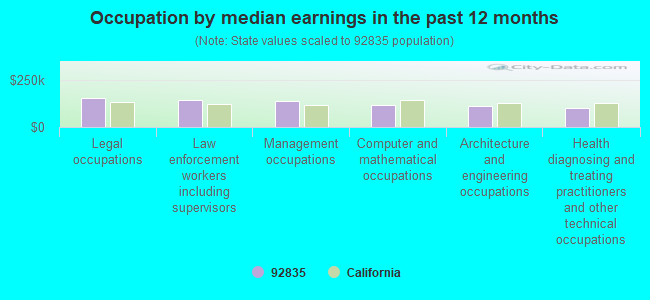
Occupation by median earnings in the past 12 months ($)
157,347Legal occupations
146,593Law enforcement workers including supervisors
139,101Management occupations
117,955Computer and mathematical occupations
114,743Architecture and engineering occupations
102,578Health diagnosing and treating practitioners and other technical occupations
Companies with federal contracts located in this zip code (FULLERTON, CA):
ADAMS RITE AEROSPACE, INC (4141 N PALM ST; small business) : $8,891,250 in 59 contractsfrom 2000 to 2006
Contracts for Hardware, Commercial, Miscellaneous Aircraft Accessories and Components, Miscellaneous Communication Equipment, Airframe Structural Components, and moreby Defense Logistics Agency, Army, Air Force, Navy, and others Signed by year:2000: $2,394,100; 2001: $613,222; 2002: $3,656,843; 2003: $863,190; 2004: $669,152; 2005: $658,484; 2006: $36,259.
Biggest contracts:
$2,298,400 with Defense Logistics Agency for Hardware, Commercial. Signed on 2002-04-22. Completion date: 2002-08-18.
$711,096 with Defense Logistics Agency for Miscellaneous Aircraft Accessories and Components. Signed on 2000-08-11. Completion date: 2001-09-21.
$619,800 with Army for Miscellaneous Aircraft Accessories and Components. Signed on 2005-02-28. Completion date: 2007-09-30.
$601,725, same as above.Signed on 2004-09-13. Completion date: 2007-09-30.
Q-MAX CONSTRUCTION COMPANY (4020 N PALM ST #203,; small business) : $831,299 in 10 contractsfrom 2004 to 2005
Contracts for Maintenance, Repair or Alteration of Real Property -- Other Non-Building Facilities, Maintenance, Repair or Alteration of Real Property -- Office Buildings, Maintenance, Repair or Alteration of Real Property -- Other Administrative Facilities and Service Buildings by Navy Signed by year:2000: $0; 2001: $0; 2002: $0; 2003: $0; 2004: $179,294; 2005: $652,005; 2006: $0.
Biggest contracts:
$224,590 with Navy for Maintenance, Repair or Alteration of Real Property -- Other Non-Building Facilities. Signed on 2005-07-27. Completion date: 2005-10-26.
$173,679 with Navy for Maintenance, Repair or Alteration of Real Property -- Office Buildings. Signed on 2005-03-31. Completion date: 2005-06-30.
$116,596 with Navy for Maintenance, Repair or Alteration of Real Property -- Other Administrative Facilities and Service Buildings. Signed on 2005-03-23. Completion date: 2005-12-15.
$94,775 with Navy for Maintenance, Repair or Alteration of Real Property -- Office Buildings. Signed on 2004-04-14. Completion date: 2004-07-13.
BI TECHNOLOGIES CORPORATION (4200 BONITA PLACE; small business) : $552,752 in 20 contractsfrom 2000 to 2006
Contracts for Resistors, Automatic Pilot Mechanisms and Airborne Gyro Components, Electrical and Electronic Properties Measuring and Testing Instruments, Microcircuits, Electronic, and moreby Defense Logistics Agency, Navy, Army Signed by year:2000: $138,715; 2001: $114,199; 2002: $85,881; 2003: $0; 2004: $87,862; 2005: $103,625; 2006: $22,470.
Biggest contracts:
$99,531 with Defense Logistics Agency for Resistors. Signed on 2000-03-08. Completion date: 2000-07-13.
$76,987 with Navy for Automatic Pilot Mechanisms and Airborne Gyro Components. Taking place in IN. Signed on 2005-05-04. Completion date: 2005-10-26.
$63,015 with Defense Logistics Agency for Resistors. Signed on 2002-08-08. Completion date: 2002-11-05.
$59,788, same as above.Signed on 2001-11-23. Completion date: 2002-03-22.
BERGER BULLETS (4275 N PALM ST; small business) : $25,896 in 3 contractsfrom 2003 to 2006
$17,519 with Army for Ammunition, through 30 mm. Signed on 2003-02-26. Completion date: 2003-04-17.
$9,160, same as above.Signed on 2005-06-15. Completion date: 2005-09-01.
-$783, same as above.Signed on 2006-05-12. Completion date: 2005-09-01.
Top industries in this zip code by the number of employees in 2005:
Health Care and Social Assistance: General Medical and Surgical Hospitals (over 1000 employees: 1 establishment)
Health Care and Social Assistance: Offices of Physicians (except Mental Health Specialists) (100-249: 2, 50-99: 2, 20-49: 8, 10-19: 10, 5-9: 15, 1-4: 48)
2005 - 2018 National Fire Incident Reporting System (NFIRS) incidents
According to the data from the years 2005 - 2018 the average number of fire incidents per year is 14. The highest number of fire incidents - 28 took place in 2005, and the least - 6 in 2010. The data has a decreasing trend.
When looking into fire subcategories, the most incidents belonged to: Outside Fires (39.4%), and Structure Fires (26.1%).
Fire incident types reported to NFIRS in Zip Code 92835


 Nearest zip codes: 92831, 92832, 92821, 92833, 90631, 92870.


 According to the data from the years 2005 - 2018 the average number of fire incidents per year is 14. The highest number of fire incidents - 28 took place in 2005, and the least - 6 in 2010. The data has a decreasing trend.
 When looking into fire subcategories, the most incidents belonged to: Outside Fires (39.4%), and Structure Fires (26.1%).