Fullerton, California Submit your own pictures of this city and show them to the world
OSM Map
General Map
Google Map
MSN Map
OSM Map
General Map
Google Map
MSN Map
OSM Map
General Map
Google Map
MSN Map
OSM Map
General Map
Google Map
MSN Map
Please wait while loading the map...
Population in 2022: 140,541 (100% urban, 0% rural). Population change since 2000: +11.5%Males: 66,114 Females: 74,427
March 2022 cost of living index in Fullerton: 89.1 (less than average, U.S. average is 100) Percentage of residents living in poverty in 2022: 10.8%for White Non-Hispanic residents , 22.4% for Black residents , 12.4% for Hispanic or Latino residents , 18.8% for American Indian residents , 9.9% for Native Hawaiian and other Pacific Islander residents , 24.9% for other race residents , 15.5% for two or more races residents )
Profiles of local businesses
Business Search - 14 Million verified businesses
Data:
Median household income ($)
Median household income (% change since 2000)
Household income diversity
Ratio of average income to average house value (%)
Ratio of average income to average rent
Median household income ($) - White
Median household income ($) - Black or African American
Median household income ($) - Asian
Median household income ($) - Hispanic or Latino
Median household income ($) - American Indian and Alaska Native
Median household income ($) - Multirace
Median household income ($) - Other Race
Median household income for houses/condos with a mortgage ($)
Median household income for apartments without a mortgage ($)
Races - White alone (%)
Races - White alone (% change since 2000)
Races - Black alone (%)
Races - Black alone (% change since 2000)
Races - American Indian alone (%)
Races - American Indian alone (% change since 2000)
Races - Asian alone (%)
Races - Asian alone (% change since 2000)
Races - Hispanic (%)
Races - Hispanic (% change since 2000)
Races - Native Hawaiian and Other Pacific Islander alone (%)
Races - Native Hawaiian and Other Pacific Islander alone (% change since 2000)
Races - Two or more races (%)
Races - Two or more races (% change since 2000)
Races - Other race alone (%)
Races - Other race alone (% change since 2000)
Racial diversity
Unemployment (%)
Unemployment (% change since 2000)
Unemployment (%) - White
Unemployment (%) - Black or African American
Unemployment (%) - Asian
Unemployment (%) - Hispanic or Latino
Unemployment (%) - American Indian and Alaska Native
Unemployment (%) - Multirace
Unemployment (%) - Other Race
Population density (people per square mile)
Population - Males (%)
Population - Females (%)
Population - Males (%) - White
Population - Males (%) - Black or African American
Population - Males (%) - Asian
Population - Males (%) - Hispanic or Latino
Population - Males (%) - American Indian and Alaska Native
Population - Males (%) - Multirace
Population - Males (%) - Other Race
Population - Females (%) - White
Population - Females (%) - Black or African American
Population - Females (%) - Asian
Population - Females (%) - Hispanic or Latino
Population - Females (%) - American Indian and Alaska Native
Population - Females (%) - Multirace
Population - Females (%) - Other Race
Coronavirus confirmed cases (Apr 27, 2024)
Deaths caused by coronavirus (Apr 27, 2024)
Coronavirus confirmed cases (per 100k population) (Apr 27, 2024)
Deaths caused by coronavirus (per 100k population) (Apr 27, 2024)
Daily increase in number of cases (Apr 27, 2024)
Weekly increase in number of cases (Apr 27, 2024)
Cases doubled (in days) (Apr 27, 2024)
Hospitalized patients (Apr 18, 2022)
Negative test results (Apr 18, 2022)
Total test results (Apr 18, 2022)
COVID Vaccine doses distributed (per 100k population) (Sep 19, 2023)
COVID Vaccine doses administered (per 100k population) (Sep 19, 2023)
COVID Vaccine doses distributed (Sep 19, 2023)
COVID Vaccine doses administered (Sep 19, 2023)
Likely homosexual households (%)
Likely homosexual households (% change since 2000)
Likely homosexual households - Lesbian couples (%)
Likely homosexual households - Lesbian couples (% change since 2000)
Likely homosexual households - Gay men (%)
Likely homosexual households - Gay men (% change since 2000)
Cost of living index
Median gross rent ($)
Median contract rent ($)
Median monthly housing costs ($)
Median house or condo value ($)
Median house or condo value ($ change since 2000)
Mean house or condo value by units in structure - 1, detached ($)
Mean house or condo value by units in structure - 1, attached ($)
Mean house or condo value by units in structure - 2 ($)
Mean house or condo value by units in structure by units in structure - 3 or 4 ($)
Mean house or condo value by units in structure - 5 or more ($)
Mean house or condo value by units in structure - Boat, RV, van, etc. ($)
Mean house or condo value by units in structure - Mobile home ($)
Median house or condo value ($) - White
Median house or condo value ($) - Black or African American
Median house or condo value ($) - Asian
Median house or condo value ($) - Hispanic or Latino
Median house or condo value ($) - American Indian and Alaska Native
Median house or condo value ($) - Multirace
Median house or condo value ($) - Other Race
Median resident age
Resident age diversity
Median resident age - Males
Median resident age - Females
Median resident age - White
Median resident age - Black or African American
Median resident age - Asian
Median resident age - Hispanic or Latino
Median resident age - American Indian and Alaska Native
Median resident age - Multirace
Median resident age - Other Race
Median resident age - Males - White
Median resident age - Males - Black or African American
Median resident age - Males - Asian
Median resident age - Males - Hispanic or Latino
Median resident age - Males - American Indian and Alaska Native
Median resident age - Males - Multirace
Median resident age - Males - Other Race
Median resident age - Females - White
Median resident age - Females - Black or African American
Median resident age - Females - Asian
Median resident age - Females - Hispanic or Latino
Median resident age - Females - American Indian and Alaska Native
Median resident age - Females - Multirace
Median resident age - Females - Other Race
Commute - mean travel time to work (minutes)
Travel time to work - Less than 5 minutes (%)
Travel time to work - Less than 5 minutes (% change since 2000)
Travel time to work - 5 to 9 minutes (%)
Travel time to work - 5 to 9 minutes (% change since 2000)
Travel time to work - 10 to 19 minutes (%)
Travel time to work - 10 to 19 minutes (% change since 2000)
Travel time to work - 20 to 29 minutes (%)
Travel time to work - 20 to 29 minutes (% change since 2000)
Travel time to work - 30 to 39 minutes (%)
Travel time to work - 30 to 39 minutes (% change since 2000)
Travel time to work - 40 to 59 minutes (%)
Travel time to work - 40 to 59 minutes (% change since 2000)
Travel time to work - 60 to 89 minutes (%)
Travel time to work - 60 to 89 minutes (% change since 2000)
Travel time to work - 90 or more minutes (%)
Travel time to work - 90 or more minutes (% change since 2000)
Marital status - Never married (%)
Marital status - Now married (%)
Marital status - Separated (%)
Marital status - Widowed (%)
Marital status - Divorced (%)
Median family income ($)
Median family income (% change since 2000)
Median non-family income ($)
Median non-family income (% change since 2000)
Median per capita income ($)
Median per capita income (% change since 2000)
Median family income ($) - White
Median family income ($) - Black or African American
Median family income ($) - Asian
Median family income ($) - Hispanic or Latino
Median family income ($) - American Indian and Alaska Native
Median family income ($) - Multirace
Median family income ($) - Other Race
Median year house/condo built
Median year apartment built
Year house built - Built 2005 or later (%)
Year house built - Built 2000 to 2004 (%)
Year house built - Built 1990 to 1999 (%)
Year house built - Built 1980 to 1989 (%)
Year house built - Built 1970 to 1979 (%)
Year house built - Built 1960 to 1969 (%)
Year house built - Built 1950 to 1959 (%)
Year house built - Built 1940 to 1949 (%)
Year house built - Built 1939 or earlier (%)
Average household size
Household density (households per square mile)
Average household size - White
Average household size - Black or African American
Average household size - Asian
Average household size - Hispanic or Latino
Average household size - American Indian and Alaska Native
Average household size - Multirace
Average household size - Other Race
Occupied housing units (%)
Vacant housing units (%)
Owner occupied housing units (%)
Renter occupied housing units (%)
Vacancy status - For rent (%)
Vacancy status - For sale only (%)
Vacancy status - Rented or sold, not occupied (%)
Vacancy status - For seasonal, recreational, or occasional use (%)
Vacancy status - For migrant workers (%)
Vacancy status - Other vacant (%)
Residents with income below the poverty level (%)
Residents with income below 50% of the poverty level (%)
Children below poverty level (%)
Poor families by family type - Married-couple family (%)
Poor families by family type - Male, no wife present (%)
Poor families by family type - Female, no husband present (%)
Poverty status for native-born residents (%)
Poverty status for foreign-born residents (%)
Poverty among high school graduates not in families (%)
Poverty among people who did not graduate high school not in families (%)
Residents with income below the poverty level (%) - White
Residents with income below the poverty level (%) - Black or African American
Residents with income below the poverty level (%) - Asian
Residents with income below the poverty level (%) - Hispanic or Latino
Residents with income below the poverty level (%) - American Indian and Alaska Native
Residents with income below the poverty level (%) - Multirace
Residents with income below the poverty level (%) - Other Race
Air pollution - Air Quality Index (AQI)
Air pollution - CO
Air pollution - NO2
Air pollution - SO2
Air pollution - Ozone
Air pollution - PM10
Air pollution - PM25
Air pollution - Pb
Crime - Murders per 100,000 population
Crime - Rapes per 100,000 population
Crime - Robberies per 100,000 population
Crime - Assaults per 100,000 population
Crime - Burglaries per 100,000 population
Crime - Thefts per 100,000 population
Crime - Auto thefts per 100,000 population
Crime - Arson per 100,000 population
Crime - City-data.com crime index
Crime - Violent crime index
Crime - Property crime index
Crime - Murders per 100,000 population (5 year average)
Crime - Rapes per 100,000 population (5 year average)
Crime - Robberies per 100,000 population (5 year average)
Crime - Assaults per 100,000 population (5 year average)
Crime - Burglaries per 100,000 population (5 year average)
Crime - Thefts per 100,000 population (5 year average)
Crime - Auto thefts per 100,000 population (5 year average)
Crime - Arson per 100,000 population (5 year average)
Crime - City-data.com crime index (5 year average)
Crime - Violent crime index (5 year average)
Crime - Property crime index (5 year average)
1996 Presidential Elections Results (%) - Democratic Party (Clinton)
1996 Presidential Elections Results (%) - Republican Party (Dole)
1996 Presidential Elections Results (%) - Other
2000 Presidential Elections Results (%) - Democratic Party (Gore)
2000 Presidential Elections Results (%) - Republican Party (Bush)
2000 Presidential Elections Results (%) - Other
2004 Presidential Elections Results (%) - Democratic Party (Kerry)
2004 Presidential Elections Results (%) - Republican Party (Bush)
2004 Presidential Elections Results (%) - Other
2008 Presidential Elections Results (%) - Democratic Party (Obama)
2008 Presidential Elections Results (%) - Republican Party (McCain)
2008 Presidential Elections Results (%) - Other
2012 Presidential Elections Results (%) - Democratic Party (Obama)
2012 Presidential Elections Results (%) - Republican Party (Romney)
2012 Presidential Elections Results (%) - Other
2016 Presidential Elections Results (%) - Democratic Party (Clinton)
2016 Presidential Elections Results (%) - Republican Party (Trump)
2016 Presidential Elections Results (%) - Other
2020 Presidential Elections Results (%) - Democratic Party (Biden)
2020 Presidential Elections Results (%) - Republican Party (Trump)
2020 Presidential Elections Results (%) - Other
Ancestries Reported - Arab (%)
Ancestries Reported - Czech (%)
Ancestries Reported - Danish (%)
Ancestries Reported - Dutch (%)
Ancestries Reported - English (%)
Ancestries Reported - French (%)
Ancestries Reported - French Canadian (%)
Ancestries Reported - German (%)
Ancestries Reported - Greek (%)
Ancestries Reported - Hungarian (%)
Ancestries Reported - Irish (%)
Ancestries Reported - Italian (%)
Ancestries Reported - Lithuanian (%)
Ancestries Reported - Norwegian (%)
Ancestries Reported - Polish (%)
Ancestries Reported - Portuguese (%)
Ancestries Reported - Russian (%)
Ancestries Reported - Scotch-Irish (%)
Ancestries Reported - Scottish (%)
Ancestries Reported - Slovak (%)
Ancestries Reported - Subsaharan African (%)
Ancestries Reported - Swedish (%)
Ancestries Reported - Swiss (%)
Ancestries Reported - Ukrainian (%)
Ancestries Reported - United States (%)
Ancestries Reported - Welsh (%)
Ancestries Reported - West Indian (%)
Ancestries Reported - Other (%)
Educational Attainment - No schooling completed (%)
Educational Attainment - Less than high school (%)
Educational Attainment - High school or equivalent (%)
Educational Attainment - Less than 1 year of college (%)
Educational Attainment - 1 or more years of college (%)
Educational Attainment - Associate degree (%)
Educational Attainment - Bachelor's degree (%)
Educational Attainment - Master's degree (%)
Educational Attainment - Professional school degree (%)
Educational Attainment - Doctorate degree (%)
School Enrollment - Nursery, preschool (%)
School Enrollment - Kindergarten (%)
School Enrollment - Grade 1 to 4 (%)
School Enrollment - Grade 5 to 8 (%)
School Enrollment - Grade 9 to 12 (%)
School Enrollment - College undergrad (%)
School Enrollment - Graduate or professional (%)
School Enrollment - Not enrolled in school (%)
School enrollment - Public schools (%)
School enrollment - Private schools (%)
School enrollment - Not enrolled (%)
Median number of rooms in houses and condos
Median number of rooms in apartments
Housing units lacking complete plumbing facilities (%)
Housing units lacking complete kitchen facilities (%)
Density of houses
Urban houses (%)
Rural houses (%)
Households with people 60 years and over (%)
Households with people 65 years and over (%)
Households with people 75 years and over (%)
Households with one or more nonrelatives (%)
Households with no nonrelatives (%)
Population in households (%)
Family households (%)
Nonfamily households (%)
Population in families (%)
Family households with own children (%)
Median number of bedrooms in owner occupied houses
Mean number of bedrooms in owner occupied houses
Median number of bedrooms in renter occupied houses
Mean number of bedrooms in renter occupied houses
Median number of vehichles in owner occupied houses
Mean number of vehichles in owner occupied houses
Median number of vehichles in renter occupied houses
Mean number of vehichles in renter occupied houses
Mortgage status - with mortgage (%)
Mortgage status - with second mortgage (%)
Mortgage status - with home equity loan (%)
Mortgage status - with both second mortgage and home equity loan (%)
Mortgage status - without a mortgage (%)
Average family size
Average family size - White
Average family size - Black or African American
Average family size - Asian
Average family size - Hispanic or Latino
Average family size - American Indian and Alaska Native
Average family size - Multirace
Average family size - Other Race
Geographical mobility - Same house 1 year ago (%)
Geographical mobility - Moved within same county (%)
Geographical mobility - Moved from different county within same state (%)
Geographical mobility - Moved from different state (%)
Geographical mobility - Moved from abroad (%)
Place of birth - Born in state of residence (%)
Place of birth - Born in other state (%)
Place of birth - Native, outside of US (%)
Place of birth - Foreign born (%)
Housing units in structures - 1, detached (%)
Housing units in structures - 1, attached (%)
Housing units in structures - 2 (%)
Housing units in structures - 3 or 4 (%)
Housing units in structures - 5 to 9 (%)
Housing units in structures - 10 to 19 (%)
Housing units in structures - 20 to 49 (%)
Housing units in structures - 50 or more (%)
Housing units in structures - Mobile home (%)
Housing units in structures - Boat, RV, van, etc. (%)
House/condo owner moved in on average (years ago)
Renter moved in on average (years ago)
Year householder moved into unit - Moved in 1999 to March 2000 (%)
Year householder moved into unit - Moved in 1995 to 1998 (%)
Year householder moved into unit - Moved in 1990 to 1994 (%)
Year householder moved into unit - Moved in 1980 to 1989 (%)
Year householder moved into unit - Moved in 1970 to 1979 (%)
Year householder moved into unit - Moved in 1969 or earlier (%)
Means of transportation to work - Drove car alone (%)
Means of transportation to work - Carpooled (%)
Means of transportation to work - Public transportation (%)
Means of transportation to work - Bus or trolley bus (%)
Means of transportation to work - Streetcar or trolley car (%)
Means of transportation to work - Subway or elevated (%)
Means of transportation to work - Railroad (%)
Means of transportation to work - Ferryboat (%)
Means of transportation to work - Taxicab (%)
Means of transportation to work - Motorcycle (%)
Means of transportation to work - Bicycle (%)
Means of transportation to work - Walked (%)
Means of transportation to work - Other means (%)
Working at home (%)
Industry diversity
Most Common Industries - Agriculture, forestry, fishing and hunting, and mining (%)
Most Common Industries - Agriculture, forestry, fishing and hunting (%)
Most Common Industries - Mining, quarrying, and oil and gas extraction (%)
Most Common Industries - Construction (%)
Most Common Industries - Manufacturing (%)
Most Common Industries - Wholesale trade (%)
Most Common Industries - Retail trade (%)
Most Common Industries - Transportation and warehousing, and utilities (%)
Most Common Industries - Transportation and warehousing (%)
Most Common Industries - Utilities (%)
Most Common Industries - Information (%)
Most Common Industries - Finance and insurance, and real estate and rental and leasing (%)
Most Common Industries - Finance and insurance (%)
Most Common Industries - Real estate and rental and leasing (%)
Most Common Industries - Professional, scientific, and management, and administrative and waste management services (%)
Most Common Industries - Professional, scientific, and technical services (%)
Most Common Industries - Management of companies and enterprises (%)
Most Common Industries - Administrative and support and waste management services (%)
Most Common Industries - Educational services, and health care and social assistance (%)
Most Common Industries - Educational services (%)
Most Common Industries - Health care and social assistance (%)
Most Common Industries - Arts, entertainment, and recreation, and accommodation and food services (%)
Most Common Industries - Arts, entertainment, and recreation (%)
Most Common Industries - Accommodation and food services (%)
Most Common Industries - Other services, except public administration (%)
Most Common Industries - Public administration (%)
Occupation diversity
Most Common Occupations - Management, business, science, and arts occupations (%)
Most Common Occupations - Management, business, and financial occupations (%)
Most Common Occupations - Management occupations (%)
Most Common Occupations - Business and financial operations occupations (%)
Most Common Occupations - Computer, engineering, and science occupations (%)
Most Common Occupations - Computer and mathematical occupations (%)
Most Common Occupations - Architecture and engineering occupations (%)
Most Common Occupations - Life, physical, and social science occupations (%)
Most Common Occupations - Education, legal, community service, arts, and media occupations (%)
Most Common Occupations - Community and social service occupations (%)
Most Common Occupations - Legal occupations (%)
Most Common Occupations - Education, training, and library occupations (%)
Most Common Occupations - Arts, design, entertainment, sports, and media occupations (%)
Most Common Occupations - Healthcare practitioners and technical occupations (%)
Most Common Occupations - Health diagnosing and treating practitioners and other technical occupations (%)
Most Common Occupations - Health technologists and technicians (%)
Most Common Occupations - Service occupations (%)
Most Common Occupations - Healthcare support occupations (%)
Most Common Occupations - Protective service occupations (%)
Most Common Occupations - Fire fighting and prevention, and other protective service workers including supervisors (%)
Most Common Occupations - Law enforcement workers including supervisors (%)
Most Common Occupations - Food preparation and serving related occupations (%)
Most Common Occupations - Building and grounds cleaning and maintenance occupations (%)
Most Common Occupations - Personal care and service occupations (%)
Most Common Occupations - Sales and office occupations (%)
Most Common Occupations - Sales and related occupations (%)
Most Common Occupations - Office and administrative support occupations (%)
Most Common Occupations - Natural resources, construction, and maintenance occupations (%)
Most Common Occupations - Farming, fishing, and forestry occupations (%)
Most Common Occupations - Construction and extraction occupations (%)
Most Common Occupations - Installation, maintenance, and repair occupations (%)
Most Common Occupations - Production, transportation, and material moving occupations (%)
Most Common Occupations - Production occupations (%)
Most Common Occupations - Transportation occupations (%)
Most Common Occupations - Material moving occupations (%)
People in Group quarters - Institutionalized population (%)
People in Group quarters - Correctional institutions (%)
People in Group quarters - Federal prisons and detention centers (%)
People in Group quarters - Halfway houses (%)
People in Group quarters - Local jails and other confinement facilities (including police lockups) (%)
People in Group quarters - Military disciplinary barracks (%)
People in Group quarters - State prisons (%)
People in Group quarters - Other types of correctional institutions (%)
People in Group quarters - Nursing homes (%)
People in Group quarters - Hospitals/wards, hospices, and schools for the handicapped (%)
People in Group quarters - Hospitals/wards and hospices for chronically ill (%)
People in Group quarters - Hospices or homes for chronically ill (%)
People in Group quarters - Military hospitals or wards for chronically ill (%)
People in Group quarters - Other hospitals or wards for chronically ill (%)
People in Group quarters - Hospitals or wards for drug/alcohol abuse (%)
People in Group quarters - Mental (Psychiatric) hospitals or wards (%)
People in Group quarters - Schools, hospitals, or wards for the mentally retarded (%)
People in Group quarters - Schools, hospitals, or wards for the physically handicapped (%)
People in Group quarters - Institutions for the deaf (%)
People in Group quarters - Institutions for the blind (%)
People in Group quarters - Orthopedic wards and institutions for the physically handicapped (%)
People in Group quarters - Wards in general hospitals for patients who have no usual home elsewhere (%)
People in Group quarters - Wards in military hospitals for patients who have no usual home elsewhere (%)
People in Group quarters - Juvenile institutions (%)
People in Group quarters - Long-term care (%)
People in Group quarters - Homes for abused, dependent, and neglected children (%)
People in Group quarters - Residential treatment centers for emotionally disturbed children (%)
People in Group quarters - Training schools for juvenile delinquents (%)
People in Group quarters - Short-term care, detention or diagnostic centers for delinquent children (%)
People in Group quarters - Type of juvenile institution unknown (%)
People in Group quarters - Noninstitutionalized population (%)
People in Group quarters - College dormitories (includes college quarters off campus) (%)
People in Group quarters - Military quarters (%)
People in Group quarters - On base (%)
People in Group quarters - Barracks, unaccompanied personnel housing (UPH), (Enlisted/Officer), ;and similar group living quarters for military personnel (%)
People in Group quarters - Transient quarters for temporary residents (%)
People in Group quarters - Military ships (%)
People in Group quarters - Group homes (%)
People in Group quarters - Homes or halfway houses for drug/alcohol abuse (%)
People in Group quarters - Homes for the mentally ill (%)
People in Group quarters - Homes for the mentally retarded (%)
People in Group quarters - Homes for the physically handicapped (%)
People in Group quarters - Other group homes (%)
People in Group quarters - Religious group quarters (%)
People in Group quarters - Dormitories (%)
People in Group quarters - Agriculture workers' dormitories on farms (%)
People in Group quarters - Job Corps and vocational training facilities (%)
People in Group quarters - Other workers' dormitories (%)
People in Group quarters - Crews of maritime vessels (%)
People in Group quarters - Other nonhousehold living situations (%)
People in Group quarters - Other noninstitutional group quarters (%)
Residents speaking English at home (%)
Residents speaking English at home - Born in the United States (%)
Residents speaking English at home - Native, born elsewhere (%)
Residents speaking English at home - Foreign born (%)
Residents speaking Spanish at home (%)
Residents speaking Spanish at home - Born in the United States (%)
Residents speaking Spanish at home - Native, born elsewhere (%)
Residents speaking Spanish at home - Foreign born (%)
Residents speaking other language at home (%)
Residents speaking other language at home - Born in the United States (%)
Residents speaking other language at home - Native, born elsewhere (%)
Residents speaking other language at home - Foreign born (%)
Class of Workers - Employee of private company (%)
Class of Workers - Self-employed in own incorporated business (%)
Class of Workers - Private not-for-profit wage and salary workers (%)
Class of Workers - Local government workers (%)
Class of Workers - State government workers (%)
Class of Workers - Federal government workers (%)
Class of Workers - Self-employed workers in own not incorporated business and Unpaid family workers (%)
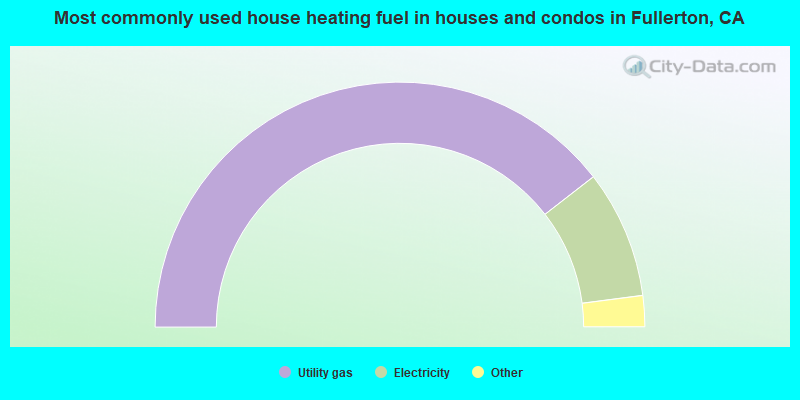
House heating fuel used in houses and condos - Utility gas (%)
House heating fuel used in houses and condos - Bottled, tank, or LP gas (%)
House heating fuel used in houses and condos - Electricity (%)
House heating fuel used in houses and condos - Fuel oil, kerosene, etc. (%)
House heating fuel used in houses and condos - Coal or coke (%)
House heating fuel used in houses and condos - Wood (%)
House heating fuel used in houses and condos - Solar energy (%)
House heating fuel used in houses and condos - Other fuel (%)
House heating fuel used in houses and condos - No fuel used (%)
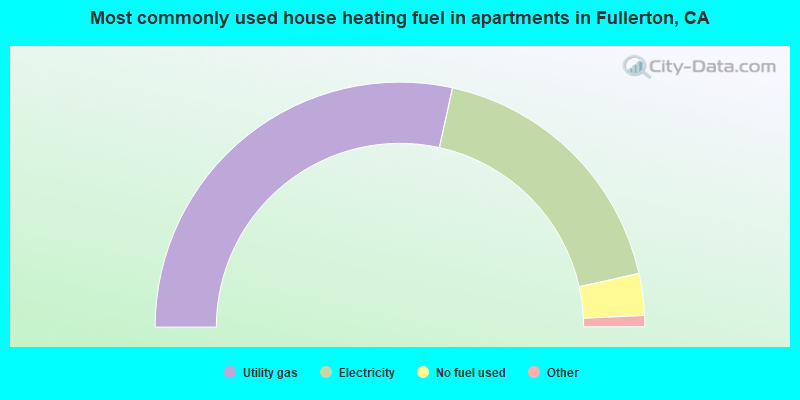
House heating fuel used in apartments - Utility gas (%)
House heating fuel used in apartments - Bottled, tank, or LP gas (%)
House heating fuel used in apartments - Electricity (%)
House heating fuel used in apartments - Fuel oil, kerosene, etc. (%)
House heating fuel used in apartments - Coal or coke (%)
House heating fuel used in apartments - Wood (%)
House heating fuel used in apartments - Solar energy (%)
House heating fuel used in apartments - Other fuel (%)
House heating fuel used in apartments - No fuel used (%)
Armed forces status - In Armed Forces (%)
Armed forces status - Civilian (%)
Armed forces status - Civilian - Veteran (%)
Armed forces status - Civilian - Nonveteran (%)
Fatal accidents locations in years 2005-2021
Fatal accidents locations in 2005
Fatal accidents locations in 2006
Fatal accidents locations in 2007
Fatal accidents locations in 2008
Fatal accidents locations in 2009
Fatal accidents locations in 2010
Fatal accidents locations in 2011
Fatal accidents locations in 2012
Fatal accidents locations in 2013
Fatal accidents locations in 2014
Fatal accidents locations in 2015
Fatal accidents locations in 2016
Fatal accidents locations in 2017
Fatal accidents locations in 2018
Fatal accidents locations in 2019
Fatal accidents locations in 2020
Fatal accidents locations in 2021
Alcohol use - People drinking some alcohol every month (%)
Alcohol use - People not drinking at all (%)
Alcohol use - Average days/month drinking alcohol
Alcohol use - Average drinks/week
Alcohol use - Average days/year people drink much
Audiometry - Average condition of hearing (%)
Audiometry - People that can hear a whisper from across a quiet room (%)
Audiometry - People that can hear normal voice from across a quiet room (%)
Audiometry - Ears ringing, roaring, buzzing (%)
Audiometry - Had a job exposure to loud noise (%)
Audiometry - Had off-work exposure to loud noise (%)
Blood Pressure & Cholesterol - Has high blood pressure (%)
Blood Pressure & Cholesterol - Checking blood pressure at home (%)
Blood Pressure & Cholesterol - Frequently checking blood cholesterol (%)
Blood Pressure & Cholesterol - Has high cholesterol level (%)
Consumer Behavior - Money monthly spent on food at supermarket/grocery store
Consumer Behavior - Money monthly spent on food at other stores
Consumer Behavior - Money monthly spent on eating out
Consumer Behavior - Money monthly spent on carryout/delivered foods
Consumer Behavior - Income spent on food at supermarket/grocery store (%)
Consumer Behavior - Income spent on food at other stores (%)
Consumer Behavior - Income spent on eating out (%)
Consumer Behavior - Income spent on carryout/delivered foods (%)
Current Health Status - General health condition (%)
Current Health Status - Blood donors (%)
Current Health Status - Has blood ever tested for HIV virus (%)
Current Health Status - Left-handed people (%)
Dermatology - People using sunscreen (%)
Diabetes - Diabetics (%)
Diabetes - Had a blood test for high blood sugar (%)
Diabetes - People taking insulin (%)
Diet Behavior & Nutrition - Diet health (%)
Diet Behavior & Nutrition - Milk product consumption (# of products/month)
Diet Behavior & Nutrition - Meals not home prepared (#/week)
Diet Behavior & Nutrition - Meals from fast food or pizza place (#/week)
Diet Behavior & Nutrition - Ready-to-eat foods (#/month)
Diet Behavior & Nutrition - Frozen meals/pizza (#/month)
Drug Use - People that ever used marijuana or hashish (%)
Drug Use - Ever used hard drugs (%)
Drug Use - Ever used any form of cocaine (%)
Drug Use - Ever used heroin (%)
Drug Use - Ever used methamphetamine (%)
Health Insurance - People covered by health insurance (%)
Kidney Conditions-Urology - Avg. # of times urinating at night
Medical Conditions - People with asthma (%)
Medical Conditions - People with anemia (%)
Medical Conditions - People with psoriasis (%)
Medical Conditions - People with overweight (%)
Medical Conditions - Elderly people having difficulties in thinking or remembering (%)
Medical Conditions - People who ever received blood transfusion (%)
Medical Conditions - People having trouble seeing even with glass/contacts (%)
Medical Conditions - People with arthritis (%)
Medical Conditions - People with gout (%)
Medical Conditions - People with congestive heart failure (%)
Medical Conditions - People with coronary heart disease (%)
Medical Conditions - People with angina pectoris (%)
Medical Conditions - People who ever had heart attack (%)
Medical Conditions - People who ever had stroke (%)
Medical Conditions - People with emphysema (%)
Medical Conditions - People with thyroid problem (%)
Medical Conditions - People with chronic bronchitis (%)
Medical Conditions - People with any liver condition (%)
Medical Conditions - People who ever had cancer or malignancy (%)
Mental Health - People who have little interest in doing things (%)
Mental Health - People feeling down, depressed, or hopeless (%)
Mental Health - People who have trouble sleeping or sleeping too much (%)
Mental Health - People feeling tired or having little energy (%)
Mental Health - People with poor appetite or overeating (%)
Mental Health - People feeling bad about themself (%)
Mental Health - People who have trouble concentrating on things (%)
Mental Health - People moving or speaking slowly or too fast (%)
Mental Health - People having thoughts they would be better off dead (%)
Oral Health - Average years since last visit a dentist
Oral Health - People embarrassed because of mouth (%)
Oral Health - People with gum disease (%)
Oral Health - General health of teeth and gums (%)
Oral Health - Average days a week using dental floss/device
Oral Health - Average days a week using mouthwash for dental problem
Oral Health - Average number of teeth
Pesticide Use - Households using pesticides to control insects (%)
Pesticide Use - Households using pesticides to kill weeds (%)
Physical Activity - People doing vigorous-intensity work activities (%)
Physical Activity - People doing moderate-intensity work activities (%)
Physical Activity - People walking or bicycling (%)
Physical Activity - People doing vigorous-intensity recreational activities (%)
Physical Activity - People doing moderate-intensity recreational activities (%)
Physical Activity - Average hours a day doing sedentary activities
Physical Activity - Average hours a day watching TV or videos
Physical Activity - Average hours a day using computer
Physical Functioning - People having limitations keeping them from working (%)
Physical Functioning - People limited in amount of work they can do (%)
Physical Functioning - People that need special equipment to walk (%)
Physical Functioning - People experiencing confusion/memory problems (%)
Physical Functioning - People requiring special healthcare equipment (%)
Prescription Medications - Average number of prescription medicines taking
Preventive Aspirin Use - Adults 40+ taking low-dose aspirin (%)
Reproductive Health - Vaginal deliveries (%)
Reproductive Health - Cesarean deliveries (%)
Reproductive Health - Deliveries resulted in a live birth (%)
Reproductive Health - Pregnancies resulted in a delivery (%)
Reproductive Health - Women breastfeeding newborns (%)
Reproductive Health - Women that had a hysterectomy (%)
Reproductive Health - Women that had both ovaries removed (%)
Reproductive Health - Women that have ever taken birth control pills (%)
Reproductive Health - Women taking birth control pills (%)
Reproductive Health - Women that have ever used Depo-Provera or injectables (%)
Reproductive Health - Women that have ever used female hormones (%)
Sexual Behavior - People 18+ that ever had sex (vaginal, anal, or oral) (%)
Sexual Behavior - Males 18+ that ever had vaginal sex with a woman (%)
Sexual Behavior - Males 18+ that ever performed oral sex on a woman (%)
Sexual Behavior - Males 18+ that ever had anal sex with a woman (%)
Sexual Behavior - Males 18+ that ever had any sex with a man (%)
Sexual Behavior - Females 18+ that ever had vaginal sex with a man (%)
Sexual Behavior - Females 18+ that ever performed oral sex on a man (%)
Sexual Behavior - Females 18+ that ever had anal sex with a man (%)
Sexual Behavior - Females 18+ that ever had any kind of sex with a woman (%)
Sexual Behavior - Average age people first had sex
Sexual Behavior - Average number of female sex partners in lifetime (males 18+)
Sexual Behavior - Average number of female vaginal sex partners in lifetime (males 18+)
Sexual Behavior - Average age people first performed oral sex on a woman (18+)
Sexual Behavior - Average number of woman performed oral sex on in lifetime (18+)
Sexual Behavior - Average number of male sex partners in lifetime (males 18+)
Sexual Behavior - Average number of male anal sex partners in lifetime (males 18+)
Sexual Behavior - Average age people first performed oral sex on a man (18+)
Sexual Behavior - Average number of male oral sex partners in lifetime (18+)
Sexual Behavior - People using protection when performing oral sex (%)
Sexual Behavior - Average number of times people have vaginal or anal sex a year
Sexual Behavior - People having sex without condom (%)
Sexual Behavior - Average number of male sex partners in lifetime (females 18+)
Sexual Behavior - Average number of male vaginal sex partners in lifetime (females 18+)
Sexual Behavior - Average number of female sex partners in lifetime (females 18+)
Sexual Behavior - Circumcised males 18+ (%)
Sleep Disorders - Average hours sleeping at night
Sleep Disorders - People that has trouble sleeping (%)
Smoking-Cigarette Use - People smoking cigarettes (%)
Taste & Smell - People 40+ having problems with smell (%)
Taste & Smell - People 40+ having problems with taste (%)
Taste & Smell - People 40+ that ever had wisdom teeth removed (%)
Taste & Smell - People 40+ that ever had tonsils teeth removed (%)
Taste & Smell - People 40+ that ever had a loss of consciousness because of a head injury (%)
Taste & Smell - People 40+ that ever had a broken nose or other serious injury to face or skull (%)
Taste & Smell - People 40+ that ever had two or more sinus infections (%)
Weight - Average height (inches)
Weight - Average weight (pounds)
Weight - Average BMI
Weight - People that are obese (%)
Weight - People that ever were obese (%)
Weight - People trying to lose weight (%)
50,830 36.2% Hispanic 43,741 31.1% White alone 38,798 27.6% Asian alone 4,224 3.0% Two or more races 2,070 1.5% Black alone 470 0.3% Other race alone 320 0.2% Native Hawaiian and Other 99 0.07% American Indian alone
According to our research of California and other state lists, there were 107 registered sex offenders living in Fullerton, California as of April 27, 2024 . The ratio of all residents to sex offenders in Fullerton is 1,315 to 1.The ratio of registered sex offenders to all residents in this city is lower than the state average.
The City-Data.com crime index weighs serious crimes and violent crimes more heavily. Higher means more crime, U.S. average is 246.1. It adjusts for the number of visitors and daily workers commuting into cities.
- means the value is smaller than the state average.
- means the value is about the same as the state average.
- means the value is bigger than the state average.
- means the value is much bigger than the state average.
Crime rate in Fullerton detailed stats: murders, rapes, robberies, assaults, burglaries, thefts, arson Officers per 1,000 residents here:
0.81California average:
2.30
Latest news from Fullerton, CA collected exclusively by city-data.com from local newspapers, TV, and radio stations
Fullerton, CA City Guides: Ancestries: American (3.7%), English (3.0%), Irish (2.8%), German (2.4%), European (1.8%), Italian (1.3%).
Current Local Time:
Land area: 22.2 square miles.
Population density: 6,331 people per square mile (high).
41,817 residents are foreign born (16.0% Asia , 10.8% Latin America ).
This city:
29.6%California:
26.5%
Median real estate property taxes paid for housing units with mortgages in 2022: $6,136 (0.7%)Median real estate property taxes paid for housing units with no mortgage in 2022: $4,107 (0.5%)
Nearest city with pop. 200,000+: Anaheim, CA
Nearest city with pop. 1,000,000+: Los Angeles, CA
Nearest cities:
Latitude: 33.88 N, Longitude: 117.93 W
Daytime population change due to commuting: -4,899 (-3.5%)Workers who live and work in this city: 19,669 (28.1%)
Single-family new house construction building permits:
2022: 3 buildings , average cost: $388,5002021: 7 buildings , average cost: $602,5002020: 19 buildings , average cost: $206,8002019: 23 buildings , average cost: $197,6002018: 19 buildings , average cost: $296,2002017: 21 buildings , average cost: $358,1002016: 25 buildings , average cost: $288,0002015: 40 buildings , average cost: $313,5002014: 147 buildings , average cost: $200,2002013: 127 buildings , average cost: $233,7002012: 6 buildings , average cost: $241,4002011: 7 buildings , average cost: $258,2002010: 48 buildings , average cost: $120,0002009: 4 buildings , average cost: $157,9002008: 31 buildings , average cost: $177,7002007: 35 buildings , average cost: $186,4002006: 91 buildings , average cost: $162,4002005: 108 buildings , average cost: $154,0002004: 64 buildings , average cost: $155,1002003: 698 buildings , average cost: $204,3002002: 664 buildings , average cost: $196,3002001: 137 buildings , average cost: $228,1002000: 248 buildings , average cost: $199,7001999: 199 buildings , average cost: $231,1001998: 78 buildings , average cost: $228,0001997: 68 buildings , average cost: $195,900Unemployment in December 2023:
Population change in the 1990s: +12,260 (+10.8%).
Most common occupations in Fullerton, CA (%)
Both Males Females
Cooks and food preparation workers (6.5%)
Other management occupations, except farmers and farm managers (5.9%)
Building and grounds cleaning and maintenance occupations (3.8%)
Cashiers (3.1%)
Material recording, scheduling, dispatching, and distributing workers (3.0%)
Computer specialists (2.8%)
Retail sales workers, except cashiers (2.6%)
Other management occupations, except farmers and farm managers (6.6%)
Cooks and food preparation workers (6.4%)
Building and grounds cleaning and maintenance occupations (4.6%)
Computer specialists (4.2%)
Material recording, scheduling, dispatching, and distributing workers (3.9%)
Engineers (3.5%)
Driver/sales workers and truck drivers (2.8%)
Cooks and food preparation workers (6.7%)
Other management occupations, except farmers and farm managers (5.2%)
Cashiers (4.8%)
Other office and administrative support workers, including supervisors (4.5%)
Supervisors and other personal care and service workers, except child care workers (3.9%)
Secretaries and administrative assistants (3.8%)
Registered nurses (3.5%)
Earthquake activity:
Fullerton-area historical earthquake activity is significantly above California state average. It is 6972% greater than the overall U.S. average. On 7/21/1952 at 11:52:14, a magnitude 7.7 (7.7 UK, Class: Major, Intensity: VIII - XII) earthquake occurred 98.7 miles away from Fullerton center, causing $50,000,000 total damage On 6/28/1992 at 11:57:34, a magnitude 7.6 (6.2 MB, 7.6 MS, 7.3 MW, Depth: 0.7 mi) earthquake occurred 82.8 miles away from Fullerton center, causing 3 deaths ( 1 shaking deaths, 2 other deaths) and 400 injuries, causing $100,000,000 total damage and $40,000,000 insured lossesOn 10/16/1999 at 09:46:44, a magnitude 7.4 (6.3 MB, 7.4 MS, 7.2 MW, 7.3 ML) earthquake occurred 96.1 miles away from Fullerton center On 11/4/1927 at 13:51:53, a magnitude 7.5 (7.5 UK) earthquake occurred 191.0 miles away from the city center On 4/21/1918 at 22:32:30, a magnitude 6.8 (6.8 UK, Class: Strong, Intensity: VII - IX) earthquake occurred 28.5 miles away from the city center On 5/19/1940 at 04:36:40, a magnitude 7.2 (7.2 UK) earthquake occurred 136.5 miles away from the city center, causing $33,000,000 total damage Magnitude types: body-wave magnitude (MB), local magnitude (ML), surface-wave magnitude (MS), moment magnitude (MW) Natural disasters: The number of natural disasters in Orange County (32) is a lot greater than the US average (15).Major Disasters (Presidential) Declared: 22Emergencies Declared: 2Floods: 15, Fires: 13, Storms: 9, Landslides: 6, Winter Storms: 6, Mudslides: 5, Earthquakes: 2, Heavy Rain: 1, Hurricane: 1, Snow: 1, Tornado: 1, Wind: 1, Other: 1 (Note: some incidents may be assigned to more than one category). Main business address for: BECKMAN COULTER INC LABORATORY ANALYTICAL INSTRUMENTS ).
Hospitals in Fullerton: CARE MORE HOSPICE, INC (2495 E ORANGETHORPE AVENUE, SUITE 200) CRISTINA'S HOME (1455 WOODCREST AVENUE) FULLERTON COMM HOSP (provides emergency services, 100 E VALLEY VIEW DRIVE) FULLERTON OUTPATIENT SURGERY MED CTR (1835 SUNNYCREST DRIVE) IND OPTS-SHERWOOD HOUSE (2625 E SHERWOOD AVENUE) ST JUDE MEDICAL CENTER (Voluntary non-profit - Church, 101 E VALENCIA MESA DRIVE) WASHINGTON AVENUE HOME (604 WASHINGTON AVENUE) Nursing Homes in Fullerton: FULLERTON POST ACUTE CARE (2222 N. HARBOR BLVD.) GORDON LANE CARE CENTER (1821 E CHAPMAN AVE) GREENFIELD CARE CENTER OF FULLERTON, LLC (330 W. BASTANCHURY ROAD) PARK VISTA AT MORNINGSIDE (2525 BREA BLVD.) ST ELIZABETH HEALTHCARE CENTER (2800 N. HARBOR BLVD.) TERRACE VIEW CARE CENTER (201 EAST BASTANCHURY) WINDSOR GARDENS CARE CENTER OF FULLERTON (245 E WILSHIRE AVENUE) Dialysis Facilities in Fullerton: DAVITA-CROSSROADS DIALYSIS CENTER (3214 YORBA LINDA BLVD.) FULLERTON DIALYSIS (238 ORANGEFAIR MALL) Home Health Centers in Fullerton: CARE PROVIDERS, THE (505 E COMMONWEALTH AVENUE) LIFESAVERS' HOME HEALTH SERVICES, INC (903 W WILSHIRE BLVD) Airports located in Fullerton: Amtrak station: FULLERTON (120 E. SANTA FE AVE.)
.
Services: ticket office, fully wheelchair accessible, enclosed waiting area, public restrooms, public payphones, full-service food facilities, free short-term parking, paid long-term parking, taxi stand, public transit connection.
Colleges/Universities in Fullerton: California State University-Fullerton Full-time enrollment: 28,947; Location: 800 N State College Blvd; Public; Website: www.fullerton.edu; Offers Doctor's degree )
Fullerton College Full-time enrollment: 11,124; Location: 321 E Chapman Avenue; Public; Website: www.fullcoll.edu)
Hope International University Full-time enrollment: 1,027; Location: 2500 E Nutwood Ave; Private, not-for-profit; Website: www.hiu.edu; Offers Master's degree )
Grace Mission University Full-time enrollment: 121; Location: 1645 West Valencia Drive; Private, not-for-profit; Website: www.gm.edu; Offers Doctor's degree )
Marshall B Ketchum University Full-time enrollment: 4; Location: 2575 Yorba Linda Blvd; Private, not-for-profit; Website: www.ketchum.edu; Offers Doctor's degree )
Western State College of Law at Argosy University Location: 1111 N State College Blvd; Private, for-profit; Website: www.wsulaw.edu; Offers Doctor's degree )
Other colleges/universities with over 2000 students near Fullerton:
West Coast University-Orange County (about 5 miles; Anaheim, CA ; Full-time enrollment: 2,464)
Biola University (about 6 miles; La Mirada, CA ; FT enrollment: 5,325)
Cypress College (about 7 miles; Cypress, CA ; FT enrollment: 8,732)
Chapman University (about 8 miles; Orange, CA ; FT enrollment: 7,089)
Trident University International (about 8 miles; Cypress, CA ; FT enrollment: 5,974)
Santa Ana College (about 9 miles; Santa Ana, CA ; FT enrollment: 11,756)
Hacienda La Puente Adult Education (about 10 miles; La Puente, CA ; FT enrollment: 2,750)
Public high schools in Fullerton: TROY HIGH Students: 1,901, Location: 2200 E. DOROTHY LN., Grades: 9-12)SUNNY HILLS HIGH Students: 1,820, Location: 1801 WARBURTON WAY, Grades: 9-12)FULLERTON UNION HIGH Students: 1,398, Location: 201 E. CHAPMAN AVE., Grades: 9-12)LA SIERRA HIGH (ALTERNATIVE) Students: 324, Location: 951 N. STATE COLLEGE BLVD., Grades: 9-12)LA VISTA HIGH (CONTINUATION) Students: 79, Location: 909 N. STATE COLLEGE BLVD., Grades: 9-12)ORANGE COUNTY CONSERVATION CORPS CHARTER Location: 1548 E. WALNUT AVE., Grades: 9-12, Charter school )
Private high schools in Fullerton: ROSARY HIGH SCHOOL Students: 576, Location: 1340 N ACACIA AVE, Grades: 9-12, Girls only )
EASTSIDE CHRISTIAN SCHOOLS Students: 238, Location: 2505 YORBA LINDA BLVD, Grades: KG-12)
Biggest public elementary/middle schools in Fullerton: D. RUSSELL PARKS JUNIOR HIGH Students: 974, Location: 1710 ROSECRANS AVE., Grades: 7-8)LADERA VISTA JUNIOR HIGH Students: 911, Location: 1700 E. WILSHIRE DR., Grades: 7-8)NICOLAS JUNIOR HIGH Students: 833, Location: 1100 W. OLIVE AVE., Grades: 7-8)ROBERT C. FISLER ELEMENTARY Students: 681, Location: 1350 STARBUCK ST., Grades: KG-8)BEECHWOOD ELEMENTARY Students: 583, Location: 780 BEECHWOOD AVE., Grades: KG-8)SUNSET LANE ELEMENTARY Students: 532, Location: 2030 SUNSET LN., Grades: KG-6)ORANGETHORPE ELEMENTARY Students: 528, Location: 1400 S. BROOKHURST RD., Grades: KG-6)RICHMAN ELEMENTARY Students: 513, Location: 700 S. RICHMAN AVE., Grades: KG-6)GOLDEN HILL ELEMENTARY Students: 505, Location: 732 BARRIS DR., Grades: KG-6)PACIFIC DRIVE ELEMENTARY Students: 469, Location: 1501 W. VALENCIA DR., Grades: KG-6)Private elementary/middle schools in Fullerton: ST JULIANA FALCONIERI SCHOOL Students: 290, Location: 1320 N ACACIA AVE, Grades: KG-8)
ANNUNCIATION CATHOLIC SCHOOL Students: 141, Location: 215 S PINE DR, Grades: PK-8)
ARBORLAND MONTESSORI & EDUCATION CENTER Students: 113, Location: 2121 HUGHES DR, Grades: PK-6)
ARBORLAND MONTESSORI CHILDREN'S ACADEMY Students: 76, Location: 1700 W VALENCIA DR, Grades: PK-6)
BERKELEY SCHOOL Students: 19, Location: 306 N POMONA AVE, Grades: KG-6)
See full list of schools located in Fullerton Library in Fullerton: FULLERTON PUBLIC LIBRARY Operating income: $3,977,680; Location: 353 W. COMMONWEALTH AVE.; 281,462 books ; 251 e-books ; 12,166 audio materials ; 13,953 video materials ; 13 local licensed databases ; 1 other licensed databases ; 352 print serial subscriptions ; 3 electronic serial subscriptions )
Notable locations in Fullerton: (A) , Fullerton Municipal Golf Course (B) , Fullerton Union Pacific Depot (C) , Hunt Public Library (D) , Fullerton Public Library (E) , Fullerton Museum Center (F) , Fullerton City Hall (G) , North Orange County Municipal Court (H) , Muckenthaler Cultural Center (I) , Loma Vista Mausoleum (J) , Orange County Fire Authority Station 41 (K) , University Hall (L) , Titan Student Union (M) , Titan House (N) , Titan Gymnasium (O) , Ruby Gerontology Center (P) , Portola Pavilion (Q) , Pollack Library (R) , Nutwood Parking Structure (S) , McCarthy Hall (T) . Display/hide their locations on the map
Shopping Centers: (1) , Sunrise Valley Shopping Center (2) , La Mancha Shopping Center (3) , Camino Del Sol Shopping Center (4) , Metrocenter Fullerton Shopping Center (5) , Fullerton Town Center Shopping Center (6) , East Fullerton Shopping Center (7) , College Plaza Shopping Center (8) , West Fullerton Shopping Center (9) . Display/hide their locations on the map
Churches in Fullerton include: (A) , Church of Jesus Christ of Latter Day Saints (B) , Dongshin Presbyterian Church (C) , First Baptist Church of Fullerton (D) , First Christian Church (E) , First Church of Religious Science (F) , First Presbyterian Church (G) , Fullerton First Lutheran Church (H) , Fullerton First United Methodist Church (I) . Display/hide their locations on the map
Cemetery: (1) . Display/hide its location on the map
Lakes and reservoirs: (A) , Fullerton Reservoir (B) , Brea Reservoir (C) . Display/hide their locations on the map
Parks in Fullerton include: (1) , Goodwin Field (2) , Adlena Park (3) , Amerige Park (4) , Chapman Park (5) , Hillcrest Park (6) , Hiltscher Park (7) , San Juan Park (8) , Simpson Park (9) . Display/hide their locations on the map
Tourist attractions: (1) , A M F Bowling Centers (Amusement & Theme Parks; 1501 South Lemon Street) (2) , American Youth Hostel (1700 North Harbor Boulevard) (3) , Carter Bowl Professional Shop (1501 South Lemon Street) (4) . Display/hide their approximate locations on the map
Hotels: (1) , Ambassador Inn (2100 West Commonwealth Avenue) (2) , Anaheim Park Hotel (222 W Houston Ave) (3) . Display/hide their approximate locations on the map
Birthplace of: Nadya Suleman - Mother of octuplets, Gwen Stefani - (born 1969), singer-songwriter, Chris Norby - California State Assemblyman, Stacey Q - Singer, Janet Evans - Swimmer, Adam Snyder - 2005 NFL player (San Francisco 49ers, born : Jan 30, 1982), Skip Stellrecht - Film actor, James Harder - Professor of Engineering and UFOlogist, Jeff Soto - Artist, Travis Kirschke - 2005 NFL player (Pittsburgh Steelers, born : Sep 6, 1974).
Orange County has a predicted average indoor radon screening level less than 2 pCi/L (pico curies per liter) - Low Potential Average household size: This city:
2.9 peopleCalifornia:
2.9 people
Percentage of family households: This city:
68.8%Whole state:
68.7%
Percentage of households with unmarried partners: This city:
5.9%Whole state:
7.2%
Likely homosexual households (counted as self-reported same-sex unmarried-partner households)
Lesbian couples: 0.4% of all households Gay men: 0.3% of all households
People in group quarters in Fullerton in 2010:
1,231 people in college/university student housing
629 people in nursing facilities/skilled-nursing facilities
352 people in group homes intended for adults
341 people in emergency and transitional shelters (with sleeping facilities) for people experiencing homelessness
333 people in other noninstitutional facilities
121 people in residential treatment centers for juveniles (non-correctional)
31 people in workers' group living quarters and job corps centers
30 people in residential treatment centers for adults
9 people in group homes for juveniles (non-correctional)
People in group quarters in Fullerton in 2000:
876 people in college dormitories (includes college quarters off campus)
846 people in nursing homes
593 people in other noninstitutional group quarters
236 people in homes or halfway houses for drug/alcohol abuse
66 people in homes for the mentally retarded
49 people in other group homes
32 people in homes for the mentally ill
24 people in other nonhousehold living situations
22 people in residential treatment centers for emotionally disturbed children
16 people in homes for abused, dependent, and neglected children
10 people in religious group quarters
Banks with most branches in Fullerton (2011 data):
Opus Bank: Fullerton Community Bank Branch, Fullerton Office, 2400 E Chapman Av Branch, 1805 W Orangethorpe Branch. Info updated 2011/11/08: Bank assets: $2,404.2 mil, Deposits: $1,831.2 mil, headquarters in Irvine, CA, negative income in the last year , Commercial Lending Specialization, 38 total offices
JPMorgan Chase Bank, National Association: Harbor Blvd Branch, Fullerton Branch, Fullerton Branch, Orangethorpe Branch. Info updated 2011/11/10: Bank assets: $1,811,678.0 mil, Deposits: $1,190,738.0 mil, headquarters in Columbus, OH, positive income , International Specialization, 5577 total offices , Holding Company: Jpmorgan Chase & Co.
Bank of America, National Association: Sunny Hills Branch, Fullerton Main Branch, Fullerton Metro Center, East Fullerton Branch. Info updated 2009/11/18: Bank assets: $1,451,969.3 mil, Deposits: $1,077,176.8 mil, headquarters in Charlotte, NC, positive income , 5782 total offices , Holding Company: Bank Of America Corporation
U.S. Bank National Association: Fullerton Albertsons Branch, California State University Branch, Sunny Hills Branch, Fullerton Branch. Info updated 2012/01/30: Bank assets: $330,470.8 mil, Deposits: $236,091.5 mil, headquarters in Cincinnati, OH, positive income , 3121 total offices , Holding Company: U.S. Bancorp
Wells Fargo Bank, National Association: Fullerton Branch, Fullerton Yorba Linda Branch, Ameriage Heights Branch. Info updated 2011/04/05: Bank assets: $1,161,490.0 mil, Deposits: $905,653.0 mil, headquarters in Sioux Falls, SD, positive income , 6395 total offices , Holding Company: Wells Fargo & Company
Union Bank, National Association: Sunny Hills Branch, University Branch, Fullerton Branch. Info updated 2011/09/01: Bank assets: $88,967.5 mil, Deposits: $65,286.4 mil, headquarters in San Francisco, CA, positive income , Commercial Lending Specialization, 403 total offices , Holding Company: Mitsubishi Ufj Financial Group, Inc.
Citibank, National Association: North Harbor Boulevard Branch at 320 North Harbor Boulevard, branch established on 1934/10/01. Info updated 2012/01/10: Bank assets: $1,288,658.0 mil, Deposits: $882,541.0 mil, headquarters in Sioux Falls, SD, positive income , International Specialization, 1048 total offices , Holding Company: Citigroup Inc.
Citizens Business Bank: Fullerton Business Financial Center at 301 N. Harbor Blvd Suite 101, branch established on 1981/05/14. Info updated 2011/03/30: Bank assets: $6,475.4 mil, Deposits: $4,625.6 mil, headquarters in Ontario, CA, positive income , Commercial Lending Specialization, 46 total offices , Holding Company: Cvb Financial Corp.
Farmers and Merchants Bank of Long Beach: West Fullerton Branch at 315 North Harbor Boulevard, branch established on 1971/11/01. Info updated 2006/11/03: Bank assets: $4,659.3 mil, Deposits: $3,393.5 mil, headquarters in Long Beach, CA, positive income , Commercial Lending Specialization, 22 total offices , Holding Company: Palomar Enterprises, Llc
3 other banks with 3 local branches
For population 15 years and over in Fullerton:
Never married: 35.4%Now married: 48.8%Separated: 2.2%Widowed: 4.9%Divorced: 8.7% For population 25 years and over in Fullerton:
High school or higher: 87.6%Bachelor's degree or higher: 46.2%Graduate or professional degree: 17.7%Unemployed: 5.7%Mean travel time to work (commute): 25.9 minutes
Education Gini index (Inequality in education) Here:
14.4California average:
15.5
Religion statistics for Fullerton, CA (based on Orange County data)
Religion Adherents Congregations Catholic 797,473 67 Evangelical Protestant 345,893 894 Other 141,815 329 Mainline Protestant 76,574 202 Orthodox 13,406 19 Black Protestant 2,424 8 None 1,632,647 -
Source: Clifford Grammich, Kirk Hadaway, Richard Houseal, Dale E.Jones, Alexei Krindatch, Richie Stanley and Richard H.Taylor. 2012. 2010 U.S.Religion Census: Religious Congregations & Membership Study. Association of Statisticians of American Religious Bodies. Jones, Dale E., et al. 2002. Congregations and Membership in the United States 2000. Nashville, TN: Glenmary Research Center. Graphs represent county-level data
Food Environment Statistics: Number of grocery stores : 530This county :
1.78 / 10,000 pop.California :
2.14 / 10,000 pop.
Number of supercenters and club stores : 18Here :
0.06 / 10,000 pop.State :
0.04 / 10,000 pop.
Number of convenience stores (no gas) : 147Orange County :
0.49 / 10,000 pop.California :
0.62 / 10,000 pop.
Number of convenience stores (with gas) : 434Here :
1.46 / 10,000 pop.California :
1.49 / 10,000 pop.
Number of full-service restaurants : 2,438Here :
8.19 / 10,000 pop.California :
7.42 / 10,000 pop.
Adult diabetes rate : This county :
6.3%State :
7.3%
Adult obesity rate : This county :
18.5%California :
21.3%
Low-income preschool obesity rate : This county :
16.4%State :
17.9%
Health and Nutrition: Healthy diet rate : Fullerton:
50.7%California:
49.4%
Average overall health of teeth and gums : Average BMI : Fullerton:
27.7California:
28.1
People feeling badly about themselves : This city:
19.0%California:
20.2%
People not drinking alcohol at all : Fullerton:
11.9%California:
11.2%
Average hours sleeping at night : This city:
6.8California:
6.8
Overweight people : Here:
30.8%California:
31.5%
General health condition : Fullerton:
57.8%California:
56.4%
Average condition of hearing : This city:
81.3%California:
80.9%
More about Health and Nutrition of Fullerton, CA Residents
Local government employment and payroll (March 2022)
Function
Full-time employees
Monthly full-time payroll
Average yearly full-time wage
Part-time employees
Monthly part-time payroll
Police Protection - Officers
121 $1,481,698 $146,945 12 $19,681 Firefighters
67 $908,995 $162,805 1 $979 Streets and Highways
55 $311,461 $67,955 2 $3,924 Water Supply
41 $235,797 $69,014 1 $1,594 Police - Other
40 $271,237 $81,371 2 $3,625 Financial Administration
33 $178,641 $64,960 0 $0 Other and Unallocable
27 $157,622 $70,054 1 $2,385 Housing and Community Development (Local)
22 $166,302 $90,710 6 $33,356 Local Libraries
16 $85,168 $63,876 8 $8,244 Sewerage
14 $78,065 $66,913 1 $2,905 Other Government Administration
13 $85,425 $78,854 10 $32,696 Parks and Recreation
12 $70,144 $70,144 36 $51,396 Airports
6 $31,983 $63,966 0 $0 Fire - Other
1 $8,928 $107,136 3 $1,701
Totals for Government
468 $4,071,466 $104,397 83 $162,485
Fullerton government finances - Expenditure in 2021 (per resident):
Construction - Regular Highways: $14,227,000 ($101.23)
General - Other: $556,000 ($3.96)Housing and Community Development: $488,000 ($3.47)Police Protection: $380,000 ($2.70)Parks and Recreation: $152,000 ($1.08)Sewerage: $102,000 ($0.73)Health - Other: $87,000 ($0.62)Miscellaneous Commercial Activities - Other: $85,000 ($0.60)Central Staff Services: $76,000 ($0.54)Hospitals: $74,000 ($0.53)Solid Waste Management: $70,000 ($0.50)Air Transportation: $68,000 ($0.48)Parking Facilities: $61,000 ($0.43)Transit Utilities: $53,000 ($0.38)Gas Utilities: $48,000 ($0.34)Electric Utilities: $47,000 ($0.33)Public Welfare - Other: $47,000 ($0.33)Water Utilities: $45,000 ($0.32)General Public Buildings: $43,000 ($0.31)Judicial and Legal Services: $42,000 ($0.30)Financial Administration: $40,000 ($0.28)Libraries: $27,000 ($0.19)Protective Inspection and Regulation - Other: $15,000 ($0.11)Local Fire Protection: $5,000 ($0.04)Natural Resources - Other: $4,000 ($0.03)Correctional Institutions: $2,000 ($0.01)Current Operations - Police Protection: $48,785,000 ($347.12)
Water Utilities: $30,268,000 ($215.37)General - Other: $29,976,000 ($213.29)Local Fire Protection: $24,185,000 ($172.09)Solid Waste Management: $18,822,000 ($133.93)Central Staff Services: $10,464,000 ($74.46)Parks and Recreation: $7,452,000 ($53.02)Regular Highways: $6,654,000 ($47.35)Protective Inspection and Regulation - Other: $5,104,000 ($36.32)Libraries: $3,760,000 ($26.75)Housing and Community Development: $2,886,000 ($20.53)Sewerage: $2,633,000 ($18.73)Air Transportation: $1,452,000 ($10.33)Judicial and Legal Services: $500,000 ($3.56)Gas Utilities: $169,000 ($1.20)Transit Utilities: $101,000 ($0.72)Financial Administration: $100,000 ($0.71)Parking Facilities: $96,000 ($0.68)General - Interest on Debt: $2,117,000 ($15.06)
Other Capital Outlay - General - Other: $283,000 ($2.01)
Parks and Recreation: $153,000 ($1.09)Sewerage: $102,000 ($0.73)Housing and Community Development: $91,000 ($0.65)Health - Other: $88,000 ($0.63)Miscellaneous Commercial Activities - Other: $85,000 ($0.60)Central Staff Services: $76,000 ($0.54)Hospitals: $74,000 ($0.53)Regular Highways: $70,000 ($0.50)Solid Waste Management: $70,000 ($0.50)Air Transportation: $68,000 ($0.48)Parking Facilities: $61,000 ($0.43)Transit Utilities: $53,000 ($0.38)Gas Utilities: $48,000 ($0.34)Electric Utilities: $47,000 ($0.33)Public Welfare - Other: $47,000 ($0.33)Water Utilities: $45,000 ($0.32)General Public Building: $43,000 ($0.31)Judicial and Legal Services: $42,000 ($0.30)Financial Administration: $40,000 ($0.28)Libraries: $27,000 ($0.19)Protective Inspection and Regulation - Other: $15,000 ($0.11)Local Fire Protection: $5,000 ($0.04)Natural Resources - Other: $4,000 ($0.03)Correctional Institutions: $2,000 ($0.01)Police Protection: $1,000 ($0.01)Water Utilities - Interest on Debt: $227,000 ($1.62)
Fullerton government finances - Revenue in 2021 (per resident):
Charges - Other: $36,524,000 ($259.88)
Sewerage: $6,182,000 ($43.99)Parks and Recreation: $4,423,000 ($31.47)Air Transportation: $1,824,000 ($12.98)Solid Waste Management: $972,000 ($6.92)Natural Resources - Other: $1,000 ($0.01)Federal Intergovernmental - Housing and Community Development: $1,373,000 ($9.77)
Other: $681,000 ($4.85)Water Utilities: $290,000 ($2.06)Air Transportation: $258,000 ($1.84)Local Intergovernmental - Other: $4,302,000 ($30.61)
Miscellaneous - General Revenue - Other: $3,495,000 ($24.87)
Rents: $2,427,000 ($17.27)Interest Earnings: $1,350,000 ($9.61)Fines and Forfeits: $1,014,000 ($7.21)Special Assessments: $448,000 ($3.19)Donations From Private Sources: $444,000 ($3.16)Revenue - Water Utilities: $43,858,000 ($312.07)
Gas Utilities: $169,000 ($1.20)State Intergovernmental - Other: $6,448,000 ($45.88)
Highways: $5,592,000 ($39.79)Water Utilities: $689,000 ($4.90)General Local Government Support: $138,000 ($0.98)Tax - Property: $50,011,000 ($355.85)
General Sales and Gross Receipts: $31,962,000 ($227.42)Public Utilities Sales: $4,382,000 ($31.18)Other License: $2,850,000 ($20.28)Other Selective Sales: $1,330,000 ($9.46)Occupation and Business License - Other: $1,126,000 ($8.01)Documentary and Stock Transfer: $931,000 ($6.62)Other: $7,000 ($0.05)
Fullerton government finances - Debt in 2021 (per resident):
Long Term Debt - Beginning Outstanding - Unspecified Public Purpose: $89,316,000 ($635.52)
Retired Unspecified Public Purpose: $50,376,000 ($358.44)Outstanding Unspecified Public Purpose: $43,976,000 ($312.91)Issue, Unspecified Public Purpose: $5,035,000 ($35.83)Outstanding Nonguaranteed - Industrial Revenue: $269,000 ($1.91)Beginning Outstanding - Public Debt for Private Purpose: $269,000 ($1.91)
Fullerton government finances - Cash and Securities in 2021 (per resident):
Bond Funds - Cash and Securities: $7,638,000 ($54.35)
Other Funds - Cash and Securities: $89,720,000 ($638.39)
Sinking Funds - Cash and Securities: $9,123,000 ($64.91)
4.86% of this county's 2021 resident taxpayers lived in other counties in 2020 ($95,983 average adjusted gross income )
Here:
4.86%California average:
5.19%
0.01% of residents moved from foreign countries ($132 average AGI )Orange County:
0.01%California average:
0.03%
Top counties from which taxpayers relocated into this county between 2020 and 2021:
5.71% of this county's 2020 resident taxpayers moved to other counties in 2021 ($106,828 average adjusted gross income )
Here:
5.71%California average:
6.14%
0.01% of residents moved to foreign countries ($180 average AGI )Orange County:
0.01%California average:
0.02%
Top counties to which taxpayers relocated from this county between 2020 and 2021:
Businesses in Fullerton, CA
Name Count Name Count
7-Eleven 6 Jack In The Box 6 99 Cents Only Stores 2 Jamba Juice 1 AMF Bowling 1 Jones New York 4 AT&T 1 KFC 3 Ace Hardware 1 Kohl's 1 Albertsons 4 Kroger 3 AutoZone 4 LA Fitness 1 Avenue 1 Little Caesars Pizza 2 Baja Fresh Mexican Grill 1 Marriott 1 Bally Total Fitness 1 Marshalls 1 Barnes & Noble 1 MasterBrand Cabinets 12 Baskin-Robbins 2 McDonald's 3 Bath & Body Works 1 Nike 9 Big O Tires 1 Office Depot 2 Blockbuster 1 Old Navy 1 Burger King 2 Panda Express 2 Burlington Coat Factory 1 Panera Bread 2 CVS 5 Papa John's Pizza 2 Carl\s Jr. 5 Payless 3 Casual Male XL 1 PetSmart 1 Catherines 1 Pizza Hut 1 Chipotle 1 Quiznos 2 Chuck E. Cheese's 1 RadioShack 2 Circle K 3 Rite Aid 3 Cold Stone Creamery 1 Sam's Club 1 Costco 1 Skechers USA 1 Curves 1 Sprint Nextel 1 DHL 3 Staples 1 Decora Cabinetry 3 Starbucks 10 Dennys 2 Subaru 1 Discount Tire 1 Subway 11 Domino's Pizza 2 Taco Bell 5 El Pollo Loco 3 Target 3 FedEx 13 Toys"R"Us 1 Firestone Complete Auto Care 1 U-Haul 3 GNC 3 UPS 16 GameStop 3 Vans 1 H&R Block 3 Verizon Wireless 2 Holiday Inn 2 Walgreens 2 Home Depot 1 Wendy's 1 IHOP 1 YMCA 1
Strongest AM radio stations in Fullerton:
KFI (640 AM; 50 kW; LOS ANGELES, CA; Owner: CAPSTAR TX LIMITED PARTNERSHIP)
KTNQ (1020 AM; 50 kW; LOS ANGELES, CA; Owner: KTNQ-AM LICENSE CORP.)
KXTA (1150 AM; 50 kW; LOS ANGELES, CA; Owner: CITICASTERS LICENSES, L.P.)
KLAC (570 AM; 50 kW; LOS ANGELES, CA; Owner: AMFM RADIO LICENSES, L.L.C.)
KPLS (830 AM; 50 kW; ORANGE, CA; Owner: CRN LICENSES, LLC)
KDIS (1110 AM; 50 kW; PASADENA, CA; Owner: ABC,INC.)
KFWB (980 AM; 50 kW; LOS ANGELES, CA; Owner: INFINITY BROADCASTING OPERATIONS, INC.)
KMPC (1540 AM; 50 kW; LOS ANGELES, CA; Owner: ROSE CITY RADIO CORPORATION)
KNX (1070 AM; 50 kW; LOS ANGELES, CA; Owner: INFINITY BROADCASTING OPERATIONS, INC.)
KALI (900 AM; 6 kW; WEST COVINA, CA; Owner: MULTICULTURAL RADIO BROADCASTING, INC.)
KBLA (1580 AM; 50 kW; SANTA MONICA, CA)
KSPN (710 AM; 50 kW; LOS ANGELES, CA; Owner: KABC-AM RADIO, INC.)
KXMX (1190 AM; 25 kW; ANAHEIM, CA; Owner: NEW INSPIRATION BROADCASTING COMPANY)
Strongest FM radio stations in Fullerton:
KCBS-FM (93.1 FM; LOS ANGELES, CA; Owner: INFINITY BROADCASTING OPERATIONS, INC.)
KZLA-FM (93.9 FM; LOS ANGELES, CA; Owner: EMMIS RADIO LICENSE CORPORATION)
KSCA (101.9 FM; GLENDALE, CA; Owner: HBC LICENSE CORPORATION)
KLOS (95.5 FM; LOS ANGELES, CA; Owner: KLOS-FM RADIO, INC.)
K212FA (90.3 FM; TEMPLE CITY, CA; Owner: EDUCATIONAL MEDIA FOUNDATION)
KOST (103.5 FM; LOS ANGELES, CA; Owner: CAPSTAR TX LIMITED PARTNERSHIP)
KPWR (105.9 FM; LOS ANGELES, CA; Owner: EMMIS RADIO LICENSE CORPORATION)
KLSX (97.1 FM; LOS ANGELES, CA; Owner: INFINITY BROADCASTING OPERATIONS, INC.)
KUSC (91.5 FM; LOS ANGELES, CA; Owner: UNIVERSITY OF SOUTHERN CALIFORNIA)
KIIS-FM (102.7 FM; LOS ANGELES, CA; Owner: CITICASTERS LICENSES, L.P.)
KLVE (107.5 FM; LOS ANGELES, CA; Owner: KLVE-FM LICENSE CORP.)
KKLA-FM (99.5 FM; LOS ANGELES, CA; Owner: NEW INSPIRATION BROADCASTING CO., INC.)
KPCC (89.3 FM; PASADENA, CA; Owner: PASADENA AREA COMMUNITY COLLEGE DISTRICT)
KHHT (92.3 FM; LOS ANGELES, CA; Owner: AMFM RADIO LICENSES, L.L.C.)
KBIG-FM (104.3 FM; LOS ANGELES, CA; Owner: AMFM RADIO LICENSES, L.L.C.)
KTWV (94.7 FM; LOS ANGELES, CA; Owner: INFINITY BROADCASTING OPERATIONS, INC.)
KMZT-FM (105.1 FM; LOS ANGELES, CA; Owner: MOUNT WILSON FM BROADCASTERS, INC.)
KPFK (90.7 FM; LOS ANGELES, CA; Owner: PACIFICA FOUNDATION, INC)
K216EM (91.1 FM; ARCADIA, CA; Owner: LIFE ON THE WAY COMMUNICATIONS, INC.)
KRTH-FM (101.1 FM; LOS ANGELES, CA; Owner: INFINITY BROADCASTING OPERATIONS, INC.)
TV broadcast stations around Fullerton:
KTRO-LP (Channel 50; LANCASTER, CA; Owner: ROBERT D. ADELMAN)
KCBS-TV (Channel 2; LOS ANGELES, CA; Owner: CBS BROADCASTING INC.)
KHIZ (Channel 64; BARSTOW, CA; Owner: SUNBELT TELEVISION, INC.)
KTLA-TV (Channel 5; LOS ANGELES, CA; Owner: KTLA INC.)
KABC-TV (Channel 7; LOS ANGELES, CA; Owner: ABC HOLDING COMPANY, INC.)
KCAL-TV (Channel 9; LOS ANGELES, CA; Owner: VIACOM TELEVISION STATIONS GROUP OF LOS ANGELES LLC)
KNBC (Channel 4; LOS ANGELES, CA; Owner: NBC SUBSIDIARY (KNBC-TV), INC.)
KMEX-TV (Channel 34; LOS ANGELES, CA; Owner: KMEX LICENSE PARTNERSHIP, G.P.)
KAZA-TV (Channel 54; AVALON, CA; Owner: PAPPAS SOUTHERN CALIFORNIA LICENSE LLC)
KDOC-TV (Channel 56; ANAHEIM, CA; Owner: GOLDEN ORANGE BROADCASTING CO., INC.)
KOCE-TV (Channel 50; HUNTINGTON BEACH, CA; Owner: BD. OF TRUSTEES, COAST COMMUNITY COLLEGE DIST.)
KSCI (Channel 18; LONG BEACH, CA; Owner: KSLS, INC.)
KXLA (Channel 44; RANCHO PALOS VERDES, CA; Owner: RANCHO PALOS VERDES BROADCASTERS, INC.)
KCET (Channel 28; LOS ANGELES, CA; Owner: COMMUNITY TELEVISION OF SOUTHERN CALIFORNIA)
KFTR (Channel 46; ONTARIO, CA; Owner: TELEFUTURA LOS ANGELES LLC)
National Bridge Inventory (NBI) Statistics 99 Number of bridges1,358ft / 414m Total length $1,652,000 Total costs4,989,788 Total average daily traffic223,359 Total average daily truck traffic
New bridges - historical statistics
3 1920-1929 4 1930-1939 3 1940-1949 20 1950-1959 18 1960-1969 31 1970-1979 7 1980-1989 6 1990-1999 7 2000-2009
See full National Bridge Inventory statistics for Fullerton, CA
Home Mortgage Disclosure Act Aggregated Statistics For Year 2009(Based on 21 full and 11 partial tracts) A) FHA, FSA/RHS & VA B) Conventional C) Refinancings D) Home Improvement Loans E) Loans on Dwellings For 5+ Families F) Non-occupant Loans on G) Loans On Manufactured Number Average Value Number Average Value Number Average Value Number Average Value Number Average Value Number Average Value Number Average Value
LOANS ORIGINATED 299 $334,571 605 $339,600 2,367 $321,888 107 $251,326 15 $8,424,274 155 $261,709 17 $157,845 APPLICATIONS APPROVED, NOT ACCEPTED 27 $315,790 76 $313,168 272 $356,519 19 $138,084 0 $0 24 $260,402 4 $146,632 APPLICATIONS DENIED 71 $323,963 146 $311,551 711 $348,999 37 $174,708 2 $820,000 65 $245,300 15 $129,335 APPLICATIONS WITHDRAWN 50 $332,970 123 $335,132 441 $341,173 19 $217,819 0 $0 45 $258,543 0 $0 FILES CLOSED FOR INCOMPLETENESS 15 $386,481 31 $351,536 134 $357,571 8 $238,244 2 $710,545 12 $241,552 2 $73,325
Aggregated Statistics For Year 2008(Based on 21 full and 11 partial tracts) A) FHA, FSA/RHS & VA B) Conventional C) Refinancings D) Home Improvement Loans E) Loans on Dwellings For 5+ Families F) Non-occupant Loans on G) Loans On Manufactured Number Average Value Number Average Value Number Average Value Number Average Value Number Average Value Number Average Value Number Average Value
LOANS ORIGINATED 131 $382,652 720 $344,686 1,077 $322,107 148 $180,117 12 $3,119,694 161 $287,847 21 $114,962 APPLICATIONS APPROVED, NOT ACCEPTED 16 $353,640 127 $352,000 266 $344,765 26 $196,177 0 $0 34 $290,648 12 $146,685 APPLICATIONS DENIED 27 $370,311 194 $348,419 674 $390,524 131 $137,547 2 $2,258,155 90 $295,804 22 $134,505 APPLICATIONS WITHDRAWN 19 $372,287 135 $366,707 299 $339,858 23 $172,014 1 $6,000,000 43 $284,406 2 $293,875 FILES CLOSED FOR INCOMPLETENESS 6 $300,678 37 $385,226 89 $393,407 10 $251,818 0 $0 14 $350,625 1 $185,000
Aggregated Statistics For Year 2007(Based on 21 full and 11 partial tracts) A) FHA, FSA/RHS & VA B) Conventional C) Refinancings D) Home Improvement Loans E) Loans on Dwellings For 5+ Families F) Non-occupant Loans on G) Loans On Manufactured Number Average Value Number Average Value Number Average Value Number Average Value Number Average Value Number Average Value Number Average Value
LOANS ORIGINATED 3 $356,973 1,055 $391,642 2,143 $374,215 332 $223,332 43 $2,098,284 299 $347,652 21 $110,671 APPLICATIONS APPROVED, NOT ACCEPTED 1 $417,000 255 $374,544 568 $371,697 56 $208,174 1 $1,637,040 56 $368,562 27 $95,848 APPLICATIONS DENIED 0 $0 400 $363,756 1,191 $414,786 183 $190,850 3 $704,673 119 $379,166 43 $101,782 APPLICATIONS WITHDRAWN 1 $339,380 189 $398,246 563 $391,690 56 $213,302 1 $569,550 67 $382,281 0 $0 FILES CLOSED FOR INCOMPLETENESS 0 $0 56 $353,864 244 $408,244 18 $185,052 0 $0 17 $367,998 3 $206,423
Aggregated Statistics For Year 2006(Based on 21 full and 11 partial tracts) A) FHA, FSA/RHS & VA B) Conventional C) Refinancings D) Home Improvement Loans E) Loans on Dwellings For 5+ Families F) Non-occupant Loans on G) Loans On Manufactured Number Average Value Number Average Value Number Average Value Number Average Value Number Average Value Number Average Value Number Average Value
LOANS ORIGINATED 1 $278,680 1,893 $375,077 3,051 $369,861 517 $222,285 28 $2,098,388 405 $342,716 28 $111,226 APPLICATIONS APPROVED, NOT ACCEPTED 0 $0 420 $374,718 545 $363,450 82 $256,629 1 $330,300 99 $352,320 28 $109,563 APPLICATIONS DENIED 0 $0 689 $389,419 1,197 $397,423 254 $218,697 1 $611,660 133 $392,047 31 $154,786 APPLICATIONS WITHDRAWN 1 $300,000 382 $377,067 922 $371,806 102 $242,128 3 $620,480 95 $359,398 1 $115,110 FILES CLOSED FOR INCOMPLETENESS 0 $0 86 $359,960 239 $378,886 26 $242,396 0 $0 13 $351,114 0 $0
Aggregated Statistics For Year 2005(Based on 21 full and 11 partial tracts) A) FHA, FSA/RHS & VA B) Conventional C) Refinancings D) Home Improvement Loans E) Loans on Dwellings For 5+ Families F) Non-occupant Loans on G) Loans On Manufactured Number Average Value Number Average Value Number Average Value Number Average Value Number Average Value Number Average Value Number Average Value
LOANS ORIGINATED 1 $280,000 2,259 $363,376 3,695 $344,926 511 $219,603 41 $1,831,390 426 $339,568 28 $130,795 APPLICATIONS APPROVED, NOT ACCEPTED 0 $0 455 $322,117 615 $342,045 72 $175,344 0 $0 80 $309,758 46 $88,675 APPLICATIONS DENIED 1 $234,260 634 $360,567 1,289 $347,261 213 $199,197 3 $1,236,900 119 $341,608 47 $131,441 APPLICATIONS WITHDRAWN 0 $0 490 $338,319 1,263 $348,806 164 $223,016 2 $1,315,000 103 $295,801 14 $163,870 FILES CLOSED FOR INCOMPLETENESS 1 $296,230 113 $335,373 243 $369,720 24 $220,253 0 $0 30 $336,253 2 $177,735
Aggregated Statistics For Year 2004(Based on 21 full and 11 partial tracts) A) FHA, FSA/RHS & VA B) Conventional C) Refinancings D) Home Improvement Loans E) Loans on Dwellings For 5+ Families F) Non-occupant Loans on G) Loans On Manufactured Number Average Value Number Average Value Number Average Value Number Average Value Number Average Value Number Average Value Number Average Value
LOANS ORIGINATED 13 $209,530 2,286 $333,300 4,872 $288,531 513 $168,509 37 $2,261,558 514 $277,190 45 $108,210 APPLICATIONS APPROVED, NOT ACCEPTED 2 $147,000 402 $336,149 808 $289,187 66 $153,843 0 $0 76 $285,453 17 $88,743 APPLICATIONS DENIED 6 $204,753 534 $314,710 1,272 $297,204 265 $141,759 4 $2,592,510 106 $280,624 27 $101,672 APPLICATIONS WITHDRAWN 1 $213,000 371 $349,505 1,310 $284,650 97 $155,974 3 $648,840 82 $263,584 8 $147,058 FILES CLOSED FOR INCOMPLETENESS 0 $0 114 $337,941 264 $302,934 34 $142,975 0 $0 28 $298,282 1 $37,620
Aggregated Statistics For Year 2003(Based on 21 full and 11 partial tracts) A) FHA, FSA/RHS & VA B) Conventional C) Refinancings D) Home Improvement Loans E) Loans on Dwellings For 5+ Families F) Non-occupant Loans on Number Average Value Number Average Value Number Average Value Number Average Value Number Average Value Number Average Value
LOANS ORIGINATED 93 $198,830 3,037 $287,593 9,231 $237,418 202 $87,905 54 $1,407,040 708 $212,580 APPLICATIONS APPROVED, NOT ACCEPTED 8 $214,512 497 $308,902 1,203 $241,806 53 $75,581 0 $0 96 $217,628 APPLICATIONS DENIED 14 $213,327 546 $273,777 1,509 $240,518 145 $49,498 2 $817,500 124 $224,501 APPLICATIONS WITHDRAWN 8 $178,915 599 $309,103 1,498 $240,160 47 $54,764 1 $589,450 84 $206,483 FILES CLOSED FOR INCOMPLETENESS 3 $233,830 155 $341,202 353 $250,489 18 $118,176 3 $3,123,787 28 $204,114
Aggregated Statistics For Year 2002(Based on 16 full and 9 partial tracts) A) FHA, FSA/RHS & VA B) Conventional C) Refinancings D) Home Improvement Loans E) Loans on Dwellings For 5+ Families F) Non-occupant Loans on Number Average Value Number Average Value Number Average Value Number Average Value Number Average Value Number Average Value
LOANS ORIGINATED 141 $210,389 1,859 $245,370 5,159 $220,819 138 $60,130 41 $1,268,778 384 $193,022 APPLICATIONS APPROVED, NOT ACCEPTED 10 $213,362 302 $291,641 757 $222,318 31 $39,519 1 $192,470 55 $189,274 APPLICATIONS DENIED 21 $225,321 306 $243,233 949 $215,798 116 $36,732 4 $1,923,348 63 $204,018 APPLICATIONS WITHDRAWN 23 $212,580 208 $253,432 869 $219,731 50 $46,919 3 $391,000 41 $161,870 FILES CLOSED FOR INCOMPLETENESS 3 $301,333 67 $252,990 300 $216,602 3 $65,730 2 $198,775 18 $194,878
Aggregated Statistics For Year 2001(Based on 16 full and 9 partial tracts) A) FHA, FSA/RHS & VA B) Conventional C) Refinancings D) Home Improvement Loans E) Loans on Dwellings For 5+ Families F) Non-occupant Loans on Number Average Value Number Average Value Number Average Value Number Average Value Number Average Value Number Average Value
LOANS ORIGINATED 247 $198,003 1,528 $213,762 3,666 $200,601 176 $43,354 32 $1,651,791 284 $170,044 APPLICATIONS APPROVED, NOT ACCEPTED 8 $181,405 212 $248,041 531 $194,190 35 $42,057 1 $792,860 37 $152,198 APPLICATIONS DENIED 42 $213,675 216 $203,450 910 $180,210 122 $34,738 8 $1,530,088 57 $156,371 APPLICATIONS WITHDRAWN 30 $192,573 164 $196,969 732 $181,698 63 $52,422 5 $1,427,776 31 $190,325 FILES CLOSED FOR INCOMPLETENESS 7 $182,464 52 $209,945 261 $195,364 8 $86,591 5 $2,647,722 23 $164,693
Aggregated Statistics For Year 2000(Based on 16 full and 9 partial tracts) A) FHA, FSA/RHS & VA B) Conventional C) Refinancings D) Home Improvement Loans E) Loans on Dwellings For 5+ Families F) Non-occupant Loans on Number Average Value Number Average Value Number Average Value Number Average Value Number Average Value Number Average Value
LOANS ORIGINATED 229 $171,849 1,450 $211,766 892 $155,371 188 $42,402 21 $1,144,130 144 $162,016 APPLICATIONS APPROVED, NOT ACCEPTED 17 $168,378 229 $245,158 178 $117,916 73 $38,345 1 $182,000 14 $157,921 APPLICATIONS DENIED 25 $164,004 237 $194,959 483 $142,241 117 $43,048 1 $572,520 33 $160,479 APPLICATIONS WITHDRAWN 25 $172,593 168 $199,842 294 $117,534 24 $43,902 3 $895,333 18 $145,822 FILES CLOSED FOR INCOMPLETENESS 7 $209,123 63 $271,175 114 $158,770 6 $66,563 5 $1,152,400 6 $153,170
Aggregated Statistics For Year 1999(Based on 20 full and 11 partial tracts) A) FHA, FSA/RHS & VA B) Conventional C) Refinancings D) Home Improvement Loans E) Loans on Dwellings For 5+ Families F) Non-occupant Loans on Number Average Value Number Average Value Number Average Value Number Average Value Number Average Value Number Average Value
LOANS ORIGINATED 364 $160,721 1,571 $183,536 2,037 $157,843 232 $31,068 34 $4,707,444 215 $137,992 APPLICATIONS APPROVED, NOT ACCEPTED 18 $154,142 176 $194,140 399 $157,401 86 $28,499 2 $292,985 39 $129,793 APPLICATIONS DENIED 52 $170,402 255 $164,745 686 $146,535 167 $29,929 5 $198,400 69 $120,156 APPLICATIONS WITHDRAWN 47 $166,846 261 $191,457 438 $138,416 31 $41,934 4 $3,058,398 34 $119,458 FILES CLOSED FOR INCOMPLETENESS 9 $157,622 54 $219,921 202 $163,441 9 $27,722 3 $537,667 14 $119,524
Detailed mortgage data for all 32 tracts in Fullerton, CA
Private Mortgage Insurance Companies Aggregated Statistics For Year 2009(Based on 19 full and 11 partial tracts) A) Conventional B) Refinancings C) Non-occupant Loans on Number Average Value Number Average Value Number Average Value
LOANS ORIGINATED 51 $303,121 7 $373,564 0 $0 APPLICATIONS APPROVED, NOT ACCEPTED 20 $382,246 13 $376,131 0 $0 APPLICATIONS DENIED 15 $367,089 6 $389,235 0 $0 APPLICATIONS WITHDRAWN 2 $452,280 3 $486,080 0 $0 FILES CLOSED FOR INCOMPLETENESS 3 $330,317 0 $0 1 $180,950
Aggregated Statistics For Year 2008(Based on 20 full and 11 partial tracts) A) Conventional B) Refinancings C) Non-occupant Loans on Number Average Value Number Average Value Number Average Value
LOANS ORIGINATED 136 $373,784 21 $407,419 3 $353,660 APPLICATIONS APPROVED, NOT ACCEPTED 118 $320,311 30 $427,499 3 $326,850 APPLICATIONS DENIED 30 $388,216 3 $374,040 4 $308,472 APPLICATIONS WITHDRAWN 8 $342,530 2 $299,870 1 $448,240 FILES CLOSED FOR INCOMPLETENESS 4 $476,968 0 $0 0 $0
Aggregated Statistics For Year 2007(Based on 18 full and 11 partial tracts) A) Conventional B) Refinancings C) Non-occupant Loans on Number Average Value Number Average Value Number Average Value
LOANS ORIGINATED 44 $425,691 27 $432,463 5 $428,796 APPLICATIONS APPROVED, NOT ACCEPTED 94 $260,333 13 $465,986 1 $495,000 APPLICATIONS DENIED 1 $398,000 6 $466,208 1 $398,000 APPLICATIONS WITHDRAWN 2 $289,600 8 $393,908 0 $0 FILES CLOSED FOR INCOMPLETENESS 0 $0 0 $0 0 $0
Aggregated Statistics For Year 2006(Based on 13 full and 11 partial tracts) A) Conventional B) Refinancings C) Non-occupant Loans on Number Average Value Number Average Value Number Average Value
LOANS ORIGINATED 19 $460,607 14 $428,244 3 $371,337 APPLICATIONS APPROVED, NOT ACCEPTED 22 $281,642 5 $379,746 1 $253,000 APPLICATIONS DENIED 0 $0 1 $587,890 0 $0 APPLICATIONS WITHDRAWN 0 $0 4 $561,650 0 $0 FILES CLOSED FOR INCOMPLETENESS 0 $0 0 $0 0 $0
Aggregated Statistics For Year 2005(Based on 16 full and 11 partial tracts) A) Conventional B) Refinancings C) Non-occupant Loans on Number Average Value Number Average Value Number Average Value
LOANS ORIGINATED 33 $385,335 16 $440,898 3 $414,123 APPLICATIONS APPROVED, NOT ACCEPTED 11 $369,019 10 $378,719 2 $210,500 APPLICATIONS DENIED 2 $376,000 1 $297,090 0 $0 APPLICATIONS WITHDRAWN 3 $317,000 4 $453,000 1 $238,000 FILES CLOSED FOR INCOMPLETENESS 0 $0 0 $0 0 $0
Aggregated Statistics For Year 2004(Based on 19 full and 11 partial tracts) A) Conventional B) Refinancings C) Non-occupant Loans on D) Loans On Manufactured Number Average Value Number Average Value Number Average Value Number Average Value
LOANS ORIGINATED 78 $342,148 26 $284,531 10 $336,790 1 $169,270 APPLICATIONS APPROVED, NOT ACCEPTED 36 $327,716 25 $286,866 4 $374,028 0 $0 APPLICATIONS DENIED 2 $646,835 3 $311,333 0 $0 0 $0 APPLICATIONS WITHDRAWN 12 $267,083 4 $320,328 1 $153,000 0 $0 FILES CLOSED FOR INCOMPLETENESS 2 $280,360 0 $0 0 $0 0 $0
Aggregated Statistics For Year 2003(Based on 21 full and 11 partial tracts) A) Conventional B) Refinancings C) Non-occupant Loans on Number Average Value Number Average Value Number Average Value
LOANS ORIGINATED 224 $287,674 119 $265,650 13 $231,599 APPLICATIONS APPROVED, NOT ACCEPTED 54 $304,855 51 $253,212 2 $181,220 APPLICATIONS DENIED 4 $382,200 2 $229,815 1 $86,000 APPLICATIONS WITHDRAWN 8 $279,580 4 $226,550 2 $292,830 FILES CLOSED FOR INCOMPLETENESS 1 $266,000 1 $147,940 0 $0
Aggregated Statistics For Year 2002(Based on 16 full and 9 partial tracts) A) Conventional B) Refinancings C) Non-occupant Loans on Number Average Value Number Average Value Number Average Value
LOANS ORIGINATED 199 $238,855 119 $236,297 8 $214,945 APPLICATIONS APPROVED, NOT ACCEPTED 42 $223,201 61 $235,446 4 $135,012 APPLICATIONS DENIED 7 $338,937 2 $247,170 0 $0 APPLICATIONS WITHDRAWN 16 $242,825 12 $265,554 2 $216,310 FILES CLOSED FOR INCOMPLETENESS 3 $173,667 3 $177,563 0 $0
Aggregated Statistics For Year 2001(Based on 16 full and 9 partial tracts) A) Conventional B) Refinancings C) Non-occupant Loans on Number Average Value Number Average Value Number Average Value
LOANS ORIGINATED 225 $214,428 151 $203,148 14 $173,545 APPLICATIONS APPROVED, NOT ACCEPTED 42 $199,359 53 $214,896 4 $185,245 APPLICATIONS DENIED 8 $242,859 8 $214,292 2 $233,690 APPLICATIONS WITHDRAWN 9 $235,963 8 $209,594 2 $137,940 FILES CLOSED FOR INCOMPLETENESS 2 $245,590 1 $175,280 0 $0
Aggregated Statistics For Year 2000(Based on 16 full and 9 partial tracts) A) Conventional B) Refinancings C) Non-occupant Loans on Number Average Value Number Average Value Number Average Value
LOANS ORIGINATED 246 $212,354 86 $186,810 12 $189,732 APPLICATIONS APPROVED, NOT ACCEPTED 36 $217,260 22 $173,594 3 $151,860 APPLICATIONS DENIED 19 $186,707 13 $207,917 1 $86,000 APPLICATIONS WITHDRAWN 8 $218,478 6 $180,140 0 $0 FILES CLOSED FOR INCOMPLETENESS 2 $240,000 2 $162,665 0 $0
Aggregated Statistics For Year 1999(Based on 20 full and 11 partial tracts) A) Conventional B) Refinancings C) Non-occupant Loans on Number Average Value Number Average Value Number Average Value
LOANS ORIGINATED 322 $196,744 174 $179,650 10 $126,490 APPLICATIONS APPROVED, NOT ACCEPTED 46 $196,256 62 $175,798 3 $111,593 APPLICATIONS DENIED 16 $204,410 8 $196,856 2 $212,000 APPLICATIONS WITHDRAWN 10 $185,260 9 $166,661 1 $92,830 FILES CLOSED FOR INCOMPLETENESS 4 $230,932 9 $206,507 0 $0
Fire-safe hotels and motels in Fullerton, California:
Anaheim Park Hotel, 222 W Houston Ave, Fullerton, California 92832 Phone: (714) 992-1700, Fax: (714) 992-4843
Travelodge Fullerton Anaheim, 1415 S Euclid St, Fullerton, California 92832 Phone: (714) 578-7950
The Hotel Fullerton Anaheim, 1500 S Raymond Ave, Fullerton, California 92831 Phone: (714) 635-9000, Fax: (714) 520-4622
Holiday Inn & Suites, 2932 E Nutwood Ave, Fullerton, California 92831 Phone: (714) 579-7400, Fax: (714) 528-7945
Days Inn & Suites, 333 E Imperial Hwy, Fullerton, California 92835 Phone: (714) 447-9200, Fax: (714) 773-0685
Holiday Inn Express Fullerton/Anaheim, 212 W Houston Ave, Fullerton, California 92832 Phone: (714) 853-1700
All 6 fire-safe hotels and motels in Fullerton, California
Most common first names in Fullerton, CA among deceased individuals Name Count Lived (average)
Robert 192 76.6 years Mary 177 81.2 years John 154 78.5 years William 134 78.1 years James 110 74.9 years Dorothy 107 83.7 years Helen 98 85.9 years George 86 81.0 years Richard 80 74.4 years Donald 78 75.0 years
Most common last names in Fullerton, CA among deceased individuals Last name Count Lived (average)
Smith 56 79.4 years Miller 49 76.5 years Johnson 48 74.8 years Kim 41 76.7 years Williams 32 82.3 years Anderson 29 84.6 years Lee 29 78.5 years Brown 29 79.0 years Jones 27 82.6 years Martinez 26 76.4 years
Fullerton compared to California state average:
Unemployed percentage below state average. Black race population percentage significantly below state average. Percentage of population with a bachelor's degree or higher above state average. Fullerton, CA compared to other similar cities:
#16 on the list of "Top 101 cities with largest percentage of males in occupations: arts, design, entertainment, sports, and media occupations (population 50,000+)"
#29 on the list of "Top 101 cities with the largest city-data.com crime index increase from 2011 to 2012 (population 50,000+)"
#31 on the list of "Top 101 cities with largest percentage of males in industries: wholesale trade (population 50,000+)"
#36 on the list of "Top 101 cities with the lowest average snowfall in a year (population 50,000+)"
#38 on the list of "Top 101 cities with the most residents born in Korea (population 500+)"
#40 on the list of "Top 101 cities with largest percentage of females in industries: wholesale trade (population 50,000+)"
#60 on the list of "Top 101 cities with fewest building permits per 10,000 residents (population 50,000+)"
#67 on the list of "Top 101 cities with the lowest number of murders per 100,000 residents (population 50,000+)"
#71 on the list of "Top 101 cities with the lowest number of police officers per 1000 residents (population 50,000+)"
#76 on the list of "Top 100 cities with highest median household income and median resident age less than 35 (pop. 50,000+)"
#79 on the list of "Top 101 cities with largest percentage of females in industries: construction (population 50,000+)"
#79 on the list of "Top 100 cities with highest ratio of median house value to median household income (pop. 50,000+)"
#83 on the list of "Top 101 larger cities with the highest increase in house/condo value from 2000 (population 50,000+)"
#90 on the list of "Top 101 cities with largest percentage of females in occupations: sales and related occupations (population 50,000+)"
#96 on the list of "Top 101 cities with the lowest average yearly precipitation (population 50,000+)"
#97 on the list of "Top 100 cities with highest median house value (pop. 50,000+)"
#4 on the list of "Top 101 counties with the highest total withdrawal of fresh water for public supply"
#5 on the list of "Top 101 counties with the most Catholic adherents"
#6 on the list of "Top 101 counties with the highest ground withdrawal of fresh water for public supply"
#7 on the list of "Top 101 counties with the most Evangelical Protestant adherents"
#8 on the list of "Top 101 counties with the highest Particulate Matter (PM2.5 ) Annual air pollution readings in 2012 (µg/m3 )"
Top Patent Applicants
Terrance F. Little (62)
Ester Fernandez-Salas (55)
Richard C. Ewers (49)
Carol E. Eberhardt (24)
David Tso-Chin Ko (19)
Fernandez-Salas Ester (18)
Timothy R. Bumbalough (17)
Philip J. Bromley (16)
Jane Lee (15)
Hector Ray Hernandez (13)
Total of 1068 patent applications in 2008-2024.
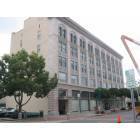

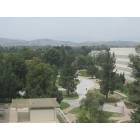
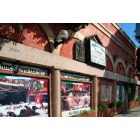
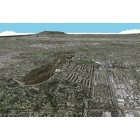
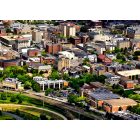

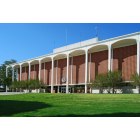

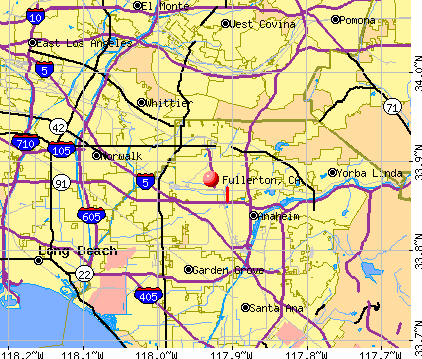


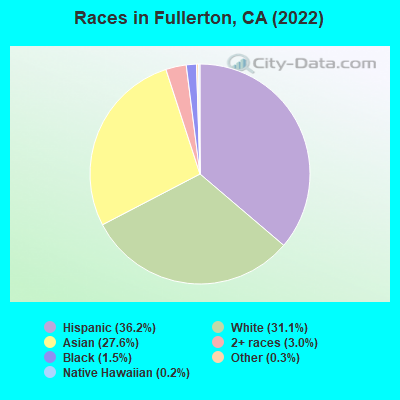
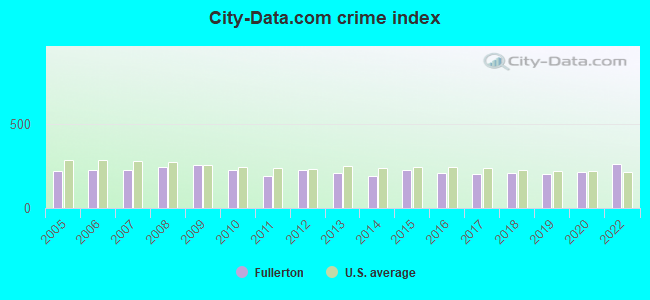
 Recent articles from our blog. Our writers, many of them Ph.D. graduates or candidates, create easy-to-read articles on a wide variety of topics.

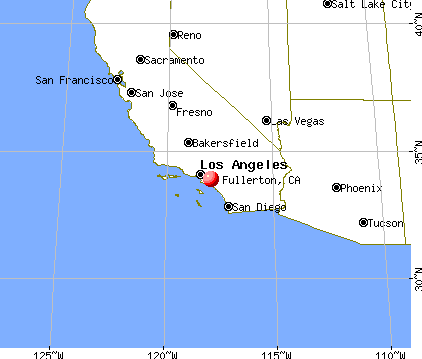
 (3.8 miles
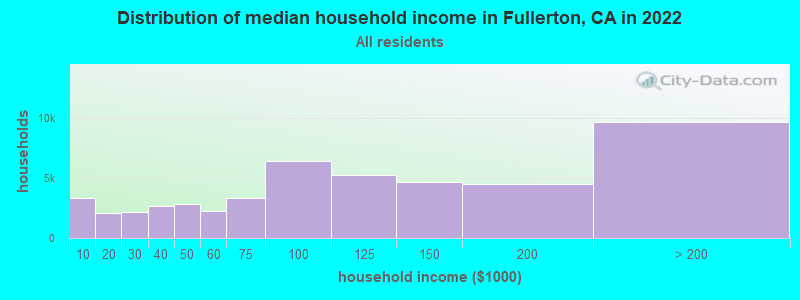
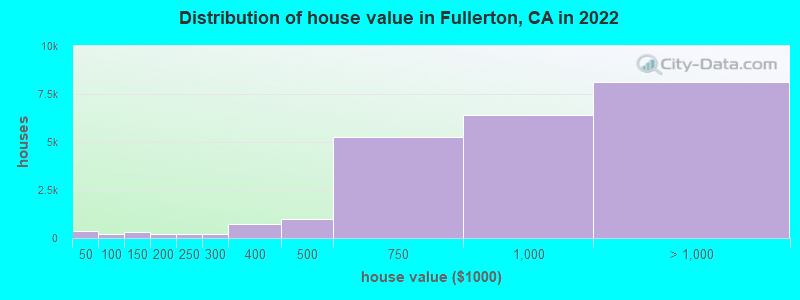
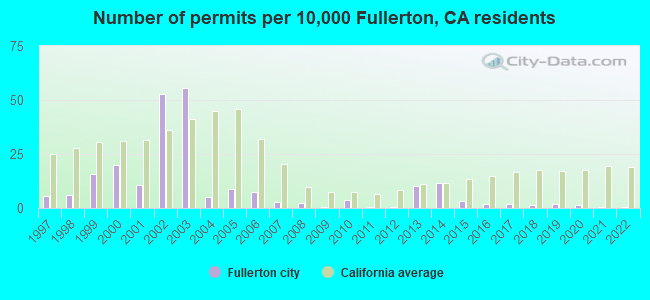
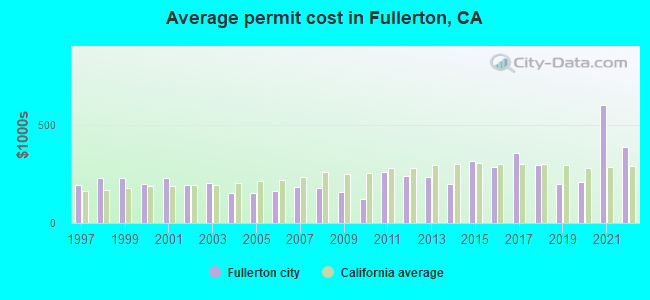
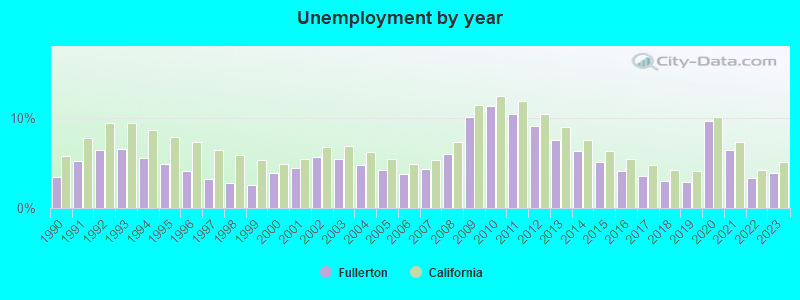
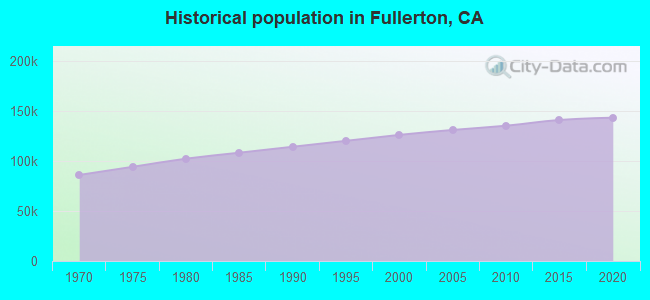
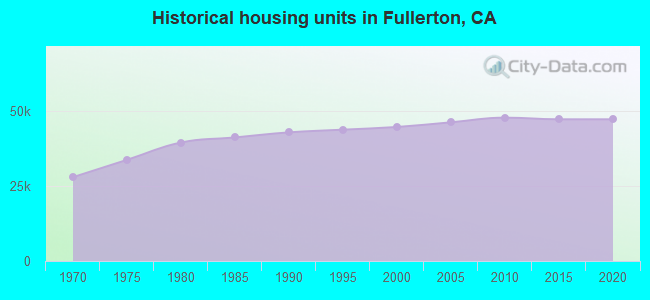
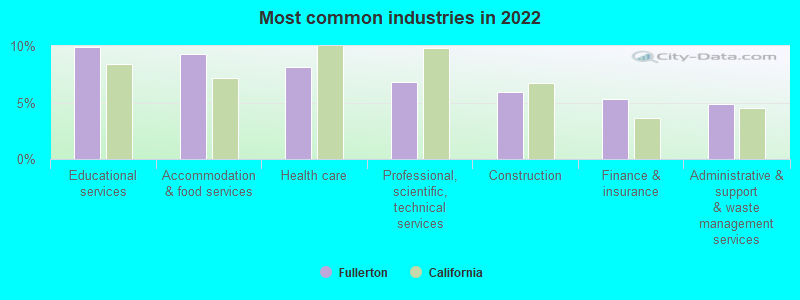
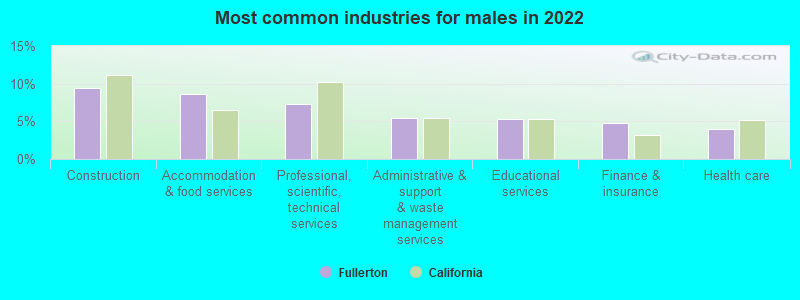
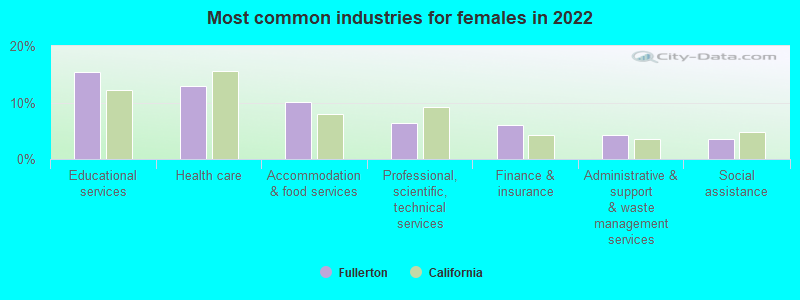
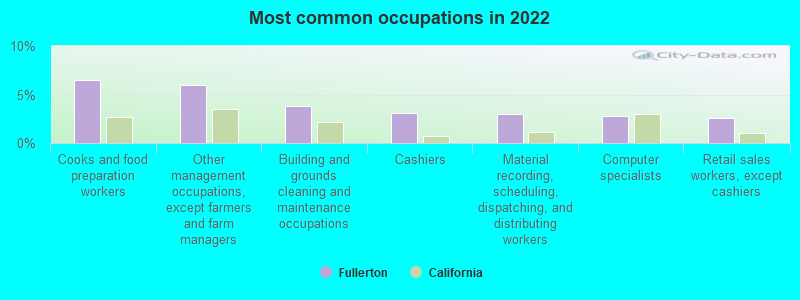
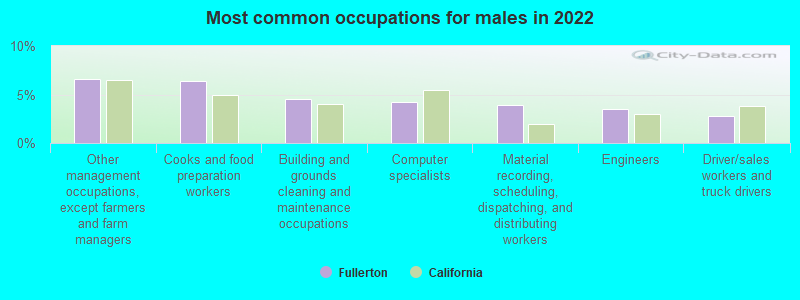
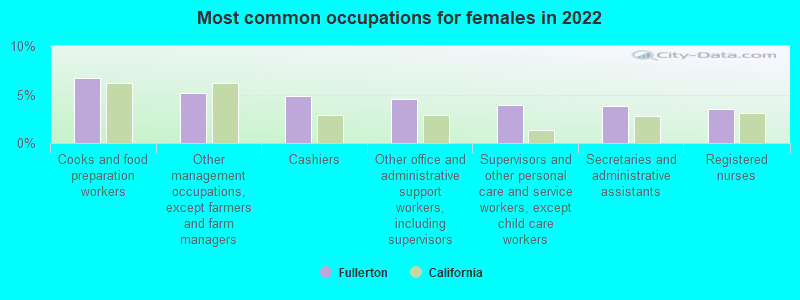
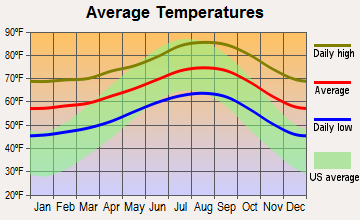
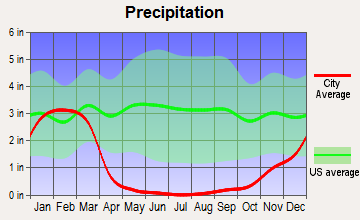
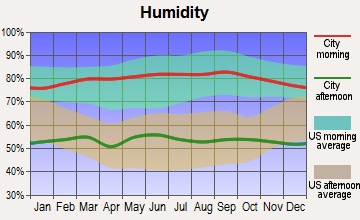
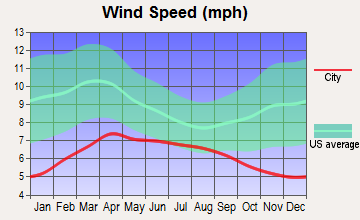
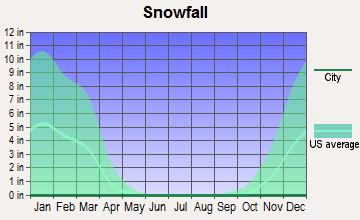
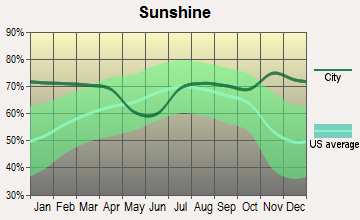
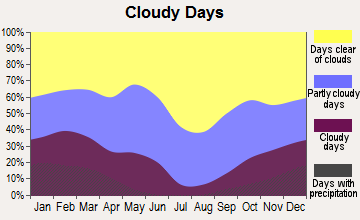
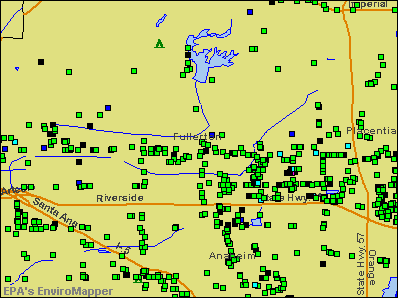

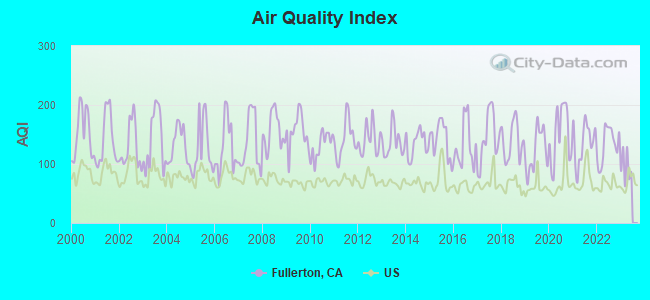
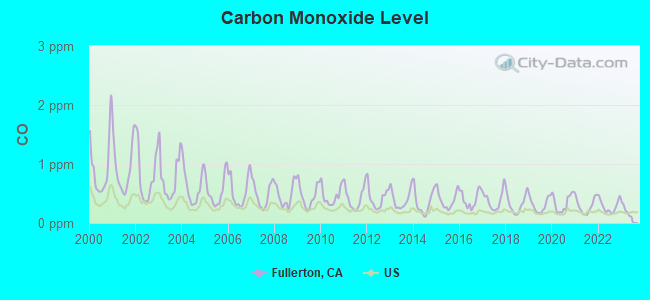
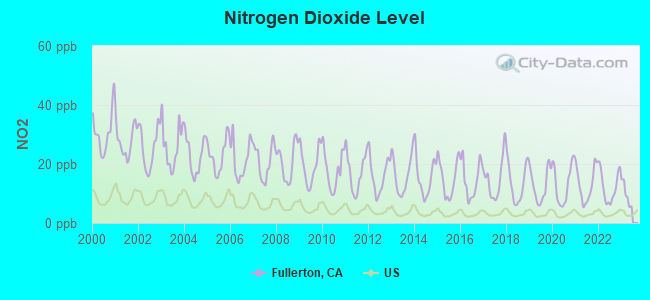
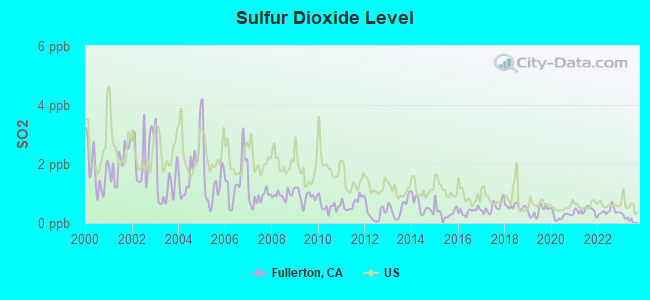
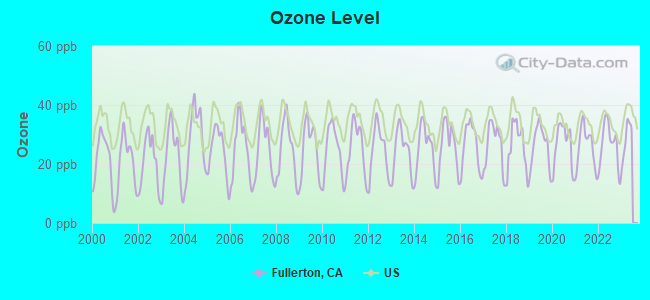
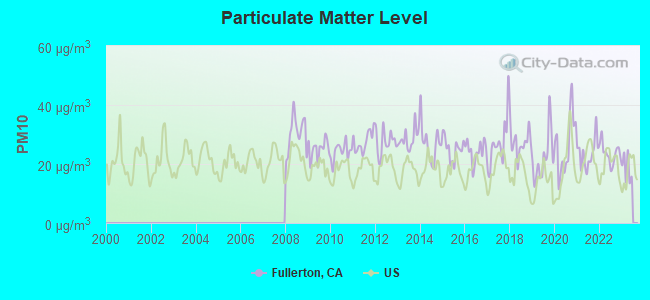
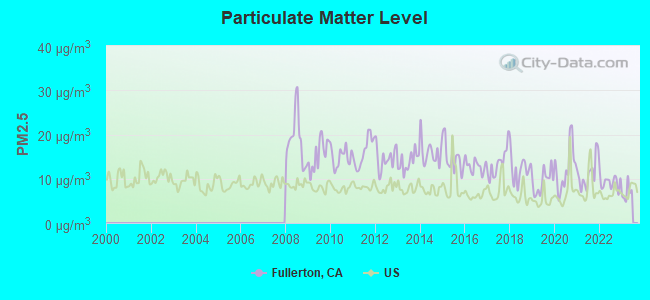
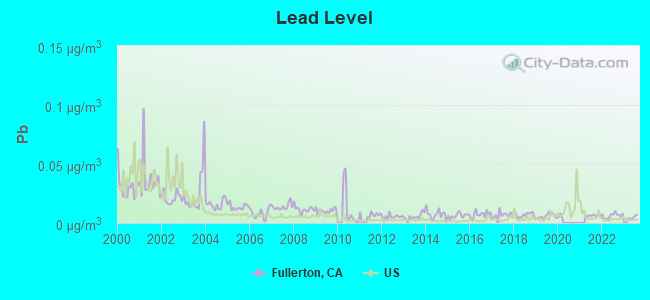
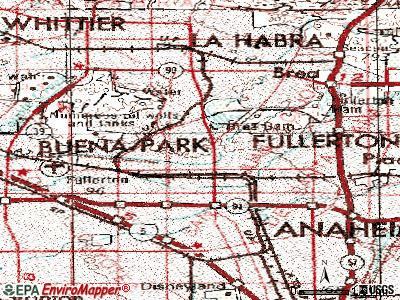
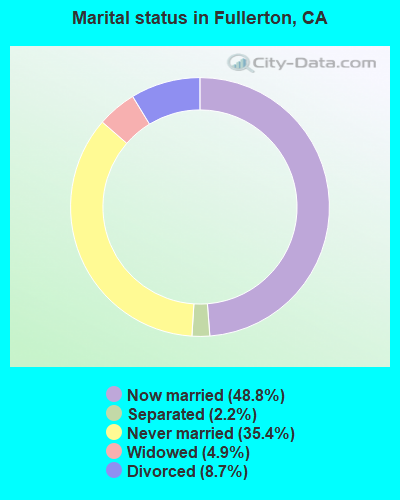

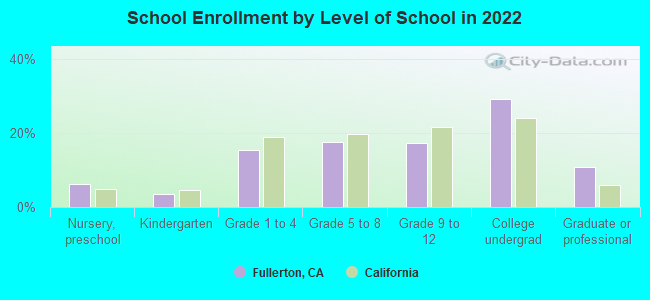
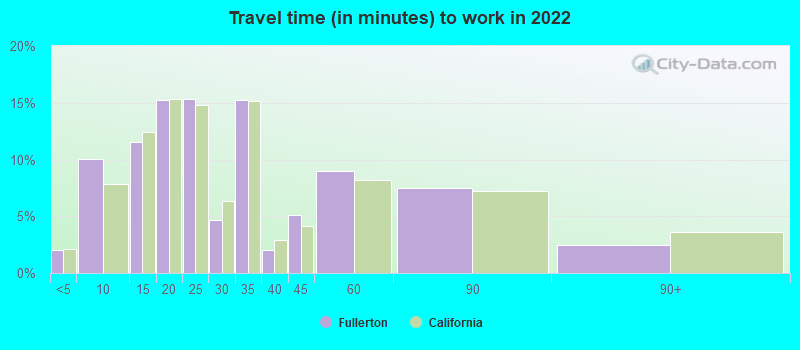
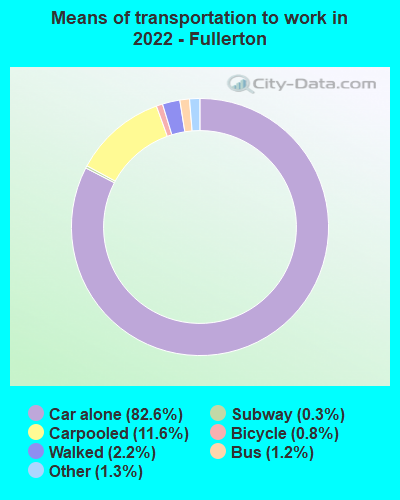


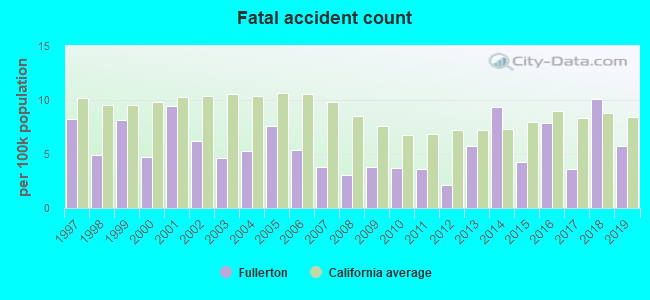
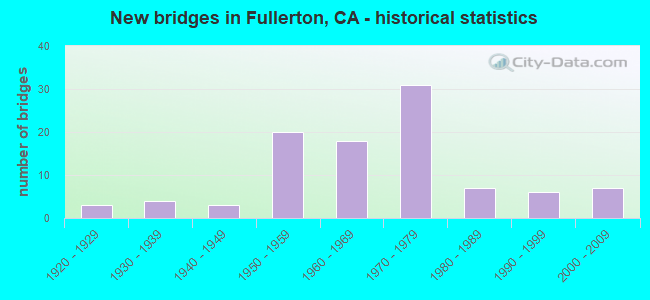
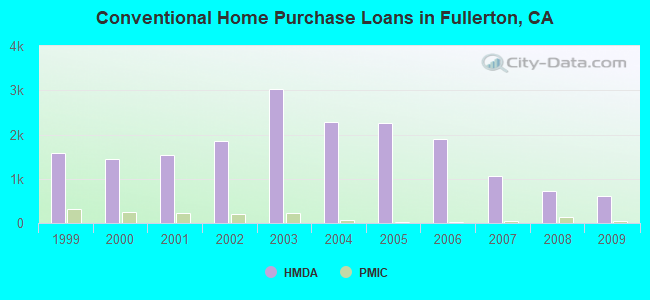
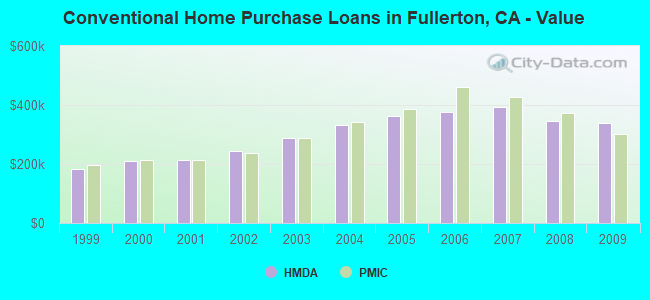
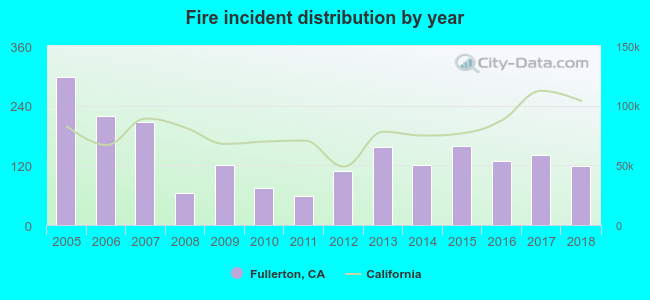 According to the data from the years 2005 - 2018 the average number of fires per year is 141. The highest number of fire incidents - 297 took place in 2005, and the least - 59 in 2011. The data has a dropping trend.
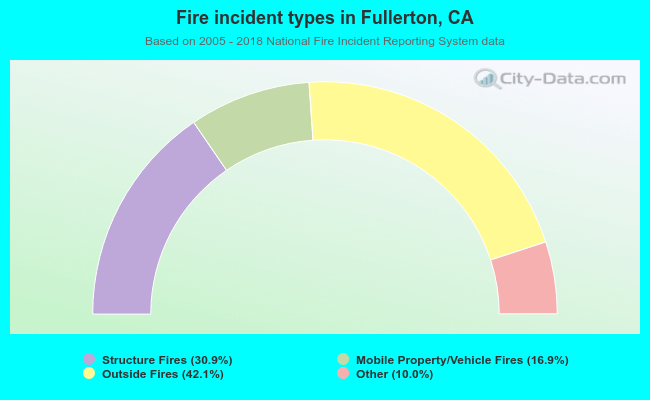 When looking into fire subcategories, the most reports belonged to: Outside Fires (42.1%), and Structure Fires (30.9%).