Percentage of residents living in poverty in 2022: 4.1%
(4.7% for White Non-Hispanic residents, 3.5% for Hispanic or Latino residents, 0.2% for other race residents, 0.2% for two or more races residents)
According to our research of California and other state lists, there were 4 registered sex offenders living in La Habra Heights, California as of April 26, 2024. The ratio of all residents to sex offenders in La Habra Heights is 1,362 to 1. The ratio of registered sex offenders to all residents in this city is lower than the state average.
Crime rates in La Habra Heights by year
Type
2009
2010
2011
2012
2013
2014
2015
2016
2017
2018
2019
2020
2022
Murders (per 100,000)
0 (0.0)
0 (0.0)
0 (0.0)
0 (0.0)
0 (0.0)
0 (0.0)
0 (0.0)
0 (0.0)
0 (0.0)
0 (0.0)
0 (0.0)
0 (0.0)
0 (0.0)
Rapes (per 100,000)
1 (16.9)
1 (18.8)
1 (18.6)
0 (0.0)
1 (18.4)
0 (0.0)
1 (18.2)
0 (0.0)
1 (18.4)
1 (18.5)
0 (0.0)
1 (15.4)
2 (36.8)
Robberies (per 100,000)
2 (33.8)
0 (0.0)
1 (18.6)
0 (0.0)
0 (0.0)
0 (0.0)
0 (0.0)
2 (36.5)
1 (18.4)
2 (36.9)
1 (18.7)
0 (0.0)
0 (0.0)
Assaults (per 100,000)
2 (33.8)
6 (112.7)
5 (92.8)
6 (110.8)
2 (36.8)
8 (146.8)
1 (18.2)
2 (36.5)
2 (36.9)
3 (55.4)
3 (56.0)
2 (30.8)
1 (18.4)
Burglaries (per 100,000)
29 (490.6)
32 (600.9)
29 (538.2)
24 (443.4)
33 (607.0)
19 (348.6)
20 (363.6)
37 (675.2)
29 (534.5)
22 (406.3)
29 (541.3)
17 (262.1)
25 (460.1)
Thefts (per 100,000)
30 (507.5)
42 (788.7)
38 (705.3)
18 (332.5)
20 (367.8)
30 (550.4)
32 (581.8)
64 (1,168)
60 (1,106)
43 (794.1)
45 (840.0)
30 (462.5)
30 (552.1)
Auto thefts (per 100,000)
2 (33.8)
7 (131.5)
4 (74.2)
2 (36.9)
2 (36.8)
0 (0.0)
3 (54.5)
8 (146.0)
6 (110.6)
1 (18.5)
5 (93.3)
8 (123.3)
2 (36.8)
Arson (per 100,000)
2 (33.8)
0 (0.0)
1 (18.6)
3 (55.4)
0 (0.0)
0 (0.0)
0 (0.0)
1 (18.2)
1 (18.4)
0 (0.0)
1 (18.7)
0 (0.0)
0 (0.0)
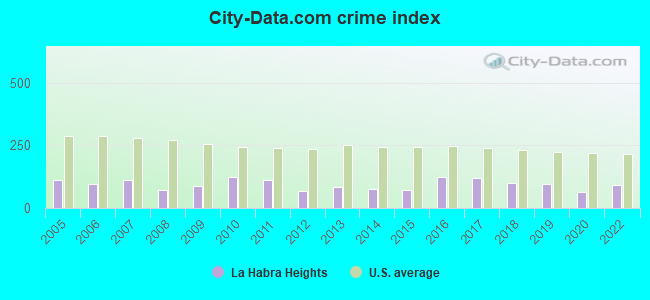
City-Data.com crime index
87.8
121.7
110.8
69.5
82.2
75.8
71.3
123.9
118.1
98.6
95.8
65.2
90.4
The City-Data.com crime index weighs serious crimes and violent crimes more heavily. Higher means more crime, U.S. average is 246.1. It adjusts for the number of visitors and daily workers commuting into cities.
Latest news from La Habra Heights, CA collected exclusively by city-data.com from local newspapers, TV, and radio stations
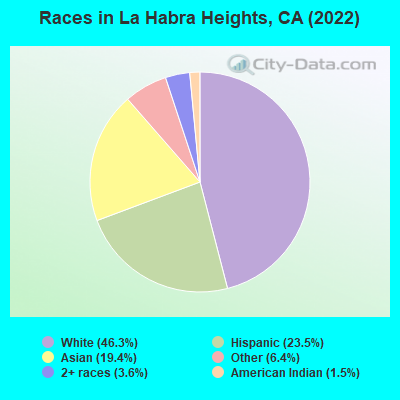
Ancestries: English (7.5%), American (6.1%), European (4.1%), German (3.7%), Jamaican (2.3%), Northern European (1.9%).
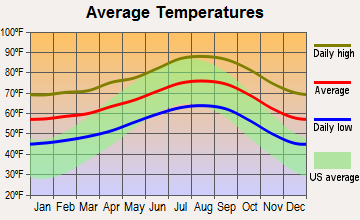
Current Local Time: PST time zone
Elevation: 700 feet
Land area: 6.20 square miles.
Population density: 879 people per square mile (low).
1,391 residents are foreign born (14.5% Asia, 5.7% Latin America, 4.7% Europe).
This city:
25.4%
California:
26.5%
Median real estate property taxes paid for housing units with mortgages in 2022: $9,977 (0.9%) Median real estate property taxes paid for housing units with no mortgage in 2022: $8,256 (0.7%)
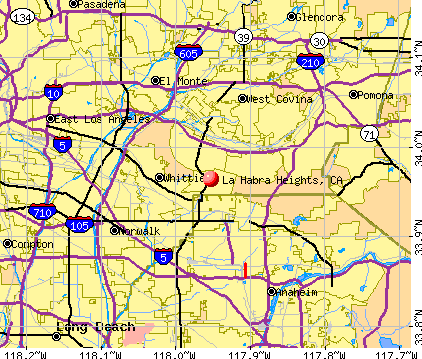
Nearest city with pop. 50,000+: La Habra, CA (2.4 miles , pop. 58,974).
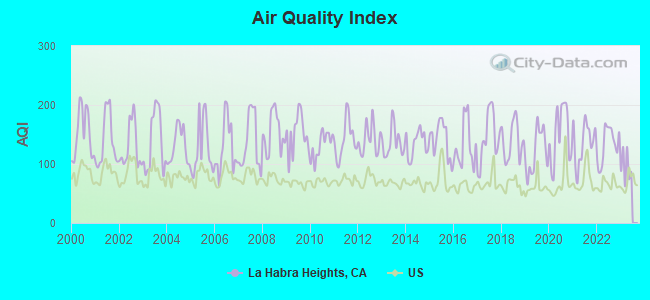
Air Quality Index (AQI) level in 2022 was 133. This is significantly worse than average.
City:
133
U.S.:
73
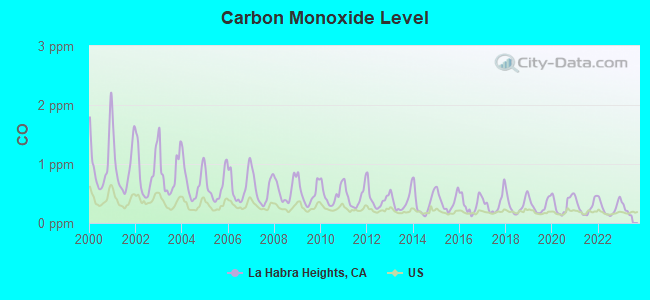
Carbon Monoxide (CO) [ppm] level in 2022 was 0.256. This is about average.Closest monitor was 2.7 miles away from the city center.
City:
0.256
U.S.:
0.251
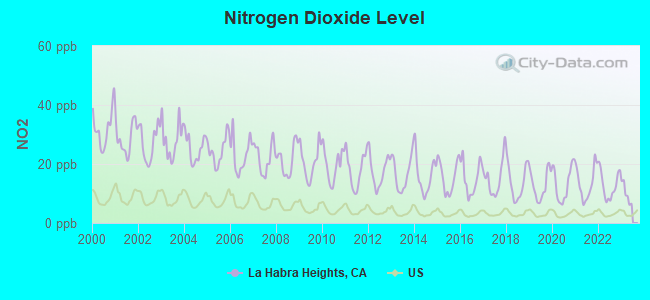
Nitrogen Dioxide (NO2) [ppb] level in 2022 was 12.8. This is significantly worse than average.Closest monitor was 2.7 miles away from the city center.
City:
12.8
U.S.:
5.1
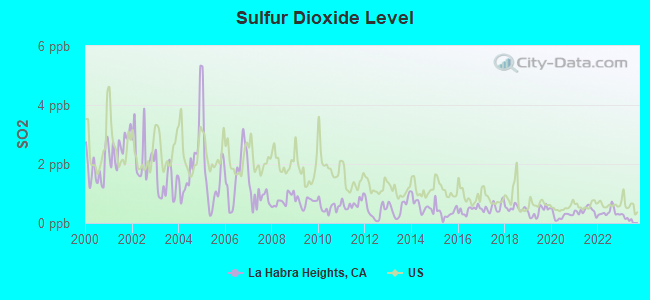
Sulfur Dioxide (SO2) [ppb] level in 2022 was 0.365. This is significantly better than average.Closest monitor was 2.7 miles away from the city center.
City:
0.365
U.S.:
1.515
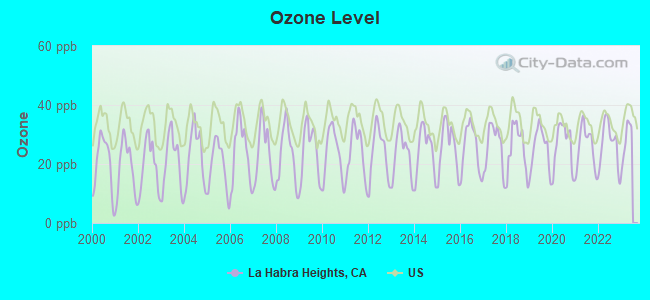
Ozone [ppb] level in 2022 was 26.7. This is better than average.Closest monitor was 2.7 miles away from the city center.
City:
26.7
U.S.:
33.3
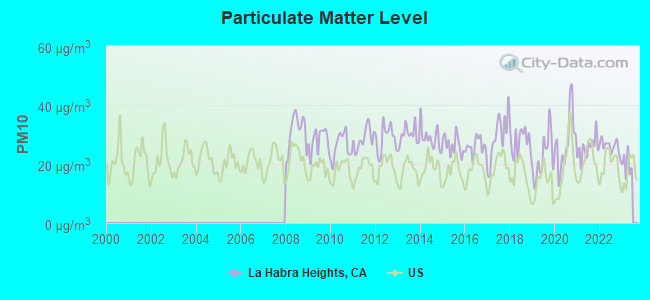
Particulate Matter (PM10) [µg/m3] level in 2022 was 26.0. This is worse than average.Closest monitor was 9.3 miles away from the city center.
City:
26.0
U.S.:
19.2
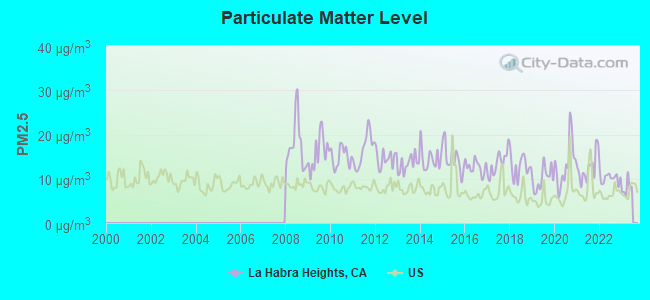
Particulate Matter (PM2.5) [µg/m3] level in 2022 was 10.2. This is worse than average.Closest monitor was 7.1 miles away from the city center.
City:
10.2
U.S.:
8.1
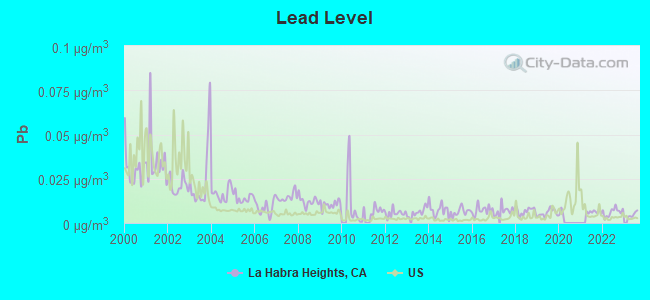
Lead (Pb) [µg/m3] level in 2022 was 0.00619. This is significantly better than average.Closest monitor was 2.7 miles away from the city center.
City:
0.00619
U.S.:
0.00931
Earthquake activity:
La Habra Heights-area historical earthquake activity is significantly above California state average. It is 7051% greater than the overall U.S. average.
On 7/21/1952 at 11:52:14, a magnitude 7.7 (7.7 UK, Class: Major, Intensity: VIII - XII) earthquake occurred 93.3 miles away from the city center, causing $50,000,000 total damage On 6/28/1992 at 11:57:34, a magnitude 7.6 (6.2 MB, 7.6 MS, 7.3 MW, Depth: 0.7 mi) earthquake occurred 82.8 miles away from the city center, causing 3 deaths (1 shaking deaths, 2 other deaths) and 400 injuries, causing $100,000,000 total damage and $40,000,000 insured losses On 10/16/1999 at 09:46:44, a magnitude 7.4 (6.3 MB, 7.4 MS, 7.2 MW, 7.3 ML) earthquake occurred 94.8 miles away from La Habra Heights center On 11/4/1927 at 13:51:53, a magnitude 7.5 (7.5 UK) earthquake occurred 187.5 miles away from La Habra Heights center On 4/21/1918 at 22:32:30, a magnitude 6.8 (6.8 UK, Class: Strong, Intensity: VII - IX) earthquake occurred 31.3 miles away from La Habra Heights center On 1/17/1994 at 12:30:55, a magnitude 6.8 (6.4 MB, 6.8 MS, 6.7 MW, Depth: 11.4 mi) earthquake occurred 38.0 miles away from La Habra Heights center, causing 60 deaths (60 shaking deaths) and 7000 injuries Magnitude types: body-wave magnitude (MB), local magnitude (ML), surface-wave magnitude (MS), moment magnitude (MW)
Natural disasters:
The number of natural disasters in Los Angeles County (57) is a lot greater than the US average (15). Major Disasters (Presidential) Declared: 27 Emergencies Declared: 3
Causes of natural disasters: Fires: 37, Floods: 16, Storms: 9, Winter Storms: 6, Landslides: 5, Mudslides: 5, Earthquakes: 3, Freeze: 1, Heavy Rain: 1, Hurricane: 1, Snow: 1, Tornado: 1, Wind: 1, Other: 1 (Note: some incidents may be assigned to more than one category).
Hospitals and medical centers near La Habra Heights:
THE JOHN FURBEE HOUSE (Hospital, about 2 miles away; DESERT HOT SPRINGS, CA)
WHITTIER KIDNEY DIALYSIS CENTER (Dialysis Facility, about 3 miles away; WHITTIER, CA)
LA HABRA CONV. HOSP. (Nursing Home, about 3 miles away; LA HABRA, CA)
WHITTIER HILLS HEALTH CARE CTR (Nursing Home, about 3 miles away; WHITTIER, CA)
PARK REGENCY CARE CENTER (Nursing Home, about 3 miles away; LA HABRA, CA)
HACIENDA DIALYSIS CENTER (Dialysis Facility, about 3 miles away; HACIENDA HEIGHTS, CA)
QUOTIDIAN DIALYSIS (Dialysis Facility, about 3 miles away; LA HABRA, CA)
Amtrak stations near La Habra Heights:
7 miles: FULLERTON (120 E. SANTA FE AVE.) . Services: ticket office, fully wheelchair accessible, enclosed waiting area, public restrooms, public payphones, full-service food facilities, free short-term parking, paid long-term parking, taxi stand, public transit connection.
12 miles: ANAHEIM (2150 KATELLA AVE.) . Services: ticket office, fully wheelchair accessible, enclosed waiting area, public restrooms, public payphones, vending machines, free short-term parking, free long-term parking, call for car rental service, call for taxi service.
14 miles: POMONA (156 W. COMMERCIAL ST.) . Services: partially wheelchair accessible, public payphones, free short-term parking, free long-term parking, call for taxi service, public transit connection.
Colleges/universities with over 2000 students nearest to La Habra Heights:
Hacienda La Puente Adult Education (about 4 miles; La Puente, CA; Full-time enrollment: 2,750)
Biola University (about 6 miles; La Mirada, CA; FT enrollment: 5,325)
Rio Hondo College (about 7 miles; Whittier, CA; FT enrollment: 9,610)
Fullerton College (about 7 miles; Fullerton, CA; FT enrollment: 11,124)
California State University-Fullerton (about 7 miles; Fullerton, CA; FT enrollment: 28,947)
Mt San Antonio College (about 9 miles; Walnut, CA; FT enrollment: 19,891)
California State Polytechnic University-Pomona (about 10 miles; Pomona, CA; FT enrollment: 18,141)
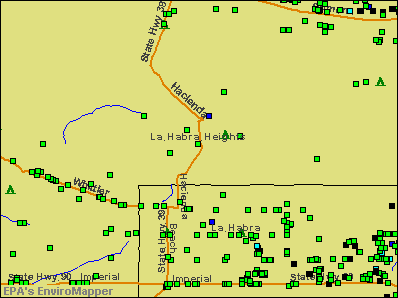
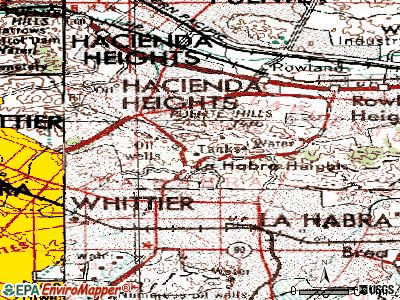
Notable locations in La Habra Heights: Hacienda Golf Club (A), City of La Habra Heights Fire Department Station 2 (B), City of La Habra Heights Fire Department Station 1 Headquarters (C). Display/hide their locations on the map
Religion statistics for La Habra Heights, CA (based on Los Angeles County data)
Religion
Adherents
Congregations
Catholic
3,542,994
275
Evangelical Protestant
814,611
3,249
Other
451,594
1,023
Mainline Protestant
229,056
860
Black Protestant
112,338
290
Orthodox
63,517
76
None
4,604,495
-
Source: Clifford Grammich, Kirk Hadaway, Richard Houseal, Dale E.Jones, Alexei Krindatch, Richie Stanley and Richard H.Taylor. 2012. 2010 U.S.Religion Census: Religious Congregations & Membership Study. Association of Statisticians of American Religious Bodies. Jones, Dale E., et al. 2002. Congregations and Membership in the United States 2000. Nashville, TN: Glenmary Research Center. Graphs represent county-level data
Aircraft: SCHWEIZER SGS 2-33A (Category: Land, Seats: 2, Weight: Up to 12,499 Pounds, Speed: 73 mph), Engine: None N-Number: 1195S, N1195S, N-1195S, Serial Number: 195, Year manufactured: 1970, Airworthiness Date: 12/23/1970, Certificate Issue Date: 09/01/1976 Registrant (Individual): Charles B Blumer, 1520 N Walnut St, La Habra Heights, CA 90631
Aircraft: CESSNA 182S (Category: Land, Seats: 6, Weight: Up to 12,499 Pounds), Engine: LYCOMING IO-540 SER (300 HP) (Reciprocating) N-Number: 257AE, N257AE, N-257AE, Serial Number: 18280019, Year manufactured: 1997, Airworthiness Date: 07/02/1997, Certificate Issue Date: 04/06/2012 Registrant (LLC): 7ae LLC, 1093 E Avocado Crest Rd, La Habra Heights, CA 90631
Aircraft: CESSNA 182A (Category: Land, Seats: 4, Weight: Up to 12,499 Pounds, Speed: 119 mph), Engine: CONT MOTOR O-470 SERIES (230 HP) (Reciprocating) N-Number: 3822D, N3822D, N-3822D, Serial Number: 34522, Year manufactured: 1957, Airworthiness Date: 07/09/1957, Certificate Issue Date: 11/12/2020 Registrant (LLC): Rpj Farming LLC, 558 Lamat Rd, La Habra Heights, CA 90631
Aircraft: PIPER PA-28-140 (Category: Land, Seats: 4, Weight: Up to 12,499 Pounds, Speed: 107 mph), Engine: LYCOMING 0-320 SERIES (180 HP) (Reciprocating) N-Number: 41223, N41223, N-41223, Serial Number: 28-7425208, Airworthiness Date: 01/14/1974, Certificate Issue Date: 04/08/2020 Registrant (Individual): Melissa Y Fan Chen, 918 Dorothea Rd, La Habra Heights, CA 90631
Aircraft: AERO COMMANDER 200D (Category: Land, Seats: 4, Weight: Up to 12,499 Pounds, Speed: 157 mph), Engine: CONT MOTOR IO 520 SERIES (285 HP) (Reciprocating) N-Number: 5504M, N5504M, N-5504M, Serial Number: 375, Year manufactured: 1967, Airworthiness Date: 05/17/1967, Certificate Issue Date: 11/16/1993 Registrant (Co-Owned): Richard L Daniel, 1309 Dorothea Rd, La Habra Heights, CA 90631, Other Owners: Marilyn E Daniel
Aircraft: CESSNA 172K (Category: Land, Seats: 4, Weight: Up to 12,499 Pounds, Speed: 105 mph), Engine: LYCOMING 0-320 SERIES (180 HP) (4 Cycle) N-Number: 84573, N84573, N-84573, Serial Number: 17258528, Year manufactured: 1969, Airworthiness Date: 08/05/1969, Certificate Issue Date: 01/05/1990 Registrant (Individual): Mark J Lee, 513 Dorothea Rd, La Habra Heights, CA 90631
Home Mortgage Disclosure Act Aggregated Statistics For Year 2009 (Based on 1 full and 1 partial tracts)
A) FHA, FSA/RHS & VA Home Purchase Loans
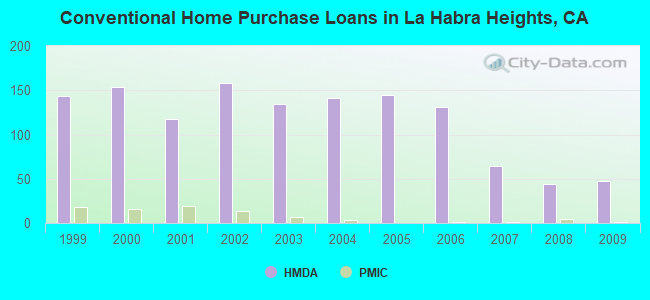
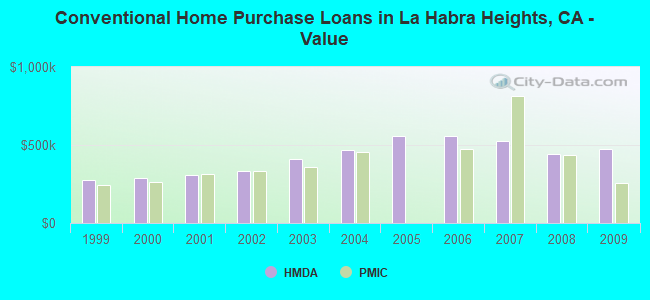
B) Conventional Home Purchase Loans
C) Refinancings
D) Home Improvement Loans
F) Non-occupant Loans on < 5 Family Dwellings (A B C & D)
Number
Average Value
Number
Average Value
Number
Average Value
Number
Average Value
Number
Average Value
LOANS ORIGINATED
23
$474,366
47
$472,392
236
$370,764
19
$299,014
10
$363,348
APPLICATIONS APPROVED, NOT ACCEPTED
1
$573,060
6
$456,887
23
$459,973
1
$11,240
1
$397,980
APPLICATIONS DENIED
2
$463,320
17
$648,174
82
$418,802
9
$216,510
3
$313,123
APPLICATIONS WITHDRAWN
2
$664,805
6
$410,335
44
$414,210
3
$393,810
1
$454,700
FILES CLOSED FOR INCOMPLETENESS
2
$413,810
2
$503,395
18
$425,499
2
$190,880
0
$0
Aggregated Statistics For Year 2008 (Based on 1 full and 1 partial tracts)
A) FHA, FSA/RHS & VA Home Purchase Loans
B) Conventional Home Purchase Loans
C) Refinancings
D) Home Improvement Loans
F) Non-occupant Loans on < 5 Family Dwellings (A B C & D)
G) Loans On Manufactured Home Dwelling (A B C & D)
Number
Average Value
Number
Average Value
Number
Average Value
Number
Average Value
Number
Average Value
Number
Average Value
LOANS ORIGINATED
6
$450,423
44
$444,221
88
$369,015
20
$212,566
1
$209,750
1
$6,680
APPLICATIONS APPROVED, NOT ACCEPTED
1
$437,470
10
$528,218
25
$333,812
0
$0
3
$285,767
2
$286,320
APPLICATIONS DENIED
1
$450,480
16
$636,906
58
$547,189
11
$165,115
3
$318,873
1
$334,990
APPLICATIONS WITHDRAWN
1
$731,870
12
$668,241
25
$475,224
4
$407,348
1
$95,440
0
$0
FILES CLOSED FOR INCOMPLETENESS
0
$0
2
$774,020
16
$581,009
0
$0
0
$0
0
$0
Aggregated Statistics For Year 2007 (Based on 1 full and 1 partial tracts)
B) Conventional Home Purchase Loans
C) Refinancings
D) Home Improvement Loans
F) Non-occupant Loans on < 5 Family Dwellings (A B C & D)
G) Loans On Manufactured Home Dwelling (A B C & D)
Number
Average Value
Number
Average Value
Number
Average Value
Number
Average Value
Number
Average Value
LOANS ORIGINATED
64
$528,077
187
$498,052
35
$279,792
8
$331,500
0
$0
APPLICATIONS APPROVED, NOT ACCEPTED
14
$420,023
53
$485,206
5
$209,480
5
$375,116
1
$235,220
APPLICATIONS DENIED
43
$648,114
132
$555,744
17
$453,411
4
$578,290
1
$146,820
APPLICATIONS WITHDRAWN
12
$450,080
48
$500,339
5
$507,580
4
$481,308
0
$0
FILES CLOSED FOR INCOMPLETENESS
2
$614,595
18
$653,606
1
$419,500
2
$328,575
0
$0
Aggregated Statistics For Year 2006 (Based on 1 full and 1 partial tracts)
B) Conventional Home Purchase Loans
C) Refinancings
D) Home Improvement Loans
E) Loans on Dwellings For 5+ Families
F) Non-occupant Loans on < 5 Family Dwellings (A B C & D)
G) Loans On Manufactured Home Dwelling (A B C & D)
Number
Average Value
Number
Average Value
Number
Average Value
Number
Average Value
Number
Average Value
Number
Average Value
LOANS ORIGINATED
131
$557,007
217
$472,152
47
$292,685
0
$0
12
$537,734
1
$96,630
APPLICATIONS APPROVED, NOT ACCEPTED
30
$542,667
38
$569,280
3
$484,210
0
$0
3
$424,663
0
$0
APPLICATIONS DENIED
77
$577,432
82
$521,922
24
$206,249
1
$674,190
4
$349,628
0
$0
APPLICATIONS WITHDRAWN
30
$486,281
78
$520,894
13
$320,819
0
$0
5
$258,022
1
$57,260
FILES CLOSED FOR INCOMPLETENESS
9
$466,144
15
$398,105
2
$609,545
0
$0
1
$93,640
0
$0
Aggregated Statistics For Year 2005 (Based on 1 full and 1 partial tracts)
B) Conventional Home Purchase Loans
C) Refinancings
D) Home Improvement Loans
E) Loans on Dwellings For 5+ Families
F) Non-occupant Loans on < 5 Family Dwellings (A B C & D)
G) Loans On Manufactured Home Dwelling (A B C & D)
Number
Average Value
Number
Average Value
Number
Average Value
Number
Average Value
Number
Average Value
Number
Average Value
LOANS ORIGINATED
145
$559,414
280
$432,329
43
$240,596
1
$1,116,650
20
$387,127
0
$0
APPLICATIONS APPROVED, NOT ACCEPTED
22
$503,583
43
$466,122
10
$211,101
0
$0
1
$988,810
1
$26,220
APPLICATIONS DENIED
54
$548,880
92
$468,000
22
$287,274
0
$0
4
$650,592
1
$11,240
APPLICATIONS WITHDRAWN
28
$522,453
115
$406,678
11
$216,464
0
$0
3
$211,227
0
$0
FILES CLOSED FOR INCOMPLETENESS
11
$611,362
26
$443,178
1
$297,390
0
$0
2
$196,350
0
$0
Aggregated Statistics For Year 2004 (Based on 1 full and 1 partial tracts)
B) Conventional Home Purchase Loans
C) Refinancings
D) Home Improvement Loans
F) Non-occupant Loans on < 5 Family Dwellings (A B C & D)
G) Loans On Manufactured Home Dwelling (A B C & D)
Number
Average Value
Number
Average Value
Number
Average Value
Number
Average Value
Number
Average Value
LOANS ORIGINATED
141
$466,026
383
$376,043
58
$219,550
19
$355,081
0
$0
APPLICATIONS APPROVED, NOT ACCEPTED
38
$444,819
64
$329,617
5
$275,478
2
$567,070
0
$0
APPLICATIONS DENIED
48
$683,893
111
$376,936
20
$217,364
10
$299,660
1
$70,630
APPLICATIONS WITHDRAWN
38
$433,755
119
$346,739
7
$100,519
6
$357,748
0
$0
FILES CLOSED FOR INCOMPLETENESS
13
$342,389
28
$372,999
2
$111,030
2
$220,765
0
$0
Aggregated Statistics For Year 2003 (Based on 1 full and 1 partial tracts)
B) Conventional Home Purchase Loans
C) Refinancings
D) Home Improvement Loans
F) Non-occupant Loans on < 5 Family Dwellings (A B C & D)
Number
Average Value
Number
Average Value
Number
Average Value
Number
Average Value
LOANS ORIGINATED
134
$409,595
824
$299,362
28
$82,984
14
$236,119
APPLICATIONS APPROVED, NOT ACCEPTED
27
$403,756
106
$318,314
9
$77,558
4
$240,088
APPLICATIONS DENIED
24
$326,476
148
$329,155
12
$40,378
9
$171,851
APPLICATIONS WITHDRAWN
24
$352,210
139
$301,142
3
$61,677
1
$122,850
FILES CLOSED FOR INCOMPLETENESS
4
$566,838
34
$307,290
0
$0
1
$112,620
Aggregated Statistics For Year 2002 (Based on 1 full and 1 partial tracts)
A) FHA, FSA/RHS & VA Home Purchase Loans
B) Conventional Home Purchase Loans
C) Refinancings
D) Home Improvement Loans
F) Non-occupant Loans on < 5 Family Dwellings (A B C & D)
Number
Average Value
Number
Average Value
Number
Average Value
Number
Average Value
Number
Average Value
LOANS ORIGINATED
1
$382,040
158
$333,856
611
$287,184
16
$69,213
14
$254,266
APPLICATIONS APPROVED, NOT ACCEPTED
0
$0
24
$381,770
91
$290,891
8
$58,465
7
$233,971
APPLICATIONS DENIED
0
$0
31
$336,155
97
$275,357
12
$30,090
3
$184,203
APPLICATIONS WITHDRAWN
0
$0
16
$346,561
88
$283,916
9
$74,827
3
$116,670
FILES CLOSED FOR INCOMPLETENESS
0
$0
5
$404,326
35
$309,984
0
$0
2
$241,910
Aggregated Statistics For Year 2001 (Based on 1 full and 1 partial tracts)
A) FHA, FSA/RHS & VA Home Purchase Loans
B) Conventional Home Purchase Loans
C) Refinancings
D) Home Improvement Loans
F) Non-occupant Loans on < 5 Family Dwellings (A B C & D)
Number
Average Value
Number
Average Value
Number
Average Value
Number
Average Value
Number
Average Value
LOANS ORIGINATED
3
$224,007
118
$309,567
369
$259,153
19
$75,283
6
$225,300
APPLICATIONS APPROVED, NOT ACCEPTED
0
$0
15
$312,537
71
$307,700
3
$71,163
3
$225,730
APPLICATIONS DENIED
1
$159,560
25
$362,681
84
$258,878
8
$24,921
3
$92,577
APPLICATIONS WITHDRAWN
2
$171,580
18
$221,232
60
$234,336
6
$69,717
2
$274,740
FILES CLOSED FOR INCOMPLETENESS
1
$241,460
7
$334,859
15
$306,401
0
$0
0
$0
Aggregated Statistics For Year 2000 (Based on 1 full and 1 partial tracts)
A) FHA, FSA/RHS & VA Home Purchase Loans
B) Conventional Home Purchase Loans
C) Refinancings
D) Home Improvement Loans
E) Loans on Dwellings For 5+ Families
F) Non-occupant Loans on < 5 Family Dwellings (A B C & D)
Number
Average Value
Number
Average Value
Number
Average Value
Number
Average Value
Number
Average Value
Number
Average Value
LOANS ORIGINATED
6
$229,233
154
$286,899
104
$220,661
30
$54,031
1
$3,149,520
5
$225,216
APPLICATIONS APPROVED, NOT ACCEPTED
0
$0
27
$308,402
26
$310,566
5
$24,774
0
$0
2
$676,180
APPLICATIONS DENIED
0
$0
30
$309,232
57
$264,401
9
$39,404
0
$0
1
$249,450
APPLICATIONS WITHDRAWN
1
$200,760
22
$265,262
44
$213,714
2
$43,075
0
$0
1
$182,780
FILES CLOSED FOR INCOMPLETENESS
1
$158,810
5
$256,502
19
$294,943
3
$30,443
0
$0
1
$99,260
Aggregated Statistics For Year 1999 (Based on 3 partial tracts)
A) FHA, FSA/RHS & VA Home Purchase Loans
B) Conventional Home Purchase Loans
C) Refinancings
D) Home Improvement Loans
E) Loans on Dwellings For 5+ Families
F) Non-occupant Loans on < 5 Family Dwellings (A B C & D)
#11 on the list of "Top 101 cities with the most cars per house, population 5,000+"
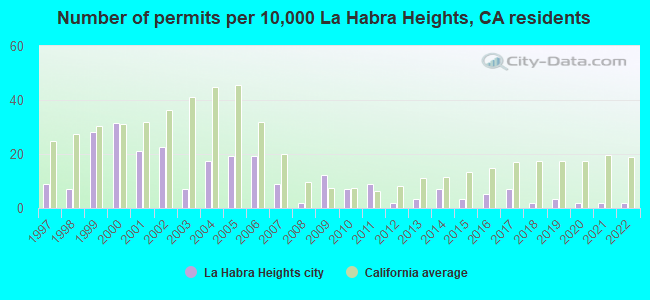
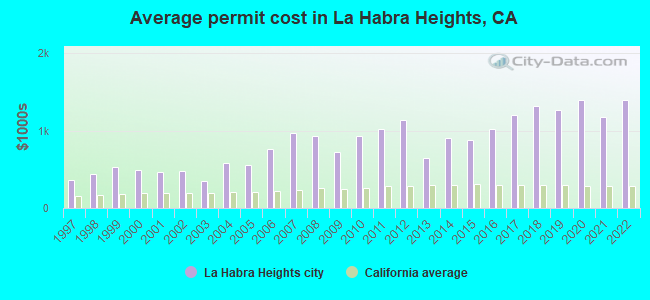
#20 on the list of "Top 101 cities with the highest cost per building permit(population 5,000+)"
#47 on the list of "Top 101 cities with the most residents born in Other Northern America (population 500+)"
#52 on the list of "Top 101 cities with the most people living the same house as 1 year ago (population 5,000+))"
#62 on the list of "Top 101 cities with the most residents born in Taiwan (population 500+)"
#67 on the list of "Top 101 cities with the lowest number of thefts per 100,000 residents (population 5,000+)"
#78 on the list of "Top 101 cities with largest percentage of males in occupations: architecture and engineering occupations (population 5,000+)"
#79 on the list of "Top 101 cities with the most residents born in Sweden (population 500+)"
#82 on the list of "Top 101 cities with largest percentage of females in occupations: health diagnosing and treating practitioners and other technical occupations (population 5,000+)"
#84 on the list of "Top 101 cities with largest percentage of females in occupations: law enforcement workers including supervisors (population 5,000+)"
#88 on the list of "Top 101 cities with the largest city-data.com crime index decrease from 2011 to 2012 (population 5,000+)"
#89 on the list of "Top 101 cities with largest percentage of males in occupations: health diagnosing and treating practitioners and other technical occupations (population 5,000+)"
#100 on the list of "Top 101 cities with the most residents born in China (population 500+)"
#1 on the list of "Top 101 counties with the most Evangelical Protestant congregations"
#1 on the list of "Top 101 counties with the most Mainline Protestant congregations"
#1 on the list of "Top 101 counties with the most Orthodox adherents"
#1 on the list of "Top 101 counties with the highest ground withdrawal of fresh water for public supply (pop. 50,000+)"
#1 on the list of "Top 101 counties with the most Catholic adherents (pop. 50,000+)"


 Recent articles from our blog. Our writers, many of them Ph.D. graduates or candidates, create easy-to-read articles on a wide variety of topics.

 (2.4 miles