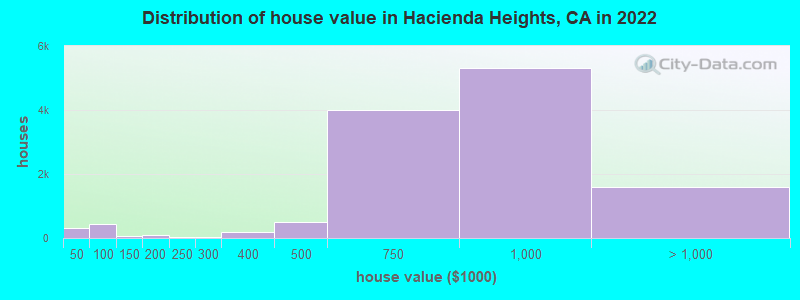
Estimated median house or condo value in 2022: $816,933 (it was $221,800 in 2000)
Hacienda Heights:
$816,933
CA:
$715,900
Mean prices in 2022:all housing units: $855,667; detached houses: $918,488; townhouses or other attached units: $668,156; in 3-to-4-unit structures: $410,120; in 5-or-more-unit structures: $702,835; mobile homes: $119,585
Median gross rent in 2022: $2,084.
March 2022 cost of living index in Hacienda Heights: 137.2 (high, U.S. average is 100)
Percentage of residents living in poverty in 2022: 10.6%
(10.7% for White Non-Hispanic residents, 8.3% for Black residents, 9.1% for Hispanic or Latino residents, 3.4% for American Indian residents, 12.8% for Native Hawaiian and other Pacific Islander residents, 11.8% for other race residents, 10.3% for two or more races residents)
420.08%Native Hawaiian and Other Pacific Islander alone
According to our research of California and other state lists, there were 38 registered sex offenders living in Hacienda Heights, California as of April 27, 2024. The ratio of all residents to sex offenders in Hacienda Heights is 1,433 to 1. The ratio of registered sex offenders to all residents in this city is lower than the state average.
Recent articles from our blog. Our writers, many of them Ph.D. graduates or candidates, create easy-to-read articles on a wide variety of topics.
Latest news from Hacienda Heights, CA collected exclusively by city-data.com from local newspapers, TV, and radio stations
Ancestries: American (1.4%).
Current Local Time: PST time zone
Elevation: 460 feet
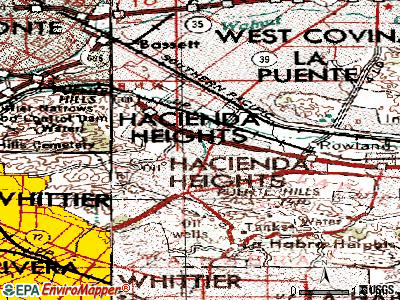
Land area: 11.4 square miles.
Population density: 4,749 people per square mile (average).
21,876 residents are foreign born (28.2% Asia, 11.3% Latin America).
This place:
40.3%
California:
26.5%
Median real estate property taxes paid for housing units with mortgages in 2022: $5,751 (0.7%) Median real estate property taxes paid for housing units with no mortgage in 2022: $4,465 (0.6%)
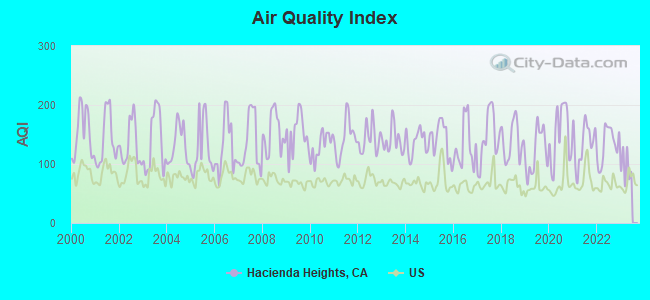
Air Quality Index (AQI) level in 2022 was 133. This is significantly worse than average.
City:
133
U.S.:
73
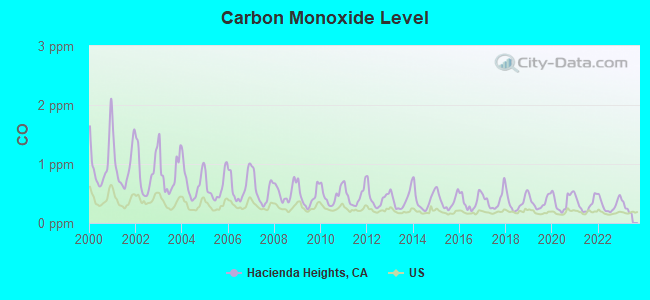
Carbon Monoxide (CO) [ppm] level in 2022 was 0.306. This is worse than average.Closest monitor was 5.3 miles away from the city center.
City:
0.306
U.S.:
0.251
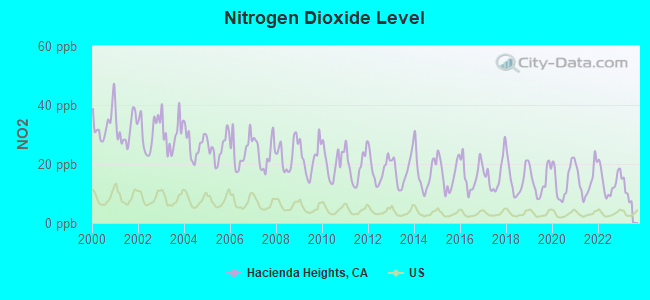
Nitrogen Dioxide (NO2) [ppb] level in 2022 was 13.9. This is significantly worse than average.Closest monitor was 5.3 miles away from the city center.
City:
13.9
U.S.:
5.1
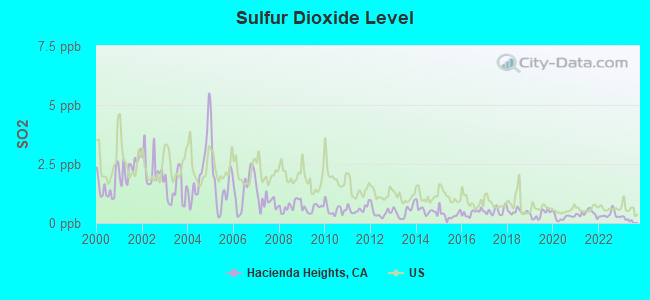
Sulfur Dioxide (SO2) [ppb] level in 2022 was 0.347. This is significantly better than average.Closest monitor was 5.3 miles away from the city center.
City:
0.347
U.S.:
1.515
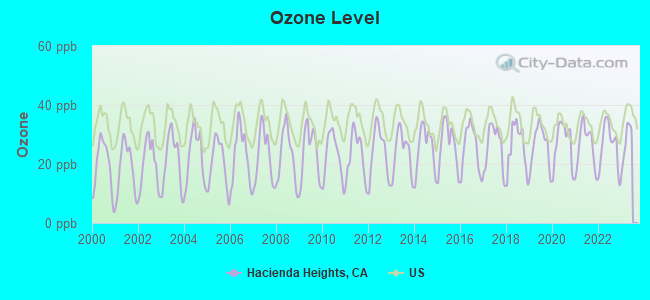
Ozone [ppb] level in 2022 was 26.2. This is better than average.Closest monitor was 5.3 miles away from the city center.
City:
26.2
U.S.:
33.3
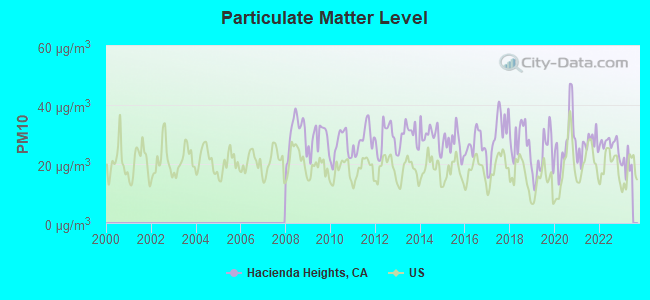
Particulate Matter (PM10) [µg/m3] level in 2022 was 26.5. This is worse than average.Closest monitor was 9.8 miles away from the city center.
City:
26.5
U.S.:
19.2
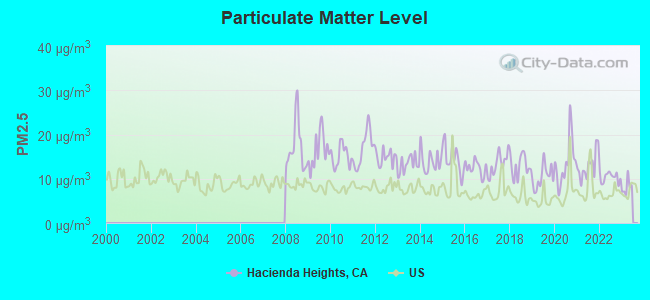
Particulate Matter (PM2.5) [µg/m3] level in 2022 was 10.4. This is worse than average.Closest monitor was 5.3 miles away from the city center.
City:
10.4
U.S.:
8.1
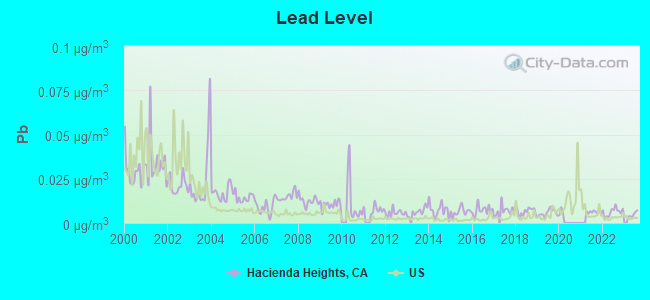
Lead (Pb) [µg/m3] level in 2022 was 0.00620. This is significantly better than average.Closest monitor was 4.9 miles away from the city center.
City:
0.00620
U.S.:
0.00931
Earthquake activity:
Hacienda Heights-area historical earthquake activity is significantly above California state average. It is 7082% greater than the overall U.S. average.
On 7/21/1952 at 11:52:14, a magnitude 7.7 (7.7 UK, Class: Major, Intensity: VIII - XII) earthquake occurred 90.7 miles away from Hacienda Heights center, causing $50,000,000 total damage On 6/28/1992 at 11:57:34, a magnitude 7.6 (6.2 MB, 7.6 MS, 7.3 MW, Depth: 0.7 mi) earthquake occurred 83.3 miles away from Hacienda Heights center, causing 3 deaths (1 shaking deaths, 2 other deaths) and 400 injuries, causing $100,000,000 total damage and $40,000,000 insured losses On 10/16/1999 at 09:46:44, a magnitude 7.4 (6.3 MB, 7.4 MS, 7.2 MW, 7.3 ML) earthquake occurred 94.7 miles away from Hacienda Heights center On 11/4/1927 at 13:51:53, a magnitude 7.5 (7.5 UK) earthquake occurred 185.7 miles away from the city center On 4/21/1918 at 22:32:30, a magnitude 6.8 (6.8 UK, Class: Strong, Intensity: VII - IX) earthquake occurred 33.1 miles away from Hacienda Heights center On 1/17/1994 at 12:30:55, a magnitude 6.8 (6.4 MB, 6.8 MS, 6.7 MW, Depth: 11.4 mi) earthquake occurred 36.3 miles away from Hacienda Heights center, causing 60 deaths (60 shaking deaths) and 7000 injuries Magnitude types: body-wave magnitude (MB), local magnitude (ML), surface-wave magnitude (MS), moment magnitude (MW)
Natural disasters:
The number of natural disasters in Los Angeles County (57) is a lot greater than the US average (15). Major Disasters (Presidential) Declared: 27 Emergencies Declared: 3
Causes of natural disasters: Fires: 37, Floods: 16, Storms: 9, Winter Storms: 6, Landslides: 5, Mudslides: 5, Earthquakes: 3, Freeze: 1, Heavy Rain: 1, Hurricane: 1, Snow: 1, Tornado: 1, Wind: 1, Other: 1 (Note: some incidents may be assigned to more than one category).
Hospitals and medical centers in Hacienda Heights:
CASA TERRY (15576 LUJON STREET)
UNITED CARE HOMES - KINBRAE (1160 KINBRAE AVENUE)
HACIENDA DIALYSIS CENTER (2020 S. HACIENDA BLVD., SUITE G)
Amtrak stations near Hacienda Heights:
10 miles: FULLERTON (120 E. SANTA FE AVE.) . Services: ticket office, fully wheelchair accessible, enclosed waiting area, public restrooms, public payphones, full-service food facilities, free short-term parking, paid long-term parking, taxi stand, public transit connection.
14 miles: POMONA (156 W. COMMERCIAL ST.) . Services: partially wheelchair accessible, public payphones, free short-term parking, free long-term parking, call for taxi service, public transit connection.
14 miles: PASADENA (150 S. ROBLES AVE.) - Bus Station . Services: fully wheelchair accessible, enclosed waiting area, public restrooms, public payphones, full-service food facilities, paid short-term parking, paid long-term parking, taxi stand, public transit connection.
Colleges/universities with over 2000 students nearest to Hacienda Heights:
Hacienda La Puente Adult Education (about 2 miles; La Puente, CA; Full-time enrollment: 2,750)
Rio Hondo College (about 4 miles; Whittier, CA; FT enrollment: 9,610)
Biola University (about 8 miles; La Mirada, CA; FT enrollment: 5,325)
Mt San Antonio College (about 8 miles; Walnut, CA; FT enrollment: 19,891)
Fullerton College (about 10 miles; Fullerton, CA; FT enrollment: 11,124)
California State Polytechnic University-Pomona (about 10 miles; Pomona, CA; FT enrollment: 18,141)
California State University-Fullerton (about 10 miles; Fullerton, CA; FT enrollment: 28,947)
Public high schools in Hacienda Heights:
LOS ALTOS HIGH(Students: 1,544, Location: 15325 E. LOS ROBLES AVE., Grades: 9-12)
GLEN A. WILSON HIGH(Students: 1,238, Location: 16455 WEDGEWORTH DR., Grades: 9-12)
Notable locations in Hacienda Heights: Hacienda Heights Branch County of Los Angeles Public Library (A), Los Angeles County Fire Department Station 91 (B). Display/hide their locations on the map
Churches in Hacienda Heights include: Saint Matthews United Methodist Church (A), Holy Trinity Lutheran Church (B), Hacienda Heights Baptist Church (C). Display/hide their locations on the map
Parks in Hacienda Heights include: Stimson Park (1), Los Robles County Park (2), Manzanita Park (3), Country Wood Park (4), Pepperbrook Park (5), Schabarum Regional Park (6), Thomas S Burton Park (7). Display/hide their locations on the map
Tourist attraction: A Premier Travel (Tours & Charters; S 2391 Hacienda Bl).
Birthplace of: Caprice Bourret, Shane del Rosario - Martial artist, Josh Keaton - Child actor, Ralph Brown - 2005 NFL player (Minnesota Vikings, born: Sep 16, 1978), Ralph Brown (American football) - College football player, Shaun Cody - 2005 NFL player (Detroit Lions, born: Jan 22, 1983), Jill Sterkel - Swimmer, Troy Tanner - Volleyball player.
Los Angeles County has a predicted average indoor radon screening level between 2 and 4 pCi/L (pico curies per liter) - Moderate Potential
Average household size:
This place:
3.3 people
California:
2.9 people
Percentage of family households:
This place:
83.4%
Whole state:
68.7%
Percentage of households with unmarried partners:
This place:
4.0%
Whole state:
7.2%
Likely homosexual households (counted as self-reported same-sex unmarried-partner households)
Lesbian couples: 0.3% of all households
Gay men: 0.3% of all households
People in group quarters in Hacienda Heights in 2010:
46 people in group homes intended for adults
36 people in nursing facilities/skilled-nursing facilities
16 people in residential treatment centers for adults
8 people in other noninstitutional facilities
4 people in in-patient hospice facilities
People in group quarters in Hacienda Heights in 2000:
43 people in schools, hospitals, or wards for the intellectually disabled
17 people in nursing homes
12 people in homes for the mentally ill
6 people in agriculture workers' dormitories on farms
3 people in homes for the mentally retarded
Banks with branches in Hacienda Heights (2011 data):
Bank of America, National Association: Puente Hills Branch at 1605 South Azusa Avenue, branch established on 1971/05/03; Hacienda Heights Branch at 2101 South Hacienda Boulevard, branch established on 1967/04/04. Info updated 2009/11/18: Bank assets: $1,451,969.3 mil, Deposits: $1,077,176.8 mil, headquarters in Charlotte, NC, positive income, 5782 total offices, Holding Company: Bank Of America Corporation
Banco Popular North America: Loan Production Office at 3101 Colima Rd, branch established on 1920/01/01; Hacienda Heights Branch at 3160 South Colima Road, branch established on 1934/10/30. Info updated 2012/01/27: Bank assets: $8,605.3 mil, Deposits: $6,167.7 mil, headquarters in New York, NY, positive income, Commercial Lending Specialization, 97 total offices, Holding Company: Popular, Inc.
U.S. Bank National Association: Hacienda Heights Branch at 2040 South Hacienda Boulevard, branch established on 1963/10/03; Hacienda Heights Albertsons Branch at 17120 Colima Rd, branch established on 2000/11/03. Info updated 2012/01/30: Bank assets: $330,470.8 mil, Deposits: $236,091.5 mil, headquarters in Cincinnati, OH, positive income, 3121 total offices, Holding Company: U.S. Bancorp
The Bank of East Asia (USA), National Association: Los Angeles Regional Branch at 17180 Colima Road, branch established on 1986/04/28. Info updated 2006/05/30: Bank assets: $780.4 mil, Deposits: $620.7 mil, headquarters in New York, NY, positive income, Commercial Lending Specialization, 13 total offices, Holding Company: Bank Of East Asia, Limited, The
OneWest Bank, FSB: 2233 So. Hacienda Blvd. Branch at 2233 S. Hacienda Blvd., branch established on 1936/07/06. Info updated 2011/07/21: Bank assets: $26,181.3 mil, Deposits: $15,408.4 mil, headquarters in Pasadena, CA, positive income, 79 total offices
California Bank & Trust: Hacienda Heights Branch at 1687 South Azusa Avenue, branch established on 1978/05/03. Info updated 2009/07/20: Bank assets: $10,894.1 mil, Deposits: $9,193.9 mil, headquarters in San Diego, CA, positive income, Commercial Lending Specialization, 109 total offices, Holding Company: Zions Bancorporation
East West Bank: Hacienda Heights Branch at 17188-A Colima Rd., branch established on 1989/06/30. Info updated 2010/06/14: Bank assets: $21,962.4 mil, Deposits: $17,501.8 mil, headquarters in Pasadena, CA, positive income, Commercial Lending Specialization, 131 total offices, Holding Company: East West Bancorp, Inc.
JPMorgan Chase Bank, National Association: Colima Road Branch at 17160-D Colima Road, branch established on 1919/01/01. Info updated 2011/11/10: Bank assets: $1,811,678.0 mil, Deposits: $1,190,738.0 mil, headquarters in Columbus, OH, positive income, International Specialization, 5577 total offices, Holding Company: Jpmorgan Chase & Co.
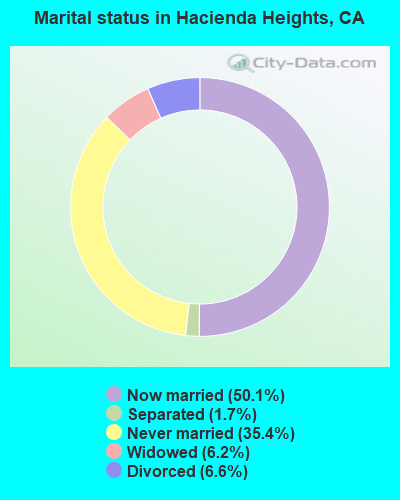
For population 15 years and over in Hacienda Heights:
Never married: 35.4%
Now married: 50.1%
Separated: 1.7%
Widowed: 6.2%
Divorced: 6.6%
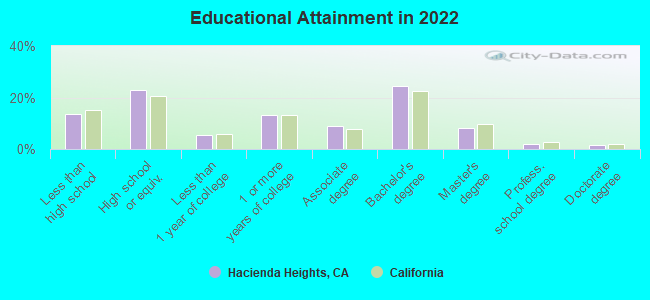
For population 25 years and over in Hacienda Heights:
Religion statistics for Hacienda Heights, CA (based on Los Angeles County data)
Religion
Adherents
Congregations
Catholic
3,542,994
275
Evangelical Protestant
814,611
3,249
Other
451,594
1,023
Mainline Protestant
229,056
860
Black Protestant
112,338
290
Orthodox
63,517
76
None
4,604,495
-
Source: Clifford Grammich, Kirk Hadaway, Richard Houseal, Dale E.Jones, Alexei Krindatch, Richie Stanley and Richard H.Taylor. 2012. 2010 U.S.Religion Census: Religious Congregations & Membership Study. Association of Statisticians of American Religious Bodies. Jones, Dale E., et al. 2002. Congregations and Membership in the United States 2000. Nashville, TN: Glenmary Research Center. Graphs represent county-level data
Aircraft: PIPER PA-28RT-201 (Category: Land, Seats: 4, Weight: Up to 12,499 Pounds), Engine: LYCOMING I0360 SER A&C (200 HP) (Reciprocating) N-Number: 2219Z, N2219Z, N-2219Z, Serial Number: 28R-7918118, Year manufactured: 1979, Airworthiness Date: 04/02/1979, Certificate Issue Date: 04/22/1998 Registrant (Individual): Robert E Schneider, 15072 E Wedgeworth Dr, Hacienda Heights, CA 91745
Aircraft: PIPER PA-28-180 (Category: Land, Seats: 4, Weight: Up to 12,499 Pounds, Speed: 107 mph), Engine: LYCOMING O&VO-360 SER (180 HP) (Reciprocating) N-Number: 8448W, N8448W, N-8448W, Serial Number: 28-2654, Year manufactured: 1965, Airworthiness Date: 08/10/1965, Certificate Issue Date: 05/28/2015 Registrant (Individual): Anthony J Guzman, 3235 Leticia Dr, Hacienda Heights, CA 91745
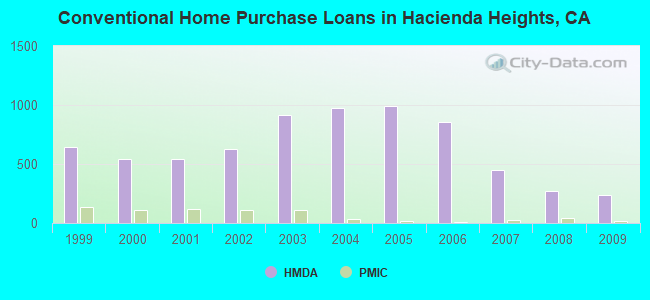
Home Mortgage Disclosure Act Aggregated Statistics For Year 2009 (Based on 9 full and 4 partial tracts)
A) FHA, FSA/RHS & VA Home Purchase Loans
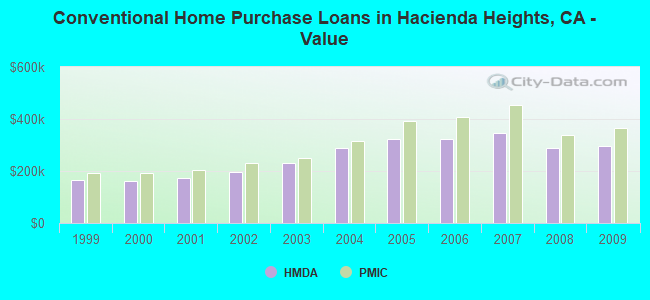
B) Conventional Home Purchase Loans
C) Refinancings
D) Home Improvement Loans
F) Non-occupant Loans on < 5 Family Dwellings (A B C & D)
G) Loans On Manufactured Home Dwelling (A B C & D)
Number
Average Value
Number
Average Value
Number
Average Value
Number
Average Value
Number
Average Value
Number
Average Value
LOANS ORIGINATED
60
$325,492
239
$297,686
909
$284,468
57
$241,811
56
$230,061
0
$0
APPLICATIONS APPROVED, NOT ACCEPTED
7
$379,339
26
$341,690
121
$289,211
10
$106,376
6
$225,943
1
$44,000
APPLICATIONS DENIED
12
$288,391
55
$334,534
320
$317,211
27
$161,329
33
$245,162
1
$20,920
APPLICATIONS WITHDRAWN
21
$341,462
29
$314,941
156
$298,470
19
$265,117
14
$238,784
0
$0
FILES CLOSED FOR INCOMPLETENESS
4
$257,647
20
$312,797
52
$329,045
8
$201,905
2
$526,275
0
$0
Aggregated Statistics For Year 2008 (Based on 9 full and 4 partial tracts)
A) FHA, FSA/RHS & VA Home Purchase Loans
B) Conventional Home Purchase Loans
C) Refinancings
D) Home Improvement Loans
F) Non-occupant Loans on < 5 Family Dwellings (A B C & D)
G) Loans On Manufactured Home Dwelling (A B C & D)
Number
Average Value
Number
Average Value
Number
Average Value
Number
Average Value
Number
Average Value
Number
Average Value
LOANS ORIGINATED
33
$351,387
272
$287,048
563
$301,518
64
$182,189
57
$274,296
6
$93,290
APPLICATIONS APPROVED, NOT ACCEPTED
5
$347,208
50
$291,405
142
$310,270
13
$92,394
15
$248,339
4
$74,695
APPLICATIONS DENIED
12
$331,939
94
$303,652
332
$336,839
56
$133,438
38
$236,111
9
$71,921
APPLICATIONS WITHDRAWN
10
$364,976
39
$295,069
160
$314,453
15
$145,088
14
$290,836
0
$0
FILES CLOSED FOR INCOMPLETENESS
3
$527,433
26
$327,797
61
$356,173
9
$181,496
4
$265,018
0
$0
Aggregated Statistics For Year 2007 (Based on 9 full and 4 partial tracts)
A) FHA, FSA/RHS & VA Home Purchase Loans
B) Conventional Home Purchase Loans
C) Refinancings
D) Home Improvement Loans
F) Non-occupant Loans on < 5 Family Dwellings (A B C & D)
G) Loans On Manufactured Home Dwelling (A B C & D)
Number
Average Value
Number
Average Value
Number
Average Value
Number
Average Value
Number
Average Value
Number
Average Value
LOANS ORIGINATED
2
$268,000
451
$346,310
1,074
$337,695
177
$219,694
84
$312,779
8
$121,366
APPLICATIONS APPROVED, NOT ACCEPTED
0
$0
170
$354,177
279
$350,650
38
$266,070
21
$336,778
9
$81,399
APPLICATIONS DENIED
0
$0
240
$391,464
652
$380,879
134
$198,095
47
$334,828
12
$56,746
APPLICATIONS WITHDRAWN
0
$0
90
$392,512
281
$367,388
41
$255,774
21
$309,723
0
$0
FILES CLOSED FOR INCOMPLETENESS
0
$0
34
$328,283
109
$402,819
12
$194,349
3
$397,710
1
$11,620
Aggregated Statistics For Year 2006 (Based on 9 full and 4 partial tracts)
A) FHA, FSA/RHS & VA Home Purchase Loans
B) Conventional Home Purchase Loans
C) Refinancings
D) Home Improvement Loans
F) Non-occupant Loans on < 5 Family Dwellings (A B C & D)
G) Loans On Manufactured Home Dwelling (A B C & D)
Number
Average Value
Number
Average Value
Number
Average Value
Number
Average Value
Number
Average Value
Number
Average Value
LOANS ORIGINATED
1
$316,000
856
$323,392
1,440
$336,399
221
$223,869
115
$295,444
5
$56,320
APPLICATIONS APPROVED, NOT ACCEPTED
1
$109,850
205
$310,291
285
$331,222
47
$234,583
36
$265,524
14
$65,126
APPLICATIONS DENIED
0
$0
374
$325,909
662
$375,748
132
$228,755
58
$342,582
11
$97,046
APPLICATIONS WITHDRAWN
1
$315,000
149
$331,924
441
$352,033
76
$215,504
31
$271,674
5
$268,398
FILES CLOSED FOR INCOMPLETENESS
0
$0
44
$355,599
130
$376,077
12
$277,486
6
$374,428
0
$0
Aggregated Statistics For Year 2005 (Based on 9 full and 4 partial tracts)
A) FHA, FSA/RHS & VA Home Purchase Loans
B) Conventional Home Purchase Loans
C) Refinancings
D) Home Improvement Loans
E) Loans on Dwellings For 5+ Families
F) Non-occupant Loans on < 5 Family Dwellings (A B C & D)
G) Loans On Manufactured Home Dwelling (A B C & D)
Number
Average Value
Number
Average Value
Number
Average Value
Number
Average Value
Number
Average Value
Number
Average Value
Number
Average Value
LOANS ORIGINATED
1
$191,000
993
$321,908
1,710
$299,379
259
$219,119
1
$3,452,850
174
$251,751
6
$134,490
APPLICATIONS APPROVED, NOT ACCEPTED
1
$307,000
189
$285,286
320
$286,002
56
$146,110
0
$0
30
$239,543
18
$79,036
APPLICATIONS DENIED
2
$242,000
280
$318,679
636
$312,149
131
$151,036
0
$0
50
$246,214
10
$64,611
APPLICATIONS WITHDRAWN
0
$0
174
$303,949
594
$305,030
86
$227,601
0
$0
33
$293,334
2
$112,945
FILES CLOSED FOR INCOMPLETENESS
0
$0
44
$294,948
142
$313,077
11
$164,748
0
$0
7
$309,341
2
$149,815
Aggregated Statistics For Year 2004 (Based on 9 full and 4 partial tracts)
A) FHA, FSA/RHS & VA Home Purchase Loans
B) Conventional Home Purchase Loans
C) Refinancings
D) Home Improvement Loans
E) Loans on Dwellings For 5+ Families
F) Non-occupant Loans on < 5 Family Dwellings (A B C & D)
G) Loans On Manufactured Home Dwelling (A B C & D)
Number
Average Value
Number
Average Value
Number
Average Value
Number
Average Value
Number
Average Value
Number
Average Value
Number
Average Value
LOANS ORIGINATED
3
$260,673
972
$287,865
2,264
$250,700
256
$176,630
2
$18,573,410
176
$213,659
4
$70,205
APPLICATIONS APPROVED, NOT ACCEPTED
2
$270,500
173
$287,806
451
$248,218
45
$110,005
0
$0
29
$227,529
2
$62,760
APPLICATIONS DENIED
1
$294,000
256
$263,843
718
$247,099
127
$120,029
0
$0
55
$198,772
8
$74,265
APPLICATIONS WITHDRAWN
4
$216,162
152
$264,686
578
$245,368
61
$135,213
0
$0
24
$254,770
2
$43,750
FILES CLOSED FOR INCOMPLETENESS
2
$162,000
23
$284,400
136
$260,481
14
$242,378
0
$0
7
$240,259
0
$0
Aggregated Statistics For Year 2003 (Based on 9 full and 4 partial tracts)
A) FHA, FSA/RHS & VA Home Purchase Loans
B) Conventional Home Purchase Loans
C) Refinancings
D) Home Improvement Loans
E) Loans on Dwellings For 5+ Families
F) Non-occupant Loans on < 5 Family Dwellings (A B C & D)
Number
Average Value
Number
Average Value
Number
Average Value
Number
Average Value
Number
Average Value
Number
Average Value
LOANS ORIGINATED
30
$233,516
912
$229,752
4,349
$200,594
91
$69,173
1
$2,397,120
235
$166,900
APPLICATIONS APPROVED, NOT ACCEPTED
4
$158,700
145
$237,310
700
$205,100
23
$92,920
0
$0
51
$199,289
APPLICATIONS DENIED
8
$220,146
179
$228,408
806
$215,960
77
$48,248
0
$0
45
$193,255
APPLICATIONS WITHDRAWN
5
$212,888
86
$246,710
816
$202,319
23
$75,549
0
$0
29
$191,443
FILES CLOSED FOR INCOMPLETENESS
1
$50,000
42
$240,017
165
$218,820
8
$28,558
0
$0
8
$117,984
Aggregated Statistics For Year 2002 (Based on 8 full and 1 partial tracts)
A) FHA, FSA/RHS & VA Home Purchase Loans
B) Conventional Home Purchase Loans
C) Refinancings
D) Home Improvement Loans
E) Loans on Dwellings For 5+ Families
F) Non-occupant Loans on < 5 Family Dwellings (A B C & D)
Number
Average Value
Number
Average Value
Number
Average Value
Number
Average Value
Number
Average Value
Number
Average Value
LOANS ORIGINATED
62
$187,902
629
$197,352
2,305
$187,285
65
$49,465
1
$9,488,600
126
$139,774
APPLICATIONS APPROVED, NOT ACCEPTED
4
$210,688
81
$220,712
359
$185,417
21
$24,516
0
$0
11
$148,747
APPLICATIONS DENIED
14
$173,929
80
$159,924
468
$170,146
48
$28,256
0
$0
14
$171,831
APPLICATIONS WITHDRAWN
16
$195,922
68
$191,077
520
$185,480
30
$59,117
0
$0
11
$132,015
FILES CLOSED FOR INCOMPLETENESS
0
$0
25
$189,024
163
$187,295
1
$20,000
0
$0
3
$183,723
Aggregated Statistics For Year 2001 (Based on 8 full and 1 partial tracts)
A) FHA, FSA/RHS & VA Home Purchase Loans
B) Conventional Home Purchase Loans
C) Refinancings
D) Home Improvement Loans
E) Loans on Dwellings For 5+ Families
F) Non-occupant Loans on < 5 Family Dwellings (A B C & D)
Number
Average Value
Number
Average Value
Number
Average Value
Number
Average Value
Number
Average Value
Number
Average Value
LOANS ORIGINATED
131
$169,822
543
$172,356
1,514
$169,900
88
$39,056
3
$11,413,333
86
$140,036
APPLICATIONS APPROVED, NOT ACCEPTED
7
$195,043
59
$177,763
226
$155,013
13
$51,442
0
$0
9
$132,358
APPLICATIONS DENIED
15
$165,999
97
$158,908
516
$147,939
78
$45,959
0
$0
25
$117,317
APPLICATIONS WITHDRAWN
12
$161,304
64
$167,251
452
$169,210
39
$54,021
0
$0
11
$147,475
FILES CLOSED FOR INCOMPLETENESS
4
$163,090
25
$160,128
106
$187,692
1
$55,000
0
$0
7
$106,190
Aggregated Statistics For Year 2000 (Based on 8 full and 1 partial tracts)
A) FHA, FSA/RHS & VA Home Purchase Loans
B) Conventional Home Purchase Loans
C) Refinancings
D) Home Improvement Loans
E) Loans on Dwellings For 5+ Families
F) Non-occupant Loans on < 5 Family Dwellings (A B C & D)
Number
Average Value
Number
Average Value
Number
Average Value
Number
Average Value
Number
Average Value
Number
Average Value
LOANS ORIGINATED
106
$155,638
542
$160,710
381
$129,054
85
$29,999
2
$3,631,580
34
$120,860
APPLICATIONS APPROVED, NOT ACCEPTED
7
$148,714
62
$179,372
82
$133,826
35
$26,610
0
$0
10
$135,096
APPLICATIONS DENIED
17
$174,340
124
$152,710
248
$118,641
61
$32,607
1
$125,000
11
$100,881
APPLICATIONS WITHDRAWN
12
$148,300
59
$162,509
153
$112,712
14
$50,414
0
$0
6
$111,348
FILES CLOSED FOR INCOMPLETENESS
9
$147,753
21
$202,357
71
$156,410
4
$121,125
1
$150,000
4
$158,198
Aggregated Statistics For Year 1999 (Based on 5 full and 6 partial tracts)
A) FHA, FSA/RHS & VA Home Purchase Loans
B) Conventional Home Purchase Loans
C) Refinancings
D) Home Improvement Loans
E) Loans on Dwellings For 5+ Families
F) Non-occupant Loans on < 5 Family Dwellings (A B C & D)
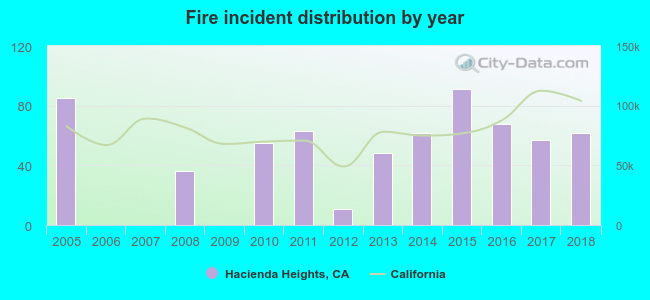
2005 - 2018 National Fire Incident Reporting System (NFIRS) incidents
According to the data from the years 2005 - 2018 the average number of fire incidents per year is 46. The highest number of fires - 91 took place in 2015, and the least - 0 in 2006. The data has a decreasing trend.
When looking into fire subcategories, the most reports belonged to: Outside Fires (35.7%), and Structure Fires (29.2%).
Fire incident types reported to NFIRS in Hacienda Heights, CA
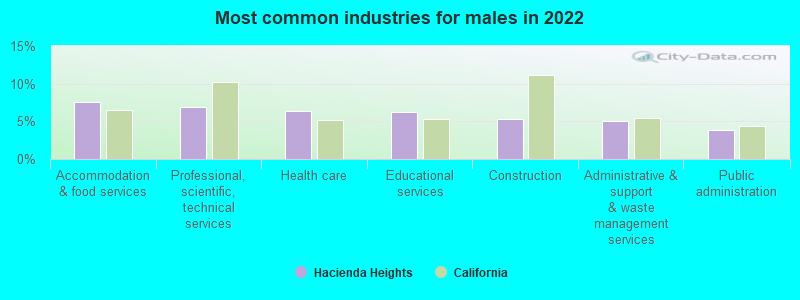
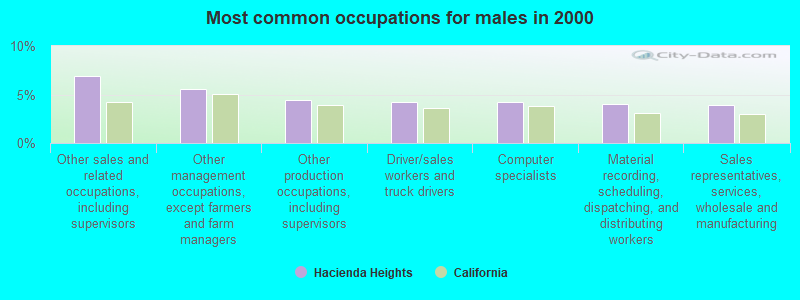
#6 on the list of "Top 101 cities with largest percentage of males in industries: wholesale trade (population 50,000+)"
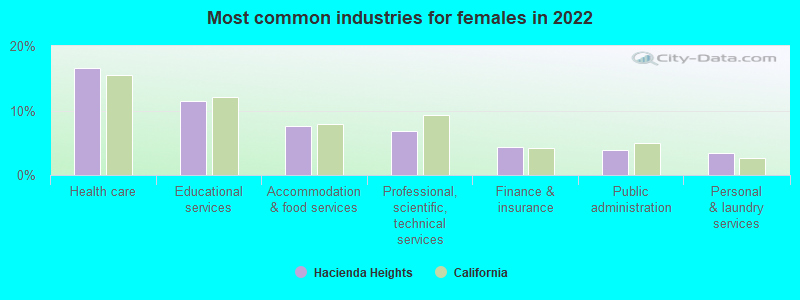
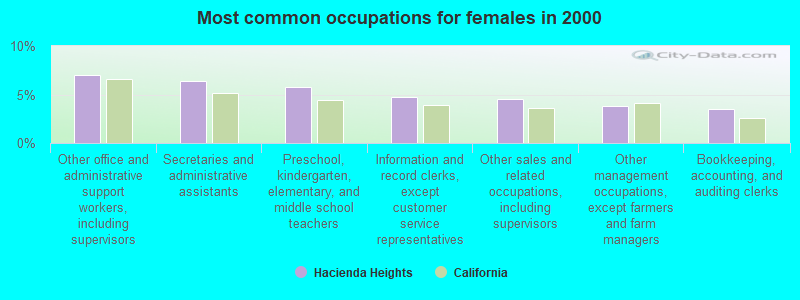
#8 on the list of "Top 101 cities with largest percentage of females in industries: wholesale trade (population 50,000+)"
#10 on the list of "Top 101 cities with the most residents born in Taiwan (population 500+)"
#13 on the list of "Top 101 cities with the most residents born in China (population 500+)"
#20 on the list of "Top 101 cities with the most residents born in Eastern Asia (population 500+)"
#21 on the list of "Top 101 cities where residents moved in more then 10 years ago (10,000+ households)"
#30 on the list of "Top 101 cities with the most residents born in China, excluding Hong Kong and Taiwan (population 500+)"
#31 on the list of "Top 101 cities that people commute from (largest negative percentage daily daytime population change due to commuting) (population 50,000+)"
#32 on the list of "Top 100 cities with highest percentage of foreign-born residents (pop. 50,000+)"
#38 on the list of "Top 101 cities with the most cars per house, population 50,000+"
#42 on the list of "Top 101 cities with the most residents born in Hong Kong (population 500+)"
#47 on the list of "Top 101 cities with the lowest percentage of English-only speaking households, population 50,000+"
#48 on the list of "Top 100 cities with longest commuting times (pop. 50,000+)"
#57 on the list of "Top 101 cities with the smallest percentage of unmarried partner households (population 50,000+)"
#66 on the list of "Top 101 cities with largest percentage of males in occupations: healthcare support occupations (population 50,000+)"
#67 on the list of "Top 101 cities with the most residents born in Asia (population 500+)"
#73 on the list of "Top 100 high-educated but low-earning cities (pop. 50,000+)"
#81 on the list of "Top 101 larger cities with the highest increase in house/condo value from 2000 (population 50,000+)"
#100 on the list of "Top 100 cities with highest median house value (pop. 50,000+)"
#27 (91748) on the list of "Top 101 zip codes with the most full service restaurants in 2005"
#1 on the list of "Top 101 counties with the most Evangelical Protestant congregations"
#1 on the list of "Top 101 counties with the most Mainline Protestant congregations"
#1 on the list of "Top 101 counties with the most Orthodox adherents"
#1 on the list of "Top 101 counties with the highest ground withdrawal of fresh water for public supply (pop. 50,000+)"
#1 on the list of "Top 101 counties with the most Catholic adherents (pop. 50,000+)"


 Recent articles from our blog. Our writers, many of them Ph.D. graduates or candidates, create easy-to-read articles on a wide variety of topics.

 (7.7 miles


 According to the data from the years 2005 - 2018 the average number of fire incidents per year is 46. The highest number of fires - 91 took place in 2015, and the least - 0 in 2006. The data has a decreasing trend.
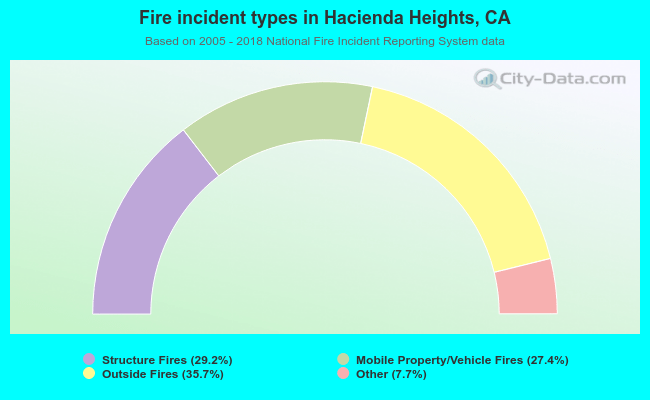 When looking into fire subcategories, the most reports belonged to: Outside Fires (35.7%), and Structure Fires (29.2%).