Estimated zip code population in 2022: 43,486 Zip code population in 2010: 45,406 Zip code population in 2000: 46,324
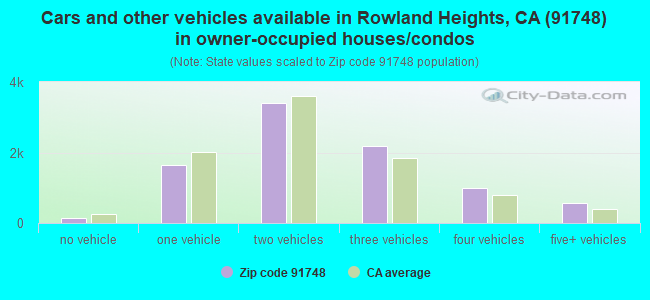
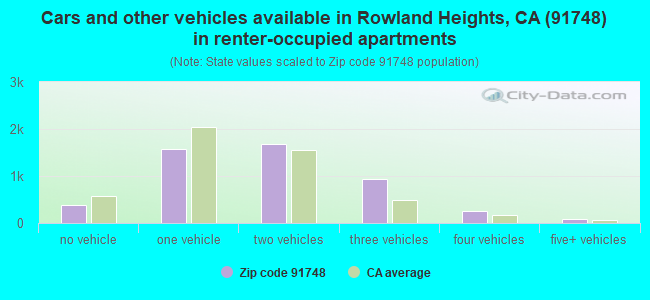
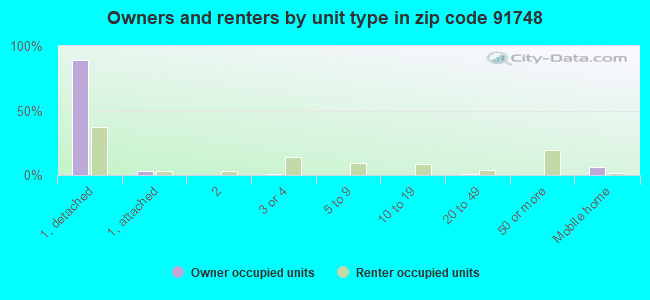
Houses and condos: 14,455 Renter-occupied apartments: 4,931
% of renters here:
35%
State:
44%
March 2022 cost of living index in zip code 91748: 136.1 (high, U.S. average is 100)
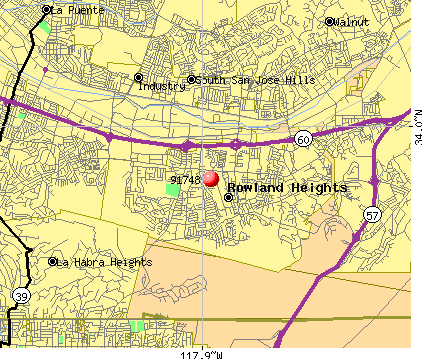
Land area: 14.5 sq. mi. Water area: 0.1 sq. mi.
Population density: 3,006 people per square mile
(average).
OSM Map
General Map
Google Map
MSN Map
OSM Map
General Map
Google Map
MSN Map
OSM Map
General Map
Google Map
MSN Map
OSM Map
General Map
Google Map
MSN Map
Please wait while loading the map...
Real estate property taxes paid for housing units in 2022:
This zip code:
0.8% ($6,008)
California:
0.7% ($4,831)
Median real estate property taxes paid for housing units with mortgages in 2022: $6,721 (0.8%) Median real estate property taxes paid for housing units with no mortgage in 2022: $4,966 (0.7%)
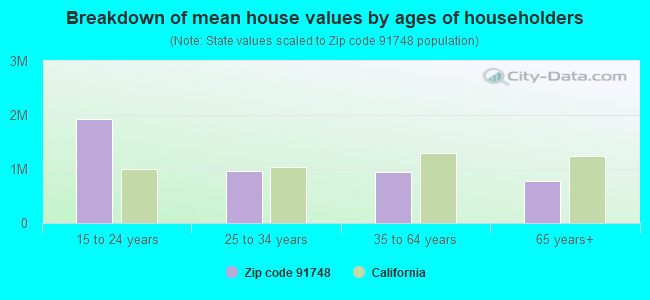
Estimated median house/condo value in 2022: $792,995
91748:
$792,995
California:
$715,900
According to our research of California and other state lists, there were 27 registered sex offenders living in 91748 zip code as of April 27, 2024. The ratio of all residents to sex offenders in zip code 91748 is 1,749 to 1. The ratio of registered sex offenders to all residents in this zip code is lower than the state average.
Median resident age:
This zip code:
43.9 years
California median age:
37.9 years
Average household size:
This zip code:
3.1 people
California:
2.8 people
Averages for the 2020 tax year for zip code 91748, filed in 2021:
Average Adjusted Gross Income (AGI) in 2020: $64,028 (Individual Income Tax Returns)
Here:
$64,028
State:
$95,910
Salary/wage: $51,741 (reported on 74.8% of returns)
Here:
$51,741
State:
$77,331
(% of AGI for various income ranges: 1187.2% for AGIs below $25k, 3892.2% for AGIs $25k-50k, 7605.3% for AGIs $50k-75k, 11292.1% for AGIs $75k-100k, 20389.7% for AGIs $100k-200k, 94261.0% for AGIs over 200k)
Taxable interest for individuals: $3,183 (reported on 34.8% of returns)
This zip code:
$3,183
California:
$2,294
(% of AGI for various income ranges: 43.3% for AGIs below $25k, 49.7% for AGIs $25k-50k, 126.1% for AGIs $50k-75k, 161.5% for AGIs $75k-100k, 377.7% for AGIs $100k-200k, 6553.0% for AGIs over 200k)
Ordinary dividends: $5,893 (reported on 19.2% of returns)
Here:
$5,893
State:
$10,949
(% of AGI for various income ranges: 22.3% for AGIs below $25k, 33.0% for AGIs $25k-50k, 82.8% for AGIs $50k-75k, 161.2% for AGIs $75k-100k, 407.3% for AGIs $100k-200k, 7955.5% for AGIs over 200k)
Net capital gain/loss in AGI: +$23,774 (reported on 21.1% of returns)
Here:
+$23,774
State:
+$49,306
(% of AGI for various income ranges: 9.7% for AGIs below $25k, 63.5% for AGIs $25k-50k, 181.4% for AGIs $50k-75k, 403.9% for AGIs $75k-100k, 1289.7% for AGIs $100k-200k, 45413.0% for AGIs over 200k)
Profit/loss from business: +$11,781 (reported on 23.6% of returns)
Here:
+$11,781
State:
+$15,671
(% of AGI for various income ranges: 308.9% for AGIs below $25k, 365.0% for AGIs $25k-50k, 363.4% for AGIs $50k-75k, 372.2% for AGIs $75k-100k, 700.0% for AGIs $100k-200k, 7352.0% for AGIs over 200k)
Taxable individual retirement arrangement distribution: $20,519 (reported on 5.3% of returns)
91748:
$20,519
California:
$23,505
(% of AGI for various income ranges: 37.7% for AGIs below $25k, 58.3% for AGIs $25k-50k, 152.5% for AGIs $50k-75k, 233.2% for AGIs $75k-100k, 730.5% for AGIs $100k-200k, 3733.0% for AGIs over 200k)
Self-employed (Keogh) retirement plans: $17,100 (reported on 0.4% of returns)
91748:
$17,100
California:
$30,163
(% of AGI for various income ranges: 3.2% for AGIs $25k-50k, 33.2% for AGIs $100k-200k, 510.0% for AGIs over 200k)
Total itemized deductions: $34,159 (reported on 10.7% of returns)
Here:
$34,159
State:
$39,517
(% of AGI for various income ranges: 83.0% for AGIs below $25k, 218.7% for AGIs $25k-50k, 541.8% for AGIs $50k-75k, 984.6% for AGIs $75k-100k, 2197.9% for AGIs $100k-200k, 13271.5% for AGIs over 200k)
Charity contributions: $8,037 (reported on 8.1% of returns)
Here:
$8,037
State:
$12,598
(% of AGI for various income ranges: 2.6% for AGIs below $25k, 17.9% for AGIs $25k-50k, 65.0% for AGIs $50k-75k, 125.3% for AGIs $75k-100k, 336.2% for AGIs $100k-200k, 3912.0% for AGIs over 200k)
Taxes paid: $8,745 (reported on 10.7% of returns)
91748:
$8,745
State:
$8,807
(% of AGI for various income ranges: 24.0% for AGIs below $25k, 60.3% for AGIs $25k-50k, 168.0% for AGIs $50k-75k, 306.1% for AGIs $75k-100k, 644.3% for AGIs $100k-200k, 2229.0% for AGIs over 200k)
Earned income credit: $1,760 (reported on 17.2% of returns)
Here:
$1,760
State:
$2,074
(% of AGI for various income ranges: 76.1% for AGIs below $25k, 72.7% for AGIs $25k-50k, 1.5% for AGIs $50k-75k)
Percentage of individuals using paid preparers for their 2020 taxes: 90.7%
Here:
91%
State:
92%
(% for various income ranges: 89.1% for AGIs below $25k, 92.0% for AGIs $25k-50k, 91.4% for AGIs $50k-75k, 91.1% for AGIs $75k-100k, 91.3% for AGIs $100k-200k, 90.8% for AGIs over 200k)
Averages for the 2012 tax year for zip code 91748, filed in 2013:
Average Adjusted Gross Income (AGI) in 2012: $57,672 (Individual Income Tax Returns)
Here:
$57,672
State:
$72,726
Salary/wage: $45,814 (reported on 80.5% of returns)
Here:
$45,814
State:
$59,079
(% of AGI for various income ranges: 74.2% for AGIs below $25k, 82.5% for AGIs $25k-50k, 80.7% for AGIs $50k-75k, 78.0% for AGIs $75k-100k, 77.0% for AGIs $100k-200k, 30.7% for AGIs over 200k)
Taxable interest for individuals: $1,485 (reported on 36.9% of returns)
This zip code:
$1,485
California:
$2,146
(% of AGI for various income ranges: 1.4% for AGIs below $25k, 0.8% for AGIs $25k-50k, 0.9% for AGIs $50k-75k, 0.7% for AGIs $75k-100k, 0.7% for AGIs $100k-200k, 1.1% for AGIs over 200k)
Ordinary dividends: $4,771 (reported on 17.0% of returns)
Here:
$4,771
State:
$9,308
(% of AGI for various income ranges: 1.3% for AGIs below $25k, 0.8% for AGIs $25k-50k, 0.7% for AGIs $50k-75k, 0.9% for AGIs $75k-100k, 1.1% for AGIs $100k-200k, 2.4% for AGIs over 200k)
Net capital gain/loss in AGI: +$9,889 (reported on 16.0% of returns)
Here:
+$9,889
State:
+$30,460
(% of AGI for various income ranges: 0.2% for AGIs $50k-75k, 0.6% for AGIs $75k-100k, 0.6% for AGIs $100k-200k, 8.4% for AGIs over 200k)
Profit/loss from business: +$13,153 (reported on 22.2% of returns)
Here:
+$13,153
State:
+$17,064
(% of AGI for various income ranges: 17.8% for AGIs below $25k, 6.5% for AGIs $25k-50k, 4.7% for AGIs $50k-75k, 3.3% for AGIs $75k-100k, 3.1% for AGIs $100k-200k, 2.5% for AGIs over 200k)
Taxable individual retirement arrangement distribution: $17,084 (reported on 5.3% of returns)
91748:
$17,084
California:
$19,557
(% of AGI for various income ranges: 1.6% for AGIs below $25k, 1.7% for AGIs $25k-50k, 1.6% for AGIs $50k-75k, 2.1% for AGIs $75k-100k, 1.9% for AGIs $100k-200k, 1.1% for AGIs over 200k)
Self-employment retirement plans: $24,120 (reported on 0.5% of returns)
91748:
$24,120
California:
$24,530
(% of AGI for various income ranges: 0.3% for AGIs $50k-75k, 0.2% for AGIs $100k-200k, 0.4% for AGIs over 200k)
Total itemized deductions: $28,661 (27% of AGI, reported on 31.3% of returns)
Here:
$28,661
State:
$34,004
Here:
26.6% of AGI
State:
22.7% of AGI
(% of AGI for various income ranges: 9.8% for AGIs below $25k, 12.9% for AGIs $25k-50k, 18.3% for AGIs $50k-75k, 20.6% for AGIs $75k-100k, 21.0% for AGIs $100k-200k, 12.0% for AGIs over 200k)
Charity contributions: $3,177 (reported on 24.3% of returns)
Here:
$3,177
State:
$4,659
(% of AGI for various income ranges: 0.4% for AGIs below $25k, 1.0% for AGIs $25k-50k, 1.6% for AGIs $50k-75k, 1.8% for AGIs $75k-100k, 2.1% for AGIs $100k-200k, 1.0% for AGIs over 200k)
Taxes paid: $11,698 (reported on 31.2% of returns)
91748:
$11,698
State:
$14,448
(% of AGI for various income ranges: 2.9% for AGIs below $25k, 3.7% for AGIs $25k-50k, 5.8% for AGIs $50k-75k, 7.3% for AGIs $75k-100k, 8.8% for AGIs $100k-200k, 6.9% for AGIs over 200k)
Earned income credit: $1,905 (reported on 22.1% of returns)
Here:
$1,905
State:
$2,286
(% of AGI for various income ranges: 5.9% for AGIs below $25k, 1.2% for AGIs $25k-50k)
Percentage of individuals using paid preparers for their 2012 taxes: 70.2%
Here:
70%
State:
64%
(% for various income ranges: 69.2% for AGIs below $25k, 70.4% for AGIs $25k-50k, 70.7% for AGIs $50k-75k, 71.8% for AGIs $75k-100k, 71.1% for AGIs $100k-200k, 75.9% for AGIs over 200k)
Averages for the 2004 tax year for zip code 91748, filed in 2005:
Average Adjusted Gross Income (AGI) in 2004: $46,228 (Individual Income Tax Returns)
Here:
$46,228
State:
$58,600
Salary/wage: $41,864 (reported on 83.6% of returns)
Here:
$41,864
State:
$49,455
(% of AGI for various income ranges: 564.0% for AGIs below $10k, 79.0% for AGIs $10k-25k, 85.8% for AGIs $25k-50k, 84.2% for AGIs $50k-75k, 83.6% for AGIs $75k-100k, 60.6% for AGIs over 100k)
Taxable interest for individuals: $1,588 (reported on 47.7% of returns)
This zip code:
$1,588
California:
$2,365
(% of AGI for various income ranges: 37.0% for AGIs below $10k, 2.2% for AGIs $10k-25k, 1.2% for AGIs $25k-50k, 1.0% for AGIs $50k-75k, 1.4% for AGIs $75k-100k, 1.7% for AGIs over 100k)
Taxable dividends: $2,839 (reported on 19.6% of returns)
Here:
$2,839
State:
$4,746
(% of AGI for various income ranges: 13.8% for AGIs below $10k, 0.8% for AGIs $10k-25k, 0.5% for AGIs $25k-50k, 0.5% for AGIs $50k-75k, 0.9% for AGIs $75k-100k, 1.8% for AGIs over 100k)
Net capital gain/loss: +$12,974 (reported on 19.1% of returns)
Here:
+$12,974
State:
+$23,418
(% of AGI for various income ranges: -10.8% for AGIs below $10k, -0.2% for AGIs $10k-25k, 0.3% for AGIs $25k-50k, 0.8% for AGIs $50k-75k, 1.6% for AGIs $75k-100k, 11.8% for AGIs over 100k)
Profit/loss from business: +$13,902 (reported on 20.2% of returns)
Here:
+$13,902
State:
+$16,826
(% of AGI for various income ranges: 87.1% for AGIs below $10k, 11.7% for AGIs $10k-25k, 6.8% for AGIs $25k-50k, 5.1% for AGIs $50k-75k, 3.6% for AGIs $75k-100k, 4.9% for AGIs over 100k)
IRA payment deduction: $3,788 (reported on 5.9% of returns)
91748:
$3,788
California:
$3,192
(% of AGI for various income ranges: 1.8% for AGIs below $10k, 0.5% for AGIs $10k-25k, 0.8% for AGIs $25k-50k, 0.6% for AGIs $50k-75k, 0.5% for AGIs $75k-100k, 0.3% for AGIs over 100k)
Self-employed pension: $19,895 (reported on 0.9% of returns)
Here:
$19,895
California:
$17,688
(% of AGI for various income ranges: 0.1% for AGIs $10k-25k, 0.1% for AGIs $25k-50k, 0.2% for AGIs $50k-75k, 0.2% for AGIs $75k-100k, 0.7% for AGIs over 100k)
Total itemized deductions: $24,882 (28% of AGI, reported on 38.1% of returns)
Here:
$24,882
State:
$28,113
Here:
28.4% of AGI
State:
25.3% of AGI
(% of AGI for various income ranges: 88.2% for AGIs below $10k, 13.2% for AGIs $10k-25k, 18.3% for AGIs $25k-50k, 23.5% for AGIs $50k-75k, 24.7% for AGIs $75k-100k, 20.2% for AGIs over 100k)
Charity contributions deductions: $3,148 (3% of AGI, reported on 31.5% of returns)
Here:
$3,148
State:
$3,923
Here:
3.4% of AGI
State:
3.3% of AGI
(% of AGI for various income ranges: 2.5% for AGIs below $10k, 0.9% for AGIs $10k-25k, 1.5% for AGIs $25k-50k, 2.6% for AGIs $50k-75k, 2.6% for AGIs $75k-100k, 2.4% for AGIs over 100k)
Total tax: $7,278 (reported on 73.2% of returns)
91748:
$7,278
State:
$10,761
(% of AGI for various income ranges: 25.1% for AGIs below $10k, 4.6% for AGIs $10k-25k, 6.3% for AGIs $25k-50k, 8.0% for AGIs $50k-75k, 9.1% for AGIs $75k-100k, 17.3% for AGIs over 100k)
Earned income credit: $1,594 (reported on 17.5% of returns)
Here:
$1,594
State:
$1,763
Percentage of individuals using paid preparers for their 2004 taxes: 68.8%
Here:
69%
State:
66%
(% for various income ranges: 63.3% for AGIs below $10k, 68.8% for AGIs $10k-25k, 70.1% for AGIs $25k-50k, 71.7% for AGIs $50k-75k, 70.2% for AGIs $75k-100k, 72.9% for AGIs over 100k)
Likely homosexual households (counted as self-reported same-sex unmarried-partner households)
Lesbian couples: 0.1% of all households
Gay men: 0.0% of all households
Household received Food Stamps/SNAP in the past 12 months: 1,076 Household did not receive Food Stamps/SNAP in the past 12 months: 12,669
Women who had a birth in the past 12 months: 283 (235 now married, 47 unmarried) Women who did not have a birth in the past 12 months: 9,342 (3,814 now married, 5,523 unmarried)
Housing units in zip code 91748 with a mortgage: 5,279 (420 second mortgage, 22 home equity loan, 344 both second mortgage and home equity loan) Houses without a mortgage: 118
Median monthly owner costs for units with a mortgage: $2,667 Median monthly owner costs for units without a mortgage: $838
Residents with income below the poverty level in 2022:
This zip code:
10.1%
Whole state:
12.2%
Residents with income below 50% of the poverty level in 2022:
This zip code:
4.5%
Whole state:
6.2%
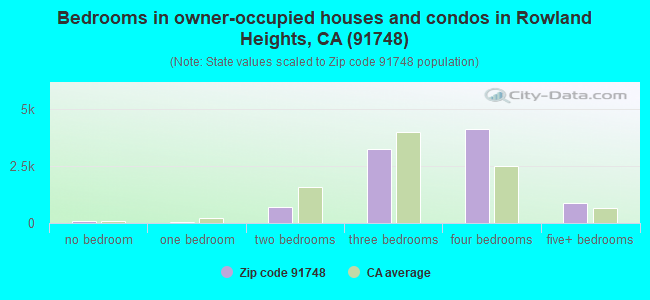
Median number of rooms in houses and condos:
Here:
5.9
State:
6.0
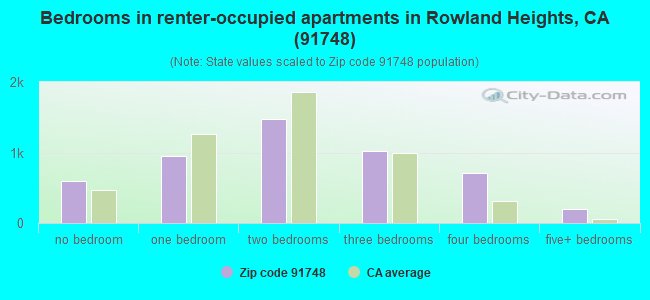
Median number of rooms in apartments:
Here:
4.0
State:
3.9
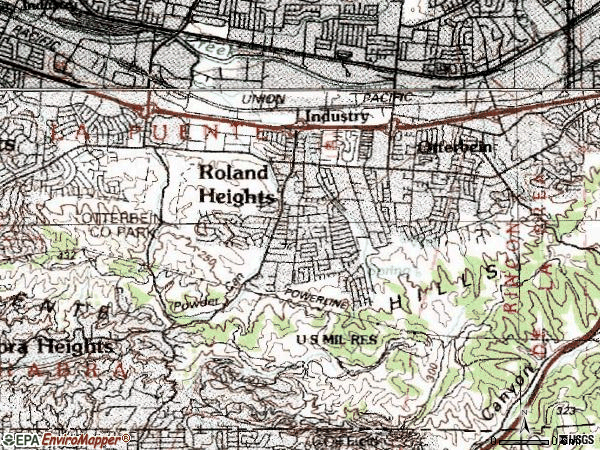
Notable locations in this zip code not listed on our city pages
Notable locations in zip code 91748: Fallon (A), Grazide Ranch (B), Los Angeles County Fire Department Station 145 (C). Display/hide their locations on the map
Shopping Centers: Rowland Heights Plaza Shopping Center (1), Canyon Point Marketplace Shopping Center (2), The Plaza at Puente Hills Shopping Center (3), Ross Plaza Shopping Center (4), Puenta Hills Mall Shopping Center (5), Puente Hills East Shopping Center (6), Fairway Plaza Shopping Center (7), Eastwood Village Shopping Center (8). Display/hide their locations on the map
Parks in zip code 91748 include: Carolyn Rosas Park (1), Gloria Heer Park (2), Rowland Heights Park (3), Schabarum Regional Park (4), Trailview Park (5). Display/hide their locations on the map
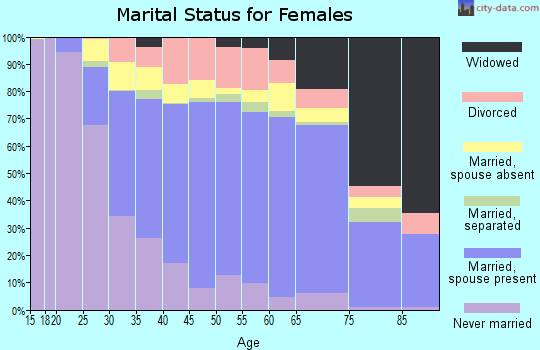
4,221 married couples with children.
1,668 single-parent households (351 men, 1,317 women).
24.1% of residents of 91748 zip code speak English at home.
21.3% of residents speak Spanish at home (53% very well, 26% well, 17% not well, 4% not at all).
1.6% of residents speak other Indo-European language at home (79% very well, 18% well, 3% not well).
53.0% of residents speak Asian or Pacific Island language at home (37% very well, 30% well, 24% not well, 9% not at all).
0.4% of residents speak other language at home (74% very well, 19% well, 7% not well).
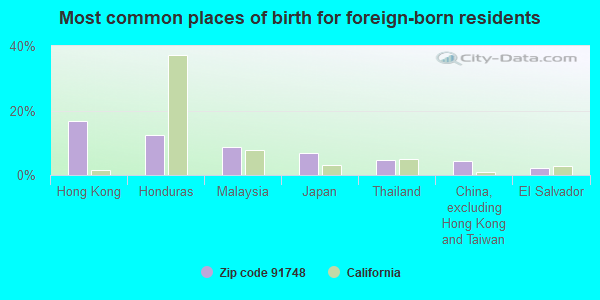
Foreign born population: 24,281 (55.8%) (62.9% of them are naturalized citizens)
This zip code:
55.8%
Whole state:
26.7%
17%Hong Kong
12%Honduras
9%Malaysia
7%Japan
5%Thailand
4%China, excluding Hong Kong and Taiwan
2%El Salvador
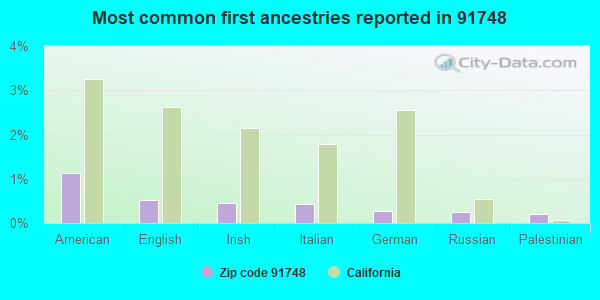
1%American
1%English
0%Irish
0%Italian
0%German
0%Russian
0%Palestinian
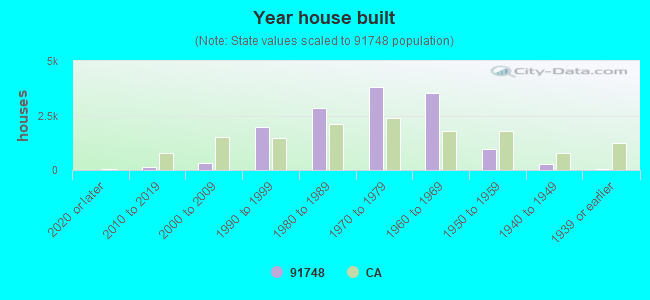
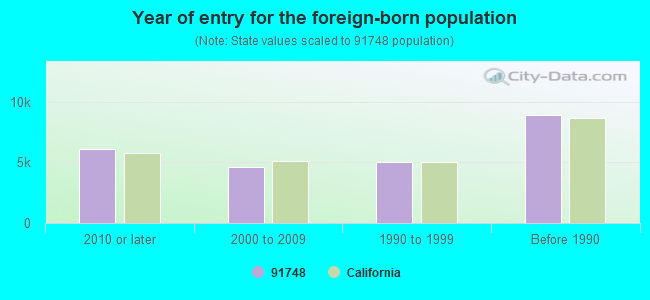
Year of entry for the foreign-born population
6,0802010 or later
4,5832000 to 2009
5,0601990 to 1999
8,899Before 1990
Major facilities with environmental interests located in this zip code:
CARRIER CORPORATION (855 ANAHEIM PUENTE ROAD in ROWLAND HEIGHTS, CA)
STATE MASTER (California - Hazardous Waste Tracking) - HAZARDOU WASTE PROGRAM (Integrated Compliance Information System) - ICIS-09-2001-0153, FORMAL ENFORCEMENT ACTION, ICIS-09-2005-0129, ENFORCEMENT/COMPLIANCE ACTIVITY CRITERIA AND HAZARDOUS AIR POLLUTANT INVENTORY (Inventory of air pollution sources) HAZARDOUS WASTE BIENNIAL REPORTER (Resource Conservation and Recovery Act (tracking hazardous waste)) Large Quantity Generators, more that 1000 kg of hazardous waste/month (Resource Conservation and Recovery Act (tracking hazardous waste)) TRI REPORTER (Tracking of toxic chemicals releasing facilities) Business SIC classification: AIR-CONDITIONING AND WARM AIR HEATING EQUIPMENT AND COMMERCIAL AND INDUSTRIAL REFRIGERATION EQUIPMENT Alternative names: BDP CO DIV OF CARRIER CORP, CARRIER CORPORATION BDP COMPAN
KION PRINTING INCORPORATED (18130 ROWLAND ST in CITY OF INDUSTRY, CA)
AIR MAJOR (AIRS/AFS) STATE MASTER (California - Hazardous Waste Tracking) - HAZARDOU WASTE PROGRAM CRITERIA AND HAZARDOUS AIR POLLUTANT INVENTORY (Inventory of air pollution sources) HAZARDOUS WASTE BIENNIAL REPORTER (Resource Conservation and Recovery Act (tracking hazardous waste)) Large Quantity Generators, more that 1000 kg of hazardous waste/month (Resource Conservation and Recovery Act (tracking hazardous waste)) TRI REPORTER (Tracking of toxic chemicals releasing facilities) Business SIC classification: COMMERCIAL PRINTING, LITHOGRAPHIC Organizations: VICTOR LAU (CONTACT/OPERATOR)
, ALEXANDER CHU (CONTACT/OWNER)
KING MACHINERY, INC. (1110 FULLERTON RD in INDUSTRY, CA)
ENFORCEMENT/COMPLIANCE ACTIVITY (Integrated Compliance Information System) - ICIS-HQ-2002-0618, FORMAL ENFORCEMENT ACTION (Integrated Compliance Information System) - ICIS-HQ-2002-0618, FORMAL ENFORCEMENT ACTION Business SIC classification: CONSTRUCTION AND MINING (EXCEPT PETROLEUM) MACHINERY AND EQUIPMENT
CDI TORQUE PRODUCTS (19220 SAN JOSE AVENUE in CITY OF INDUSTRY, CA)
STATE MASTER (California - Hazardous Waste Tracking) - HAZARDOU WASTE PROGRAM CRITERIA AND HAZARDOUS AIR POLLUTANT INVENTORY (Inventory of air pollution sources) HAZARDOUS WASTE BIENNIAL REPORTER (Resource Conservation and Recovery Act (tracking hazardous waste)) Large Quantity Generators, more that 1000 kg of hazardous waste/month (Resource Conservation and Recovery Act (tracking hazardous waste)) Business SIC classification: HAND AND EDGE TOOLS, EXCEPT MACHINE TOOLS AND HANDSAWS Business NAICS classification: HAND AND EDGE TOOL MANUFACTURING. Alternative names: CONSOLIDATED DEVICES INC
C M E METAL FORMING (19433 SAN JOSE AVE in CITY OF INDUSTRY, CA)
STATE MASTER (California - Hazardous Waste Tracking) - HAZARDOU WASTE PROGRAM Large Quantity Generators, more that 1000 kg of hazardous waste/month (Resource Conservation and Recovery Act (tracking hazardous waste)) - notification Organizations: DAVE JANES SR (CONTACT/OWNER)
HOLIDAY PRINTING (1034 LAWSON in CITY OF INDUSTRY, CA)
STATE MASTER (California - Hazardous Waste Tracking) - HAZARDOU WASTE PROGRAM CRITERIA AND HAZARDOUS AIR POLLUTANT INVENTORY (Inventory of air pollution sources) Small Quantity Generators, between 100 kg and 1000 kg of hazardous waste/month (Resource Conservation and Recovery Act (tracking hazardous waste)) - notification Business SIC classification: COMMERCIAL PRINTING, LITHOGRAPHIC Business NAICS classification: COMMERCIAL LITHOGRAPHIC PRINTING. Organizations: DOMINION PROPERTYS (CONTACT/OWNER)
CAL SNAP & TAB CORP (1210 FULLERTON RD in CITY OF INDUSTRY, CA)
STATE MASTER (California - Hazardous Waste Tracking) - HAZARDOU WASTE PROGRAM Small Quantity Generators, between 100 kg and 1000 kg of hazardous waste/month (Resource Conservation and Recovery Act (tracking hazardous waste)) - notification Organizations: FRANK R KERSHNER (CONTACT/OWNER)
CHEVRON STATION NO 98442 (19004 COLIMA RD in ROWLAND HEIGHTS, CA)
STATE MASTER (California - Hazardous Waste Tracking) - HAZARDOU WASTE PROGRAM Small Quantity Generators, between 100 kg and 1000 kg of hazardous waste/month (Resource Conservation and Recovery Act (tracking hazardous waste)) - notification Organizations: CHEVRON PRODUCTS CO (CONTACT/OWNER)
CALIFORNIA HYDRO FORMING (850 S LAWSON in CITY OF INDUSTRY, CA)
STATE MASTER (California - Hazardous Waste Tracking) - HAZARDOU WASTE PROGRAM Small Quantity Generators, between 100 kg and 1000 kg of hazardous waste/month (Resource Conservation and Recovery Act (tracking hazardous waste)) - notification Organizations: CALIFORNIA HYDROFORMING CO INC (CONTACT/OWNER)
AAF INTL (18856 SAN JOSE AVE in CITY OF INDUSTRY, CA)
(Integrated Compliance Information System) - ICIS-09-1998-0151, FORMAL ENFORCEMENT ACTION COMPLIANCE ACTIVITY (Tracking inspections of insecticide, fungicide, and rodenticide, and toxic substances)
FARJARDO ELEMENTARY (18550 E. FARJARDO in ROWLAND HEIGHTS, CA)
(National Center for Education Statistics) - STATE ID-6022230 Organizations: ROWLAND UNIFIED (SCHOOL DISTRICT)
ECOLAB INC. (18383 EAST RAILROAD STREET in LA PUENTE, CA)
COMPLIANCE ACTIVITY (Tracking inspections of insecticide, fungicide, and rodenticide, and toxic substances) CRITERIA AND HAZARDOUS AIR POLLUTANT INVENTORY (Inventory of air pollution sources) Small Quantity Generators, between 100 kg and 1000 kg of hazardous waste/month (Resource Conservation and Recovery Act (tracking hazardous waste)) TRI REPORTER (Tracking of toxic chemicals releasing facilities) Business SIC classification: SOAP AND OTHER DETERGENTS, EXCEPT SPECIALTY CLEANERS; SPECIALTY CLEANING, POLISHING, AND SANITATION PREPARATIONS Business NAICS classification: SOAP AND OTHER DETERGENT MANUFACTURING.; SOAP AND OTHER DETERGENT MANUFACTURING.; POLISH AND OTHER SANITATION GOOD MANUFACTURING. Organizations: ECONOMICS LABORATORY INC (CONTACT/OPERATOR)
Alternative names: CAMCO CHEMICAL CO, ELF ATOCHEM N A AT CAMCO, ELF ATOCHEM N A AT CAMCO CHEMICAL
JELLICK ELEMENTARY (1400 S. JELLICK AVE. in ROWLAND HEIGHTS, CA)
(National Center for Education Statistics) - STATE ID-6022297 Organizations: ROWLAND UNIFIED (SCHOOL DISTRICT)
Housing units lacking complete kitchen facilities: 1.4%
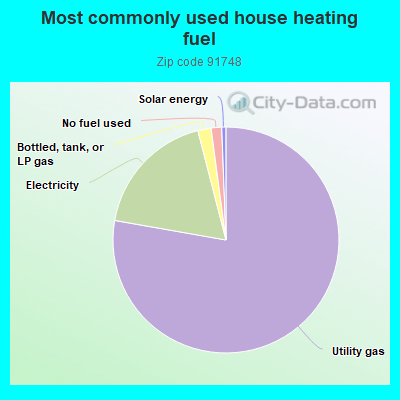
77.7%Utility gas
18.2%Electricity
1.9%Bottled, tank, or LP gas
1.5%No fuel used
0.6%Solar energy
Population in 1990: 40,511. Population change in the 1990s: +5,813 (+14.3%).
Place of birth for U.S.-born residents:
This state: 17,279
Northeast: 394
Midwest: 574
South: 602
West: 276
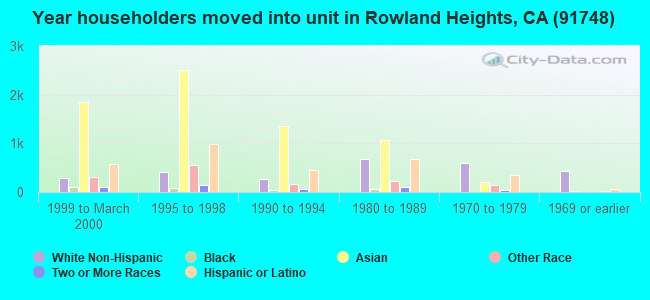
58% of the 91748 zip code residents lived in the same house 5 years ago. Out of people who lived in different houses, 75% lived in this county. Out of people who lived in different counties, 50% lived in California.
94% of the 91748 zip code residents lived in the same house 1 year ago. Out of people who lived in different houses, 68% moved from this county. Out of people who lived in different houses, 9% moved from different county within same state. Out of people who lived in different houses, 14% moved from different state. Out of people who lived in different houses, 14% moved from abroad.
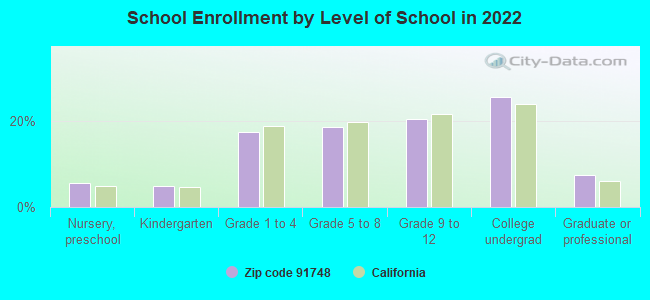
Private vs. public school enrollment:
Students in private schools in grades 1 to 8 (elementary and middle school): 153
Here:
4.6%
California:
10.5%
Students in private schools in grades 9 to 12 (high school): 225
Here:
11.7%
California:
8.5%
Students in private undergraduate colleges: 407
Here:
16.8%
California:
15.9%
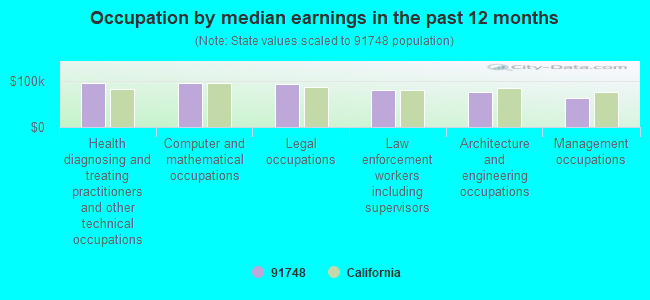
Occupation by median earnings in the past 12 months ($)
96,656Health diagnosing and treating practitioners and other technical occupations
95,834Computer and mathematical occupations
93,662Legal occupations
82,182Law enforcement workers including supervisors
77,652Architecture and engineering occupations
63,030Management occupations
Companies with biggest federal contracts located in this zip code:
HEARTLAND FARMS (17851 RAILROAD ST in CITY OF INDUST, CA; small business) : $8,973,985 in 25 contractsfrom 2002 to 2006
Contracts for Food Items For Resale, Beverages, Nonalcoholic, Dairy Foods and Eggs by Defense Commissary Agency, Defense Logistics Agency Signed by year:2000: $0; 2001: $0; 2002: $0; 2003: $0; 2004: $1,986,698; 2005: $4,800,804; 2006: $2,186,483.
Biggest contracts:
$2,138,739 with Defense Commissary Agency for Food Items For Resale. Signed on 2006-01-01. Completion date: 2006-03-31.
$2,121,833, same as above.Signed on 2005-04-01. Completion date: 2005-08-31.
$1,986,698, same as above.Signed on 2004-10-01. Completion date: 2005-02-28.
$1,328,881, same as above.Signed on 2005-10-01. Completion date: 2005-12-31.
ASTRO SPAR INC (1121 FULLERTON RD in CITY OF INDUST, CA; small business) : $1,383,649 in 13 contractsfrom 2000 to 2006
Contracts for Airframe Structural Components by Air Force, Defense Logistics Agency Signed by year:2000: $35,900; 2001: $607,688; 2002: $0; 2003: $0; 2004: $385,627; 2005: $171,713; 2006: $182,721.
Biggest contracts:
$360,188 with Air Force for Airframe Structural Components. Signed on 2001-09-26. Completion date: 2002-04-12.
$238,717 with Defense Logistics Agency for Airframe Structural Components. Signed on 2004-09-03. Completion date: 2004-09-25.
$218,500, same as above.Signed on 2001-05-04. Completion date: 2002-02-22.
$147,600, same as above.Signed on 2006-05-11. Completion date: 2007-08-04.
CROWN PRINCE INC (18581 RAILROAD ST in CITY OF INDUST, CA; small business) : $702,866 in 5 contractsfrom 2004 to 2005
Contracts for Food Items For Resale by Defense Commissary Agency Signed by year:2000: $0; 2001: $0; 2002: $0; 2003: $0; 2004: $204,019; 2005: $498,847; 2006: $0.
Biggest contracts:
$219,500 with Defense Commissary Agency for Food Items For Resale. Signed on 2005-04-01. Completion date: 2005-08-31.
$204,019, same as above.Signed on 2004-10-01. Completion date: 2005-02-28.
$137,635, same as above.Signed on 2005-10-01. Completion date: 2005-12-31.
$94,340, same as above.Signed on 2005-01-01. Completion date: 2005-03-31.
THE MONADNOCK COMPANY (18301 E ARENTH in ROWLAND HEIGHT, CA; small business) : $342,775 in 10 contractsfrom 2000 to 2006
Contracts for Rivets, Fastening Device, Screws, Nuts and Washers, and moreby Defense Logistics Agency Signed by year:2000: $86,750; 2001: $138,361; 2002: $30,967; 2003: $0; 2004: $81,888; 2005: $0; 2006: $4,809.
Biggest contracts:
$77,517 with Defense Logistics Agency for Rivets. Signed on 2001-02-16. Completion date: 2001-06-21.
$73,300 with Defense Logistics Agency for Fastening Device. Signed on 2004-07-26. Completion date: 2004-08-09.
$30,967, same as above.Signed on 2002-04-12. Completion date: 2002-08-10.
$30,422 with Defense Logistics Agency for Screws. Signed on 2001-11-17. Completion date: 2002-09-11.
ADTECH OPTICS INC (18007 CORTNEY CT in CITY OF INDUST, CA; small business) : $149,738 in 2 contractsfrom 2005 to 2006
$99,912 with Air Force for Defense Aircraft -- Basic Research (R&D). Signed on 2006-05-03. Completion date: 2007-02-05.
$49,826 with NASA for Aeronautics and Space Technology -- Advanced Development (R&D). Signed on 2005-09-15. Completion date: 2005-10-26.
COAST CRANE COMPANY (19062 SAN JOSE AVE in CITY OF INDUST, CA) : $133,244 in 15 contractsfrom 2002 to 2005
Contracts for Maintenance, Repair and Rebuilding of Equipment -- Weapons, Installation of Equipment -- Engine Accessories, Maintenance, Repair and Rebuilding of Equipment -- Special Industry Machinery, Modification of Equipment -- Special Industry Machinery, and moreby Navy, Army Signed by year:2000: $0; 2001: $0; 2002: $18,072; 2003: $64,705; 2004: $38,295; 2005: $12,172; 2006: $0.
Biggest contracts:
$41,288 with Navy for Maintenance, Repair and Rebuilding of Equipment -- Weapons. Signed on 2003-08-21. Completion date: 2003-10-10.
$24,859 with Navy for Installation of Equipment -- Engine Accessories. Signed on 2004-03-10. Completion date: 2004-06-01.
$12,172 with Navy for Maintenance, Repair and Rebuilding of Equipment -- Special Industry Machinery. Signed on 2005-07-12. Completion date: 2005-07-18.
$11,297 with Navy for Modification of Equipment -- Special Industry Machinery. Signed on 2002-12-18. Completion date: 2003-02-28.
DARNELL CORPORATION (17915 RAILROAD ST in CITY OF INDUST, CA; small business)
$75,294 with Navy for Miscellaneous Materials Handling Equipment. Signed on 2002-02-22. Completion date: 2003-02-22.
EINUX SYSTEMS, LLC (17837 ROWLAND STREET in CITY OF INDUST, CA; small business)
$74,374 with Air Force for ADP Support Equipment. Signed on 2003-05-02. Completion date: 2003-06-30.
SEA SHIELD MARINE PRODUCTS INC (17907 ARENTH AVE in CITY OF INDUST, CA; small business) 500 employees, $0 revenue. : $37,509 in 7 contractsfrom 2005 to 2006
Contracts for Hardware, Weapon System by Defense Logistics Agency Signed by year:2000: $0; 2001: $0; 2002: $0; 2003: $0; 2004: $0; 2005: $18,158; 2006: $19,351.
Biggest contracts:
$8,659 with Defense Logistics Agency for Hardware, Weapon System. Signed on 2006-03-16. Completion date: 2006-04-17.
$5,346, same as above.Signed on 2006-04-13. Completion date: 2006-06-13.
$5,346, same as above.Signed on 2006-06-28. Completion date: 2006-08-28.
$5,249, same as above.Signed on 2005-10-08. Completion date: 2005-12-12.
TELEDYNE INSTRUMENTS, INC (16830 CHESTNUT ST in CITY OF INDUST, CA; small business) : $28,695 in 4 contractsin 2005
$19,675 with Army for Miscellaneous Power Transmission Equipment. Taking place in MI. Signed on 2005-09-26. Completion date: 2005-11-11.
$7,475 with Navy for Synchros and Resolvers. Signed on 2005-09-08. Completion date: 2005-11-10.
$1,545, same as above.Signed on 2005-12-01. Completion date: 2005-12-01.
$0, same as above.Signed on 2005-12-01. Completion date: 2005-12-01.
Top industries in this zip code by the number of employees in 2005:

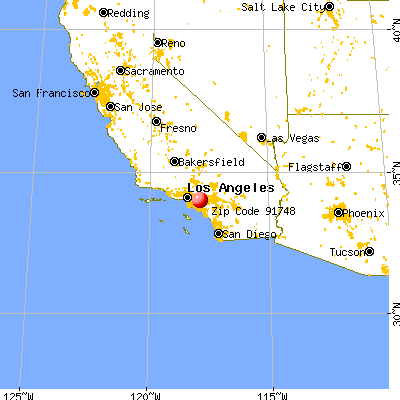


 Nearest zip codes: 91792, 92821, 90631, 91789, 91744, 92835.