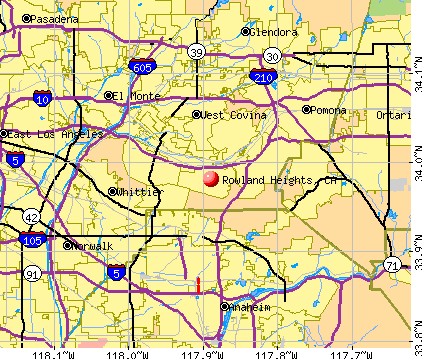
Rowland Heights, California
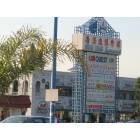
Rowland Heights: Colima Blvd.
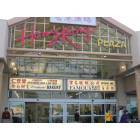
Rowland Heights: Hong Kong Plaza
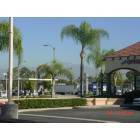
Rowland Heights: Looking across towards Puent Hills Mall from outside Taco Bell
- add
your
Submit your own pictures of this place and show them to the world
- OSM Map
- General Map
- Google Map
- MSN Map
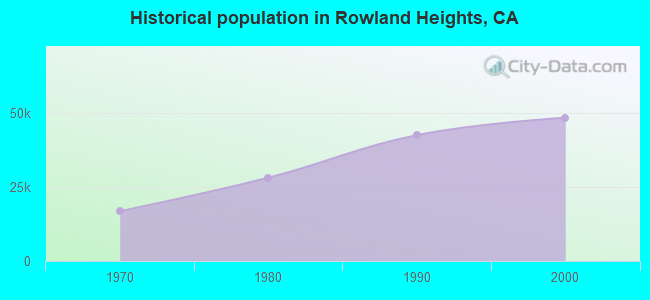
Population change since 2000: +0.9%
| Males: 24,194 | |
| Females: 24,799 |
| Median resident age: | 44.9 years |
| California median age: | 37.9 years |
Zip codes: 91748.
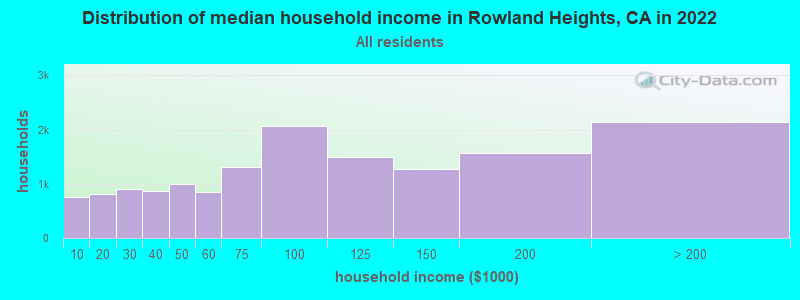
| Rowland Heights: | $84,921 |
| CA: | $91,551 |
Estimated per capita income in 2022: $38,014 (it was $19,315 in 2000)
Rowland Heights CDP income, earnings, and wages data
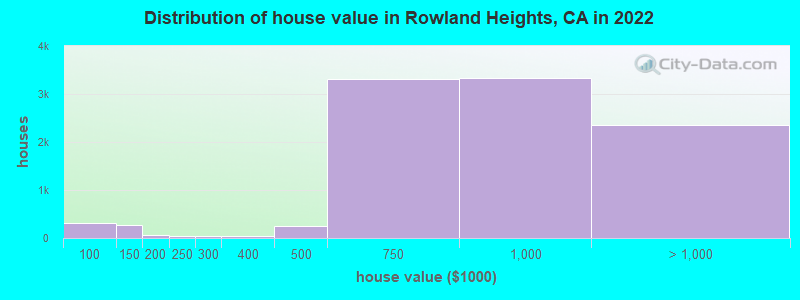
Estimated median house or condo value in 2022: $832,886 (it was $209,600 in 2000)
| Rowland Heights: | $832,886 |
| CA: | $715,900 |
Mean prices in 2022: all housing units: $909,355; detached houses: $932,574; townhouses or other attached units: $692,951; in 3-to-4-unit structures: $878,426; in 5-or-more-unit structures: over $1,000,000; mobile homes: $90,529
Median gross rent in 2022: $1,868.
Rowland Heights, CA residents, houses, and apartments details
(10.2% for White Non-Hispanic residents, 25.1% for Black residents, 11.0% for Hispanic or Latino residents, 6.8% for American Indian residents, 14.3% for other race residents, 6.8% for two or more races residents)
Detailed information about poverty and poor residents in Rowland Heights, CA


Compare current foreclosures near Rowland Heights, CA:
| Photo | Address | Area | Beds / Baths | Price | Details |
|---|---|---|---|---|---|

|
#1
Granby Pl
Rowland Heights, CA 91748
|
2,358 sq. feet
|
3 baths 5 beds |
show details | |

|
#2
Pilario St
Rowland Heights, CA 91748
|
1,602 sq. feet
|
2 baths 5 beds |
show details | |

|
#3
Klum Pl
Rowland Heights, CA 91748
|
1,538 sq. feet
|
2 baths 4 beds |
show details | |

|
#4
Rainer Ave
Rowland Heights, CA 91748
|
1,532 sq. feet
|
3 baths 3 beds |
show details | |

|
#5
Custoza Ave
Rowland Heights, CA 91748
|
1,603 sq. feet
|
2 baths 4 beds |
show details | |

|
#6
Andrada Dr
Rowland Heights, CA 91748
|
1,175 sq. feet
|
2 baths 4 beds |
show details | |

|
#7
Lerona Ave
Rowland Heights, CA 91748
|
1,858 sq. feet
|
3 baths 4 beds |
show details | |

|
#8
Searls Dr
Rowland Heights, CA 91748
|
1,288 sq. feet
|
2 baths 4 beds |
show details | |

|
#9
Gallio Ave
Rowland Heights, CA 91748
|
1,420 sq. feet
|
2 baths 3 beds |
show details | |

|
#10
Aguiro St
Rowland Heights, CA 91748
|
1,120 sq. feet
|
2 baths 3 beds |
show details |
| Photo | Address | Area | Beds / Baths | Price | Details |
|---|---|---|---|---|---|

|
#11
Bellorita St
Rowland Heights, CA 91748
|
1,120 sq. feet
|
2 baths 3 beds |
show details | |

|
#12
Springport Dr
Rowland Heights, CA 91748
|
1,606 sq. feet
|
3 baths 4 beds |
show details | |

|
#13
Aguiro St
Rowland Heights, CA 91748
|
1,219 sq. feet
|
2 baths 3 beds |
show details | |

|
#14
Kingsmill Ave
Rowland Heights, CA 91748
|
1,088 sq. feet
|
2 baths 3 beds |
show details | |

|
#15
Avenida Del Canada
Rowland Heights, CA 91748
|
- sq. feet
|
- baths - beds |
show details | |

|
#16
La Cueva Dr Apt 2
Rowland Heights, CA 91748
|
- sq. feet
|
- baths - beds |
show details | |

|
#17
Rowland St
Rowland Heights, CA 91748
|
- sq. feet
|
- baths - beds |
show details | |

|
#18
E Walnut Dr N Ste B
Rowland Heights, CA 91748
|
- sq. feet
|
- baths - beds |
show details | |

|
#19
Colima Rd Apt 21
Rowland Heights, CA 91748
|
- sq. feet
|
- baths - beds |
show details | |

|
#20
E G St
Ontario, CA 91764
|
1,036 sq. feet
|
1 baths 3 beds |
$577,200
|
show details |
| Photo | Address | Area | Beds / Baths | Price | Details |
|---|---|---|---|---|---|

|
#21
Hawkstone Ave
Whittier, CA 90605
|
1,444 sq. feet
|
2 baths 4 beds |
$674,900
|
show details |

|
#22
Millbury Ave
Baldwin Park, CA 91706
|
1,632 sq. feet
|
2 baths 4 beds |
$869,000
|
show details |

|
#23
E Norma Ave
West Covina, CA 91791
|
1,134 sq. feet
|
2 baths 3 beds |
$599,000
|
show details |

|
#24
Rowland St
Rowland Heights, CA 91748
|
- sq. feet
|
- baths - beds |
show details | |

|
#25
E Holton St
West Covina, CA 91791
|
- sq. feet
|
2 baths 3 beds |
$450,000
|
show details |

|
#26
Norwalk Blvd Apt
Hawaiian Gardens, CA 90716
|
800 sq. feet
|
2 baths 1 beds |
show details | |

|
#27
Bohlig Rd Apt 45
Los Angeles, CA 90032
|
813 sq. feet
|
2 baths 2 beds |
show details | |

|
#28
Apple Court
Upland, CA 91786
|
1,655 sq. feet
|
2 baths 2 beds |
show details | |

|
#29
Celebration St
Chino, CA 91708
|
1,644 sq. feet
|
2 baths 3 beds |
show details | |

|
#30
E Jackson Ave Unit C
Anaheim, CA 92806
|
1,266 sq. feet
|
2 baths 3 beds |
show details |
| Photo | Address | Area | Beds / Baths | Price | Details |
|---|---|---|---|---|---|

|
#31
Elburg St Unit A
Paramount, CA 90723
|
1,131 sq. feet
|
2 baths 3 beds |
show details | |

|
#32
Dunrobin Ave
Downey, CA 90242
|
3,000 sq. feet
|
4 baths 8 beds |
show details | |

|
#33
And 6111 Northside Drive
Los Angeles, CA 90022
|
1,329 sq. feet
|
4 baths 3 beds |
show details | |

|
#34
Van Wig Ave
Baldwin Park, CA 91706
|
1,330 sq. feet
|
2 baths 3 beds |
show details | |

|
#35
W 4th St
Ontario, CA 91762
|
1,248 sq. feet
|
2 baths 3 beds |
show details | |

|
#36
Mac Duff St
Garden Grove, CA 92841
|
1,197 sq. feet
|
2 baths 4 beds |
show details | |

|
#37
Hunter Rd
Chino Hills, CA 91709
|
2,360 sq. feet
|
2 baths 3 beds |
show details | |

|
#38
Lander Cir
Claremont, CA 91711
|
1,469 sq. feet
|
2 baths 3 beds |
show details | |

|
#39
Denison St
Pomona, CA 91766
|
1,157 sq. feet
|
1 baths 4 beds |
show details | |

|
#40
Downey Ave
Downey, CA 90241
|
3,162 sq. feet
|
4 baths 8 beds |
show details |
| Photo | Address | Area | Beds / Baths | Price | Details |
|---|---|---|---|---|---|

|
#41
Centralia St Unit 94
Lakewood, CA 90715
|
1,056 sq. feet
|
1 baths 2 beds |
show details | |

|
#42
Parise Dr
Whittier, CA 90604
|
1,198 sq. feet
|
2 baths 3 beds |
show details | |

|
#43
Basetdale Ave
La Puente, CA 91746
|
1,328 sq. feet
|
2 baths 4 beds |
show details | |

|
#44
E Benbow St
Covina, CA 91722
|
1,514 sq. feet
|
2 baths 4 beds |
show details | |

|
#45
E Edna Pl
Covina, CA 91722
|
1,440 sq. feet
|
2 baths 4 beds |
show details | |

|
#46
Meadow View Dr
Pomona, CA 91766
|
1,538 sq. feet
|
2 baths 4 beds |
show details | |

|
#47
E Merion St
Ontario, CA 91761
|
2,220 sq. feet
|
2 baths 4 beds |
show details | |

|
#48
Skyview Cir
Pomona, CA 91766
|
2,060 sq. feet
|
3 baths 4 beds |
show details | |

|
#49
Ocana Ave
Bellflower, CA 90706
|
1,218 sq. feet
|
2 baths 3 beds |
show details | |

|
Check over 1 million property listings on Foreclosure.com!
|
browse all offers | |||


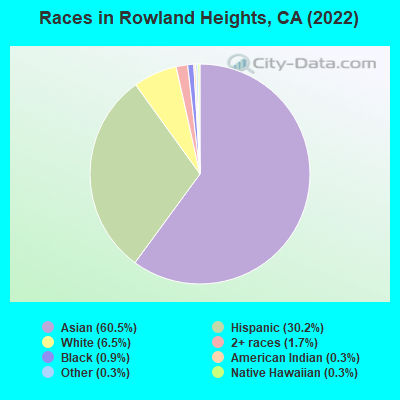
- 27,92460.5%Asian alone
- 13,96530.2%Hispanic
- 3,0086.5%White alone
- 8001.7%Two or more races
- 4240.9%Black alone
- 1490.3%American Indian alone
- 1170.3%Native Hawaiian and Other
Pacific Islander alone - 1240.3%Other race alone
According to our research of California and other state lists, there were 32 registered sex offenders living in Rowland Heights, California as of April 27, 2024.
The ratio of all residents to sex offenders in Rowland Heights is 1,584 to 1.
The ratio of registered sex offenders to all residents in this city is lower than the state average.
 Recent articles from our blog. Our writers, many of them Ph.D. graduates or candidates, create easy-to-read articles on a wide variety of topics.


Latest news from Rowland Heights, CA collected exclusively by city-data.com from local newspapers, TV, and radio stations
Ancestries: American (1.1%).
Current Local Time: PST time zone
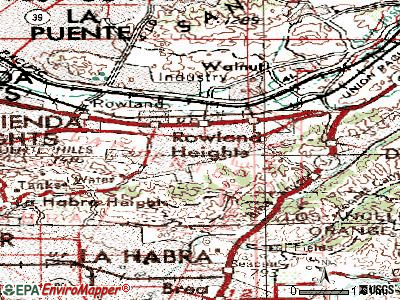
Elevation: 540 feet
Land area: 9.02 square miles.
Population density: 5,429 people per square mile (average).
25,304 residents are foreign born (44.1% Asia, 10.2% Latin America).
| This place: | 54.8% |
| California: | 26.5% |
Median real estate property taxes paid for housing units with mortgages in 2022: $6,875 (0.8%)
Median real estate property taxes paid for housing units with no mortgage in 2022: $5,145 (0.7%)
Nearest city with pop. 50,000+: Diamond Bar, CA  (4.2 miles , pop. 56,287).
Nearest city with pop. 200,000+: East San Gabriel Valley, CA (6.3 miles , pop. 933,557).
Nearest city with pop. 1,000,000+: Los Angeles, CA (28.8 miles , pop. 3,694,820).
Nearest cities:
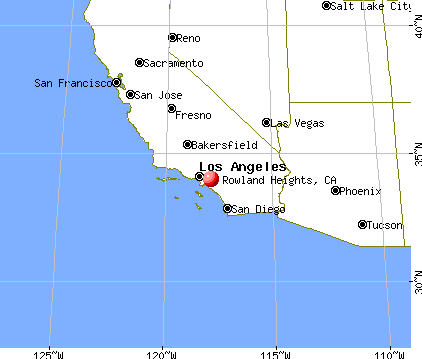
), ), ), Latitude: 33.98 N, Longitude: 117.89 W
Daytime population change due to commuting: -11,205 (-24.3%)
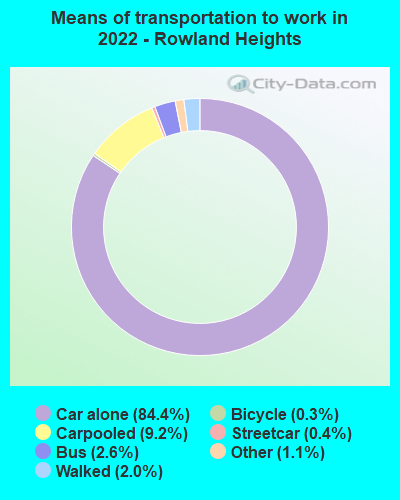
Workers who live and work in this place: 4,796 (21.1%)
Property values in Rowland Heights, CA
| Here: | 5.0% |
| California: | 5.1% |
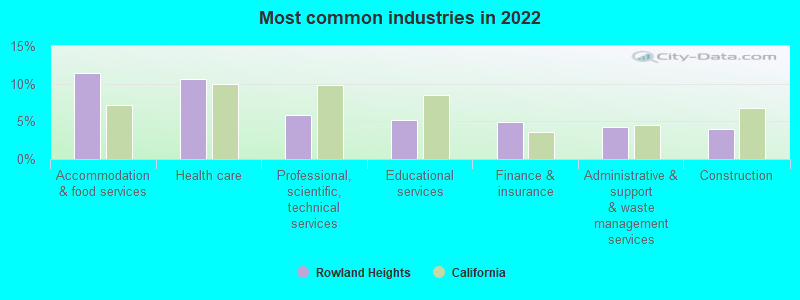
- Accommodation & food services (11.4%)
- Health care (10.6%)
- Professional, scientific, technical services (5.8%)
- Educational services (5.1%)
- Finance & insurance (4.9%)
- Administrative & support & waste management services (4.3%)
- Construction (4.0%)
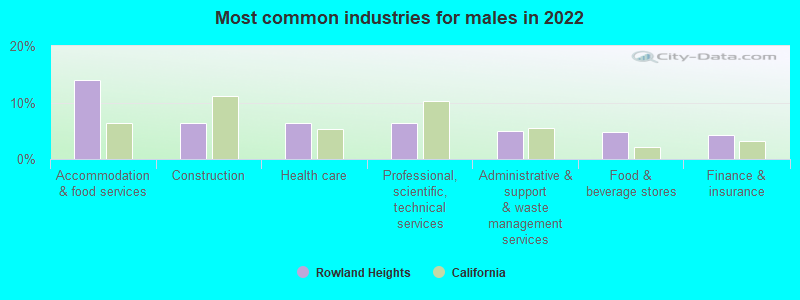
- Accommodation & food services (13.9%)
- Construction (6.5%)
- Health care (6.4%)
- Professional, scientific, technical services (6.3%)
- Administrative & support & waste management services (5.0%)
- Food & beverage stores (4.7%)
- Finance & insurance (4.2%)
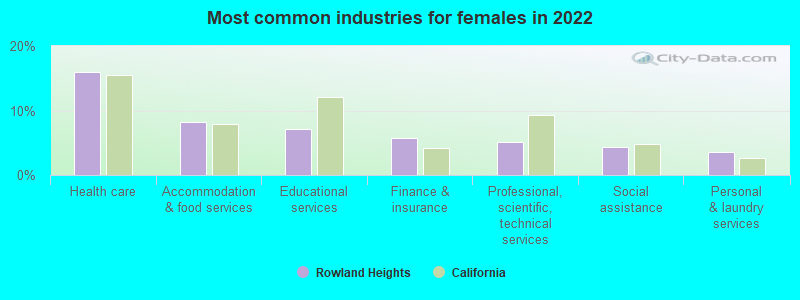
- Health care (15.9%)
- Accommodation & food services (8.3%)
- Educational services (7.1%)
- Finance & insurance (5.7%)
- Professional, scientific, technical services (5.2%)
- Social assistance (4.3%)
- Personal & laundry services (3.6%)
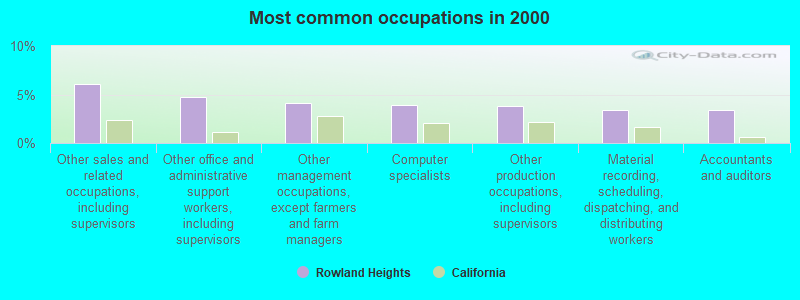
- Other sales and related occupations, including supervisors (6.1%)
- Other office and administrative support workers, including supervisors (4.7%)
- Other management occupations, except farmers and farm managers (4.1%)
- Computer specialists (4.0%)
- Other production occupations, including supervisors (3.8%)
- Material recording, scheduling, dispatching, and distributing workers (3.4%)
- Accountants and auditors (3.4%)
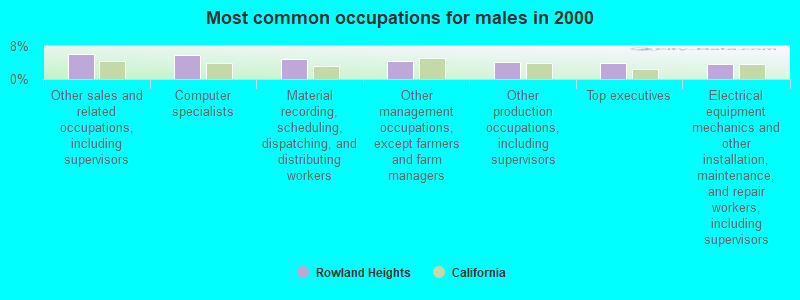
- Other sales and related occupations, including supervisors (6.2%)
- Computer specialists (5.8%)
- Material recording, scheduling, dispatching, and distributing workers (4.7%)
- Other management occupations, except farmers and farm managers (4.3%)
- Other production occupations, including supervisors (4.2%)
- Top executives (3.9%)
- Electrical equipment mechanics and other installation, maintenance, and repair workers, including supervisors (3.6%)
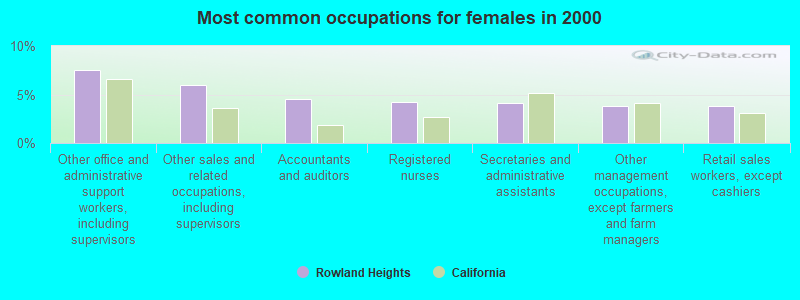
- Other office and administrative support workers, including supervisors (7.5%)
- Other sales and related occupations, including supervisors (6.0%)
- Accountants and auditors (4.5%)
- Registered nurses (4.3%)
- Secretaries and administrative assistants (4.2%)
- Other management occupations, except farmers and farm managers (3.8%)
- Retail sales workers, except cashiers (3.8%)
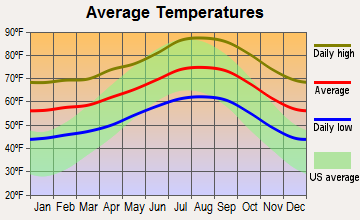
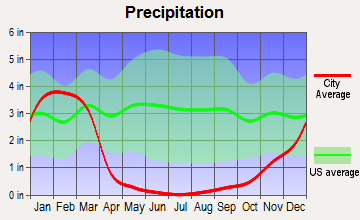
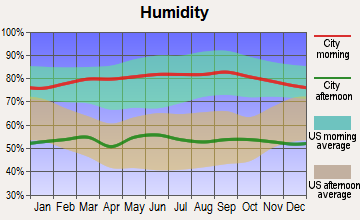
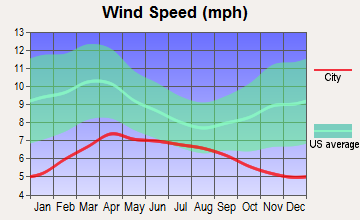
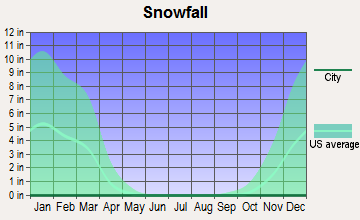
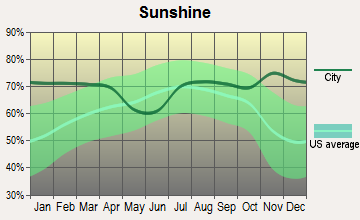
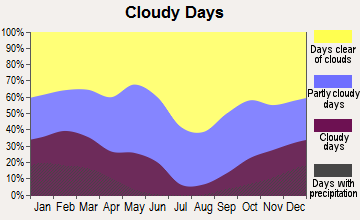
Average climate in Rowland Heights, California
Based on data reported by over 4,000 weather stations
(lower is better)
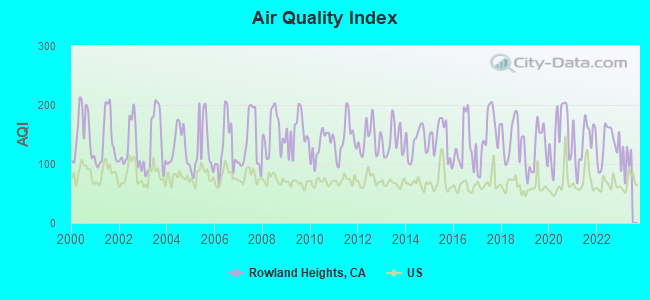
Air Quality Index (AQI) level in 2022 was 134. This is significantly worse than average.
| City: | 134 |
| U.S.: | 73 |
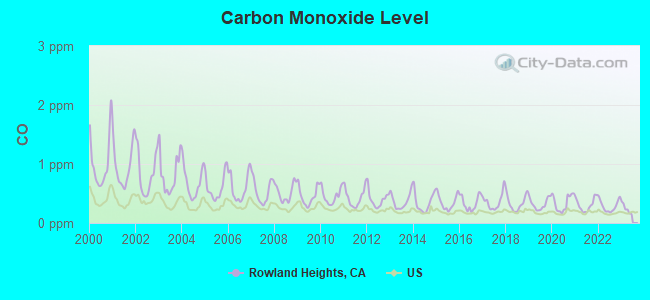
Carbon Monoxide (CO) [ppm] level in 2022 was 0.289. This is about average. Closest monitor was 3.1 miles away from the city center.
| City: | 0.289 |
| U.S.: | 0.251 |
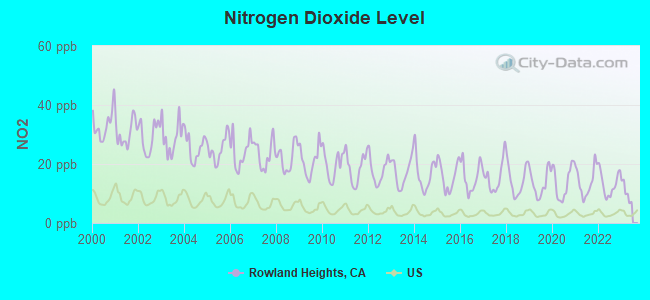
Nitrogen Dioxide (NO2) [ppb] level in 2022 was 13.3. This is significantly worse than average. Closest monitor was 3.1 miles away from the city center.
| City: | 13.3 |
| U.S.: | 5.1 |
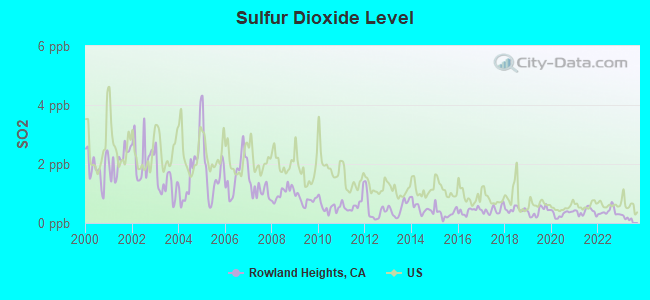
Sulfur Dioxide (SO2) [ppb] level in 2022 was 0.387. This is significantly better than average. Closest monitor was 5.3 miles away from the city center.
| City: | 0.387 |
| U.S.: | 1.515 |
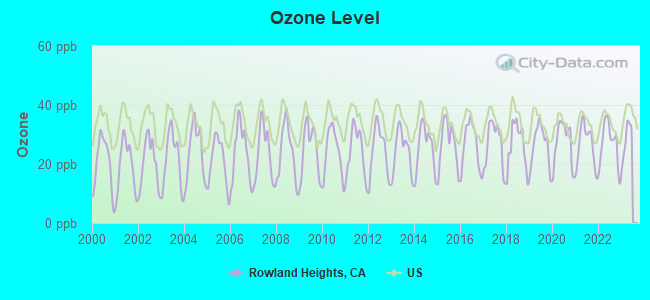
Ozone [ppb] level in 2022 was 26.8. This is better than average. Closest monitor was 3.1 miles away from the city center.
| City: | 26.8 |
| U.S.: | 33.3 |
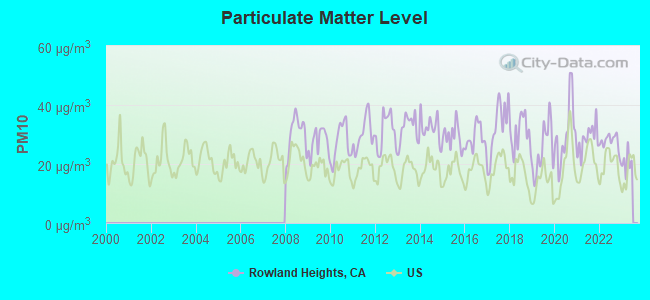
Particulate Matter (PM10) [µg/m3] level in 2022 was 27.4. This is significantly worse than average. Closest monitor was 10.8 miles away from the city center.
| City: | 27.4 |
| U.S.: | 19.2 |
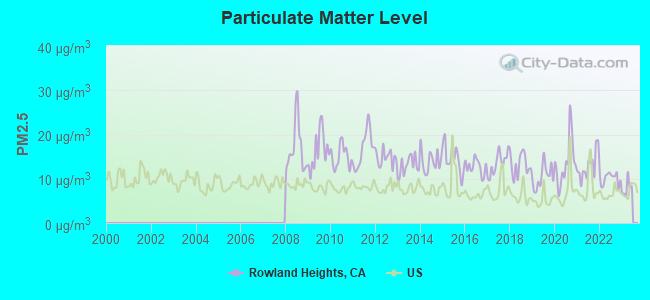
Particulate Matter (PM2.5) [µg/m3] level in 2022 was 10.1. This is worse than average. Closest monitor was 10.1 miles away from the city center.
| City: | 10.1 |
| U.S.: | 8.1 |
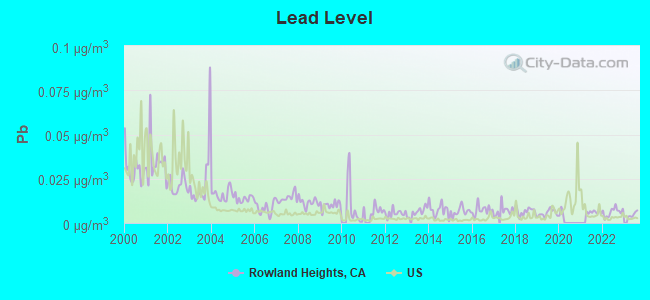
Lead (Pb) [µg/m3] level in 2022 was 0.00622. This is significantly better than average. Closest monitor was 3.1 miles away from the city center.
| City: | 0.00622 |
| U.S.: | 0.00931 |
Earthquake activity:
Rowland Heights-area historical earthquake activity is significantly above California state average. It is 7096% greater than the overall U.S. average.On 7/21/1952 at 11:52:14, a magnitude 7.7 (7.7 UK, Class: Major, Intensity: VIII - XII) earthquake occurred 94.7 miles away from the city center, causing $50,000,000 total damage
On 6/28/1992 at 11:57:34, a magnitude 7.6 (6.2 MB, 7.6 MS, 7.3 MW, Depth: 0.7 mi) earthquake occurred 79.0 miles away from Rowland Heights center, causing 3 deaths (1 shaking deaths, 2 other deaths) and 400 injuries, causing $100,000,000 total damage and $40,000,000 insured losses
On 10/16/1999 at 09:46:44, a magnitude 7.4 (6.3 MB, 7.4 MS, 7.2 MW, 7.3 ML) earthquake occurred 91.0 miles away from Rowland Heights center
On 11/4/1927 at 13:51:53, a magnitude 7.5 (7.5 UK) earthquake occurred 190.4 miles away from Rowland Heights center
On 4/21/1918 at 22:32:30, a magnitude 6.8 (6.8 UK, Class: Strong, Intensity: VII - IX) earthquake occurred 28.3 miles away from the city center
On 5/19/1940 at 04:36:40, a magnitude 7.2 (7.2 UK) earthquake occurred 136.8 miles away from the city center, causing $33,000,000 total damage
Magnitude types: body-wave magnitude (MB), local magnitude (ML), surface-wave magnitude (MS), moment magnitude (MW)
Natural disasters:
The number of natural disasters in Los Angeles County (57) is a lot greater than the US average (15).Major Disasters (Presidential) Declared: 27
Emergencies Declared: 3
Causes of natural disasters: Fires: 37, Floods: 16, Storms: 9, Winter Storms: 6, Landslides: 5, Mudslides: 5, Earthquakes: 3, Freeze: 1, Heavy Rain: 1, Hurricane: 1, Snow: 1, Tornado: 1, Wind: 1, Other: 1 (Note: some incidents may be assigned to more than one category).
Hospitals and medical centers in Rowland Heights:
Other hospitals and medical centers near Rowland Heights:
- ADVENT HEALTHCARE SERVICES, INC (Home Health Center, about 2 miles away; WEST COVINA, CA)
- HIGHMARK HOME HEALTH, INC (Home Health Center, about 2 miles away; WEST COVINA, CA)
- G E PEDIATRIC CARE (Hospital, about 2 miles away; LA PUENTE, CA)
- GERELYN PEDIATRIC CARE (Hospital, about 2 miles away; WEST COVINA, CA)
- MULITI-SKILLED HOME CARE SERVICES, INC (Home Health Center, about 2 miles away; WALNUT, CA)
- N AND D HEALTH CARE SERVICES INC (Home Health Center, about 2 miles away; CITY OF INDUSTRY, CA)
- AGAPE HOME HEALTH SERVICES, INC (Home Health Center, about 2 miles away; CITY OF INDUSTRY, CA)
Amtrak stations near Rowland Heights:
- 8 miles: FULLERTON (120 E. SANTA FE AVE.) . Services: ticket office, fully wheelchair accessible, enclosed waiting area, public restrooms, public payphones, full-service food facilities, free short-term parking, paid long-term parking, taxi stand, public transit connection.
- 10 miles: POMONA (156 W. COMMERCIAL ST.) . Services: partially wheelchair accessible, public payphones, free short-term parking, free long-term parking, call for taxi service, public transit connection.
- 13 miles: ANAHEIM (2150 KATELLA AVE.) . Services: ticket office, fully wheelchair accessible, enclosed waiting area, public restrooms, public payphones, vending machines, free short-term parking, free long-term parking, call for car rental service, call for taxi service.
Colleges/universities with over 2000 students nearest to Rowland Heights:
- Hacienda La Puente Adult Education (about 5 miles; La Puente, CA; Full-time enrollment: 2,750)
- Mt San Antonio College (about 6 miles; Walnut, CA; FT enrollment: 19,891)
- California State Polytechnic University-Pomona (about 7 miles; Pomona, CA; FT enrollment: 18,141)
- California State University-Fullerton (about 7 miles; Fullerton, CA; FT enrollment: 28,947)
- Fullerton College (about 8 miles; Fullerton, CA; FT enrollment: 11,124)
- DeVry University-California (about 8 miles; Pomona, CA; FT enrollment: 10,875)
- Rio Hondo College (about 9 miles; Whittier, CA; FT enrollment: 9,610)
Public high schools in Rowland Heights:
- JOHN A. ROWLAND HIGH (Students: 1,633, Location: 2000 S. OTTERBEIN ST., Grades: 9-12)
- ROWLAND UNIFIED COMMUNITY DAY (Students: 20, Location: 1928 NOGALES ST., Grades: 7-12)
Private high schools in Rowland Heights:
Public elementary/middle schools in Rowland Heights:
- ALVARADO INTERMEDIATE (Students: 893, Location: 1901 S. DESIRE AVE., Grades: 7-8)
- BLANDFORD ELEMENTARY (Students: 492, Location: 2601 BLANDFORD DR., Grades: KG-6)
- KILLIAN ELEMENTARY (Students: 430, Location: 19100 E. KILLIAN ST., Grades: KG-6)
- SHELYN ELEMENTARY (Students: 368, Location: 19500 E. NACORA ST., Grades: KG-6)
- ROWLAND ELEMENTARY (Students: 289, Location: 2036 S. FULLERTON RD., Grades: KG-6)
- JELLICK ELEMENTARY (Students: 274, Location: 1400 S. JELLICK AVE., Grades: KG-6)
- ROWLAND HEIGHTS CHARTER ACADEMY (Location: 1127 OTTERBEIN AVE., Grades: KG-8, Charter school)
Points of interest:
Notable locations in Rowland Heights: Grazide Ranch (A), Royal Vista Golf Course (B), Los Angeles County Fire Department Station 119 (C), Los Angeles County Fire Department Station 145 (D). Display/hide their locations on the map
Shopping Centers: Rowland Heights Plaza Shopping Center (1), Canyon Point Marketplace Shopping Center (2), Ross Plaza Shopping Center (3), Fairway Plaza Shopping Center (4), Eastwood Village Shopping Center (5). Display/hide their locations on the map
Cemetery: Queen of Heaven Cemetery (1). Display/hide its location on the map
Parks in Rowland Heights include: Carolyn Rosas Park (1), Gloria Heer Park (2), Rowland Heights Park (3), Trailview Park (4). Display/hide their locations on the map
Tourist attraction: C & H Travel & Tours (17870 Castleton Street Suite 205).
Hotel: Best Western Executive Inn (18880 Gale Avenue).
| This place: | 3.4 people |
| California: | 2.9 people |
| This place: | 84.8% |
| Whole state: | 68.7% |
| This place: | 3.4% |
| Whole state: | 7.2% |
Likely homosexual households (counted as self-reported same-sex unmarried-partner households)
- Lesbian couples: 0.3% of all households
- Gay men: 0.2% of all households
People in group quarters in Rowland Heights in 2010:
- 67 people in other noninstitutional facilities
- 51 people in group homes intended for adults
- 19 people in residential treatment centers for adults
- 9 people in in-patient hospice facilities
- 6 people in emergency and transitional shelters (with sleeping facilities) for people experiencing homelessness
- 5 people in nursing facilities/skilled-nursing facilities
- 5 people in workers' group living quarters and job corps centers
People in group quarters in Rowland Heights in 2000:
- 96 people in nursing homes
- 36 people in other noninstitutional group quarters
- 9 people in other group homes
- 7 people in homes for the mentally retarded
- 4 people in religious group quarters
- 3 people in other nonhousehold living situations
Banks with most branches in Rowland Heights (2011 data):
- East West Bank: Rowland Heights East Branch, Rowland Heights Branch, Rowland Heights Branch, 99 Rowland Heights Branch, Rowland Heights Fairway Branch, Rowland Heights Colima Branch. Info updated 2010/06/14: Bank assets: $21,962.4 mil, Deposits: $17,501.8 mil, headquarters in Pasadena, CA, positive income, Commercial Lending Specialization, 131 total offices, Holding Company: East West Bancorp, Inc.
- Royal Business Bank: Rowland Heights Branch at 1015 S. Nogales Street, Unit 121 & 122a, branch established on 2011/07/11. Info updated 2011/09/28: Bank assets: $502.4 mil, Deposits: $427.6 mil, headquarters in Los Angeles, CA, positive income, Commercial Lending Specialization, 9 total offices, Holding Company: Rbb Bancorp
- Hanmi Bank: Rowland Heights Branch at 18720 East Colima Road, branch established on 1998/10/01. Info updated 2010/04/01: Bank assets: $2,739.6 mil, Deposits: $2,377.7 mil, headquarters in Los Angeles, CA, positive income, Commercial Lending Specialization, 28 total offices, Holding Company: Hanmi Financial Corporation
- BBCN Bank: Rowland Heights Branch at 1709 South Nogales St. Suite 100, branch established on 2004/04/16. Info updated 2011/12/12: Bank assets: $5,170.7 mil, Deposits: $3,989.4 mil, headquarters in Los Angeles, CA, positive income, Commercial Lending Specialization, 49 total offices, Holding Company: Bbcn Bancorp, Inc.
- HSBC Bank USA, National Association: Rowland Heights Branch at 18250 Colima Road, branch established on 2003/05/12. Info updated 2010/11/30: Bank assets: $206,009.7 mil, Deposits: $149,026.8 mil, headquarters in Mc Lean, VA, positive income, 474 total offices, Holding Company: Hsbc Holdings Plc
- American Plus Bank, N.A.: Rowland Heights Branch at 17506 Colima Road, branch established on 2009/08/08. Info updated 2008/12/02: Bank assets: $212.6 mil, Deposits: $166.8 mil, headquarters in Arcadia, CA, positive income, Commercial Lending Specialization, 2 total offices
- Los Angeles National Bank: Rowland Height Branch at 18253 Colma Road, Suite 101, branch established on 2010/05/10. Info updated 2010/06/14: Bank assets: $193.0 mil, Deposits: $164.1 mil, headquarters in Buena Park, CA, positive income, Commercial Lending Specialization, 5 total offices, Holding Company: Concord Place, Inc.
- Bank of the West: Rowland Heights Branch at 19005 East Colima Road, branch established on 1995/04/13. Info updated 2009/11/16: Bank assets: $62,408.3 mil, Deposits: $43,995.2 mil, headquarters in San Francisco, CA, positive income, 647 total offices, Holding Company: Bnp Paribas
- Bank of America, National Association: Rowland Heights Branch at 1501 Nogales Street, branch established on 1965/05/14. Info updated 2009/11/18: Bank assets: $1,451,969.3 mil, Deposits: $1,077,176.8 mil, headquarters in Charlotte, NC, positive income, 5782 total offices, Holding Company: Bank Of America Corporation
- 13 other banks with 13 local branches
For population 15 years and over in Rowland Heights:
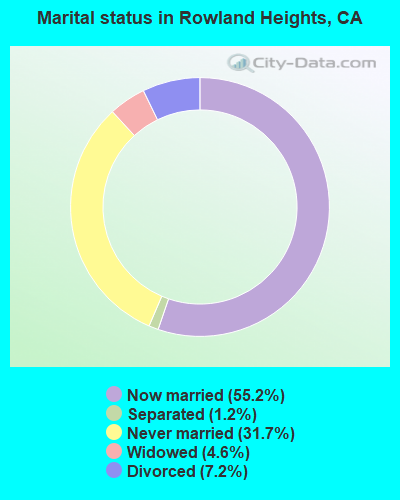
- Never married: 31.7%
- Now married: 55.2%
- Separated: 1.2%
- Widowed: 4.6%
- Divorced: 7.2%
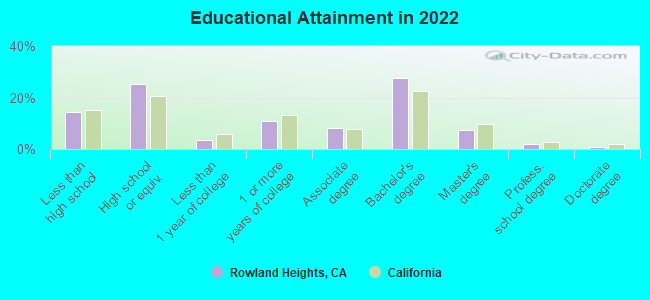
For population 25 years and over in Rowland Heights:
- High school or higher: 85.3%
- Bachelor's degree or higher: 36.7%
- Graduate or professional degree: 9.7%
- Unemployed: 4.2%
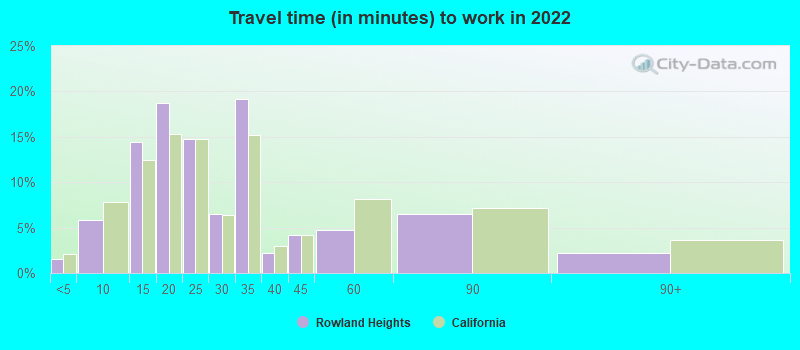
- Mean travel time to work (commute): 27.0 minutes
| Here: | 14.8 |
| California average: | 15.5 |


Graphs represent county-level data. Detailed 2008 Election Results
Political contributions by individuals in Rowland Heights, CA
Neighborhoods in Rowland Heights:
(Rowland Heights, California Neighborhood Map)Religion statistics for Rowland Heights, CA (based on Los Angeles County data)


| Religion | Adherents | Congregations |
|---|---|---|
| Catholic | 3,542,994 | 275 |
| Evangelical Protestant | 814,611 | 3,249 |
| Other | 451,594 | 1,023 |
| Mainline Protestant | 229,056 | 860 |
| Black Protestant | 112,338 | 290 |
| Orthodox | 63,517 | 76 |
| None | 4,604,495 | - |
Food Environment Statistics:
| Here: | 2.12 / 10,000 pop. |
| California: | 2.14 / 10,000 pop. |
| Los Angeles County: | 0.03 / 10,000 pop. |
| State: | 0.04 / 10,000 pop. |
| Los Angeles County: | 0.58 / 10,000 pop. |
| California: | 0.62 / 10,000 pop. |
| Los Angeles County: | 1.23 / 10,000 pop. |
| California: | 1.49 / 10,000 pop. |
| This county: | 7.15 / 10,000 pop. |
| State: | 7.42 / 10,000 pop. |
| Here: | 7.5% |
| State: | 7.3% |
| This county: | 20.4% |
| California: | 21.3% |
| Los Angeles County: | 18.6% |
| California: | 17.9% |
Health and Nutrition:
| Rowland Heights: | 54.3% |
| California: | 49.4% |
| Rowland Heights: | 50.8% |
| State: | 48.0% |
| This city: | 26.6 |
| California: | 28.1 |
| Rowland Heights: | 16.4% |
| California: | 20.2% |
| Rowland Heights: | 18.2% |
| California: | 11.2% |
| This city: | 6.8 |
| California: | 6.8 |
| Rowland Heights: | 25.3% |
| California: | 31.5% |
| Rowland Heights: | 57.8% |
| California: | 56.4% |
| Rowland Heights: | 82.8% |
| California: | 80.9% |
More about Health and Nutrition of Rowland Heights, CA Residents
2.98% of this county's 2021 resident taxpayers lived in other counties in 2020 ($81,235 average adjusted gross income)
| Here: | 2.98% |
| California average: | 5.19% |
0.01% of residents moved from foreign countries ($155 average AGI)
Los Angeles County: 0.01% California average: 0.03%
Top counties from which taxpayers relocated into this county between 2020 and 2021:
| from Orange County, CA | |
| from San Bernardino County, CA | |
| from Riverside County, CA |
4.68% of this county's 2020 resident taxpayers moved to other counties in 2021 ($97,324 average adjusted gross income)
| Here: | 4.68% |
| California average: | 6.14% |
0.01% of residents moved to foreign countries ($196 average AGI)
Los Angeles County: 0.01% California average: 0.02%
Top counties to which taxpayers relocated from this county between 2020 and 2021:
| to Orange County, CA | |
| to San Bernardino County, CA | |
| to Riverside County, CA |
| Businesses in Rowland Heights, CA | ||||
| Name | Count | Name | Count | |
|---|---|---|---|---|
| 7-Eleven | 1 | GNC | 1 | |
| 99 Cents Only Stores | 1 | GameStop | 1 | |
| AT&T | 1 | H&R Block | 1 | |
| Aeropostale | 1 | KFC | 1 | |
| Albertsons | 1 | McDonald's | 1 | |
| Avenue | 1 | Motel 6 | 1 | |
| Baja Fresh Mexican Grill | 1 | Nike | 2 | |
| Barnes & Noble | 1 | RadioShack | 1 | |
| Best Western | 1 | Rite Aid | 1 | |
| Burger King | 1 | Starbucks | 4 | |
| Carl\s Jr. | 1 | Subway | 2 | |
| Dennys | 1 | Target | 1 | |
| Domino's Pizza | 1 | UPS | 3 | |
| El Pollo Loco | 1 | Walgreens | 1 | |
| FedEx | 2 | |||
Strongest AM radio stations in Rowland Heights:
- KTNQ (1020 AM; 50 kW; LOS ANGELES, CA; Owner: KTNQ-AM LICENSE CORP.)
- KXTA (1150 AM; 50 kW; LOS ANGELES, CA; Owner: CITICASTERS LICENSES, L.P.)
- KFI (640 AM; 50 kW; LOS ANGELES, CA; Owner: CAPSTAR TX LIMITED PARTNERSHIP)
- KLAC (570 AM; 50 kW; LOS ANGELES, CA; Owner: AMFM RADIO LICENSES, L.L.C.)
- KDIS (1110 AM; 50 kW; PASADENA, CA; Owner: ABC,INC.)
- KALI (900 AM; 6 kW; WEST COVINA, CA; Owner: MULTICULTURAL RADIO BROADCASTING, INC.)
- KPLS (830 AM; 50 kW; ORANGE, CA; Owner: CRN LICENSES, LLC)
- KFWB (980 AM; 50 kW; LOS ANGELES, CA; Owner: INFINITY BROADCASTING OPERATIONS, INC.)
- KMPC (1540 AM; 50 kW; LOS ANGELES, CA; Owner: ROSE CITY RADIO CORPORATION)
- KBLA (1580 AM; 50 kW; SANTA MONICA, CA)
- KSPN (710 AM; 50 kW; LOS ANGELES, CA; Owner: KABC-AM RADIO, INC.)
- KNX (1070 AM; 50 kW; LOS ANGELES, CA; Owner: INFINITY BROADCASTING OPERATIONS, INC.)
- KXMX (1190 AM; 25 kW; ANAHEIM, CA; Owner: NEW INSPIRATION BROADCASTING COMPANY)
Strongest FM radio stations in Rowland Heights:
- KCBS-FM (93.1 FM; LOS ANGELES, CA; Owner: INFINITY BROADCASTING OPERATIONS, INC.)
- KSCA (101.9 FM; GLENDALE, CA; Owner: HBC LICENSE CORPORATION)
- KLOS (95.5 FM; LOS ANGELES, CA; Owner: KLOS-FM RADIO, INC.)
- KOST (103.5 FM; LOS ANGELES, CA; Owner: CAPSTAR TX LIMITED PARTNERSHIP)
- K212FA (90.3 FM; TEMPLE CITY, CA; Owner: EDUCATIONAL MEDIA FOUNDATION)
- KIIS-FM (102.7 FM; LOS ANGELES, CA; Owner: CITICASTERS LICENSES, L.P.)
- KLVE (107.5 FM; LOS ANGELES, CA; Owner: KLVE-FM LICENSE CORP.)
- KPCC (89.3 FM; PASADENA, CA; Owner: PASADENA AREA COMMUNITY COLLEGE DISTRICT)
- KHHT (92.3 FM; LOS ANGELES, CA; Owner: AMFM RADIO LICENSES, L.L.C.)
- KBIG-FM (104.3 FM; LOS ANGELES, CA; Owner: AMFM RADIO LICENSES, L.L.C.)
- KTWV (94.7 FM; LOS ANGELES, CA; Owner: INFINITY BROADCASTING OPERATIONS, INC.)
- KMZT-FM (105.1 FM; LOS ANGELES, CA; Owner: MOUNT WILSON FM BROADCASTERS, INC.)
- KPFK (90.7 FM; LOS ANGELES, CA; Owner: PACIFICA FOUNDATION, INC)
- K216EM (91.1 FM; ARCADIA, CA; Owner: LIFE ON THE WAY COMMUNICATIONS, INC.)
- KZLA-FM (93.9 FM; LOS ANGELES, CA; Owner: EMMIS RADIO LICENSE CORPORATION)
- KSAK (90.1 FM; WALNUT, CA; Owner: MT. SAN ANTONIO COMM. COLLEGE DIST.)
- KPWR (105.9 FM; LOS ANGELES, CA; Owner: EMMIS RADIO LICENSE CORPORATION)
- KLSX (97.1 FM; LOS ANGELES, CA; Owner: INFINITY BROADCASTING OPERATIONS, INC.)
- KUSC (91.5 FM; LOS ANGELES, CA; Owner: UNIVERSITY OF SOUTHERN CALIFORNIA)
- KKLA-FM (99.5 FM; LOS ANGELES, CA; Owner: NEW INSPIRATION BROADCASTING CO., INC.)
TV broadcast stations around Rowland Heights:
- KCBS-TV (Channel 2; LOS ANGELES, CA; Owner: CBS BROADCASTING INC.)
- KTRO-LP (Channel 50; LANCASTER, CA; Owner: ROBERT D. ADELMAN)
- KTLA-TV (Channel 5; LOS ANGELES, CA; Owner: KTLA INC.)
- KABC-TV (Channel 7; LOS ANGELES, CA; Owner: ABC HOLDING COMPANY, INC.)
- KHIZ (Channel 64; BARSTOW, CA; Owner: SUNBELT TELEVISION, INC.)
- KCAL-TV (Channel 9; LOS ANGELES, CA; Owner: VIACOM TELEVISION STATIONS GROUP OF LOS ANGELES LLC)
- KNBC (Channel 4; LOS ANGELES, CA; Owner: NBC SUBSIDIARY (KNBC-TV), INC.)
- KMEX-TV (Channel 34; LOS ANGELES, CA; Owner: KMEX LICENSE PARTNERSHIP, G.P.)
- KAZA-TV (Channel 54; AVALON, CA; Owner: PAPPAS SOUTHERN CALIFORNIA LICENSE LLC)
- KDOC-TV (Channel 56; ANAHEIM, CA; Owner: GOLDEN ORANGE BROADCASTING CO., INC.)
- KOCE-TV (Channel 50; HUNTINGTON BEACH, CA; Owner: BD. OF TRUSTEES, COAST COMMUNITY COLLEGE DIST.)
- KSCI (Channel 18; LONG BEACH, CA; Owner: KSLS, INC.)
- KCET (Channel 28; LOS ANGELES, CA; Owner: COMMUNITY TELEVISION OF SOUTHERN CALIFORNIA)
- KXLA (Channel 44; RANCHO PALOS VERDES, CA; Owner: RANCHO PALOS VERDES BROADCASTERS, INC.)
- KFTR (Channel 46; ONTARIO, CA; Owner: TELEFUTURA LOS ANGELES LLC)
- KTTV (Channel 11; LOS ANGELES, CA; Owner: FOX TELEVISION STATIONS, INC.)
- KWHY-TV (Channel 22; LOS ANGELES, CA; Owner: TELEMUNDO OF LOS ANGELES LICENSE CORPORATION)
- KVEA (Channel 52; CORONA, CA; Owner: ESTRELLA LICENSE CORPORATION)
- KRCA (Channel 62; RIVERSIDE, CA; Owner: KRCA LICENSE CORP.)
- KCOP-TV (Channel 13; LOS ANGELES, CA; Owner: FOX TELEVISION STATIONS, INC.)
- KPXN (Channel 30; SAN BERNARDINO, CA; Owner: PAXSON LOS ANGELES LICENSE, INC.)
- National Bridge Inventory (NBI) Statistics
- 5Number of bridges
- 30ft / 9.2mTotal length
- 647,476Total average daily traffic
- 58,445Total average daily truck traffic
FCC Registered Antenna Towers:
14 (See the full list of FCC Registered Antenna Towers in Rowland Heights)FCC Registered Broadcast Land Mobile Towers:
15 (See the full list of FCC Registered Broadcast Land Mobile Towers in Rowland Heights, CA)FCC Registered Microwave Towers:
13 (See the full list of FCC Registered Microwave Towers in this town)FCC Registered Amateur Radio Licenses:
202 (See the full list of FCC Registered Amateur Radio Licenses in Rowland Heights)FAA Registered Aircraft:
6- Aircraft: BELLANCA 14-19-3 (Category: Land, Seats: 4, Weight: Up to 12,499 Pounds, Speed: 152 mph), Engine: CONT MOTOR I0-470 SERIES (260 HP) (Reciprocating)
N-Number: 1290R, N1290R, N-1290R, Serial Number: 4316, Year manufactured: 1966, Airworthiness Date: 09/06/1966, Certificate Issue Date: 02/26/2020
Registrant (Individual): William Frank Jones, 1878 Calle La Paz, Rowland Heights, CA 91748 - Aircraft: CESSNA 182Q (Category: Land, Seats: 4, Weight: Up to 12,499 Pounds, Speed: 112 mph), Engine: CONT MOTOR O-470 SERIES (230 HP) (Reciprocating)
N-Number: 182K, N182K, N-182K, Serial Number: 18266882, Year manufactured: 1979, Airworthiness Date: 03/20/1979, Certificate Issue Date: 12/12/2019
Registrant (Corporation): Chris I Lee Md Inc, 18897 Colima Rd Ste B, Rowland Heights, CA 91748 - Aircraft: PIPER PA-32RT-300T (Category: Land, Seats: 7, Weight: Up to 12,499 Pounds, Speed: 124 mph), Engine: LYCOMING TI0-540 SER (310 HP) (Reciprocating)
N-Number: 3028A, N3028A, N-3028A, Serial Number: 32R-7987017, Year manufactured: 1978, Certificate Issue Date: 12/26/2018
Registrant (Co-Owned): Aviation Inc Jmf, 2500 Cap Ct, Rowland Heights, CA 91748, Other Owners: Jonathan Mcneely - Aircraft: PIPER PA-28-180 (Category: Land, Seats: 4, Weight: Up to 12,499 Pounds, Speed: 107 mph), Engine: LYCOMING O&VO-360 SER (180 HP) (Reciprocating)
N-Number: 7055W, N7055W, N-7055W, Serial Number: 28-823, Year manufactured: 1962, Airworthiness Date: 10/11/1962, Certificate Issue Date: 02/06/1978
Registrant (Individual): Donald L Rickard, 18330 Madonna Street, Rowland Hts, CA 91748 - Aircraft: PIPER PA-28-180 (Category: Land, Seats: 4, Weight: Up to 12,499 Pounds, Speed: 107 mph), Engine: LYCOMING O&VO-360 SER (180 HP) (Reciprocating)
N-Number: 7730W, N7730W, N-7730W, Serial Number: 28-1738, Year manufactured: 1964, Airworthiness Date: 06/04/1964, Certificate Issue Date: 10/20/2006
Registrant (Individual): Y H Charles Suh, 2201 Saleroso Dr, Rowland Heights, CA 91748 - Aircraft: CESSNA 150F (Category: Land, Seats: 2, Weight: Up to 12,499 Pounds, Speed: 90 mph), Engine: CONT MOTOR 0-200 SERIES (100 HP) (Reciprocating)
N-Number: 8923S, N8923S, N-8923S, Serial Number: 15062223, Year manufactured: 1965, Airworthiness Date: 11/18/1965, Certificate Issue Date: 12/02/2019
Registrant (Individual): Chen Huang, 1524 Jellick Ave Apt H, Rowland Heights, CA 91748
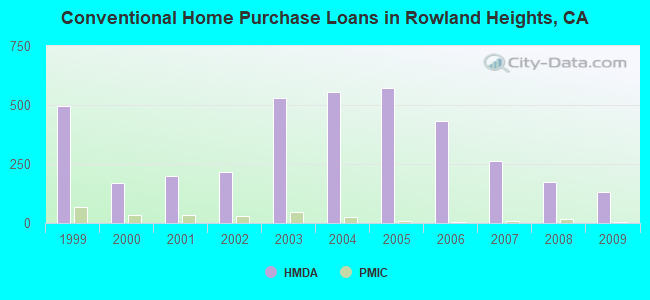
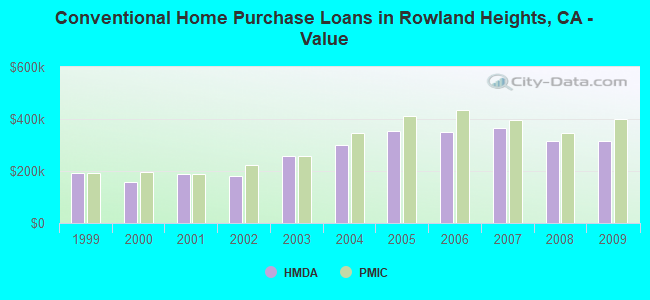
| Home Mortgage Disclosure Act Aggregated Statistics For Year 2009 (Based on 5 full and 7 partial tracts) | ||||||||||||||
| A) FHA, FSA/RHS & VA Home Purchase Loans | B) Conventional Home Purchase Loans | C) Refinancings | D) Home Improvement Loans | E) Loans on Dwellings For 5+ Families | F) Non-occupant Loans on < 5 Family Dwellings (A B C & D) | G) Loans On Manufactured Home Dwelling (A B C & D) | ||||||||
|---|---|---|---|---|---|---|---|---|---|---|---|---|---|---|
| Number | Average Value | Number | Average Value | Number | Average Value | Number | Average Value | Number | Average Value | Number | Average Value | Number | Average Value | |
| LOANS ORIGINATED | 11 | $362,013 | 132 | $317,207 | 596 | $289,523 | 29 | $210,303 | 1 | $550,000 | 38 | $278,450 | 0 | $0 |
| APPLICATIONS APPROVED, NOT ACCEPTED | 0 | $0 | 15 | $336,946 | 73 | $297,258 | 4 | $76,495 | 0 | $0 | 7 | $299,937 | 0 | $0 |
| APPLICATIONS DENIED | 4 | $468,182 | 23 | $318,528 | 205 | $321,413 | 16 | $240,334 | 0 | $0 | 18 | $248,038 | 1 | $76,150 |
| APPLICATIONS WITHDRAWN | 4 | $334,238 | 21 | $318,399 | 114 | $298,242 | 11 | $201,618 | 0 | $0 | 9 | $247,657 | 0 | $0 |
| FILES CLOSED FOR INCOMPLETENESS | 3 | $208,733 | 6 | $379,635 | 46 | $326,608 | 2 | $262,690 | 0 | $0 | 2 | $312,000 | 0 | $0 |
Detailed mortgage data for all 12 tracts in Rowland Heights, CA
| Private Mortgage Insurance Companies Aggregated Statistics For Year 2009 (Based on 4 full and 5 partial tracts) | ||||
| A) Conventional Home Purchase Loans | B) Refinancings | |||
|---|---|---|---|---|
| Number | Average Value | Number | Average Value | |
| LOANS ORIGINATED | 6 | $401,508 | 1 | $515,410 |
| APPLICATIONS APPROVED, NOT ACCEPTED | 3 | $367,607 | 1 | $552,000 |
| APPLICATIONS DENIED | 1 | $341,000 | 4 | $384,405 |
| APPLICATIONS WITHDRAWN | 0 | $0 | 1 | $208,000 |
| FILES CLOSED FOR INCOMPLETENESS | 0 | $0 | 0 | $0 |
2005 - 2018 National Fire Incident Reporting System (NFIRS) incidents
- Fire incident types reported to NFIRS in Rowland Heights, CA
- 16639.1%Outside Fires
- 14032.9%Structure Fires
- 9021.2%Mobile Property/Vehicle Fires
- 296.8%Other
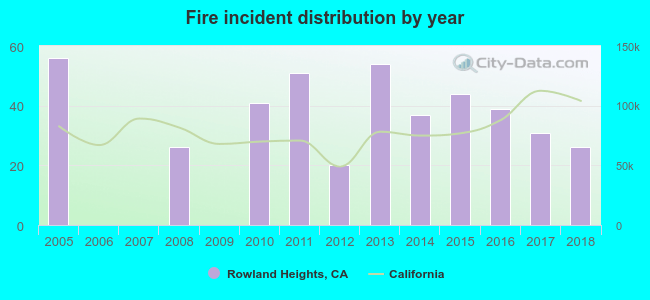 According to the data from the years 2005 - 2018 the average number of fire incidents per year is 30. The highest number of fires - 56 took place in 2005, and the least - 0 in 2006. The data has a declining trend.
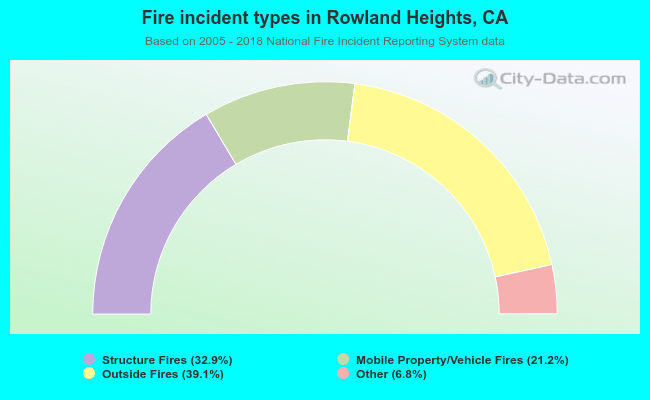 When looking into fire subcategories, the most reports belonged to: Outside Fires (39.1%), and Structure Fires (32.9%).
| Most common first names in Rowland Heights, CA among deceased individuals | ||
| Name | Count | Lived (average) |
|---|---|---|
| Mary | 72 | 79.4 years |
| John | 62 | 70.8 years |
| Robert | 55 | 67.0 years |
| William | 53 | 68.5 years |
| James | 37 | 71.2 years |
| Charles | 35 | 70.6 years |
| Frank | 33 | 75.8 years |
| George | 32 | 75.8 years |
| Helen | 29 | 80.6 years |
| Edward | 28 | 70.8 years |
| Most common last names in Rowland Heights, CA among deceased individuals | ||
| Last name | Count | Lived (average) |
|---|---|---|
| Kim | 34 | 79.0 years |
| Lee | 32 | 80.4 years |
| Smith | 31 | 72.0 years |
| Chen | 30 | 77.3 years |
| Wang | 20 | 78.9 years |
| Chang | 19 | 84.4 years |
| Wong | 17 | 82.2 years |
| Martinez | 16 | 74.3 years |
| Sanchez | 15 | 75.5 years |
| Rodriguez | 15 | 66.9 years |
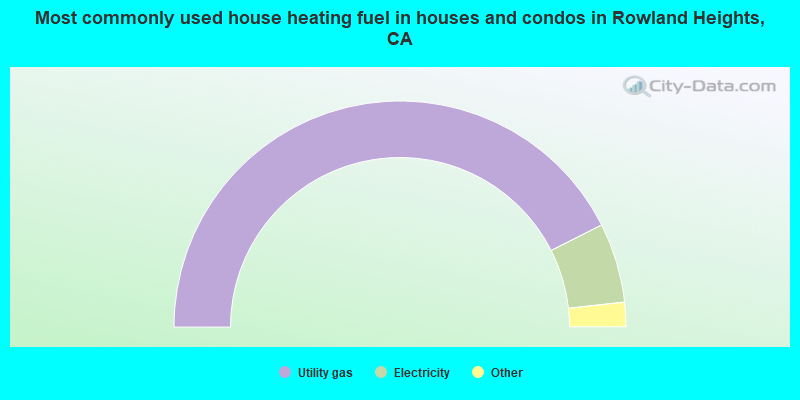
- 85.1%Utility gas
- 11.4%Electricity
- 2.1%Bottled, tank, or LP gas
- 0.7%No fuel used
- 0.5%Solar energy
- 0.1%Fuel oil, kerosene, etc.
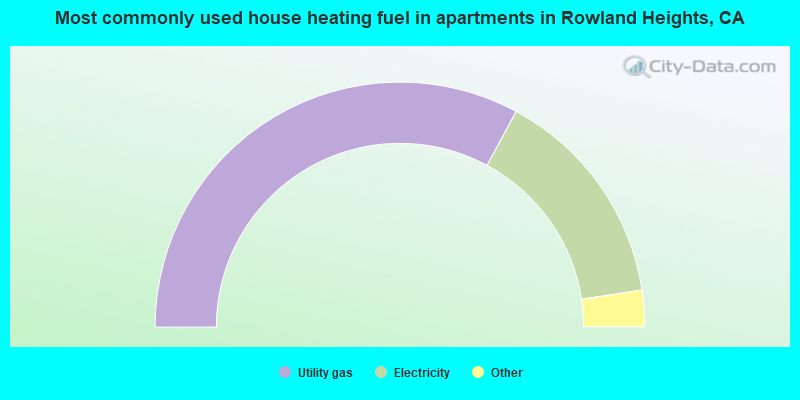
- 65.8%Utility gas
- 29.5%Electricity
- 2.8%No fuel used
- 1.3%Bottled, tank, or LP gas
- 0.7%Solar energy
Rowland Heights compared to California state average:
- Unemployed percentage significantly below state average.
- Black race population percentage significantly below state average.
- Median age significantly above state average.
- Foreign-born population percentage above state average.
- Length of stay since moving in significantly above state average.
Rowland Heights on our top lists:
- #2 on the list of "Top 101 cities with the most residents born in Eastern Asia (population 500+)"
- #3 on the list of "Top 101 cities with the most residents born in China (population 500+)"
- #3 on the list of "Top 101 cities with the most residents born in Taiwan (population 500+)"
- #6 on the list of "Top 101 cities with the most residents born in China, excluding Hong Kong and Taiwan (population 500+)"
- #7 on the list of "Top 101 cities with the most residents born in Asia (population 500+)"
- #9 on the list of "Top 101 cities with the most residents born in Indonesia (population 500+)"
- #46 on the list of "Top 101 cities with the most residents born in Hong Kong (population 500+)"
- #53 on the list of "Top 101 cities with the most residents born in Korea (population 500+)"
- #53 on the list of "Top 100 cities with highest percentage of foreign-born residents"
- #60 on the list of "Top 101 cities with largest percentage of females in industries: wholesale trade (population 5,000+)"
- #70 on the list of "Top 101 cities with largest percentage of males in industries: wholesale trade (population 5,000+)"
- #75 on the list of "Top 101 cities where residents moved in more then 10 years ago (10,000+ households)"
- #99 on the list of "Top 101 cities with the most residents born in South Eastern Asia (population 500+)"
- #27 (91748) on the list of "Top 101 zip codes with the most full service restaurants in 2005"
- #1 on the list of "Top 101 counties with the most Evangelical Protestant congregations"
- #1 on the list of "Top 101 counties with the most Mainline Protestant congregations"
- #1 on the list of "Top 101 counties with the most Orthodox adherents"
- #1 on the list of "Top 101 counties with the highest ground withdrawal of fresh water for public supply (pop. 50,000+)"
- #1 on the list of "Top 101 counties with the most Catholic adherents (pop. 50,000+)"

|
|
Total of 274 patent applications in 2008-2024.