Estimated zip code population in 2022: 68,490 Zip code population in 2010: 67,619 Zip code population in 2000: 67,353
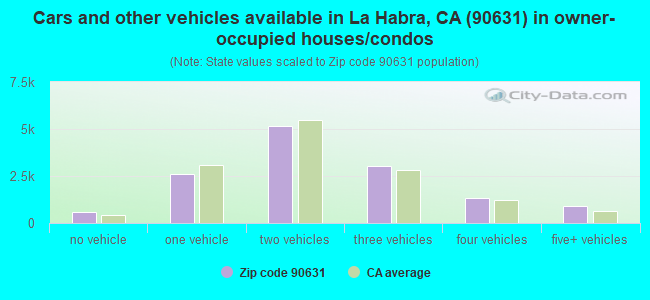
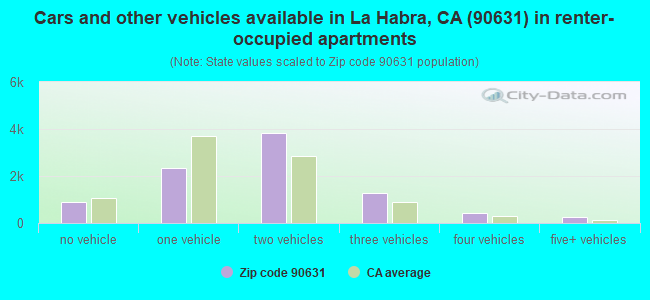
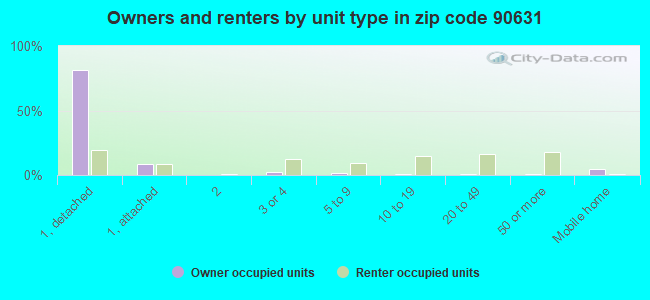
Houses and condos: 23,302 Renter-occupied apartments: 9,020
% of renters here:
40%
State:
44%
March 2022 cost of living index in zip code 90631: 86.9 (less than average, U.S. average is 100)
Land area: 13.9 sq. mi. Water area: 0.0 sq. mi.
Population density: 4,926 people per square mile
(average).
OSM Map
General Map
Google Map
MSN Map
OSM Map
General Map
Google Map
MSN Map
OSM Map
General Map
Google Map
MSN Map
OSM Map
General Map
Google Map
MSN Map
Please wait while loading the map...
Real estate property taxes paid for housing units in 2022:
This zip code:
0.6% ($4,763)
California:
0.7% ($4,831)
Median real estate property taxes paid for housing units with mortgages in 2022: $5,367 (0.7%) Median real estate property taxes paid for housing units with no mortgage in 2022: $3,106 (0.4%)
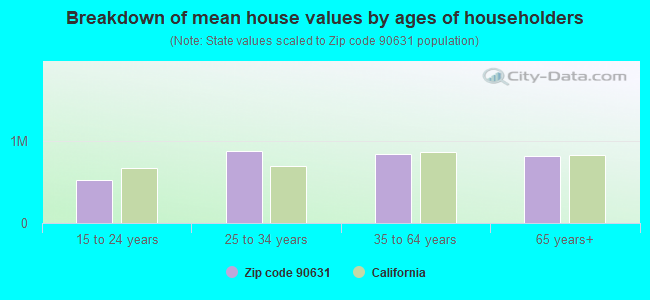
Estimated median house/condo value in 2022: $778,228
90631:
$778,228
California:
$715,900
According to our research of California and other state lists, there were 42 registered sex offenders living in 90631 zip code as of April 27, 2024. The ratio of all residents to sex offenders in zip code 90631 is 1,666 to 1. The ratio of registered sex offenders to all residents in this zip code is lower than the state average.
Median resident age:
This zip code:
39.2 years
California median age:
37.9 years
Average household size:
This zip code:
3.0 people
California:
2.8 people
Averages for the 2020 tax year for zip code 90631, filed in 2021:
Average Adjusted Gross Income (AGI) in 2020: $72,230 (Individual Income Tax Returns)
Here:
$72,230
State:
$95,910
Salary/wage: $60,988 (reported on 82.6% of returns)
Here:
$60,988
State:
$77,331
(% of AGI for various income ranges: 1289.6% for AGIs below $25k, 3981.0% for AGIs $25k-50k, 7717.6% for AGIs $50k-75k, 11075.6% for AGIs $75k-100k, 20629.2% for AGIs $100k-200k, 82458.3% for AGIs over 200k)
Taxable interest for individuals: $1,523 (reported on 34.0% of returns)
This zip code:
$1,523
California:
$2,294
(% of AGI for various income ranges: 15.2% for AGIs below $25k, 19.1% for AGIs $25k-50k, 40.6% for AGIs $50k-75k, 70.2% for AGIs $75k-100k, 154.3% for AGIs $100k-200k, 1908.7% for AGIs over 200k)
Ordinary dividends: $7,344 (reported on 14.8% of returns)
Here:
$7,344
State:
$10,949
(% of AGI for various income ranges: 17.6% for AGIs below $25k, 21.7% for AGIs $25k-50k, 54.3% for AGIs $50k-75k, 101.3% for AGIs $75k-100k, 250.6% for AGIs $100k-200k, 5280.9% for AGIs over 200k)
Net capital gain/loss in AGI: +$19,141 (reported on 15.2% of returns)
Here:
+$19,141
State:
+$49,306
(% of AGI for various income ranges: 7.7% for AGIs below $25k, 22.7% for AGIs $25k-50k, 65.6% for AGIs $50k-75k, 129.8% for AGIs $75k-100k, 476.7% for AGIs $100k-200k, 17430.0% for AGIs over 200k)
Profit/loss from business: +$12,857 (reported on 16.4% of returns)
Here:
+$12,857
State:
+$15,671
(% of AGI for various income ranges: 188.2% for AGIs below $25k, 193.0% for AGIs $25k-50k, 217.3% for AGIs $50k-75k, 273.8% for AGIs $75k-100k, 502.1% for AGIs $100k-200k, 4743.0% for AGIs over 200k)
Taxable individual retirement arrangement distribution: $21,319 (reported on 5.8% of returns)
90631:
$21,319
California:
$23,505
(% of AGI for various income ranges: 39.6% for AGIs below $25k, 53.9% for AGIs $25k-50k, 156.4% for AGIs $50k-75k, 278.8% for AGIs $75k-100k, 601.2% for AGIs $100k-200k, 2192.4% for AGIs over 200k)
Self-employed (Keogh) retirement plans: $32,473 (reported on 0.3% of returns)
90631:
$32,473
California:
$30,163
(% of AGI for various income ranges: 2.4% for AGIs below $25k, 22.5% for AGIs $100k-200k, 611.5% for AGIs over 200k)
Total itemized deductions: $33,107 (reported on 17.2% of returns)
Here:
$33,107
State:
$39,517
(% of AGI for various income ranges: 86.5% for AGIs below $25k, 198.8% for AGIs $25k-50k, 643.4% for AGIs $50k-75k, 1251.2% for AGIs $75k-100k, 2942.0% for AGIs $100k-200k, 11847.2% for AGIs over 200k)
Charity contributions: $6,929 (reported on 14.5% of returns)
Here:
$6,929
State:
$12,598
(% of AGI for various income ranges: 5.5% for AGIs below $25k, 20.9% for AGIs $25k-50k, 67.0% for AGIs $50k-75k, 177.4% for AGIs $75k-100k, 465.0% for AGIs $100k-200k, 3239.3% for AGIs over 200k)
Taxes paid: $8,824 (reported on 17.2% of returns)
90631:
$8,824
State:
$8,807
(% of AGI for various income ranges: 17.3% for AGIs below $25k, 49.7% for AGIs $25k-50k, 180.5% for AGIs $50k-75k, 382.9% for AGIs $75k-100k, 870.2% for AGIs $100k-200k, 2487.2% for AGIs over 200k)
Earned income credit: $2,037 (reported on 13.4% of returns)
Here:
$2,037
State:
$2,074
(% of AGI for various income ranges: 80.2% for AGIs below $25k, 62.0% for AGIs $25k-50k, 1.0% for AGIs $50k-75k)
Percentage of individuals using paid preparers for their 2020 taxes: 92.8%
Here:
93%
State:
92%
(% for various income ranges: 91.0% for AGIs below $25k, 93.4% for AGIs $25k-50k, 93.3% for AGIs $50k-75k, 93.8% for AGIs $75k-100k, 94.0% for AGIs $100k-200k, 93.9% for AGIs over 200k)
Averages for the 2012 tax year for zip code 90631, filed in 2013:
Average Adjusted Gross Income (AGI) in 2012: $59,693 (Individual Income Tax Returns)
Here:
$59,693
State:
$72,726
Salary/wage: $50,064 (reported on 83.8% of returns)
Here:
$50,064
State:
$59,079
(% of AGI for various income ranges: 76.4% for AGIs below $25k, 82.5% for AGIs $25k-50k, 80.1% for AGIs $50k-75k, 79.1% for AGIs $75k-100k, 77.4% for AGIs $100k-200k, 44.4% for AGIs over 200k)
Taxable interest for individuals: $1,580 (reported on 35.0% of returns)
This zip code:
$1,580
California:
$2,146
(% of AGI for various income ranges: 0.8% for AGIs below $25k, 0.5% for AGIs $25k-50k, 0.5% for AGIs $50k-75k, 0.6% for AGIs $75k-100k, 0.6% for AGIs $100k-200k, 1.9% for AGIs over 200k)
Ordinary dividends: $6,614 (reported on 14.7% of returns)
Here:
$6,614
State:
$9,308
(% of AGI for various income ranges: 1.0% for AGIs below $25k, 0.6% for AGIs $25k-50k, 0.7% for AGIs $50k-75k, 0.8% for AGIs $75k-100k, 1.3% for AGIs $100k-200k, 3.7% for AGIs over 200k)
Net capital gain/loss in AGI: +$11,696 (reported on 12.5% of returns)
Here:
+$11,696
State:
+$30,460
(% of AGI for various income ranges: 0.1% for AGIs $50k-75k, 0.3% for AGIs $75k-100k, 0.9% for AGIs $100k-200k, 8.6% for AGIs over 200k)
Profit/loss from business: +$14,384 (reported on 16.2% of returns)
Here:
+$14,384
State:
+$17,064
(% of AGI for various income ranges: 11.1% for AGIs below $25k, 4.4% for AGIs $25k-50k, 3.1% for AGIs $50k-75k, 2.3% for AGIs $75k-100k, 2.8% for AGIs $100k-200k, 3.6% for AGIs over 200k)
Taxable individual retirement arrangement distribution: $17,457 (reported on 7.8% of returns)
90631:
$17,457
California:
$19,557
(% of AGI for various income ranges: 1.9% for AGIs below $25k, 1.8% for AGIs $25k-50k, 2.4% for AGIs $50k-75k, 2.3% for AGIs $75k-100k, 3.1% for AGIs $100k-200k, 1.8% for AGIs over 200k)
Self-employment retirement plans: $26,067 (reported on 0.5% of returns)
90631:
$26,067
California:
$24,530
(% of AGI for various income ranges: 0.2% for AGIs $50k-75k, 0.1% for AGIs $100k-200k, 0.6% for AGIs over 200k)
Total itemized deductions: $29,632 (26% of AGI, reported on 35.7% of returns)
Here:
$29,632
State:
$34,004
Here:
25.5% of AGI
State:
22.7% of AGI
(% of AGI for various income ranges: 8.9% for AGIs below $25k, 12.3% for AGIs $25k-50k, 17.8% for AGIs $50k-75k, 21.3% for AGIs $75k-100k, 22.6% for AGIs $100k-200k, 17.2% for AGIs over 200k)
Charity contributions: $3,758 (reported on 30.3% of returns)
Here:
$3,758
State:
$4,659
(% of AGI for various income ranges: 0.5% for AGIs below $25k, 1.1% for AGIs $25k-50k, 1.8% for AGIs $50k-75k, 2.2% for AGIs $75k-100k, 2.6% for AGIs $100k-200k, 2.1% for AGIs over 200k)
Taxes paid: $10,806 (reported on 35.5% of returns)
90631:
$10,806
State:
$14,448
(% of AGI for various income ranges: 1.9% for AGIs below $25k, 2.7% for AGIs $25k-50k, 4.7% for AGIs $50k-75k, 6.4% for AGIs $75k-100k, 8.0% for AGIs $100k-200k, 9.5% for AGIs over 200k)
Earned income credit: $2,191 (reported on 17.0% of returns)
Here:
$2,191
State:
$2,286
(% of AGI for various income ranges: 5.5% for AGIs below $25k, 1.1% for AGIs $25k-50k)
Percentage of individuals using paid preparers for their 2012 taxes: 70.4%
Here:
70%
State:
64%
(% for various income ranges: 66.7% for AGIs below $25k, 70.4% for AGIs $25k-50k, 72.4% for AGIs $50k-75k, 73.0% for AGIs $75k-100k, 74.9% for AGIs $100k-200k, 83.7% for AGIs over 200k)
Averages for the 2004 tax year for zip code 90631, filed in 2005:
Average Adjusted Gross Income (AGI) in 2004: $52,733 (Individual Income Tax Returns)
Here:
$52,733
State:
$58,600
Salary/wage: $45,634 (reported on 84.9% of returns)
Here:
$45,634
State:
$49,455
(% of AGI for various income ranges: 219.8% for AGIs below $10k, 80.7% for AGIs $10k-25k, 84.2% for AGIs $25k-50k, 82.0% for AGIs $50k-75k, 81.1% for AGIs $75k-100k, 60.6% for AGIs over 100k)
Taxable interest for individuals: $1,939 (reported on 44.5% of returns)
This zip code:
$1,939
California:
$2,365
(% of AGI for various income ranges: 21.5% for AGIs below $10k, 1.7% for AGIs $10k-25k, 1.1% for AGIs $25k-50k, 1.1% for AGIs $50k-75k, 1.2% for AGIs $75k-100k, 1.9% for AGIs over 100k)
Taxable dividends: $2,961 (reported on 19.8% of returns)
Here:
$2,961
State:
$4,746
(% of AGI for various income ranges: 8.7% for AGIs below $10k, 1.0% for AGIs $10k-25k, 0.7% for AGIs $25k-50k, 0.8% for AGIs $50k-75k, 0.8% for AGIs $75k-100k, 1.4% for AGIs over 100k)
Net capital gain/loss: +$14,490 (reported on 16.5% of returns)
Here:
+$14,490
State:
+$23,418
(% of AGI for various income ranges: -1.9% for AGIs below $10k, 0.1% for AGIs $10k-25k, 0.3% for AGIs $25k-50k, 0.7% for AGIs $50k-75k, 1.2% for AGIs $75k-100k, 9.5% for AGIs over 100k)
Profit/loss from business: +$15,059 (reported on 15.6% of returns)
Here:
+$15,059
State:
+$16,826
(% of AGI for various income ranges: 13.0% for AGIs below $10k, 6.3% for AGIs $10k-25k, 3.9% for AGIs $25k-50k, 3.7% for AGIs $50k-75k, 3.2% for AGIs $75k-100k, 4.9% for AGIs over 100k)
IRA payment deduction: $3,233 (reported on 2.9% of returns)
90631:
$3,233
California:
$3,192
(% of AGI for various income ranges: 0.3% for AGIs below $10k, 0.2% for AGIs $10k-25k, 0.2% for AGIs $25k-50k, 0.2% for AGIs $50k-75k, 0.2% for AGIs $75k-100k, 0.2% for AGIs over 100k)
Self-employed pension: $16,643 (reported on 0.8% of returns)
Here:
$16,643
California:
$17,688
(% of AGI for various income ranges: 0.0% for AGIs $10k-25k, 0.1% for AGIs $25k-50k, 0.1% for AGIs $50k-75k, 0.1% for AGIs $75k-100k, 0.5% for AGIs over 100k)
Total itemized deductions: $26,571 (28% of AGI, reported on 39.6% of returns)
Here:
$26,571
State:
$28,113
Here:
27.6% of AGI
State:
25.3% of AGI
(% of AGI for various income ranges: 36.3% for AGIs below $10k, 10.8% for AGIs $10k-25k, 16.5% for AGIs $25k-50k, 21.9% for AGIs $50k-75k, 24.3% for AGIs $75k-100k, 20.9% for AGIs over 100k)
Charity contributions deductions: $3,727 (4% of AGI, reported on 35.5% of returns)
Here:
$3,727
State:
$3,923
Here:
3.7% of AGI
State:
3.3% of AGI
(% of AGI for various income ranges: 1.8% for AGIs below $10k, 0.8% for AGIs $10k-25k, 1.8% for AGIs $25k-50k, 2.5% for AGIs $50k-75k, 2.9% for AGIs $75k-100k, 3.1% for AGIs over 100k)
Total tax: $8,577 (reported on 73.6% of returns)
90631:
$8,577
State:
$10,761
(% of AGI for various income ranges: 8.2% for AGIs below $10k, 3.8% for AGIs $10k-25k, 6.0% for AGIs $25k-50k, 8.2% for AGIs $50k-75k, 9.2% for AGIs $75k-100k, 18.0% for AGIs over 100k)
Earned income credit: $1,748 (reported on 13.7% of returns)
Here:
$1,748
State:
$1,763
Percentage of individuals using paid preparers for their 2004 taxes: 71.9%
Here:
72%
State:
66%
(% for various income ranges: 63.2% for AGIs below $10k, 72.7% for AGIs $10k-25k, 72.1% for AGIs $25k-50k, 74.0% for AGIs $50k-75k, 73.2% for AGIs $75k-100k, 78.7% for AGIs over 100k)
Likely homosexual households (counted as self-reported same-sex unmarried-partner households)
Lesbian couples: 0.1% of all households
Gay men: 0.0% of all households
Household received Food Stamps/SNAP in the past 12 months: 2,556 Household did not receive Food Stamps/SNAP in the past 12 months: 20,054
Women who had a birth in the past 12 months: 593 (411 now married, 182 unmarried) Women who did not have a birth in the past 12 months: 16,186 (6,717 now married, 9,456 unmarried)
Housing units in zip code 90631 with a mortgage: 9,270 (934 second mortgage, 27 home equity loan, 759 both second mortgage and home equity loan) Houses without a mortgage: 46
Median monthly owner costs for units with a mortgage: $2,780 Median monthly owner costs for units without a mortgage: $789
Residents with income below the poverty level in 2022:
This zip code:
9.3%
Whole state:
12.2%
Residents with income below 50% of the poverty level in 2022:
This zip code:
4.9%
Whole state:
6.2%
Median number of rooms in houses and condos:
Here:
6.0
State:
6.0
Median number of rooms in apartments:
Here:
3.9
State:
3.9
Notable locations in this zip code not listed on our city pages
Notable locations in zip code 90631: Hacienda Golf Club (A), La Habra Branch Orange County Public Library (B), La Habra City Hall (C), Los Angeles County Fire Department Station 193 (D), Los Angeles County Fire Department Station 194 (E), City of La Habra Heights Fire Department Station 2 (F), City of La Habra Heights Fire Department Station 1 Headquarters (G), Los Angeles County Fire Department Station 192 (H), Los Angeles County Fire Department Station 191 (I), Children's Museum at La Habra (J). Display/hide their locations on the map
Shopping Centers: Sycamore Plaza Shopping Center (1), North Hills Plaza Shopping Center (2), Gateway Plaza Shopping Center (3), Central Plaza Shopping Center (4), La Habra Market Place Shopping Center (5). Display/hide their locations on the map
Churches in zip code 90631 include: Alta Vista Baptist Mission (A), Community Bible Church (B), Crossroads Community Church (C), Emanuel Lutheran Church (D), Family Bible Church (E), First Fundamental Bible Church (F), First Missionary Baptist Church (G), Heights Evangelical Free Church (H), Iglesia Biblica Fundamental (I). Display/hide their locations on the map
Parks in zip code 90631 include: La Bonita Park (1), Vista Grande Park (2), Hacienda Park (3), Corona Park (4), Descanso Park (5), El Centro Park (6), Estell Park (7), Guadalupe Park (8), Las Lomas Park (9). Display/hide their locations on the map
8,270 married couples with children.
3,137 single-parent households (1,067 men, 2,070 women).
52.6% of residents of 90631 zip code speak English at home.
36.4% of residents speak Spanish at home (66% very well, 17% well, 13% not well, 5% not at all).
1.8% of residents speak other Indo-European language at home (84% very well, 14% well, 1% not well, 1% not at all).
8.5% of residents speak Asian or Pacific Island language at home (43% very well, 32% well, 23% not well, 2% not at all).
0.6% of residents speak other language at home (64% very well, 16% well, 21% not well).
Foreign born population: 16,955 (24.8%) (56.7% of them are naturalized citizens)
This zip code:
24.8%
Whole state:
26.7%
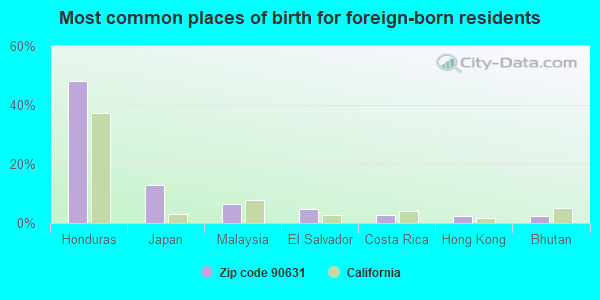
48%Honduras
13%Japan
6%Malaysia
5%El Salvador
3%Costa Rica
2%Hong Kong
2%Bhutan
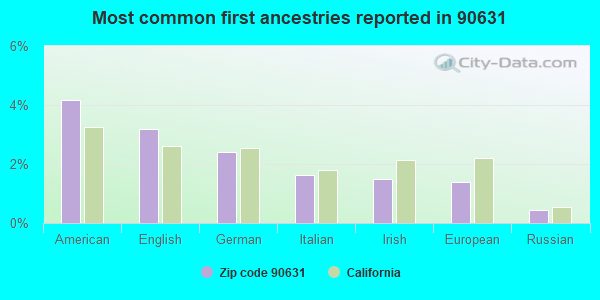
4%American
3%English
2%German
2%Italian
2%Irish
1%European
0%Russian
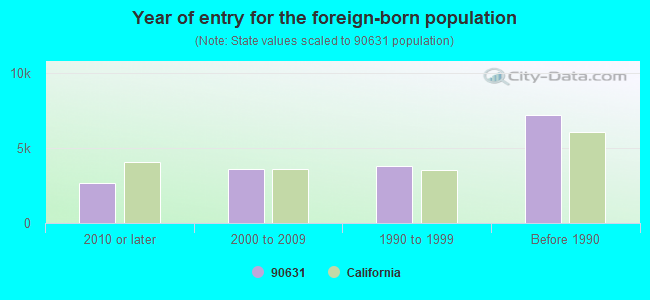
Year of entry for the foreign-born population
2,6522010 or later
3,6112000 to 2009
3,8041990 to 1999
7,212Before 1990
Major facilities with environmental interests located in this zip code:
LA HABRA HIGH SCHOOL (801 W HIGHLANDER AVE in LA HABRA, CA)
AIR MAJOR (AIRS/AFS) (National Center for Education Statistics) - STATE ID-3033362 CRITERIA AND HAZARDOUS AIR POLLUTANT INVENTORY (Inventory of air pollution sources) Business SIC classification: ELEMENTARY AND SECONDARY SCHOOLS Organizations: FULLERTON JOINT UNION HIGH (SCHOOL DISTRICT)
FOREIGN AUTOMOTIVE CENTER (2007 E LAMBERT in LA HABRA, CA) . Federal Facility
STATE MASTER (California - Hazardous Waste Tracking) - HAZARDOU WASTE PROGRAM Small Quantity Generators, between 100 kg and 1000 kg of hazardous waste/month (Resource Conservation and Recovery Act (tracking hazardous waste)) - notification Organizations: MARK CUMMINGS (CONTACT/OWNER)
Alternative names: FAR EAST AUTOMOTIVE
LE BARD & UNDERWOOD (321 E IMPERIAL HWY in LA HABRA, CA)
STATE MASTER (California - Hazardous Waste Tracking) - HAZARDOU WASTE PROGRAM Small Quantity Generators, between 100 kg and 1000 kg of hazardous waste/month (Resource Conservation and Recovery Act (tracking hazardous waste)) - notification Business NAICS classification: MOTORCYCLE DEALERS. Alternative names: LEBARD & UNDERWOOD INC
C AND C PRINTING INC (411 WEST IMPERIAL HIGHWAY UNIT B in LA HABRA, CA)
STATE MASTER (California - Hazardous Waste Tracking) - HAZARDOU WASTE PROGRAM Small Quantity Generators, between 100 kg and 1000 kg of hazardous waste/month (Resource Conservation and Recovery Act (tracking hazardous waste)) - notification Business NAICS classification: COMMERCIAL LITHOGRAPHIC PRINTING. Organizations: JOE CERJAK (CONTACT/OWNER)
ENTERPRISE SWISS (951 S CYPRESS UNIT B in LA HABRA, CA)
STATE MASTER (California - Hazardous Waste Tracking) - HAZARDOU WASTE PROGRAM Small Quantity Generators, between 100 kg and 1000 kg of hazardous waste/month (Resource Conservation and Recovery Act (tracking hazardous waste)) - notification
KMART NO 7697 (1000 W IMPERIAL in LA HABRA, CA)
STATE MASTER (California - Hazardous Waste Tracking) - HAZARDOU WASTE PROGRAM Small Quantity Generators, between 100 kg and 1000 kg of hazardous waste/month (Resource Conservation and Recovery Act (tracking hazardous waste)) - notification Organizations: WILLIAM J WADE (CONTACT/OWNER)
Alternative names: KMART SUPER #7697
NORTH HILLS CLEANERS (919 N HARBOR BLVD in LA HABRA, CA)
STATE MASTER (California - Hazardous Waste Tracking) - HAZARDOU WASTE PROGRAM Small Quantity Generators, between 100 kg and 1000 kg of hazardous waste/month (Resource Conservation and Recovery Act (tracking hazardous waste))
CHEVRON-LA HABRA (1300 BEACH BLVD in LA HABRA, CA)
(Resource Conservation and Recovery Act (tracking hazardous waste)) Large Quantity Generators, more that 1000 kg of hazardous waste/month (Resource Conservation and Recovery Act (tracking hazardous waste)) Organizations: CHEVRON USA INC (CONTACT/OWNER)
Alternative names: CHEVRON USA INC INTERIOR PROD AREA, CHEVRON USA INC. PRODUCTION DEPT.
F&B CLEANERS (1472 HARBOR in LA HABRA, CA)
STATE MASTER (California - Hazardous Waste Tracking) - HAZARDOU WASTE PROGRAM Small Quantity Generators, between 100 kg and 1000 kg of hazardous waste/month (Resource Conservation and Recovery Act (tracking hazardous waste))
FULLERTON UNION HS TRANS (1021 S LESLIE ST in LA HABRA, CA)
STATE MASTER (California - Hazardous Waste Tracking) - HAZARDOU WASTE PROGRAM Small Quantity Generators, between 100 kg and 1000 kg of hazardous waste/month (Resource Conservation and Recovery Act (tracking hazardous waste)) - notification
CHEVRON STATION NO 95833 (1151 S HARBOR BLVD in LA HABRA, CA)
STATE MASTER (California - Hazardous Waste Tracking) - HAZARDOU WASTE PROGRAM Small Quantity Generators, between 100 kg and 1000 kg of hazardous waste/month (Resource Conservation and Recovery Act (tracking hazardous waste)) - notification Organizations: CHEVRON PRODUCTS CO (CONTACT/OWNER)
CHEVRON STATION 9 2214 (1201 E LA HABRA BLVD in LA HABRA, CA)
STATE MASTER (California - Hazardous Waste Tracking) - HAZARDOU WASTE PROGRAM Small Quantity Generators, between 100 kg and 1000 kg of hazardous waste/month (Resource Conservation and Recovery Act (tracking hazardous waste)) - notification Organizations: CHEVRON USA PRODUCTS CO (CONTACT/OWNER)
Alternative names: CHEVRON 92214
IMPERIAL BODY SHOP (121 INDUSTRY AVE in LA HABRA, CA)
STATE MASTER (California - Hazardous Waste Tracking) - HAZARDOU WASTE PROGRAM Small Quantity Generators, between 100 kg and 1000 kg of hazardous waste/month (Resource Conservation and Recovery Act (tracking hazardous waste)) Business NAICS classification: AUTOMOTIVE BODY, PAINT, AND INTERIOR REPAIR AND MAINTENANCE.
Housing units lacking complete plumbing facilities: 0.3% Housing units lacking complete kitchen facilities: 3.0%
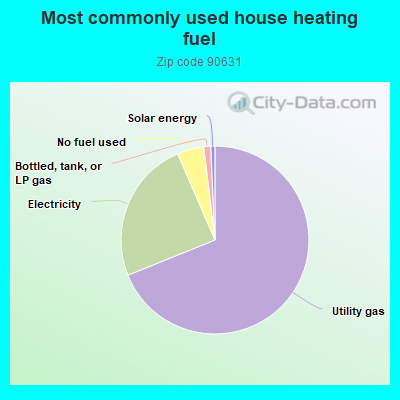
68.9%Utility gas
24.6%Electricity
4.6%No fuel used
1.2%Bottled, tank, or LP gas
0.7%Solar energy
Population in 1990: 59,113. Population change in the 1990s: +8,240 (+13.9%).
Place of birth for U.S.-born residents:
This state: 44,113
Northeast: 1,560
Midwest: 2,071
South: 1,774
West: 1,529
53% of the 90631 zip code residents lived in the same house 5 years ago. Out of people who lived in different houses, 57% lived in this county. Out of people who lived in different counties, 50% lived in California.
91% of the 90631 zip code residents lived in the same house 1 year ago. Out of people who lived in different houses, 40% moved from this county. Out of people who lived in different houses, 51% moved from different county within same state. Out of people who lived in different houses, 5% moved from different state. Out of people who lived in different houses, 6% moved from abroad.
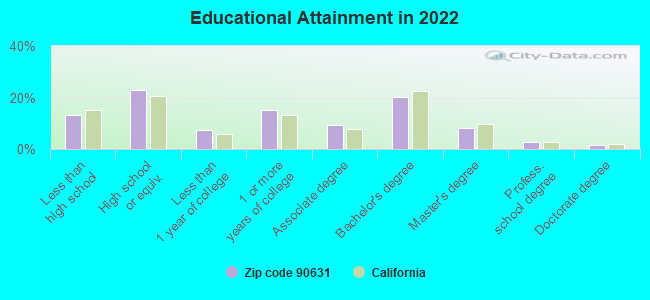
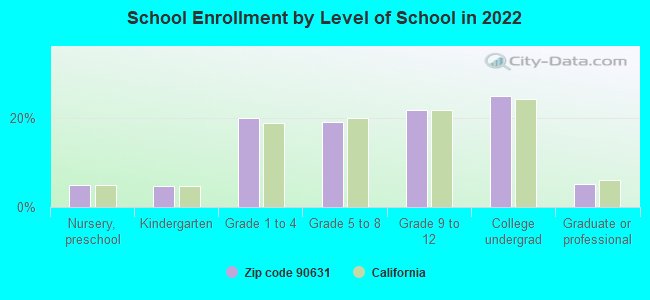
Private vs. public school enrollment:
Students in private schools in grades 1 to 8 (elementary and middle school): 800
Here:
12.3%
California:
10.5%
Students in private schools in grades 9 to 12 (high school): 276
Here:
7.6%
California:
8.5%
Students in private undergraduate colleges: 762
Here:
18.4%
California:
15.9%
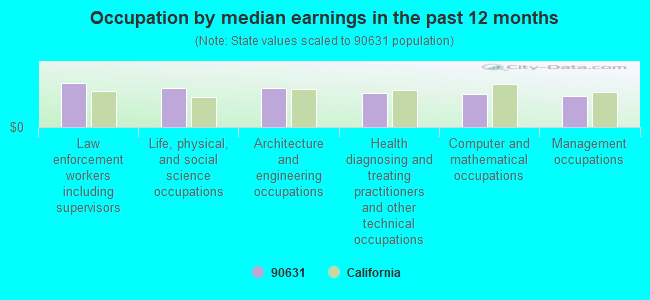
Occupation by median earnings in the past 12 months ($)
114,985Law enforcement workers including supervisors
102,810Life, physical, and social science occupations
100,661Architecture and engineering occupations
88,242Health diagnosing and treating practitioners and other technical occupations
86,334Computer and mathematical occupations
81,370Management occupations
Companies with federal contracts located in this zip code (LA HABRA, CA):
OSTOVANI & ASSOCIATES INC (481 E WHITTIER BLVD STE B; small business) : $2,031,946 in 10 contractsfrom 2002 to 2005
Contracts for Maintenance, Repair or Alteration of Real Property -- Other Utilities, Maintenance, Repair or Alteration of Real Property -- Miscellaneous Buildings, A&E Production Engineering Services (including Design and Control, and Building Programming), Maintenance, Repair or Alteration of Real Property -- Other Administrative Facilities and Service Buildings, and moreby Navy, Department of Veterans Affairs Signed by year:2000: $0; 2001: $0; 2002: $1,282,841; 2003: $64,700; 2004: $633,063; 2005: $51,342; 2006: $0.
Biggest contracts:
$987,954 with Navy for Maintenance, Repair or Alteration of Real Property -- Other Utilities. Signed on 2002-12-10. Completion date: 2003-06-23.
$594,911 with Navy for Maintenance, Repair or Alteration of Real Property -- Miscellaneous Buildings. Signed on 2004-12-03. Completion date: 2005-09-14.
$269,891 with Navy for Maintenance, Repair or Alteration of Real Property -- Other Utilities. Signed on 2002-09-24. Completion date: 2003-04-07.
$51,342 with Navy for Maintenance, Repair or Alteration of Real Property -- Miscellaneous Buildings. Signed on 2005-02-24. Completion date: 2005-09-14.
SHEPARD BROTHERS, INC (503 S CYPRESS ST; small business) : $297,187 in 48 contractsfrom 2003 to 2005
Contracts for Miscellaneous Chemical Specialties, Chemicals, Training Aids, Gases: Compressed and Liquefied by Navy Signed by year:2000: $0; 2001: $0; 2002: $0; 2003: $4,680; 2004: $32,311; 2005: $260,196; 2006: $0.
Biggest contracts:
$75,000 with Navy for Miscellaneous Chemical Specialties. Signed on 2005-08-19. Completion date: 2005-09-30.
$60,840 with Navy for Chemicals. Signed on 2004-01-06. Completion date: 2003-12-16.
$24,999, same as above.Signed on 2005-07-27. Completion date: 2005-09-30.
$14,022, same as above.Signed on 2005-04-05. Completion date: 2005-04-06.
R/C METALS ELECTRONIC INC (615 S PALM ST STE A; small business) : $169,522 in 2 contractsfrom 2002 to 2005
$169,477 with Navy for Radio and Television Communication Equipment, Except Airborne. Signed on 2002-09-27. Completion date: 2002-10-11.
$45 with Navy for Microcircuits, Electronic. Signed on 2005-06-14. Completion date: 2005-06-20.
MILAM, MARK (2420 STORY AVE; small business)
$99,800 with Air Force for Physical Sciences -- Management and Support (R&D). Signed on 2002-08-22. Completion date: 2003-08-31.
C & L DRILLING COMPANY (600 E LAMBERT ROAD; small business) : $36,983 in 3 contractsfrom 2001 to 2004
$34,665 with U.S. Army Corps of Engineers - civil program financing only for Well Drilling/Exploratory Services. Taking place in NV. Signed on 2001-06-28. Completion date: 2001-08-02.
$7,600, same as above.Signed on 2002-09-10. Completion date: 2001-08-02.
-$5,282 with Army for Well Drilling/Exploratory Services. Taking place in NV. Signed on 2004-11-17. Completion date: 2001-08-02.
PURSUIT TECHNOLOGY, INC (540 E JAMIE AVENUE; small business) : $8,839 in 2 contractsfrom 2001 to 2004
$5,839 with Navy for Vehicular Cab, Body, and Frame Structural Components. Signed on 2004-05-20. Completion date: 2004-05-24.
$3,000 with U.S. Fish and Wildlife Service for Engine Instruments. Signed on 2001-07-15. Completion date: 2001-08-15.
B & L DINERS INC (1150 SOUTH BEACH BLVD; small business)
$4,082 with Army for Other Professional Services. Signed on 2004-08-18. Completion date: 2004-08-18.
Top industries in this zip code by the number of employees in 2005:


 Nearest zip codes: 90603, 92835, 91745, 91748, 90604, 92833.