Estimated zip code population in 2022: 39,464 Zip code population in 2010: 39,407 Zip code population in 2000: 37,869
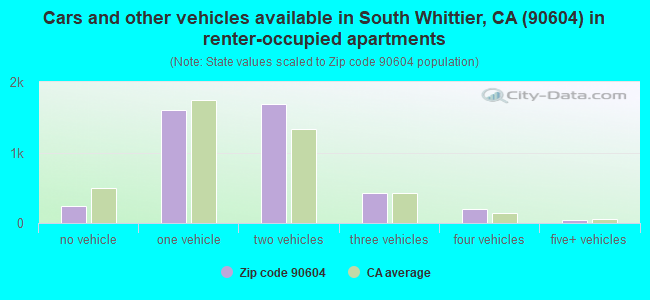
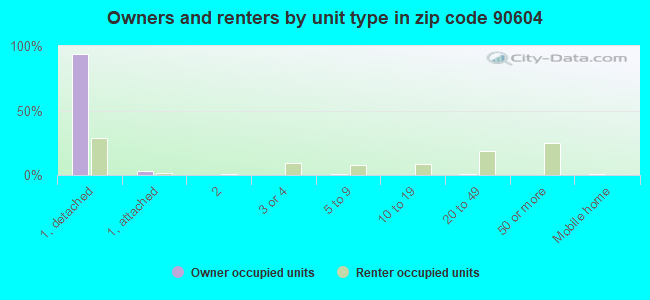
Houses and condos: 12,330 Renter-occupied apartments: 4,195
% of renters here:
35%
State:
44%
March 2022 cost of living index in zip code 90604: 132.5 (high, U.S. average is 100)
Land area: 4.3 sq. mi. Water area: 0.0 sq. mi.
Population density: 9,261 people per square mile
(high).
OSM Map
General Map
Google Map
MSN Map
OSM Map
General Map
Google Map
MSN Map
OSM Map
General Map
Google Map
MSN Map
OSM Map
General Map
Google Map
MSN Map
Please wait while loading the map...
Real estate property taxes paid for housing units in 2022:
This zip code:
0.6% ($4,413)
California:
0.7% ($4,831)
Median real estate property taxes paid for housing units with mortgages in 2022: $5,041 (0.7%) Median real estate property taxes paid for housing units with no mortgage in 2022: $3,140 (0.5%)
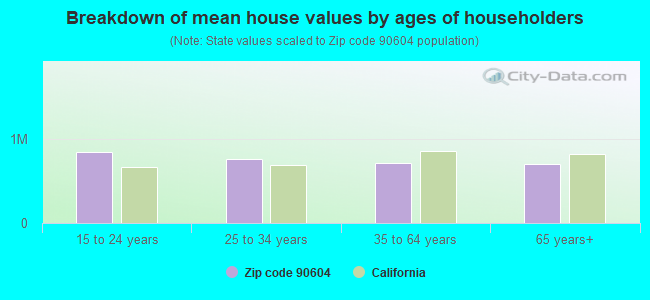
Estimated median house/condo value in 2022: $705,910
90604:
$705,910
California:
$715,900
According to our research of California and other state lists, there were 52 registered sex offenders living in 90604 zip code as of April 27, 2024. The ratio of all residents to sex offenders in zip code 90604 is 807 to 1. The ratio of registered sex offenders to all residents in this zip code is near the state average.
Median resident age:
This zip code:
36.1 years
California median age:
37.9 years
Average household size:
This zip code:
3.3 people
California:
2.8 people
Averages for the 2020 tax year for zip code 90604, filed in 2021:
Average Adjusted Gross Income (AGI) in 2020: $60,461 (Individual Income Tax Returns)
Here:
$60,461
State:
$95,910
Salary/wage: $57,920 (reported on 84.8% of returns)
Here:
$57,920
State:
$77,331
(% of AGI for various income ranges: 1230.5% for AGIs below $25k, 3884.3% for AGIs $25k-50k, 7414.3% for AGIs $50k-75k, 10843.0% for AGIs $75k-100k, 20409.0% for AGIs $100k-200k, 54132.5% for AGIs over 200k)
Taxable interest for individuals: $520 (reported on 33.1% of returns)
This zip code:
$520
California:
$2,294
(% of AGI for various income ranges: 10.7% for AGIs below $25k, 14.6% for AGIs $25k-50k, 17.9% for AGIs $50k-75k, 36.5% for AGIs $75k-100k, 63.6% for AGIs $100k-200k, 204.5% for AGIs over 200k)
Ordinary dividends: $2,222 (reported on 10.0% of returns)
Here:
$2,222
State:
$10,949
(% of AGI for various income ranges: 14.2% for AGIs below $25k, 14.5% for AGIs $25k-50k, 29.5% for AGIs $50k-75k, 37.1% for AGIs $75k-100k, 77.5% for AGIs $100k-200k, 371.0% for AGIs over 200k)
Net capital gain/loss in AGI: +$5,550 (reported on 10.7% of returns)
Here:
+$5,550
State:
+$49,306
(% of AGI for various income ranges: 3.2% for AGIs below $25k, 10.2% for AGIs $25k-50k, 30.5% for AGIs $50k-75k, 26.7% for AGIs $75k-100k, 176.9% for AGIs $100k-200k, 3481.5% for AGIs over 200k)
Profit/loss from business: +$6,970 (reported on 15.3% of returns)
Here:
+$6,970
State:
+$15,671
(% of AGI for various income ranges: 142.0% for AGIs below $25k, 132.1% for AGIs $25k-50k, 143.2% for AGIs $50k-75k, 163.0% for AGIs $75k-100k, 217.3% for AGIs $100k-200k, 616.5% for AGIs over 200k)
Taxable individual retirement arrangement distribution: $15,778 (reported on 5.0% of returns)
90604:
$15,778
California:
$23,505
(% of AGI for various income ranges: 35.5% for AGIs below $25k, 49.7% for AGIs $25k-50k, 121.3% for AGIs $50k-75k, 166.0% for AGIs $75k-100k, 329.7% for AGIs $100k-200k, 852.5% for AGIs over 200k)
Total itemized deductions: $29,869 (reported on 17.6% of returns)
Here:
$29,869
State:
$39,517
(% of AGI for various income ranges: 62.9% for AGIs below $25k, 178.6% for AGIs $25k-50k, 698.2% for AGIs $50k-75k, 1387.4% for AGIs $75k-100k, 2740.4% for AGIs $100k-200k, 6242.0% for AGIs over 200k)
Charity contributions: $4,979 (reported on 15.1% of returns)
Here:
$4,979
State:
$12,598
(% of AGI for various income ranges: 3.9% for AGIs below $25k, 21.0% for AGIs $25k-50k, 85.3% for AGIs $50k-75k, 175.4% for AGIs $75k-100k, 418.6% for AGIs $100k-200k, 1140.5% for AGIs over 200k)
Taxes paid: $8,893 (reported on 17.6% of returns)
90604:
$8,893
State:
$8,807
(% of AGI for various income ranges: 14.5% for AGIs below $25k, 44.1% for AGIs $25k-50k, 197.4% for AGIs $50k-75k, 436.0% for AGIs $75k-100k, 861.5% for AGIs $100k-200k, 1671.5% for AGIs over 200k)
Earned income credit: $2,042 (reported on 14.1% of returns)
Here:
$2,042
State:
$2,074
(% of AGI for various income ranges: 81.1% for AGIs below $25k, 60.4% for AGIs $25k-50k, 0.8% for AGIs $50k-75k)
Percentage of individuals using paid preparers for their 2020 taxes: 92.4%
Here:
92%
State:
92%
(% for various income ranges: 90.9% for AGIs below $25k, 92.9% for AGIs $25k-50k, 92.7% for AGIs $50k-75k, 93.1% for AGIs $75k-100k, 93.5% for AGIs $100k-200k, 94.2% for AGIs over 200k)
Averages for the 2012 tax year for zip code 90604, filed in 2013:
Average Adjusted Gross Income (AGI) in 2012: $48,209 (Individual Income Tax Returns)
Here:
$48,209
State:
$72,726
Salary/wage: $46,423 (reported on 86.3% of returns)
Here:
$46,423
State:
$59,079
(% of AGI for various income ranges: 76.0% for AGIs below $25k, 83.8% for AGIs $25k-50k, 83.3% for AGIs $50k-75k, 85.9% for AGIs $75k-100k, 86.6% for AGIs $100k-200k, 58.5% for AGIs over 200k)
Taxable interest for individuals: $482 (reported on 32.8% of returns)
This zip code:
$482
California:
$2,146
(% of AGI for various income ranges: 0.6% for AGIs below $25k, 0.4% for AGIs $25k-50k, 0.3% for AGIs $50k-75k, 0.3% for AGIs $75k-100k, 0.3% for AGIs $100k-200k, 0.2% for AGIs over 200k)
Ordinary dividends: $2,206 (reported on 10.4% of returns)
Here:
$2,206
State:
$9,308
(% of AGI for various income ranges: 0.6% for AGIs below $25k, 0.4% for AGIs $25k-50k, 0.4% for AGIs $50k-75k, 0.4% for AGIs $75k-100k, 0.5% for AGIs $100k-200k, 1.3% for AGIs over 200k)
Net capital gain/loss in AGI: +$1,390 (reported on 7.1% of returns)
Here:
+$1,390
State:
+$30,460
(% of AGI for various income ranges: 0.3% for AGIs $100k-200k, 3.2% for AGIs over 200k)
Profit/loss from business: +$8,845 (reported on 13.9% of returns)
Here:
+$8,845
State:
+$17,064
(% of AGI for various income ranges: 9.1% for AGIs below $25k, 3.2% for AGIs $25k-50k, 1.8% for AGIs $50k-75k, 1.8% for AGIs $75k-100k, 1.1% for AGIs $100k-200k)
Taxable individual retirement arrangement distribution: $12,186 (reported on 6.4% of returns)
90604:
$12,186
California:
$19,557
(% of AGI for various income ranges: 2.0% for AGIs below $25k, 1.8% for AGIs $25k-50k, 1.7% for AGIs $50k-75k, 1.2% for AGIs $75k-100k, 1.8% for AGIs $100k-200k)
Self-employment retirement plans: $11,300 (reported on 0.1% of returns)
90604:
$11,300
California:
$24,530
Total itemized deductions: $24,185 (29% of AGI, reported on 37.2% of returns)
Here:
$24,185
State:
$34,004
Here:
29.3% of AGI
State:
22.7% of AGI
(% of AGI for various income ranges: 8.9% for AGIs below $25k, 13.6% for AGIs $25k-50k, 19.8% for AGIs $50k-75k, 22.6% for AGIs $75k-100k, 21.9% for AGIs $100k-200k, 19.4% for AGIs over 200k)
Charity contributions: $2,720 (reported on 32.4% of returns)
Here:
$2,720
State:
$4,659
(% of AGI for various income ranges: 0.5% for AGIs below $25k, 1.3% for AGIs $25k-50k, 1.9% for AGIs $50k-75k, 2.3% for AGIs $75k-100k, 2.3% for AGIs $100k-200k, 1.4% for AGIs over 200k)
Taxes paid: $7,145 (reported on 37.1% of returns)
90604:
$7,145
State:
$14,448
(% of AGI for various income ranges: 1.7% for AGIs below $25k, 3.0% for AGIs $25k-50k, 5.2% for AGIs $50k-75k, 6.5% for AGIs $75k-100k, 7.5% for AGIs $100k-200k, 9.0% for AGIs over 200k)
Earned income credit: $2,172 (reported on 18.8% of returns)
Here:
$2,172
State:
$2,286
(% of AGI for various income ranges: 5.9% for AGIs below $25k, 1.2% for AGIs $25k-50k)
Percentage of individuals using paid preparers for their 2012 taxes: 69.8%
Here:
70%
State:
64%
(% for various income ranges: 66.0% for AGIs below $25k, 70.3% for AGIs $25k-50k, 72.4% for AGIs $50k-75k, 73.8% for AGIs $75k-100k, 74.5% for AGIs $100k-200k, 72.7% for AGIs over 200k)
Averages for the 2004 tax year for zip code 90604, filed in 2005:
Average Adjusted Gross Income (AGI) in 2004: $42,632 (Individual Income Tax Returns)
Here:
$42,632
State:
$58,600
Salary/wage: $41,721 (reported on 87.3% of returns)
Here:
$41,721
State:
$49,455
(% of AGI for various income ranges: 102.3% for AGIs below $10k, 78.3% for AGIs $10k-25k, 86.2% for AGIs $25k-50k, 86.8% for AGIs $50k-75k, 89.7% for AGIs $75k-100k, 81.6% for AGIs over 100k)
Taxable interest for individuals: $841 (reported on 42.3% of returns)
This zip code:
$841
California:
$2,365
(% of AGI for various income ranges: 3.6% for AGIs below $10k, 1.5% for AGIs $10k-25k, 0.7% for AGIs $25k-50k, 0.7% for AGIs $50k-75k, 0.5% for AGIs $75k-100k, 1.0% for AGIs over 100k)
Taxable dividends: $1,436 (reported on 14.3% of returns)
Here:
$1,436
State:
$4,746
(% of AGI for various income ranges: 1.9% for AGIs below $10k, 0.8% for AGIs $10k-25k, 0.4% for AGIs $25k-50k, 0.4% for AGIs $50k-75k, 0.4% for AGIs $75k-100k, 0.5% for AGIs over 100k)
Net capital gain/loss: +$6,309 (reported on 9.7% of returns)
Here:
+$6,309
State:
+$23,418
(% of AGI for various income ranges: -1.1% for AGIs below $10k, 0.3% for AGIs $10k-25k, 0.2% for AGIs $25k-50k, 0.2% for AGIs $50k-75k, 0.4% for AGIs $75k-100k, 5.5% for AGIs over 100k)
Profit/loss from business: +$8,857 (reported on 14.1% of returns)
Here:
+$8,857
State:
+$16,826
(% of AGI for various income ranges: 6.0% for AGIs below $10k, 6.8% for AGIs $10k-25k, 3.0% for AGIs $25k-50k, 2.2% for AGIs $50k-75k, 2.2% for AGIs $75k-100k, 2.2% for AGIs over 100k)
IRA payment deduction: $2,676 (reported on 2.0% of returns)
90604:
$2,676
California:
$3,192
(% of AGI for various income ranges: 0.2% for AGIs $10k-25k, 0.2% for AGIs $25k-50k, 0.1% for AGIs $50k-75k, 0.1% for AGIs $75k-100k, 0.1% for AGIs over 100k)
Self-employed pension: $10,333 (reported on 0.2% of returns)
Here:
$10,333
California:
$17,688
Total itemized deductions: $21,802 (32% of AGI, reported on 42.0% of returns)
Here:
$21,802
State:
$28,113
Here:
32.0% of AGI
State:
25.3% of AGI
(% of AGI for various income ranges: 15.2% for AGIs below $10k, 11.5% for AGIs $10k-25k, 18.7% for AGIs $25k-50k, 25.0% for AGIs $50k-75k, 24.9% for AGIs $75k-100k, 22.6% for AGIs over 100k)
Charity contributions deductions: $2,562 (4% of AGI, reported on 38.8% of returns)
Here:
$2,562
State:
$3,923
Here:
3.7% of AGI
State:
3.3% of AGI
(% of AGI for various income ranges: 0.7% for AGIs below $10k, 1.0% for AGIs $10k-25k, 1.9% for AGIs $25k-50k, 2.6% for AGIs $50k-75k, 2.8% for AGIs $75k-100k, 2.7% for AGIs over 100k)
Total tax: $4,520 (reported on 74.9% of returns)
90604:
$4,520
State:
$10,761
(% of AGI for various income ranges: 3.4% for AGIs below $10k, 4.0% for AGIs $10k-25k, 5.8% for AGIs $25k-50k, 7.1% for AGIs $50k-75k, 8.3% for AGIs $75k-100k, 12.7% for AGIs over 100k)
Earned income credit: $1,733 (reported on 15.0% of returns)
Here:
$1,733
State:
$1,763
Percentage of individuals using paid preparers for their 2004 taxes: 70.6%
Here:
71%
State:
66%
(% for various income ranges: 60.0% for AGIs below $10k, 70.1% for AGIs $10k-25k, 71.1% for AGIs $25k-50k, 75.5% for AGIs $50k-75k, 75.2% for AGIs $75k-100k, 75.8% for AGIs over 100k)
Likely homosexual households (counted as self-reported same-sex unmarried-partner households)
Lesbian couples: 0.3% of all households
Gay men: 0.1% of all households
Household received Food Stamps/SNAP in the past 12 months: 888 Household did not receive Food Stamps/SNAP in the past 12 months: 10,851
Women who had a birth in the past 12 months: 393 (312 now married, 80 unmarried) Women who did not have a birth in the past 12 months: 9,563 (3,861 now married, 5,699 unmarried)
Housing units in zip code 90604 with a mortgage: 5,538 (535 second mortgage, 22 home equity loan, 402 both second mortgage and home equity loan) Houses without a mortgage: 24
Median monthly owner costs for units with a mortgage: $2,673 Median monthly owner costs for units without a mortgage: $605
Residents with income below the poverty level in 2022:
This zip code:
5.9%
Whole state:
12.2%
Residents with income below 50% of the poverty level in 2022:
This zip code:
2.1%
Whole state:
6.2%
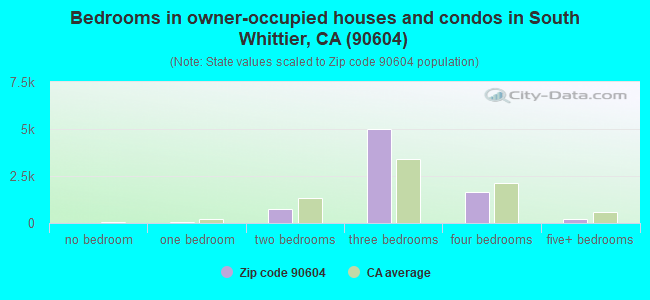
Median number of rooms in houses and condos:
Here:
5.7
State:
6.0
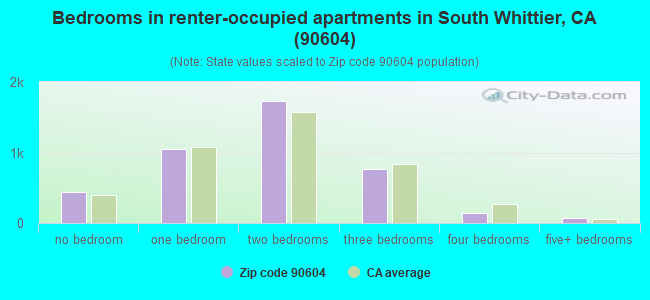
Median number of rooms in apartments:
Here:
3.9
State:
3.9
Notable locations in this zip code not listed on our city pages
Notable locations in zip code 90604: Candlewood Country Club (A), South Whittier Branch County of Los Angeles Public Library (B), Los Angeles County Fire Department Station 96 (C), Los Angeles County Fire Department Station 15 (D). Display/hide their locations on the map
Churches in zip code 90604 include: Tower of Praise Christian Center (A), Crossroads Community Church (B), La Mission De L'Esprit Saint (C), Lighthouse Christian Church (D), Young Eun Korean Presbyterian Church (E), Church of Jesus Christ of Latter Day Saints (F), Faith Community Church (G), Saint Andrew Lutheran Church (H), Saint Gregory The Great Church (I). Display/hide their locations on the map
6,049 married couples with children.
1,193 single-parent households (298 men, 895 women).
48.7% of residents of 90604 zip code speak English at home.
43.2% of residents speak Spanish at home (74% very well, 16% well, 7% not well, 3% not at all).
2.0% of residents speak other Indo-European language at home (66% very well, 23% well, 8% not well, 3% not at all).
5.4% of residents speak Asian or Pacific Island language at home (54% very well, 32% well, 12% not well, 2% not at all).
0.6% of residents speak other language at home (60% very well, 29% well, 11% not well).
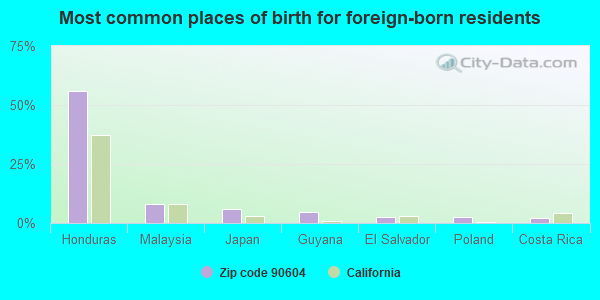
Foreign born population: 8,587 (21.8%) (61.7% of them are naturalized citizens)
Facilities with environmental interests located in this zip code:
EQUILON ENTERPRISES (11515 E SLAUSON in WHITTIER, CA) . Federal Facility
STATE MASTER (California - Hazardous Waste Tracking) - HAZARDOU WASTE PROGRAM Large Quantity Generators, more that 1000 kg of hazardous waste/month (Resource Conservation and Recovery Act (tracking hazardous waste)) Small Quantity Generators, between 100 kg and 1000 kg of hazardous waste/month (Resource Conservation and Recovery Act (tracking hazardous waste)) - notification Organizations: SHELL OIL PRODUCTS US (CONTACT/OPERATOR)
, EQUILON ENTERPRISES LLC DBA SHELL OIL PR (CONTACT/OWNER)
, EQUILON ENTERPRISES LLC DBA (CONTACT/OWNER)
Alternative names: SHELL, SHELL OIL CO, SHELL SERVICE STATION
MCKIBBEN (HOWARD J.) ELEMENTARY (10550 MILLS AVE. in WHITTIER, CA)
(National Center for Education Statistics) - STATE ID-6022818 Large Quantity Generators, more that 1000 kg of hazardous waste/month (Resource Conservation and Recovery Act (tracking hazardous waste)) Organizations: DAVID MORTON (CONTACT/OPERATOR)
, S WHITTIER SCHOOL DISTRICT (CONTACT/OWNER)
, SOUTH WHITTIER ELEMENTARY (SCHOOL DISTRICT)
Alternative names: MCKIBBEN ELEMENTARY
JAACS ENT INC (15119 MIDCREST DR in WHITTIER, CA)
STATE MASTER (California - Hazardous Waste Tracking) - HAZARDOU WASTE PROGRAM TRANSPORTER (Resource Conservation and Recovery Act (tracking hazardous waste)) Business NAICS classification: SOLID WASTE COLLECTION.; HAZARDOUS WASTE COLLECTION. Organizations: JOSE M SORIA (CONTACT/OWNER)
Alternative names: JOSE MARTIN SORIA
ECONO LUBE N TUNE (12320 VALLEY VIEW in WHITTIER, CA)
STATE MASTER (California - Hazardous Waste Tracking) - HAZARDOU WASTE PROGRAM Small Quantity Generators, between 100 kg and 1000 kg of hazardous waste/month (Resource Conservation and Recovery Act (tracking hazardous waste)) Business NAICS classification: ALL OTHER AUTOMOTIVE REPAIR AND MAINTENANCE.
LOZANO CHIRO CARE (14227 LEFFINGWELL RD in WHITTIER, CA)
STATE MASTER (California - Hazardous Waste Tracking) - HAZARDOU WASTE PROGRAM Small Quantity Generators, between 100 kg and 1000 kg of hazardous waste/month (Resource Conservation and Recovery Act (tracking hazardous waste)) - notification Organizations: SERGIO LOZANO D C (CONTACT/OWNER)
EL CAMINO HIGH (CONT.) (14625 KEESE DR. in WHITTIER, CA)
(National Center for Education Statistics) - STATE ID-1936475 Organizations: NORWALK-LA MIRADA UNIFIED (SCHOOL DISTRICT)
GRANADA MIDDLE (15337 LEMON DR. in WHITTIER, CA)
(National Center for Education Statistics) - STATE ID-6013015 Organizations: EAST WHITTIER CITY ELEMENTARY (SCHOOL DISTRICT)
HILLVIEW MIDDLE (10931 S. STAMY ROAD in WHITTIER, CA)
(National Center for Education Statistics) - STATE ID-6013023 Organizations: EAST WHITTIER CITY ELEMENTARY (SCHOOL DISTRICT)
LA COLIMA ELEMENTARY (11225 MILLER ROAD in WHITTIER, CA)
(National Center for Education Statistics) - STATE ID-6013031 Organizations: EAST WHITTIER CITY ELEMENTARY (SCHOOL DISTRICT)
MEADOW GREEN ELEMENTARY (12025 S. GROVEDALE DR. in WHITTIER, CA)
(National Center for Education Statistics) - STATE ID-6020192 Organizations: LOWELL JOINT (SCHOOL DISTRICT)
CERES ELEMENTARY (10601 S. CERES AVE. in WHITTIER, CA)
(National Center for Education Statistics) - STATE ID-6012975 Organizations: EAST WHITTIER CITY ELEMENTARY (SCHOOL DISTRICT)
MONTE VISTA MIDDLE (12000 LOMA DR. in WHITTIER, CA)
(National Center for Education Statistics) - STATE ID-6102966 Organizations: SOUTH WHITTIER ELEMENTARY (SCHOOL DISTRICT)
CALIFORNIA HIGH (9800 S. MILLS AVE. in WHITTIER, CA)
(National Center for Education Statistics) - STATE ID-1931302 Organizations: WHITTIER UNION HIGH (SCHOOL DISTRICT)
Housing units lacking complete plumbing facilities: 0.2% Housing units lacking complete kitchen facilities: 2.1%
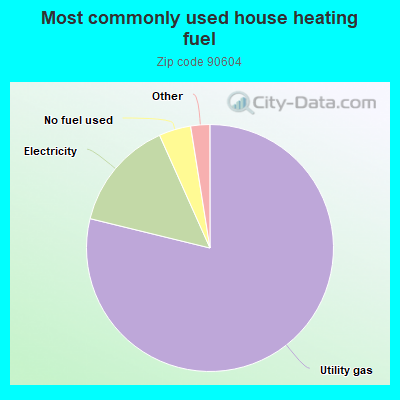
78.9%Utility gas
14.5%Electricity
4.2%No fuel used
1.0%Bottled, tank, or LP gas
0.8%Solar energy
Population in 1990: 36,371. Population change in the 1990s: +1,498 (+4.1%).
Place of birth for U.S.-born residents:
This state: 27,867
Northeast: 642
Midwest: 699
South: 720
West: 728
57% of the 90604 zip code residents lived in the same house 5 years ago. Out of people who lived in different houses, 79% lived in this county. Out of people who lived in different counties, 50% lived in California.
94% of the 90604 zip code residents lived in the same house 1 year ago. Out of people who lived in different houses, 74% moved from this county. Out of people who lived in different houses, 20% moved from different county within same state. Out of people who lived in different houses, 3% moved from different state. Out of people who lived in different houses, 5% moved from abroad.
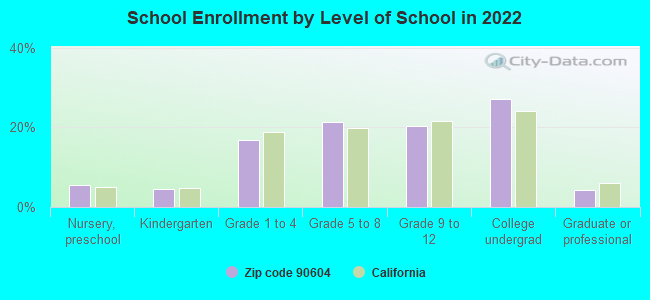
Private vs. public school enrollment:
Students in private schools in grades 1 to 8 (elementary and middle school): 363
Here:
9.1%
California:
10.5%
Students in private schools in grades 9 to 12 (high school): 121
Here:
5.6%
California:
8.5%
Students in private undergraduate colleges: 652
Here:
22.8%
California:
15.9%
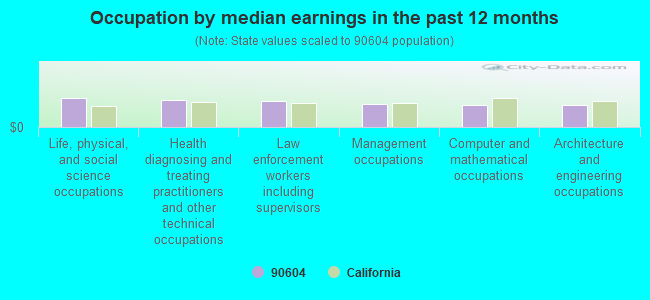
Occupation by median earnings in the past 12 months ($)
180,065Life, physical, and social science occupations
120,670Law enforcement workers including supervisors
97,904Health diagnosing and treating practitioners and other technical occupations
84,678Computer and mathematical occupations
80,056Management occupations
73,389Business and financial operations occupations
Companies with federal contracts located in this zip code:
RAY GOULD (15051 LEFFINGWELL RD STE 1 in WHITTIER, CA; small business) : $231,769 in 17 contractsfrom 2000 to 2006
Contracts for Bearings, Antifriction, Unmounted, Hardware, Commercial, Pipe, Tube and Rigid Tubing, Valves, Nonpowered, and moreby Defense Logistics Agency, Army, U.S. Army Corps of Engineers - civil program financing only Signed by year:2000: $28,400; 2001: $106,903; 2002: $0; 2003: $0; 2004: $0; 2005: $83,416; 2006: $13,050.
Biggest contracts:
$77,220 with Defense Logistics Agency for Bearings, Antifriction, Unmounted. Signed on 2001-05-25. Completion date: 2001-11-01.
$29,683 with Army for Hardware, Commercial. Signed on 2001-04-26. Completion date: 2001-05-22.
$28,400 with U.S. Army Corps of Engineers - civil program financing only for Pipe, Tube and Rigid Tubing. Signed on 2000-11-01. Completion date: 2000-12-29.
$13,050 with Defense Logistics Agency for Valves, Nonpowered. Signed on 2006-04-29. Completion date: 2006-05-28.
Top industries in this zip code by the number of employees in 2005:
Educational Services: Colleges, Universities, and Professional Schools (250-499 employees: 1 establishment, 10-19 employees: 1 establishment)


 Nearest zip codes: 90605, 90603, 90638, 90602, 90670, 90621.
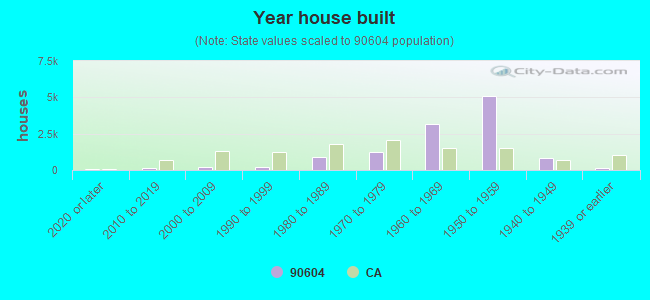


 . Federal Facility