La Mirada, California Submit your own pictures of this city and show them to the world
OSM Map
General Map
Google Map
MSN Map
OSM Map
General Map
Google Map
MSN Map
OSM Map
General Map
Google Map
MSN Map
OSM Map
General Map
Google Map
MSN Map
Please wait while loading the map...
Population in 2022: 46,323 (100% urban, 0% rural). Population change since 2000: -1.0%Males: 23,020 Females: 23,303
March 2022 cost of living index in La Mirada: 137.1 (high, U.S. average is 100) Percentage of residents living in poverty in 2022: 6.1%for White Non-Hispanic residents , 7.1% for Black residents , 5.4% for Hispanic or Latino residents , 2.1% for American Indian residents , 85.0% for Native Hawaiian and other Pacific Islander residents , 6.0% for other race residents , 6.9% for two or more races residents )
Profiles of local businesses
Business Search - 14 Million verified businesses
Data:
Median household income ($)
Median household income (% change since 2000)
Household income diversity
Ratio of average income to average house value (%)
Ratio of average income to average rent
Median household income ($) - White
Median household income ($) - Black or African American
Median household income ($) - Asian
Median household income ($) - Hispanic or Latino
Median household income ($) - American Indian and Alaska Native
Median household income ($) - Multirace
Median household income ($) - Other Race
Median household income for houses/condos with a mortgage ($)
Median household income for apartments without a mortgage ($)
Races - White alone (%)
Races - White alone (% change since 2000)
Races - Black alone (%)
Races - Black alone (% change since 2000)
Races - American Indian alone (%)
Races - American Indian alone (% change since 2000)
Races - Asian alone (%)
Races - Asian alone (% change since 2000)
Races - Hispanic (%)
Races - Hispanic (% change since 2000)
Races - Native Hawaiian and Other Pacific Islander alone (%)
Races - Native Hawaiian and Other Pacific Islander alone (% change since 2000)
Races - Two or more races (%)
Races - Two or more races (% change since 2000)
Races - Other race alone (%)
Races - Other race alone (% change since 2000)
Racial diversity
Unemployment (%)
Unemployment (% change since 2000)
Unemployment (%) - White
Unemployment (%) - Black or African American
Unemployment (%) - Asian
Unemployment (%) - Hispanic or Latino
Unemployment (%) - American Indian and Alaska Native
Unemployment (%) - Multirace
Unemployment (%) - Other Race
Population density (people per square mile)
Population - Males (%)
Population - Females (%)
Population - Males (%) - White
Population - Males (%) - Black or African American
Population - Males (%) - Asian
Population - Males (%) - Hispanic or Latino
Population - Males (%) - American Indian and Alaska Native
Population - Males (%) - Multirace
Population - Males (%) - Other Race
Population - Females (%) - White
Population - Females (%) - Black or African American
Population - Females (%) - Asian
Population - Females (%) - Hispanic or Latino
Population - Females (%) - American Indian and Alaska Native
Population - Females (%) - Multirace
Population - Females (%) - Other Race
Coronavirus confirmed cases (Apr 27, 2024)
Deaths caused by coronavirus (Apr 27, 2024)
Coronavirus confirmed cases (per 100k population) (Apr 27, 2024)
Deaths caused by coronavirus (per 100k population) (Apr 27, 2024)
Daily increase in number of cases (Apr 27, 2024)
Weekly increase in number of cases (Apr 27, 2024)
Cases doubled (in days) (Apr 27, 2024)
Hospitalized patients (Apr 18, 2022)
Negative test results (Apr 18, 2022)
Total test results (Apr 18, 2022)
COVID Vaccine doses distributed (per 100k population) (Sep 19, 2023)
COVID Vaccine doses administered (per 100k population) (Sep 19, 2023)
COVID Vaccine doses distributed (Sep 19, 2023)
COVID Vaccine doses administered (Sep 19, 2023)
Likely homosexual households (%)
Likely homosexual households (% change since 2000)
Likely homosexual households - Lesbian couples (%)
Likely homosexual households - Lesbian couples (% change since 2000)
Likely homosexual households - Gay men (%)
Likely homosexual households - Gay men (% change since 2000)
Cost of living index
Median gross rent ($)
Median contract rent ($)
Median monthly housing costs ($)
Median house or condo value ($)
Median house or condo value ($ change since 2000)
Mean house or condo value by units in structure - 1, detached ($)
Mean house or condo value by units in structure - 1, attached ($)
Mean house or condo value by units in structure - 2 ($)
Mean house or condo value by units in structure by units in structure - 3 or 4 ($)
Mean house or condo value by units in structure - 5 or more ($)
Mean house or condo value by units in structure - Boat, RV, van, etc. ($)
Mean house or condo value by units in structure - Mobile home ($)
Median house or condo value ($) - White
Median house or condo value ($) - Black or African American
Median house or condo value ($) - Asian
Median house or condo value ($) - Hispanic or Latino
Median house or condo value ($) - American Indian and Alaska Native
Median house or condo value ($) - Multirace
Median house or condo value ($) - Other Race
Median resident age
Resident age diversity
Median resident age - Males
Median resident age - Females
Median resident age - White
Median resident age - Black or African American
Median resident age - Asian
Median resident age - Hispanic or Latino
Median resident age - American Indian and Alaska Native
Median resident age - Multirace
Median resident age - Other Race
Median resident age - Males - White
Median resident age - Males - Black or African American
Median resident age - Males - Asian
Median resident age - Males - Hispanic or Latino
Median resident age - Males - American Indian and Alaska Native
Median resident age - Males - Multirace
Median resident age - Males - Other Race
Median resident age - Females - White
Median resident age - Females - Black or African American
Median resident age - Females - Asian
Median resident age - Females - Hispanic or Latino
Median resident age - Females - American Indian and Alaska Native
Median resident age - Females - Multirace
Median resident age - Females - Other Race
Commute - mean travel time to work (minutes)
Travel time to work - Less than 5 minutes (%)
Travel time to work - Less than 5 minutes (% change since 2000)
Travel time to work - 5 to 9 minutes (%)
Travel time to work - 5 to 9 minutes (% change since 2000)
Travel time to work - 10 to 19 minutes (%)
Travel time to work - 10 to 19 minutes (% change since 2000)
Travel time to work - 20 to 29 minutes (%)
Travel time to work - 20 to 29 minutes (% change since 2000)
Travel time to work - 30 to 39 minutes (%)
Travel time to work - 30 to 39 minutes (% change since 2000)
Travel time to work - 40 to 59 minutes (%)
Travel time to work - 40 to 59 minutes (% change since 2000)
Travel time to work - 60 to 89 minutes (%)
Travel time to work - 60 to 89 minutes (% change since 2000)
Travel time to work - 90 or more minutes (%)
Travel time to work - 90 or more minutes (% change since 2000)
Marital status - Never married (%)
Marital status - Now married (%)
Marital status - Separated (%)
Marital status - Widowed (%)
Marital status - Divorced (%)
Median family income ($)
Median family income (% change since 2000)
Median non-family income ($)
Median non-family income (% change since 2000)
Median per capita income ($)
Median per capita income (% change since 2000)
Median family income ($) - White
Median family income ($) - Black or African American
Median family income ($) - Asian
Median family income ($) - Hispanic or Latino
Median family income ($) - American Indian and Alaska Native
Median family income ($) - Multirace
Median family income ($) - Other Race
Median year house/condo built
Median year apartment built
Year house built - Built 2005 or later (%)
Year house built - Built 2000 to 2004 (%)
Year house built - Built 1990 to 1999 (%)
Year house built - Built 1980 to 1989 (%)
Year house built - Built 1970 to 1979 (%)
Year house built - Built 1960 to 1969 (%)
Year house built - Built 1950 to 1959 (%)
Year house built - Built 1940 to 1949 (%)
Year house built - Built 1939 or earlier (%)
Average household size
Household density (households per square mile)
Average household size - White
Average household size - Black or African American
Average household size - Asian
Average household size - Hispanic or Latino
Average household size - American Indian and Alaska Native
Average household size - Multirace
Average household size - Other Race
Occupied housing units (%)
Vacant housing units (%)
Owner occupied housing units (%)
Renter occupied housing units (%)
Vacancy status - For rent (%)
Vacancy status - For sale only (%)
Vacancy status - Rented or sold, not occupied (%)
Vacancy status - For seasonal, recreational, or occasional use (%)
Vacancy status - For migrant workers (%)
Vacancy status - Other vacant (%)
Residents with income below the poverty level (%)
Residents with income below 50% of the poverty level (%)
Children below poverty level (%)
Poor families by family type - Married-couple family (%)
Poor families by family type - Male, no wife present (%)
Poor families by family type - Female, no husband present (%)
Poverty status for native-born residents (%)
Poverty status for foreign-born residents (%)
Poverty among high school graduates not in families (%)
Poverty among people who did not graduate high school not in families (%)
Residents with income below the poverty level (%) - White
Residents with income below the poverty level (%) - Black or African American
Residents with income below the poverty level (%) - Asian
Residents with income below the poverty level (%) - Hispanic or Latino
Residents with income below the poverty level (%) - American Indian and Alaska Native
Residents with income below the poverty level (%) - Multirace
Residents with income below the poverty level (%) - Other Race
Air pollution - Air Quality Index (AQI)
Air pollution - CO
Air pollution - NO2
Air pollution - SO2
Air pollution - Ozone
Air pollution - PM10
Air pollution - PM25
Air pollution - Pb
Crime - Murders per 100,000 population
Crime - Rapes per 100,000 population
Crime - Robberies per 100,000 population
Crime - Assaults per 100,000 population
Crime - Burglaries per 100,000 population
Crime - Thefts per 100,000 population
Crime - Auto thefts per 100,000 population
Crime - Arson per 100,000 population
Crime - City-data.com crime index
Crime - Violent crime index
Crime - Property crime index
Crime - Murders per 100,000 population (5 year average)
Crime - Rapes per 100,000 population (5 year average)
Crime - Robberies per 100,000 population (5 year average)
Crime - Assaults per 100,000 population (5 year average)
Crime - Burglaries per 100,000 population (5 year average)
Crime - Thefts per 100,000 population (5 year average)
Crime - Auto thefts per 100,000 population (5 year average)
Crime - Arson per 100,000 population (5 year average)
Crime - City-data.com crime index (5 year average)
Crime - Violent crime index (5 year average)
Crime - Property crime index (5 year average)
1996 Presidential Elections Results (%) - Democratic Party (Clinton)
1996 Presidential Elections Results (%) - Republican Party (Dole)
1996 Presidential Elections Results (%) - Other
2000 Presidential Elections Results (%) - Democratic Party (Gore)
2000 Presidential Elections Results (%) - Republican Party (Bush)
2000 Presidential Elections Results (%) - Other
2004 Presidential Elections Results (%) - Democratic Party (Kerry)
2004 Presidential Elections Results (%) - Republican Party (Bush)
2004 Presidential Elections Results (%) - Other
2008 Presidential Elections Results (%) - Democratic Party (Obama)
2008 Presidential Elections Results (%) - Republican Party (McCain)
2008 Presidential Elections Results (%) - Other
2012 Presidential Elections Results (%) - Democratic Party (Obama)
2012 Presidential Elections Results (%) - Republican Party (Romney)
2012 Presidential Elections Results (%) - Other
2016 Presidential Elections Results (%) - Democratic Party (Clinton)
2016 Presidential Elections Results (%) - Republican Party (Trump)
2016 Presidential Elections Results (%) - Other
2020 Presidential Elections Results (%) - Democratic Party (Biden)
2020 Presidential Elections Results (%) - Republican Party (Trump)
2020 Presidential Elections Results (%) - Other
Ancestries Reported - Arab (%)
Ancestries Reported - Czech (%)
Ancestries Reported - Danish (%)
Ancestries Reported - Dutch (%)
Ancestries Reported - English (%)
Ancestries Reported - French (%)
Ancestries Reported - French Canadian (%)
Ancestries Reported - German (%)
Ancestries Reported - Greek (%)
Ancestries Reported - Hungarian (%)
Ancestries Reported - Irish (%)
Ancestries Reported - Italian (%)
Ancestries Reported - Lithuanian (%)
Ancestries Reported - Norwegian (%)
Ancestries Reported - Polish (%)
Ancestries Reported - Portuguese (%)
Ancestries Reported - Russian (%)
Ancestries Reported - Scotch-Irish (%)
Ancestries Reported - Scottish (%)
Ancestries Reported - Slovak (%)
Ancestries Reported - Subsaharan African (%)
Ancestries Reported - Swedish (%)
Ancestries Reported - Swiss (%)
Ancestries Reported - Ukrainian (%)
Ancestries Reported - United States (%)
Ancestries Reported - Welsh (%)
Ancestries Reported - West Indian (%)
Ancestries Reported - Other (%)
Educational Attainment - No schooling completed (%)
Educational Attainment - Less than high school (%)
Educational Attainment - High school or equivalent (%)
Educational Attainment - Less than 1 year of college (%)
Educational Attainment - 1 or more years of college (%)
Educational Attainment - Associate degree (%)
Educational Attainment - Bachelor's degree (%)
Educational Attainment - Master's degree (%)
Educational Attainment - Professional school degree (%)
Educational Attainment - Doctorate degree (%)
School Enrollment - Nursery, preschool (%)
School Enrollment - Kindergarten (%)
School Enrollment - Grade 1 to 4 (%)
School Enrollment - Grade 5 to 8 (%)
School Enrollment - Grade 9 to 12 (%)
School Enrollment - College undergrad (%)
School Enrollment - Graduate or professional (%)
School Enrollment - Not enrolled in school (%)
School enrollment - Public schools (%)
School enrollment - Private schools (%)
School enrollment - Not enrolled (%)
Median number of rooms in houses and condos
Median number of rooms in apartments
Housing units lacking complete plumbing facilities (%)
Housing units lacking complete kitchen facilities (%)
Density of houses
Urban houses (%)
Rural houses (%)
Households with people 60 years and over (%)
Households with people 65 years and over (%)
Households with people 75 years and over (%)
Households with one or more nonrelatives (%)
Households with no nonrelatives (%)
Population in households (%)
Family households (%)
Nonfamily households (%)
Population in families (%)
Family households with own children (%)
Median number of bedrooms in owner occupied houses
Mean number of bedrooms in owner occupied houses
Median number of bedrooms in renter occupied houses
Mean number of bedrooms in renter occupied houses
Median number of vehichles in owner occupied houses
Mean number of vehichles in owner occupied houses
Median number of vehichles in renter occupied houses
Mean number of vehichles in renter occupied houses
Mortgage status - with mortgage (%)
Mortgage status - with second mortgage (%)
Mortgage status - with home equity loan (%)
Mortgage status - with both second mortgage and home equity loan (%)
Mortgage status - without a mortgage (%)
Average family size
Average family size - White
Average family size - Black or African American
Average family size - Asian
Average family size - Hispanic or Latino
Average family size - American Indian and Alaska Native
Average family size - Multirace
Average family size - Other Race
Geographical mobility - Same house 1 year ago (%)
Geographical mobility - Moved within same county (%)
Geographical mobility - Moved from different county within same state (%)
Geographical mobility - Moved from different state (%)
Geographical mobility - Moved from abroad (%)
Place of birth - Born in state of residence (%)
Place of birth - Born in other state (%)
Place of birth - Native, outside of US (%)
Place of birth - Foreign born (%)
Housing units in structures - 1, detached (%)
Housing units in structures - 1, attached (%)
Housing units in structures - 2 (%)
Housing units in structures - 3 or 4 (%)
Housing units in structures - 5 to 9 (%)
Housing units in structures - 10 to 19 (%)
Housing units in structures - 20 to 49 (%)
Housing units in structures - 50 or more (%)
Housing units in structures - Mobile home (%)
Housing units in structures - Boat, RV, van, etc. (%)
House/condo owner moved in on average (years ago)
Renter moved in on average (years ago)
Year householder moved into unit - Moved in 1999 to March 2000 (%)
Year householder moved into unit - Moved in 1995 to 1998 (%)
Year householder moved into unit - Moved in 1990 to 1994 (%)
Year householder moved into unit - Moved in 1980 to 1989 (%)
Year householder moved into unit - Moved in 1970 to 1979 (%)
Year householder moved into unit - Moved in 1969 or earlier (%)
Means of transportation to work - Drove car alone (%)
Means of transportation to work - Carpooled (%)
Means of transportation to work - Public transportation (%)
Means of transportation to work - Bus or trolley bus (%)
Means of transportation to work - Streetcar or trolley car (%)
Means of transportation to work - Subway or elevated (%)
Means of transportation to work - Railroad (%)
Means of transportation to work - Ferryboat (%)
Means of transportation to work - Taxicab (%)
Means of transportation to work - Motorcycle (%)
Means of transportation to work - Bicycle (%)
Means of transportation to work - Walked (%)
Means of transportation to work - Other means (%)
Working at home (%)
Industry diversity
Most Common Industries - Agriculture, forestry, fishing and hunting, and mining (%)
Most Common Industries - Agriculture, forestry, fishing and hunting (%)
Most Common Industries - Mining, quarrying, and oil and gas extraction (%)
Most Common Industries - Construction (%)
Most Common Industries - Manufacturing (%)
Most Common Industries - Wholesale trade (%)
Most Common Industries - Retail trade (%)
Most Common Industries - Transportation and warehousing, and utilities (%)
Most Common Industries - Transportation and warehousing (%)
Most Common Industries - Utilities (%)
Most Common Industries - Information (%)
Most Common Industries - Finance and insurance, and real estate and rental and leasing (%)
Most Common Industries - Finance and insurance (%)
Most Common Industries - Real estate and rental and leasing (%)
Most Common Industries - Professional, scientific, and management, and administrative and waste management services (%)
Most Common Industries - Professional, scientific, and technical services (%)
Most Common Industries - Management of companies and enterprises (%)
Most Common Industries - Administrative and support and waste management services (%)
Most Common Industries - Educational services, and health care and social assistance (%)
Most Common Industries - Educational services (%)
Most Common Industries - Health care and social assistance (%)
Most Common Industries - Arts, entertainment, and recreation, and accommodation and food services (%)
Most Common Industries - Arts, entertainment, and recreation (%)
Most Common Industries - Accommodation and food services (%)
Most Common Industries - Other services, except public administration (%)
Most Common Industries - Public administration (%)
Occupation diversity
Most Common Occupations - Management, business, science, and arts occupations (%)
Most Common Occupations - Management, business, and financial occupations (%)
Most Common Occupations - Management occupations (%)
Most Common Occupations - Business and financial operations occupations (%)
Most Common Occupations - Computer, engineering, and science occupations (%)
Most Common Occupations - Computer and mathematical occupations (%)
Most Common Occupations - Architecture and engineering occupations (%)
Most Common Occupations - Life, physical, and social science occupations (%)
Most Common Occupations - Education, legal, community service, arts, and media occupations (%)
Most Common Occupations - Community and social service occupations (%)
Most Common Occupations - Legal occupations (%)
Most Common Occupations - Education, training, and library occupations (%)
Most Common Occupations - Arts, design, entertainment, sports, and media occupations (%)
Most Common Occupations - Healthcare practitioners and technical occupations (%)
Most Common Occupations - Health diagnosing and treating practitioners and other technical occupations (%)
Most Common Occupations - Health technologists and technicians (%)
Most Common Occupations - Service occupations (%)
Most Common Occupations - Healthcare support occupations (%)
Most Common Occupations - Protective service occupations (%)
Most Common Occupations - Fire fighting and prevention, and other protective service workers including supervisors (%)
Most Common Occupations - Law enforcement workers including supervisors (%)
Most Common Occupations - Food preparation and serving related occupations (%)
Most Common Occupations - Building and grounds cleaning and maintenance occupations (%)
Most Common Occupations - Personal care and service occupations (%)
Most Common Occupations - Sales and office occupations (%)
Most Common Occupations - Sales and related occupations (%)
Most Common Occupations - Office and administrative support occupations (%)
Most Common Occupations - Natural resources, construction, and maintenance occupations (%)
Most Common Occupations - Farming, fishing, and forestry occupations (%)
Most Common Occupations - Construction and extraction occupations (%)
Most Common Occupations - Installation, maintenance, and repair occupations (%)
Most Common Occupations - Production, transportation, and material moving occupations (%)
Most Common Occupations - Production occupations (%)
Most Common Occupations - Transportation occupations (%)
Most Common Occupations - Material moving occupations (%)
People in Group quarters - Institutionalized population (%)
People in Group quarters - Correctional institutions (%)
People in Group quarters - Federal prisons and detention centers (%)
People in Group quarters - Halfway houses (%)
People in Group quarters - Local jails and other confinement facilities (including police lockups) (%)
People in Group quarters - Military disciplinary barracks (%)
People in Group quarters - State prisons (%)
People in Group quarters - Other types of correctional institutions (%)
People in Group quarters - Nursing homes (%)
People in Group quarters - Hospitals/wards, hospices, and schools for the handicapped (%)
People in Group quarters - Hospitals/wards and hospices for chronically ill (%)
People in Group quarters - Hospices or homes for chronically ill (%)
People in Group quarters - Military hospitals or wards for chronically ill (%)
People in Group quarters - Other hospitals or wards for chronically ill (%)
People in Group quarters - Hospitals or wards for drug/alcohol abuse (%)
People in Group quarters - Mental (Psychiatric) hospitals or wards (%)
People in Group quarters - Schools, hospitals, or wards for the mentally retarded (%)
People in Group quarters - Schools, hospitals, or wards for the physically handicapped (%)
People in Group quarters - Institutions for the deaf (%)
People in Group quarters - Institutions for the blind (%)
People in Group quarters - Orthopedic wards and institutions for the physically handicapped (%)
People in Group quarters - Wards in general hospitals for patients who have no usual home elsewhere (%)
People in Group quarters - Wards in military hospitals for patients who have no usual home elsewhere (%)
People in Group quarters - Juvenile institutions (%)
People in Group quarters - Long-term care (%)
People in Group quarters - Homes for abused, dependent, and neglected children (%)
People in Group quarters - Residential treatment centers for emotionally disturbed children (%)
People in Group quarters - Training schools for juvenile delinquents (%)
People in Group quarters - Short-term care, detention or diagnostic centers for delinquent children (%)
People in Group quarters - Type of juvenile institution unknown (%)
People in Group quarters - Noninstitutionalized population (%)
People in Group quarters - College dormitories (includes college quarters off campus) (%)
People in Group quarters - Military quarters (%)
People in Group quarters - On base (%)
People in Group quarters - Barracks, unaccompanied personnel housing (UPH), (Enlisted/Officer), ;and similar group living quarters for military personnel (%)
People in Group quarters - Transient quarters for temporary residents (%)
People in Group quarters - Military ships (%)
People in Group quarters - Group homes (%)
People in Group quarters - Homes or halfway houses for drug/alcohol abuse (%)
People in Group quarters - Homes for the mentally ill (%)
People in Group quarters - Homes for the mentally retarded (%)
People in Group quarters - Homes for the physically handicapped (%)
People in Group quarters - Other group homes (%)
People in Group quarters - Religious group quarters (%)
People in Group quarters - Dormitories (%)
People in Group quarters - Agriculture workers' dormitories on farms (%)
People in Group quarters - Job Corps and vocational training facilities (%)
People in Group quarters - Other workers' dormitories (%)
People in Group quarters - Crews of maritime vessels (%)
People in Group quarters - Other nonhousehold living situations (%)
People in Group quarters - Other noninstitutional group quarters (%)
Residents speaking English at home (%)
Residents speaking English at home - Born in the United States (%)
Residents speaking English at home - Native, born elsewhere (%)
Residents speaking English at home - Foreign born (%)
Residents speaking Spanish at home (%)
Residents speaking Spanish at home - Born in the United States (%)
Residents speaking Spanish at home - Native, born elsewhere (%)
Residents speaking Spanish at home - Foreign born (%)
Residents speaking other language at home (%)
Residents speaking other language at home - Born in the United States (%)
Residents speaking other language at home - Native, born elsewhere (%)
Residents speaking other language at home - Foreign born (%)
Class of Workers - Employee of private company (%)
Class of Workers - Self-employed in own incorporated business (%)
Class of Workers - Private not-for-profit wage and salary workers (%)
Class of Workers - Local government workers (%)
Class of Workers - State government workers (%)
Class of Workers - Federal government workers (%)
Class of Workers - Self-employed workers in own not incorporated business and Unpaid family workers (%)
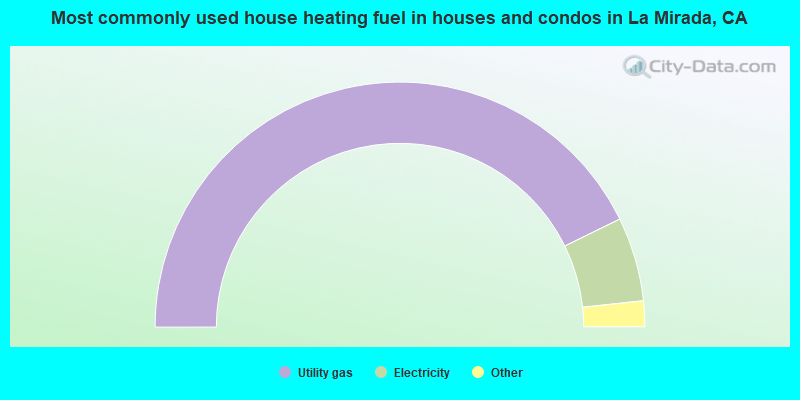
House heating fuel used in houses and condos - Utility gas (%)
House heating fuel used in houses and condos - Bottled, tank, or LP gas (%)
House heating fuel used in houses and condos - Electricity (%)
House heating fuel used in houses and condos - Fuel oil, kerosene, etc. (%)
House heating fuel used in houses and condos - Coal or coke (%)
House heating fuel used in houses and condos - Wood (%)
House heating fuel used in houses and condos - Solar energy (%)
House heating fuel used in houses and condos - Other fuel (%)
House heating fuel used in houses and condos - No fuel used (%)
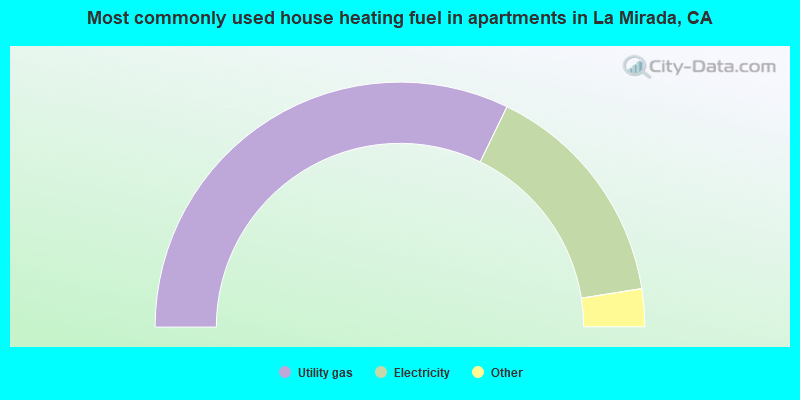
House heating fuel used in apartments - Utility gas (%)
House heating fuel used in apartments - Bottled, tank, or LP gas (%)
House heating fuel used in apartments - Electricity (%)
House heating fuel used in apartments - Fuel oil, kerosene, etc. (%)
House heating fuel used in apartments - Coal or coke (%)
House heating fuel used in apartments - Wood (%)
House heating fuel used in apartments - Solar energy (%)
House heating fuel used in apartments - Other fuel (%)
House heating fuel used in apartments - No fuel used (%)
Armed forces status - In Armed Forces (%)
Armed forces status - Civilian (%)
Armed forces status - Civilian - Veteran (%)
Armed forces status - Civilian - Nonveteran (%)
Fatal accidents locations in years 2005-2021
Fatal accidents locations in 2005
Fatal accidents locations in 2006
Fatal accidents locations in 2007
Fatal accidents locations in 2008
Fatal accidents locations in 2009
Fatal accidents locations in 2010
Fatal accidents locations in 2011
Fatal accidents locations in 2012
Fatal accidents locations in 2013
Fatal accidents locations in 2014
Fatal accidents locations in 2015
Fatal accidents locations in 2016
Fatal accidents locations in 2017
Fatal accidents locations in 2018
Fatal accidents locations in 2019
Fatal accidents locations in 2020
Fatal accidents locations in 2021
Alcohol use - People drinking some alcohol every month (%)
Alcohol use - People not drinking at all (%)
Alcohol use - Average days/month drinking alcohol
Alcohol use - Average drinks/week
Alcohol use - Average days/year people drink much
Audiometry - Average condition of hearing (%)
Audiometry - People that can hear a whisper from across a quiet room (%)
Audiometry - People that can hear normal voice from across a quiet room (%)
Audiometry - Ears ringing, roaring, buzzing (%)
Audiometry - Had a job exposure to loud noise (%)
Audiometry - Had off-work exposure to loud noise (%)
Blood Pressure & Cholesterol - Has high blood pressure (%)
Blood Pressure & Cholesterol - Checking blood pressure at home (%)
Blood Pressure & Cholesterol - Frequently checking blood cholesterol (%)
Blood Pressure & Cholesterol - Has high cholesterol level (%)
Consumer Behavior - Money monthly spent on food at supermarket/grocery store
Consumer Behavior - Money monthly spent on food at other stores
Consumer Behavior - Money monthly spent on eating out
Consumer Behavior - Money monthly spent on carryout/delivered foods
Consumer Behavior - Income spent on food at supermarket/grocery store (%)
Consumer Behavior - Income spent on food at other stores (%)
Consumer Behavior - Income spent on eating out (%)
Consumer Behavior - Income spent on carryout/delivered foods (%)
Current Health Status - General health condition (%)
Current Health Status - Blood donors (%)
Current Health Status - Has blood ever tested for HIV virus (%)
Current Health Status - Left-handed people (%)
Dermatology - People using sunscreen (%)
Diabetes - Diabetics (%)
Diabetes - Had a blood test for high blood sugar (%)
Diabetes - People taking insulin (%)
Diet Behavior & Nutrition - Diet health (%)
Diet Behavior & Nutrition - Milk product consumption (# of products/month)
Diet Behavior & Nutrition - Meals not home prepared (#/week)
Diet Behavior & Nutrition - Meals from fast food or pizza place (#/week)
Diet Behavior & Nutrition - Ready-to-eat foods (#/month)
Diet Behavior & Nutrition - Frozen meals/pizza (#/month)
Drug Use - People that ever used marijuana or hashish (%)
Drug Use - Ever used hard drugs (%)
Drug Use - Ever used any form of cocaine (%)
Drug Use - Ever used heroin (%)
Drug Use - Ever used methamphetamine (%)
Health Insurance - People covered by health insurance (%)
Kidney Conditions-Urology - Avg. # of times urinating at night
Medical Conditions - People with asthma (%)
Medical Conditions - People with anemia (%)
Medical Conditions - People with psoriasis (%)
Medical Conditions - People with overweight (%)
Medical Conditions - Elderly people having difficulties in thinking or remembering (%)
Medical Conditions - People who ever received blood transfusion (%)
Medical Conditions - People having trouble seeing even with glass/contacts (%)
Medical Conditions - People with arthritis (%)
Medical Conditions - People with gout (%)
Medical Conditions - People with congestive heart failure (%)
Medical Conditions - People with coronary heart disease (%)
Medical Conditions - People with angina pectoris (%)
Medical Conditions - People who ever had heart attack (%)
Medical Conditions - People who ever had stroke (%)
Medical Conditions - People with emphysema (%)
Medical Conditions - People with thyroid problem (%)
Medical Conditions - People with chronic bronchitis (%)
Medical Conditions - People with any liver condition (%)
Medical Conditions - People who ever had cancer or malignancy (%)
Mental Health - People who have little interest in doing things (%)
Mental Health - People feeling down, depressed, or hopeless (%)
Mental Health - People who have trouble sleeping or sleeping too much (%)
Mental Health - People feeling tired or having little energy (%)
Mental Health - People with poor appetite or overeating (%)
Mental Health - People feeling bad about themself (%)
Mental Health - People who have trouble concentrating on things (%)
Mental Health - People moving or speaking slowly or too fast (%)
Mental Health - People having thoughts they would be better off dead (%)
Oral Health - Average years since last visit a dentist
Oral Health - People embarrassed because of mouth (%)
Oral Health - People with gum disease (%)
Oral Health - General health of teeth and gums (%)
Oral Health - Average days a week using dental floss/device
Oral Health - Average days a week using mouthwash for dental problem
Oral Health - Average number of teeth
Pesticide Use - Households using pesticides to control insects (%)
Pesticide Use - Households using pesticides to kill weeds (%)
Physical Activity - People doing vigorous-intensity work activities (%)
Physical Activity - People doing moderate-intensity work activities (%)
Physical Activity - People walking or bicycling (%)
Physical Activity - People doing vigorous-intensity recreational activities (%)
Physical Activity - People doing moderate-intensity recreational activities (%)
Physical Activity - Average hours a day doing sedentary activities
Physical Activity - Average hours a day watching TV or videos
Physical Activity - Average hours a day using computer
Physical Functioning - People having limitations keeping them from working (%)
Physical Functioning - People limited in amount of work they can do (%)
Physical Functioning - People that need special equipment to walk (%)
Physical Functioning - People experiencing confusion/memory problems (%)
Physical Functioning - People requiring special healthcare equipment (%)
Prescription Medications - Average number of prescription medicines taking
Preventive Aspirin Use - Adults 40+ taking low-dose aspirin (%)
Reproductive Health - Vaginal deliveries (%)
Reproductive Health - Cesarean deliveries (%)
Reproductive Health - Deliveries resulted in a live birth (%)
Reproductive Health - Pregnancies resulted in a delivery (%)
Reproductive Health - Women breastfeeding newborns (%)
Reproductive Health - Women that had a hysterectomy (%)
Reproductive Health - Women that had both ovaries removed (%)
Reproductive Health - Women that have ever taken birth control pills (%)
Reproductive Health - Women taking birth control pills (%)
Reproductive Health - Women that have ever used Depo-Provera or injectables (%)
Reproductive Health - Women that have ever used female hormones (%)
Sexual Behavior - People 18+ that ever had sex (vaginal, anal, or oral) (%)
Sexual Behavior - Males 18+ that ever had vaginal sex with a woman (%)
Sexual Behavior - Males 18+ that ever performed oral sex on a woman (%)
Sexual Behavior - Males 18+ that ever had anal sex with a woman (%)
Sexual Behavior - Males 18+ that ever had any sex with a man (%)
Sexual Behavior - Females 18+ that ever had vaginal sex with a man (%)
Sexual Behavior - Females 18+ that ever performed oral sex on a man (%)
Sexual Behavior - Females 18+ that ever had anal sex with a man (%)
Sexual Behavior - Females 18+ that ever had any kind of sex with a woman (%)
Sexual Behavior - Average age people first had sex
Sexual Behavior - Average number of female sex partners in lifetime (males 18+)
Sexual Behavior - Average number of female vaginal sex partners in lifetime (males 18+)
Sexual Behavior - Average age people first performed oral sex on a woman (18+)
Sexual Behavior - Average number of woman performed oral sex on in lifetime (18+)
Sexual Behavior - Average number of male sex partners in lifetime (males 18+)
Sexual Behavior - Average number of male anal sex partners in lifetime (males 18+)
Sexual Behavior - Average age people first performed oral sex on a man (18+)
Sexual Behavior - Average number of male oral sex partners in lifetime (18+)
Sexual Behavior - People using protection when performing oral sex (%)
Sexual Behavior - Average number of times people have vaginal or anal sex a year
Sexual Behavior - People having sex without condom (%)
Sexual Behavior - Average number of male sex partners in lifetime (females 18+)
Sexual Behavior - Average number of male vaginal sex partners in lifetime (females 18+)
Sexual Behavior - Average number of female sex partners in lifetime (females 18+)
Sexual Behavior - Circumcised males 18+ (%)
Sleep Disorders - Average hours sleeping at night
Sleep Disorders - People that has trouble sleeping (%)
Smoking-Cigarette Use - People smoking cigarettes (%)
Taste & Smell - People 40+ having problems with smell (%)
Taste & Smell - People 40+ having problems with taste (%)
Taste & Smell - People 40+ that ever had wisdom teeth removed (%)
Taste & Smell - People 40+ that ever had tonsils teeth removed (%)
Taste & Smell - People 40+ that ever had a loss of consciousness because of a head injury (%)
Taste & Smell - People 40+ that ever had a broken nose or other serious injury to face or skull (%)
Taste & Smell - People 40+ that ever had two or more sinus infections (%)
Weight - Average height (inches)
Weight - Average weight (pounds)
Weight - Average BMI
Weight - People that are obese (%)
Weight - People that ever were obese (%)
Weight - People trying to lose weight (%)
21,331 45.8% Hispanic 12,583 27.0% White alone 10,189 21.9% Asian alone 1,589 3.4% Two or more races 729 1.6% Black alone 113 0.2% Other race alone 61 0.1% Native Hawaiian and Other 43 0.09% American Indian alone
According to our research of California and other state lists, there were 31 registered sex offenders living in La Mirada, California as of April 27, 2024 . The ratio of all residents to sex offenders in La Mirada is 1,598 to 1.The ratio of registered sex offenders to all residents in this city is lower than the state average.
The City-Data.com crime index weighs serious crimes and violent crimes more heavily. Higher means more crime, U.S. average is 246.1. It adjusts for the number of visitors and daily workers commuting into cities.
- means the value is smaller than the state average.
- means the value is about the same as the state average.
- means the value is bigger than the state average.
Crime rate in La Mirada detailed stats: murders, rapes, robberies, assaults, burglaries, thefts, arson Officers per 1,000 residents here:
0.02California average:
1.98
Latest news from La Mirada, CA collected exclusively by city-data.com from local newspapers, TV, and radio stations
Ancestries: American (2.9%), English (2.9%), German (2.2%), Irish (1.7%), Italian (1.5%), European (1.4%).
Current Local Time:
Land area: 7.85 square miles.
Population density: 5,902 people per square mile (average).
12,337 residents are foreign born (14.6% Asia , 10.5% Latin America ).
This city:
26.5%California:
26.5%
Median real estate property taxes paid for housing units with mortgages in 2022: $5,857 (0.7%)Median real estate property taxes paid for housing units with no mortgage in 2022: $3,854 (0.5%)
Nearest city with pop. 50,000+: South Whittier, CA (2.6 miles
Nearest city with pop. 200,000+: Anaheim, CA
Nearest city with pop. 1,000,000+: Los Angeles, CA
Nearest cities:
Latitude: 33.90 N, Longitude: 118.01 W
Daytime population change due to commuting: -5,110 (-11.0%)Workers who live and work in this city: 4,994 (21.6%)
Property values in La Mirada, CA
Single-family new house construction building permits:
2021: 94 buildings , average cost: $195,7002020: 4 buildings , average cost: $93,8002019: 7 buildings , average cost: $500,3002018: 9 buildings , average cost: $163,8002017: 31 buildings , average cost: $498,2002015: 37 buildings , average cost: $251,3002014: 35 buildings , average cost: $251,2002008: 1 building , cost: $188,1002007: 1 building , cost: $188,1002006: 2 buildings , average cost: $188,1002005: 3 buildings , average cost: $188,1002004: 5 buildings , average cost: $188,1002003: 5 buildings , average cost: $188,2002002: 4 buildings , average cost: $187,5002001: 4 buildings , average cost: $191,1002000: 4 buildings , average cost: $176,5001999: 50 buildings , average cost: $176,5001998: 40 buildings , average cost: $171,7001997: 73 buildings , average cost: $184,400Unemployment in December 2023:
Population change in the 1990s: +6,273 (+15.5%).
Most common occupations in La Mirada, CA (%)
Both Males Females
Other office and administrative support workers, including supervisors (5.4%)
Other sales and related occupations, including supervisors (5.0%)
Other management occupations, except farmers and farm managers (4.1%)
Material recording, scheduling, dispatching, and distributing workers (3.4%)
Other production occupations, including supervisors (3.3%)
Secretaries and administrative assistants (3.3%)
Preschool, kindergarten, elementary, and middle school teachers (3.2%)
Other sales and related occupations, including supervisors (5.4%)
Other production occupations, including supervisors (5.1%)
Other management occupations, except farmers and farm managers (4.4%)
Material recording, scheduling, dispatching, and distributing workers (4.0%)
Driver/sales workers and truck drivers (4.0%)
Electrical equipment mechanics and other installation, maintenance, and repair workers, including supervisors (3.9%)
Metal workers and plastic workers (3.5%)
Other office and administrative support workers, including supervisors (8.5%)
Secretaries and administrative assistants (6.9%)
Preschool, kindergarten, elementary, and middle school teachers (5.6%)
Other sales and related occupations, including supervisors (4.6%)
Information and record clerks, except customer service representatives (4.5%)
Other management occupations, except farmers and farm managers (3.8%)
Registered nurses (3.8%)
Earthquake activity:
La Mirada-area historical earthquake activity is significantly above California state average. It is 6959% greater than the overall U.S. average. On 7/21/1952 at 11:52:14, a magnitude 7.7 (7.7 UK, Class: Major, Intensity: VIII - XII) earthquake occurred 94.6 miles away from La Mirada center, causing $50,000,000 total damage On 6/28/1992 at 11:57:34, a magnitude 7.6 (6.2 MB, 7.6 MS, 7.3 MW, Depth: 0.7 mi) earthquake occurred 86.9 miles away from the city center, causing 3 deaths ( 1 shaking deaths, 2 other deaths) and 400 injuries, causing $100,000,000 total damage and $40,000,000 insured lossesOn 10/16/1999 at 09:46:44, a magnitude 7.4 (6.3 MB, 7.4 MS, 7.2 MW, 7.3 ML) earthquake occurred 99.5 miles away from La Mirada center On 11/4/1927 at 13:51:53, a magnitude 7.5 (7.5 UK) earthquake occurred 186.1 miles away from the city center On 4/21/1918 at 22:32:30, a magnitude 6.8 (6.8 UK, Class: Strong, Intensity: VII - IX) earthquake occurred 33.3 miles away from the city center On 1/17/1994 at 12:30:55, a magnitude 6.8 (6.4 MB, 6.8 MS, 6.7 MW, Depth: 11.4 mi) earthquake occurred 36.9 miles away from La Mirada center, causing 60 deaths ( 60 shaking deaths) and 7000 injuriesMagnitude types: body-wave magnitude (MB), local magnitude (ML), surface-wave magnitude (MS), moment magnitude (MW) Natural disasters: The number of natural disasters in Los Angeles County (57) is a lot greater than the US average (15).Major Disasters (Presidential) Declared: 27Emergencies Declared: 3Fires: 37, Floods: 16, Storms: 9, Winter Storms: 6, Landslides: 5, Mudslides: 5, Earthquakes: 3, Freeze: 1, Heavy Rain: 1, Hurricane: 1, Snow: 1, Tornado: 1, Wind: 1, Other: 1 (Note: some incidents may be assigned to more than one category). Hospitals in La Mirada: DWC HOME CARE (15340 MANZANARES ROAD) G M HOME I (13111 BLUEFIELD AVENUE) G M HOME III (15803 FOSTER ROAD) HAPPY DAYS CONVALESCENT CARE/HOSPICE (14354 SAN ARDO DRIVE) HOSPICE OF PRESBYTERIAN (15050 IMPERIAL HWY) JANRAY (12921 BIOLA AVENUE) LAFONDA DIVISION (14838 LA FONDA DRIVE) SPECIALTY HOSPITAL OF SOUTHERN CALIF (14900 E IMPERIAL HWY) Home Health Centers in La Mirada: CARE CENTER HOME HEALTH, INC (14762 BEACH BLVD) CERRITOS HH SRVS (14700 EAST FIRESTONE BOULEVARD) ORANGE COUNTY CARE PROVIDERS, INC (14700 E FIRESTONE BLVD SUITE 128) PRESBYTERIAN INTERCOMMUNITY HOSPITAL HOME HEALTH (15050 IMPERIAL HWY) VNA HOME HEALTH CARE INC (15050 IMPERIAL HWY) Nursing Homes in La Mirada: IMPERIAL CONVALESCENT HOSPITAL (11926 LA MIRADA BLVD) MIRADA HILLS REHAB AND CONV (12200 LA MIRADA BLVD.) Amtrak stations near La Mirada: 6 miles: FULLERTON (120 E. SANTA FE AVE.) Services: ticket office, fully wheelchair accessible, enclosed waiting area, public restrooms, public payphones, full-service food facilities, free short-term parking, paid long-term parking, taxi stand, public transit connection.
10 miles: ANAHEIM (2150 KATELLA AVE.) Services: ticket office, fully wheelchair accessible, enclosed waiting area, public restrooms, public payphones, vending machines, free short-term parking, free long-term parking, call for car rental service, call for taxi service.
14 miles: LONG BEACH (601 N. LONG BEACH BLVD.) - Bus Station Services: fully wheelchair accessible, public restrooms, public payphones, full-service food facilities, paid short-term parking, paid long-term parking, call for taxi service, public transit connection.
College/University in La Mirada: Biola University Full-time enrollment: 5,325; Location: 13800 Biola Ave; Private, not-for-profit; Website: www.biola.edu; Offers Doctor's degree )
Other colleges/universities with over 2000 students near La Mirada:
Cerritos College (about 6 miles; Norwalk, CA ; Full-time enrollment: 13,090)
Cypress College (about 6 miles; Cypress, CA ; FT enrollment: 8,732)
Fullerton College (about 6 miles; Fullerton, CA ; FT enrollment: 11,124)
Trident University International (about 7 miles; Cypress, CA ; FT enrollment: 5,974)
California State University-Fullerton (about 8 miles; Fullerton, CA ; FT enrollment: 28,947)
Hacienda La Puente Adult Education (about 9 miles; La Puente, CA ; FT enrollment: 2,750)
Rio Hondo College (about 9 miles; Whittier, CA ; FT enrollment: 9,610)
Public high school in La Mirada: LA MIRADA HIGH Students: 1,532, Location: 13520 ADELFA DR., Grades: 9-12)Public elementary/middle schools in La Mirada: LOS COYOTES MIDDLE Students: 610, Location: 14640 MERCADO AVE., Grades: 6-8)ARLIE F. HUTCHINSON MIDDLE Students: 513, Location: 13900 ESTERO RD., Grades: 6-8)REGINALD M. BENTON MIDDLE Students: 496, Location: 15709 E. OLIVE BRANCH RD., Grades: 6-8)GARDENHILL ELEMENTARY Students: 421, Location: 14607 E. GARDENHILL DR., Grades: KG-5)ESCALONA ELEMENTARY Students: 358, Location: 15135 ESCALONA RD., Grades: KG-5)EASTWOOD ELEMENTARY Students: 344, Location: 15730 PESCADOS DR., Grades: KG-5)LA PLUMA ELEMENTARY Students: 309, Location: 14420 LA PLUMA DR., Grades: KG-5)FOSTER ROAD ELEMENTARY Students: 254, Location: 13930 E. FOSTER RD., Grades: KG-5)JOHN FOSTER DULLES ELEMENTARY Students: 229, Location: 12726 MEADOWGREEN RD., Grades: KG-5)Private elementary/middle schools in La Mirada: HEIGHTS CHRISTIAN JUNIOR HIGH Students: 295, Location: 12900 BLUEFIELD AVE, Grades: 6-8)
LA MIRADA HEIGHTS CHRISTIAN PRESCHOOL & ELEMENTARY Students: 262, Location: 12200 OXFORD DR, Grades: KG-5)
BEATITUDES OF OUR LORD CATHOLIC SCHOOL Students: 252, Location: 13021 SANTA GERTRUDES AVE, Grades: KG-8)
ST PAUL OF THE CROSS SCHOOL Students: 169, Location: 14030 FOSTER RD, Grades: KG-8)
See full list of schools located in La Mirada
Notable locations in La Mirada: (A) , La Mirada City Hall (B) , La Mirada Branch County of Los Angeles Public Library (C) , La Mirada Theatre For The Performing Arts (D) , Los Angeles County Fire Department Station 49 (E) . Display/hide their locations on the map
Shopping Centers: (1) , Home Depot Shopping Center (2) , Mirada West Shopping Center (3) , Green Hills Plaza Shopping Center (4) , Crossroad Shopping Center (5) . Display/hide their locations on the map
Churches in La Mirada include: (A) , Trinity Reformed Baptist Church (B) , Saint Paul of the Cross Church (C) , Mount Olive Lutheran Church (D) , Church of Jesus Christ of Latter Day Saints (E) , Foursquare Church of La Mirada (F) , First Baptist Church (G) , Calvary Orthodox Presbyterian CHurch (H) , Christian Church of La Mirada (I) . Display/hide their locations on the map
Parks in La Mirada include: (1) , Frontier Park (2) , La Mirada Park (3) , Neff Park (4) , Olive Lawn Memorial Park (5) , Windermere Park (6) , La Mirada Creek Park (7) . Display/hide their locations on the map
Birthplace of: Janine Lindemulder - (born 1968), adult film actress, Toby Henderson - Bicycle motocross rider, Derrick Williams (basketball) - Professional basketball player, Eric Valent - 2005 Major League Baseball player (New York Mets, born : Apr 4, 1977), Eric Winter - Actor, Ila Borders - Baseball player, Nolan Gasser - Composer, Erik Meyer - Football player, Mark Quinn - Baseball player, Andrew Eiden - Actor.
Los Angeles County has a predicted average indoor radon screening level between 2 and 4 pCi/L (pico curies per liter) - Moderate Potential Average household size: This city:
3.1 peopleCalifornia:
2.9 people
Percentage of family households: This city:
78.4%Whole state:
68.7%
Percentage of households with unmarried partners: This city:
4.3%Whole state:
7.2%
Likely homosexual households (counted as self-reported same-sex unmarried-partner households)
Lesbian couples: 0.5% of all households Gay men: 0.2% of all households
People in group quarters in La Mirada in 2010:
2,483 people in college/university student housing
271 people in nursing facilities/skilled-nursing facilities
45 people in group homes intended for adults
33 people in other noninstitutional facilities
20 people in workers' group living quarters and job corps centers
5 people in residential treatment centers for adults
people in college dormitories (includes college quarters off campus) in 2000people in nursing homes in 2000Banks with branches in La Mirada (2011 data):
Bank of America, National Association: La Mirada-Imperial Branch at 12231 La Mirada Boulevard, branch established on 1962/12/14. Info updated 2009/11/18: Bank assets: $1,451,969.3 mil, Deposits: $1,077,176.8 mil, headquarters in Charlotte, NC, positive income , 5782 total offices , Holding Company: Bank Of America Corporation
Wells Fargo Bank, National Association: La Mirada Branch at 15056 Rosecrans Avenue, branch established on 1956/12/14. Info updated 2011/04/05: Bank assets: $1,161,490.0 mil, Deposits: $905,653.0 mil, headquarters in Sioux Falls, SD, positive income , 6395 total offices , Holding Company: Wells Fargo & Company
Bank of the West: La Mirada Branch at 12709 Valley View Avenue, branch established on 1969/04/11. Info updated 2009/11/16: Bank assets: $62,408.3 mil, Deposits: $43,995.2 mil, headquarters in San Francisco, CA, positive income , 647 total offices , Holding Company: Bnp Paribas
JPMorgan Chase Bank, National Association: La Mirada Branch at 15128 East Rosecrans Avenue, branch established on 1889/01/01. Info updated 2011/11/10: Bank assets: $1,811,678.0 mil, Deposits: $1,190,738.0 mil, headquarters in Columbus, OH, positive income , International Specialization, 5577 total offices , Holding Company: Jpmorgan Chase & Co.
Banco Popular North America: La Mirada Branch at 12333 South La Mirada Boulevard, branch established on 1934/12/17. Info updated 2012/01/27: Bank assets: $8,605.3 mil, Deposits: $6,167.7 mil, headquarters in New York, NY, positive income , Commercial Lending Specialization, 97 total offices , Holding Company: Popular, Inc.
For population 15 years and over in La Mirada:
Never married: 34.4%Now married: 50.5%Separated: 1.3%Widowed: 5.7%Divorced: 8.0% For population 25 years and over in La Mirada:
High school or higher: 90.4%Bachelor's degree or higher: 38.8%Graduate or professional degree: 13.0%Unemployed: 3.8%Mean travel time to work (commute): 25.8 minutes
Education Gini index (Inequality in education) Here:
12.7California average:
15.5
Religion statistics for La Mirada, CA (based on Los Angeles County data)
Religion Adherents Congregations Catholic 3,542,994 275 Evangelical Protestant 814,611 3,249 Other 451,594 1,023 Mainline Protestant 229,056 860 Black Protestant 112,338 290 Orthodox 63,517 76 None 4,604,495 -
Source: Clifford Grammich, Kirk Hadaway, Richard Houseal, Dale E.Jones, Alexei Krindatch, Richie Stanley and Richard H.Taylor. 2012. 2010 U.S.Religion Census: Religious Congregations & Membership Study. Association of Statisticians of American Religious Bodies. Jones, Dale E., et al. 2002. Congregations and Membership in the United States 2000. Nashville, TN: Glenmary Research Center. Graphs represent county-level data
Food Environment Statistics: Number of grocery stores : 2,084Los Angeles County :
2.12 / 10,000 pop.California :
2.14 / 10,000 pop.
Number of supercenters and club stores : 32This county :
0.03 / 10,000 pop.California :
0.04 / 10,000 pop.
Number of convenience stores (no gas) : 567This county :
0.58 / 10,000 pop.California :
0.62 / 10,000 pop.
Number of convenience stores (with gas) : 1,206Los Angeles County :
1.23 / 10,000 pop.California :
1.49 / 10,000 pop.
Number of full-service restaurants : 7,008Los Angeles County :
7.15 / 10,000 pop.California :
7.42 / 10,000 pop.
Adult diabetes rate : Los Angeles County :
7.5%California :
7.3%
Adult obesity rate : This county :
20.4%California :
21.3%
Low-income preschool obesity rate : Los Angeles County :
18.6%State :
17.9%
Health and Nutrition: Healthy diet rate : La Mirada:
51.7%California:
49.4%
Average overall health of teeth and gums : This city:
49.8%State:
48.0%
Average BMI : La Mirada:
28.1California:
28.1
People feeling badly about themselves : This city:
19.4%State:
20.2%
People not drinking alcohol at all : This city:
13.0%California:
11.2%
Average hours sleeping at night : La Mirada:
6.8California:
6.8
Overweight people : La Mirada:
32.2%California:
31.5%
General health condition : La Mirada:
57.0%California:
56.4%
Average condition of hearing : La Mirada:
80.7%California:
80.9%
More about Health and Nutrition of La Mirada, CA Residents
Local government employment and payroll (March 2022)
Function
Full-time employees
Monthly full-time payroll
Average yearly full-time wage
Part-time employees
Monthly part-time payroll
Parks and Recreation
23 $159,824 $83,386 122 $219,715 Streets and Highways
15 $89,298 $71,438 6 $12,664 Other Government Administration
13 $83,082 $76,691 1 $1,508 Police - Other
7 $43,952 $75,346 13 $30,703 Financial Administration
5 $34,748 $83,395 1 $1,950 Other and Unallocable
3 $20,469 $81,876 3 $5,928 Housing and Community Development (Local)
3 $31,992 $127,968 4 $9,046 Judicial and Legal
0 $0 1 $347
Totals for Government
69 $463,365 $80,585 151 $281,860
La Mirada government finances - Expenditure in 2017 (per resident):
Construction - Regular Highways: $18,370,000 ($396.56)
Housing and Community Development: $1,667,000 ($35.99)Current Operations - Parks and Recreation: $11,564,000 ($249.64)
Police Protection: $8,451,000 ($182.44)Regular Highways: $6,182,000 ($133.45)Central Staff Services: $4,145,000 ($89.48)Financial Administration: $1,880,000 ($40.58)Transit Utilities: $1,670,000 ($36.05)Housing and Community Development: $468,000 ($10.10)General - Interest on Debt: $2,966,000 ($64.03)
Other Capital Outlay - Parks and Recreation: $1,370,000 ($29.57)
Housing and Community Development: $1,000 ($0.02)Total Salaries and Wages: $43,000 ($0.93)
La Mirada government finances - Revenue in 2017 (per resident):
Charges - Parks and Recreation: $9,240,000 ($199.47)
Other: $1,097,000 ($23.68)Regular Highways: $43,000 ($0.93)Federal Intergovernmental - Other: $470,000 ($10.15)
Housing and Community Development: $197,000 ($4.25)Local Intergovernmental - Other: $4,419,000 ($95.40)
Transit Utilities: $168,000 ($3.63)Miscellaneous - Rents: $489,000 ($10.56)
Fines and Forfeits: $413,000 ($8.92)Interest Earnings: $310,000 ($6.69)Donations From Private Sources: $110,000 ($2.37)Revenue - Transit Utilities: $70,000 ($1.51)
State Intergovernmental - Highways: $939,000 ($20.27)
Other: $142,000 ($3.07)General Local Government Support: $34,000 ($0.73)Tax - General Sales and Gross Receipts: $18,591,000 ($401.33)
Property: $10,986,000 ($237.16)Public Utilities Sales: $2,796,000 ($60.36)Other License: $1,737,000 ($37.50)Other Selective Sales: $1,544,000 ($33.33)Occupation and Business License - Other: $326,000 ($7.04)Documentary and Stock Transfer: $239,000 ($5.16)
La Mirada government finances - Debt in 2017 (per resident):
Long Term Debt - Beginning Outstanding - Unspecified Public Purpose: $74,153,000 ($1600.78)
Outstanding Unspecified Public Purpose: $70,815,000 ($1528.72)Retired Unspecified Public Purpose: $4,330,000 ($93.47)Issue, Unspecified Public Purpose: $992,000 ($21.41)
La Mirada government finances - Cash and Securities in 2017 (per resident):
Bond Funds - Cash and Securities: $7,119,000 ($153.68)
Other Funds - Cash and Securities: $107,280,000 ($2315.91)
Sinking Funds - Cash and Securities: $104,000 ($2.25)
2.98% of this county's 2021 resident taxpayers lived in other counties in 2020 ($81,235 average adjusted gross income )
Here:
2.98%California average:
5.19%
0.01% of residents moved from foreign countries ($155 average AGI )Los Angeles County:
0.01%California average:
0.03%
Top counties from which taxpayers relocated into this county between 2020 and 2021:
4.68% of this county's 2020 resident taxpayers moved to other counties in 2021 ($97,324 average adjusted gross income )
Here:
4.68%California average:
6.14%
0.01% of residents moved to foreign countries ($196 average AGI )Los Angeles County:
0.01%California average:
0.02%
Top counties to which taxpayers relocated from this county between 2020 and 2021:
Businesses in La Mirada, CA
Name Count Name Count
24 Hour Fitness 1 Home Depot 1 99 Cents Only Stores 1 IHOP 1 Albertsons 1 Jones New York 2 AutoZone 1 KFC 1 Baskin-Robbins 1 Little Caesars Pizza 1 Big O Tires 1 Marriott 1 Blockbuster 1 Marshalls 1 Burger King 2 MasterBrand Cabinets 1 CVS 3 Nike 2 Carl\s Jr. 1 Papa John's Pizza 1 Chuck E. Cheese's 1 Penske 1 Circle K 1 Quiznos 1 Cold Stone Creamery 1 RadioShack 1 Curves 1 Red Robin 1 DHL 1 Rite Aid 1 El Pollo Loco 1 Staples 1 Extended Stay America 1 Starbucks 3 FedEx 4 Taco Bell 2 GNC 1 Toys"R"Us 1 GameStop 1 UPS 3 H&R Block 1 Vans 1 Holiday Inn 1 Wendy's 2
Strongest AM radio stations in La Mirada:
KFI (640 AM; 50 kW; LOS ANGELES, CA; Owner: CAPSTAR TX LIMITED PARTNERSHIP)
KTNQ (1020 AM; 50 kW; LOS ANGELES, CA; Owner: KTNQ-AM LICENSE CORP.)
KXTA (1150 AM; 50 kW; LOS ANGELES, CA; Owner: CITICASTERS LICENSES, L.P.)
KLAC (570 AM; 50 kW; LOS ANGELES, CA; Owner: AMFM RADIO LICENSES, L.L.C.)
KDIS (1110 AM; 50 kW; PASADENA, CA; Owner: ABC,INC.)
KFWB (980 AM; 50 kW; LOS ANGELES, CA; Owner: INFINITY BROADCASTING OPERATIONS, INC.)
KMPC (1540 AM; 50 kW; LOS ANGELES, CA; Owner: ROSE CITY RADIO CORPORATION)
KNX (1070 AM; 50 kW; LOS ANGELES, CA; Owner: INFINITY BROADCASTING OPERATIONS, INC.)
KPLS (830 AM; 50 kW; ORANGE, CA; Owner: CRN LICENSES, LLC)
KBLA (1580 AM; 50 kW; SANTA MONICA, CA)
KSPN (710 AM; 50 kW; LOS ANGELES, CA; Owner: KABC-AM RADIO, INC.)
KXMX (1190 AM; 25 kW; ANAHEIM, CA; Owner: NEW INSPIRATION BROADCASTING COMPANY)
KALI (900 AM; 6 kW; WEST COVINA, CA; Owner: MULTICULTURAL RADIO BROADCASTING, INC.)
Strongest FM radio stations in La Mirada:
KZLA-FM (93.9 FM; LOS ANGELES, CA; Owner: EMMIS RADIO LICENSE CORPORATION)
KCBS-FM (93.1 FM; LOS ANGELES, CA; Owner: INFINITY BROADCASTING OPERATIONS, INC.)
KPWR (105.9 FM; LOS ANGELES, CA; Owner: EMMIS RADIO LICENSE CORPORATION)
KLSX (97.1 FM; LOS ANGELES, CA; Owner: INFINITY BROADCASTING OPERATIONS, INC.)
KUSC (91.5 FM; LOS ANGELES, CA; Owner: UNIVERSITY OF SOUTHERN CALIFORNIA)
KKLA-FM (99.5 FM; LOS ANGELES, CA; Owner: NEW INSPIRATION BROADCASTING CO., INC.)
KSCA (101.9 FM; GLENDALE, CA; Owner: HBC LICENSE CORPORATION)
KLOS (95.5 FM; LOS ANGELES, CA; Owner: KLOS-FM RADIO, INC.)
K212FA (90.3 FM; TEMPLE CITY, CA; Owner: EDUCATIONAL MEDIA FOUNDATION)
KOST (103.5 FM; LOS ANGELES, CA; Owner: CAPSTAR TX LIMITED PARTNERSHIP)
KIIS-FM (102.7 FM; LOS ANGELES, CA; Owner: CITICASTERS LICENSES, L.P.)
KLVE (107.5 FM; LOS ANGELES, CA; Owner: KLVE-FM LICENSE CORP.)
KPCC (89.3 FM; PASADENA, CA; Owner: PASADENA AREA COMMUNITY COLLEGE DISTRICT)
KHHT (92.3 FM; LOS ANGELES, CA; Owner: AMFM RADIO LICENSES, L.L.C.)
KBIG-FM (104.3 FM; LOS ANGELES, CA; Owner: AMFM RADIO LICENSES, L.L.C.)
KTWV (94.7 FM; LOS ANGELES, CA; Owner: INFINITY BROADCASTING OPERATIONS, INC.)
KMZT-FM (105.1 FM; LOS ANGELES, CA; Owner: MOUNT WILSON FM BROADCASTERS, INC.)
KPFK (90.7 FM; LOS ANGELES, CA; Owner: PACIFICA FOUNDATION, INC)
K216EM (91.1 FM; ARCADIA, CA; Owner: LIFE ON THE WAY COMMUNICATIONS, INC.)
KRTH-FM (101.1 FM; LOS ANGELES, CA; Owner: INFINITY BROADCASTING OPERATIONS, INC.)
TV broadcast stations around La Mirada:
KTRO-LP (Channel 50; LANCASTER, CA; Owner: ROBERT D. ADELMAN)
KCBS-TV (Channel 2; LOS ANGELES, CA; Owner: CBS BROADCASTING INC.)
KTLA-TV (Channel 5; LOS ANGELES, CA; Owner: KTLA INC.)
KABC-TV (Channel 7; LOS ANGELES, CA; Owner: ABC HOLDING COMPANY, INC.)
KCAL-TV (Channel 9; LOS ANGELES, CA; Owner: VIACOM TELEVISION STATIONS GROUP OF LOS ANGELES LLC)
KHIZ (Channel 64; BARSTOW, CA; Owner: SUNBELT TELEVISION, INC.)
KNBC (Channel 4; LOS ANGELES, CA; Owner: NBC SUBSIDIARY (KNBC-TV), INC.)
KMEX-TV (Channel 34; LOS ANGELES, CA; Owner: KMEX LICENSE PARTNERSHIP, G.P.)
KAZA-TV (Channel 54; AVALON, CA; Owner: PAPPAS SOUTHERN CALIFORNIA LICENSE LLC)
KDOC-TV (Channel 56; ANAHEIM, CA; Owner: GOLDEN ORANGE BROADCASTING CO., INC.)
KOCE-TV (Channel 50; HUNTINGTON BEACH, CA; Owner: BD. OF TRUSTEES, COAST COMMUNITY COLLEGE DIST.)
KSCI (Channel 18; LONG BEACH, CA; Owner: KSLS, INC.)
KXLA (Channel 44; RANCHO PALOS VERDES, CA; Owner: RANCHO PALOS VERDES BROADCASTERS, INC.)
KCET (Channel 28; LOS ANGELES, CA; Owner: COMMUNITY TELEVISION OF SOUTHERN CALIFORNIA)
KFTR (Channel 46; ONTARIO, CA; Owner: TELEFUTURA LOS ANGELES LLC)
KWHY-TV (Channel 22; LOS ANGELES, CA; Owner: TELEMUNDO OF LOS ANGELES LICENSE CORPORATION)
National Bridge Inventory (NBI) Statistics 18 Number of bridges98ft / 30.5m Total length482,877 Total average daily traffic38,109 Total average daily truck traffic
New bridges - historical statistics
1 1930-1939 4 1950-1959 5 1960-1969 1 1970-1979 6 1980-1989 1 2010-2019
See full National Bridge Inventory statistics for La Mirada, CA
Home Mortgage Disclosure Act Aggregated Statistics For Year 2009(Based on 10 full tracts) A) FHA, FSA/RHS & VA B) Conventional C) Refinancings D) Home Improvement Loans E) Loans on Dwellings For 5+ Families F) Non-occupant Loans on G) Loans On Manufactured Number Average Value Number Average Value Number Average Value Number Average Value Number Average Value Number Average Value Number Average Value
LOANS ORIGINATED 162 $334,893 195 $292,720 969 $272,097 63 $186,820 1 $2,000,000 40 $236,120 1 $21,260 APPLICATIONS APPROVED, NOT ACCEPTED 9 $299,701 33 $329,683 109 $285,038 9 $93,364 0 $0 8 $269,558 1 $41,550 APPLICATIONS DENIED 22 $352,645 34 $288,071 352 $310,238 32 $107,413 0 $0 25 $201,324 2 $45,415 APPLICATIONS WITHDRAWN 19 $336,326 40 $288,426 198 $299,890 15 $227,303 0 $0 6 $302,167 0 $0 FILES CLOSED FOR INCOMPLETENESS 7 $367,309 7 $321,799 65 $302,619 7 $181,571 0 $0 5 $279,000 0 $0
Aggregated Statistics For Year 2008(Based on 10 full tracts) A) FHA, FSA/RHS & VA B) Conventional C) Refinancings D) Home Improvement Loans E) Loans on Dwellings For 5+ Families F) Non-occupant Loans on G) Loans On Manufactured Number Average Value Number Average Value Number Average Value Number Average Value Number Average Value Number Average Value Number Average Value
LOANS ORIGINATED 81 $382,085 217 $311,277 538 $277,631 59 $141,854 1 $2,246,650 58 $252,429 3 $71,183 APPLICATIONS APPROVED, NOT ACCEPTED 6 $345,667 42 $295,696 120 $320,651 22 $116,583 1 $975,000 10 $274,494 4 $79,112 APPLICATIONS DENIED 18 $392,171 75 $323,808 337 $354,290 62 $100,642 0 $0 17 $301,960 1 $100,000 APPLICATIONS WITHDRAWN 7 $368,803 45 $280,218 158 $291,067 18 $235,420 0 $0 4 $139,750 1 $80,000 FILES CLOSED FOR INCOMPLETENESS 5 $386,578 9 $346,910 50 $302,008 6 $239,333 0 $0 3 $313,333 1 $84,000
Aggregated Statistics For Year 2007(Based on 10 full tracts) A) FHA, FSA/RHS & VA B) Conventional C) Refinancings D) Home Improvement Loans E) Loans on Dwellings For 5+ Families F) Non-occupant Loans on G) Loans On Manufactured Number Average Value Number Average Value Number Average Value Number Average Value Number Average Value Number Average Value Number Average Value
LOANS ORIGINATED 1 $234,000 433 $324,825 1,120 $320,833 182 $182,716 5 $870,000 73 $302,843 2 $76,940 APPLICATIONS APPROVED, NOT ACCEPTED 0 $0 100 $346,079 262 $344,920 38 $212,450 0 $0 20 $331,580 2 $266,910 APPLICATIONS DENIED 0 $0 171 $361,435 656 $368,600 91 $219,105 0 $0 49 $342,482 5 $152,270 APPLICATIONS WITHDRAWN 0 $0 73 $331,843 291 $339,959 32 $253,624 0 $0 28 $275,880 1 $515,000 FILES CLOSED FOR INCOMPLETENESS 0 $0 19 $367,997 105 $369,082 6 $239,777 0 $0 4 $319,500 0 $0
Aggregated Statistics For Year 2006(Based on 10 full tracts) A) FHA, FSA/RHS & VA B) Conventional C) Refinancings D) Home Improvement Loans E) Loans on Dwellings For 5+ Families F) Non-occupant Loans on G) Loans On Manufactured Number Average Value Number Average Value Number Average Value Number Average Value Number Average Value Number Average Value Number Average Value
LOANS ORIGINATED 1 $162,000 673 $322,581 1,516 $321,955 284 $183,634 2 $3,801,185 110 $272,833 5 $47,074 APPLICATIONS APPROVED, NOT ACCEPTED 0 $0 122 $295,761 357 $341,623 40 $181,938 0 $0 29 $280,387 2 $79,500 APPLICATIONS DENIED 0 $0 270 $325,481 588 $359,844 121 $189,850 0 $0 33 $360,495 1 $57,010 APPLICATIONS WITHDRAWN 0 $0 140 $342,682 481 $332,286 76 $233,963 2 $452,250 28 $236,848 0 $0 FILES CLOSED FOR INCOMPLETENESS 0 $0 53 $332,651 89 $343,985 10 $179,600 0 $0 5 $296,800 0 $0
Aggregated Statistics For Year 2005(Based on 10 full tracts) A) FHA, FSA/RHS & VA B) Conventional C) Refinancings D) Home Improvement Loans E) Loans on Dwellings For 5+ Families F) Non-occupant Loans on G) Loans On Manufactured Number Average Value Number Average Value Number Average Value Number Average Value Number Average Value Number Average Value Number Average Value
LOANS ORIGINATED 3 $210,667 919 $326,433 1,852 $302,745 306 $189,862 1 $400,000 122 $278,027 4 $69,090 APPLICATIONS APPROVED, NOT ACCEPTED 1 $209,000 130 $318,435 320 $294,171 46 $121,696 0 $0 28 $285,065 6 $98,120 APPLICATIONS DENIED 0 $0 227 $313,900 676 $322,590 141 $158,334 0 $0 47 $319,119 5 $152,200 APPLICATIONS WITHDRAWN 0 $0 175 $325,594 676 $308,056 95 $181,628 0 $0 36 $297,286 0 $0 FILES CLOSED FOR INCOMPLETENESS 0 $0 32 $299,705 146 $302,318 19 $170,947 0 $0 6 $185,500 0 $0
Aggregated Statistics For Year 2004(Based on 10 full tracts) A) FHA, FSA/RHS & VA B) Conventional C) Refinancings D) Home Improvement Loans E) Loans on Dwellings For 5+ Families F) Non-occupant Loans on G) Loans On Manufactured Number Average Value Number Average Value Number Average Value Number Average Value Number Average Value Number Average Value Number Average Value
LOANS ORIGINATED 7 $186,286 847 $283,349 2,210 $258,963 311 $149,904 2 $3,363,910 129 $239,700 4 $91,000 APPLICATIONS APPROVED, NOT ACCEPTED 0 $0 156 $272,030 405 $257,010 62 $157,312 0 $0 29 $260,697 2 $43,500 APPLICATIONS DENIED 0 $0 182 $287,841 701 $263,489 137 $124,035 0 $0 48 $241,539 2 $52,425 APPLICATIONS WITHDRAWN 0 $0 132 $299,879 772 $252,432 79 $135,859 0 $0 23 $237,645 3 $176,217 FILES CLOSED FOR INCOMPLETENESS 0 $0 37 $262,751 147 $279,433 17 $162,824 0 $0 6 $280,347 0 $0
Aggregated Statistics For Year 2003(Based on 10 full tracts) A) FHA, FSA/RHS & VA B) Conventional C) Refinancings D) Home Improvement Loans E) Loans on Dwellings For 5+ Families F) Non-occupant Loans on Number Average Value Number Average Value Number Average Value Number Average Value Number Average Value Number Average Value
LOANS ORIGINATED 21 $201,816 977 $245,504 4,224 $204,809 150 $67,179 8 $884,750 178 $178,723 APPLICATIONS APPROVED, NOT ACCEPTED 1 $51,000 141 $256,671 581 $207,439 48 $53,396 0 $0 38 $195,650 APPLICATIONS DENIED 3 $216,143 161 $245,698 830 $208,413 76 $57,681 2 $1,214,000 35 $217,225 APPLICATIONS WITHDRAWN 2 $241,720 124 $260,063 891 $213,256 28 $84,174 0 $0 18 $181,429 FILES CLOSED FOR INCOMPLETENESS 0 $0 41 $260,253 181 $227,786 9 $46,700 0 $0 7 $184,191
Aggregated Statistics For Year 2002(Based on 10 full tracts) A) FHA, FSA/RHS & VA B) Conventional C) Refinancings D) Home Improvement Loans E) Loans on Dwellings For 5+ Families F) Non-occupant Loans on Number Average Value Number Average Value Number Average Value Number Average Value Number Average Value Number Average Value
LOANS ORIGINATED 54 $175,689 818 $198,980 2,907 $187,506 76 $57,673 3 $662,073 108 $163,754 APPLICATIONS APPROVED, NOT ACCEPTED 3 $163,127 85 $226,401 445 $180,780 24 $37,423 0 $0 16 $141,271 APPLICATIONS DENIED 8 $162,505 114 $197,614 624 $186,783 61 $42,376 0 $0 18 $172,526 APPLICATIONS WITHDRAWN 12 $161,813 88 $200,704 569 $193,883 37 $37,315 1 $795,000 10 $183,787 FILES CLOSED FOR INCOMPLETENESS 2 $154,500 32 $227,356 267 $196,838 2 $35,500 2 $1,325,000 8 $162,518
Aggregated Statistics For Year 2001(Based on 10 full tracts) A) FHA, FSA/RHS & VA B) Conventional C) Refinancings D) Home Improvement Loans E) Loans on Dwellings For 5+ Families F) Non-occupant Loans on Number Average Value Number Average Value Number Average Value Number Average Value Number Average Value Number Average Value
LOANS ORIGINATED 165 $184,313 617 $171,249 2,084 $168,860 87 $31,746 0 $0 111 $149,557 APPLICATIONS APPROVED, NOT ACCEPTED 9 $195,667 68 $167,873 283 $161,329 20 $59,550 1 $400,000 14 $136,562 APPLICATIONS DENIED 15 $176,437 76 $147,855 665 $161,353 74 $28,591 0 $0 22 $105,821 APPLICATIONS WITHDRAWN 23 $171,550 65 $173,914 539 $164,565 32 $54,345 0 $0 11 $113,818 FILES CLOSED FOR INCOMPLETENESS 2 $176,500 21 $172,565 175 $168,085 2 $45,000 0 $0 5 $190,200
Aggregated Statistics For Year 2000(Based on 10 full tracts) A) FHA, FSA/RHS & VA B) Conventional C) Refinancings D) Home Improvement Loans E) Loans on Dwellings For 5+ Families F) Non-occupant Loans on Number Average Value Number Average Value Number Average Value Number Average Value Number Average Value Number Average Value
LOANS ORIGINATED 140 $164,819 597 $156,846 489 $125,722 112 $32,695 4 $1,383,750 35 $106,948 APPLICATIONS APPROVED, NOT ACCEPTED 7 $154,407 61 $171,737 111 $141,823 56 $26,625 0 $0 8 $85,876 APPLICATIONS DENIED 17 $123,445 86 $151,551 310 $115,701 97 $28,344 1 $161,000 14 $93,000 APPLICATIONS WITHDRAWN 6 $179,717 78 $144,154 213 $116,696 25 $35,342 0 $0 4 $135,000 FILES CLOSED FOR INCOMPLETENESS 6 $106,245 15 $111,596 86 $149,902 4 $24,718 1 $4,553,000 5 $131,000
Aggregated Statistics For Year 1999(Based on 7 full and 3 partial tracts) A) FHA, FSA/RHS & VA B) Conventional C) Refinancings D) Home Improvement Loans E) Loans on Dwellings For 5+ Families F) Non-occupant Loans on Number Average Value Number Average Value Number Average Value Number Average Value Number Average Value Number Average Value
LOANS ORIGINATED 179 $165,544 735 $158,887 934 $142,387 129 $24,141 3 $153,150 58 $99,647 APPLICATIONS APPROVED, NOT ACCEPTED 6 $155,555 108 $163,552 201 $149,706 65 $28,004 0 $0 10 $99,250 APPLICATIONS DENIED 27 $160,719 115 $171,223 422 $120,965 77 $26,624 1 $147,000 17 $111,281 APPLICATIONS WITHDRAWN 8 $149,101 141 $173,398 270 $138,969 12 $59,592 1 $127,430 5 $165,454 FILES CLOSED FOR INCOMPLETENESS 5 $128,428 30 $160,085 122 $158,952 2 $96,580 1 $2,457,820 2 $105,770
Detailed mortgage data for all 10 tracts in La Mirada, CA
Private Mortgage Insurance Companies Aggregated Statistics For Year 2009(Based on 10 full tracts) A) Conventional B) Refinancings Number Average Value Number Average Value
LOANS ORIGINATED 33 $347,136 10 $362,500 APPLICATIONS APPROVED, NOT ACCEPTED 12 $371,903 5 $432,432 APPLICATIONS DENIED 2 $266,215 1 $383,000 APPLICATIONS WITHDRAWN 3 $313,733 0 $0 FILES CLOSED FOR INCOMPLETENESS 1 $321,780 0 $0
Aggregated Statistics For Year 2008(Based on 10 full tracts) A) Conventional B) Refinancings C) Non-occupant Loans on Number Average Value Number Average Value Number Average Value
LOANS ORIGINATED 64 $364,474 14 $397,595 2 $388,500 APPLICATIONS APPROVED, NOT ACCEPTED 24 $384,349 8 $448,768 2 $436,500 APPLICATIONS DENIED 12 $332,583 5 $447,000 1 $352,000 APPLICATIONS WITHDRAWN 2 $355,500 0 $0 0 $0 FILES CLOSED FOR INCOMPLETENESS 3 $437,770 1 $490,000 1 $565,000
Aggregated Statistics For Year 2007(Based on 10 full tracts) A) Conventional B) Refinancings C) Non-occupant Loans on Number Average Value Number Average Value Number Average Value
LOANS ORIGINATED 23 $400,827 18 $487,313 2 $389,500 APPLICATIONS APPROVED, NOT ACCEPTED 5 $418,600 6 $566,500 0 $0 APPLICATIONS DENIED 1 $420,000 0 $0 0 $0 APPLICATIONS WITHDRAWN 3 $400,333 2 $551,930 1 $459,000 FILES CLOSED FOR INCOMPLETENESS 0 $0 0 $0 0 $0
Aggregated Statistics For Year 2006(Based on 8 full tracts) A) Conventional B) Refinancings C) Non-occupant Loans on Number Average Value Number Average Value Number Average Value
LOANS ORIGINATED 3 $476,000 6 $424,603 0 $0 APPLICATIONS APPROVED, NOT ACCEPTED 2 $475,985 4 $416,960 0 $0 APPLICATIONS DENIED 0 $0 0 $0 0 $0 APPLICATIONS WITHDRAWN 1 $497,000 1 $450,000 1 $497,000 FILES CLOSED FOR INCOMPLETENESS 0 $0 0 $0 0 $0
Aggregated Statistics For Year 2005(Based on 9 full tracts) A) Conventional B) Refinancings C) Non-occupant Loans on D) Loans On Manufactured Number Average Value Number Average Value Number Average Value Number Average Value
LOANS ORIGINATED 24 $397,036 12 $337,682 2 $389,950 1 $354,000 APPLICATIONS APPROVED, NOT ACCEPTED 2 $538,500 3 $505,393 0 $0 0 $0 APPLICATIONS DENIED 0 $0 0 $0 0 $0 0 $0 APPLICATIONS WITHDRAWN 0 $0 6 $400,333 1 $299,000 0 $0 FILES CLOSED FOR INCOMPLETENESS 0 $0 2 $359,500 1 $123,000 0 $0
Aggregated Statistics For Year 2004(Based on 10 full tracts) A) Conventional B) Refinancings C) Non-occupant Loans on Number Average Value Number Average Value Number Average Value
LOANS ORIGINATED 29 $354,963 23 $304,691 2 $360,000 APPLICATIONS APPROVED, NOT ACCEPTED 8 $366,934 16 $276,124 1 $227,080 APPLICATIONS DENIED 3 $420,863 0 $0 0 $0 APPLICATIONS WITHDRAWN 3 $317,687 3 $308,667 1 $383,000 FILES CLOSED FOR INCOMPLETENESS 2 $382,000 1 $125,000 0 $0
Aggregated Statistics For Year 2003(Based on 10 full tracts) A) Conventional B) Refinancings C) Non-occupant Loans on Number Average Value Number Average Value Number Average Value
LOANS ORIGINATED 88 $272,483 72 $265,421 4 $243,545 APPLICATIONS APPROVED, NOT ACCEPTED 29 $244,488 39 $242,575 3 $226,573 APPLICATIONS DENIED 0 $0 0 $0 0 $0 APPLICATIONS WITHDRAWN 4 $304,272 0 $0 2 $333,545 FILES CLOSED FOR INCOMPLETENESS 0 $0 0 $0 0 $0
Aggregated Statistics For Year 2002(Based on 10 full tracts) A) Conventional B) Refinancings C) Non-occupant Loans on Number Average Value Number Average Value Number Average Value
LOANS ORIGINATED 152 $246,559 131 $237,543 6 $209,042 APPLICATIONS APPROVED, NOT ACCEPTED 24 $216,263 46 $221,561 3 $109,667 APPLICATIONS DENIED 2 $282,000 5 $235,000 0 $0 APPLICATIONS WITHDRAWN 8 $228,750 12 $212,392 3 $239,333 FILES CLOSED FOR INCOMPLETENESS 2 $187,500 0 $0 0 $0
Aggregated Statistics For Year 2001(Based on 10 full tracts) A) Conventional B) Refinancings C) Non-occupant Loans on Number Average Value Number Average Value Number Average Value
LOANS ORIGINATED 180 $218,861 148 $216,836 3 $158,000 APPLICATIONS APPROVED, NOT ACCEPTED 33 $201,193 33 $208,865 1 $143,010 APPLICATIONS DENIED 2 $155,000 6 $242,688 0 $0 APPLICATIONS WITHDRAWN 4 $237,905 5 $193,428 0 $0 FILES CLOSED FOR INCOMPLETENESS 0 $0 0 $0 0 $0
Aggregated Statistics For Year 2000(Based on 10 full tracts) A) Conventional B) Refinancings C) Non-occupant Loans on Number Average Value Number Average Value Number Average Value
LOANS ORIGINATED 132 $196,474 45 $192,566 7 $159,704 APPLICATIONS APPROVED, NOT ACCEPTED 33 $213,454 18 $180,462 0 $0 APPLICATIONS DENIED 5 $193,600 10 $212,400 0 $0 APPLICATIONS WITHDRAWN 3 $198,000 1 $210,000 0 $0 FILES CLOSED FOR INCOMPLETENESS 2 $255,500 1 $244,000 0 $0
Aggregated Statistics For Year 1999(Based on 7 full and 3 partial tracts) A) Conventional B) Refinancings C) Non-occupant Loans on Number Average Value Number Average Value Number Average Value
LOANS ORIGINATED 183 $197,307 122 $181,920 2 $131,635 APPLICATIONS APPROVED, NOT ACCEPTED 21 $180,574 48 $177,884 0 $0 APPLICATIONS DENIED 6 $179,703 3 $177,853 0 $0 APPLICATIONS WITHDRAWN 6 $193,315 2 $273,805 0 $0 FILES CLOSED FOR INCOMPLETENESS 1 $165,650 3 $149,717 0 $0
Fire-safe hotels and motels in La Mirada, California:
Residence Inn By Marriott La Mirada/Buena Park, 14419 Firestone Blvd, La Mirada, California 90638 Phone: (714) 523-2800, Fax: (714) 522-5884
Extended Stay America - Los Angeles - La Mirada, 14775 Firestone Blvd, La Mirada, California 90638 Phone: (714) 670-8579, Fax: (714) 670-8361
All 2 fire-safe hotels and motels in La Mirada, California
Most common first names in La Mirada, CA among deceased individuals Name Count Lived (average)
John 185 74.7 years Robert 182 69.1 years Mary 181 79.5 years William 156 74.5 years James 128 71.3 years Charles 122 73.3 years George 106 74.7 years Helen 94 80.3 years Margaret 93 80.1 years Joseph 91 75.6 years
Most common last names in La Mirada, CA among deceased individuals Last name Count Lived (average)
Smith 63 74.7 years Johnson 41 75.4 years Jones 40 75.5 years Brown 32 74.0 years Garcia 32 77.4 years Miller 32 74.4 years Davis 31 73.2 years Martinez 30 72.6 years Anderson 29 74.8 years Williams 27 78.4 years
La Mirada compared to California state average:
Unemployed percentage significantly below state average. Black race population percentage significantly below state average. Median age above state average. Renting percentage below state average. Length of stay since moving in significantly above state average. Percentage of population with a bachelor's degree or higher above state average.
#17 on the list of "Top 101 cities where residents moved in more then 10 years ago (10,000+ households)"
#51 on the list of "Top 101 cities with the most residents born in Korea (population 500+)"
#1 on the list of "Top 101 counties with the most Evangelical Protestant congregations"
#1 on the list of "Top 101 counties with the most Mainline Protestant congregations"
#1 on the list of "Top 101 counties with the most Orthodox adherents"
#1 on the list of "Top 101 counties with the highest ground withdrawal of fresh water for public supply (pop. 50,000+)"
#1 on the list of "Top 101 counties with the most Catholic adherents (pop. 50,000+)"
Top Patent Applicants
Charles W. Beeson (10)
David T. Boltz (8)
Danny Lee Haile (8)
Patrick Beresewicz (7)
Stuart Yamamoto (6)
David W. Kwok (6)
Ramez Emile Necola Shehada (5)
Abimael Cordova (5)
Dan Kuykendall (4)
Parsa Mirmobin (4)
Total of 185 patent applications in 2008-2024.
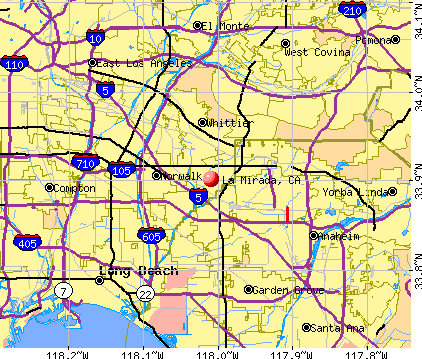


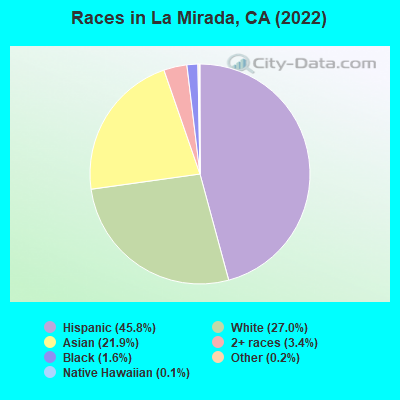
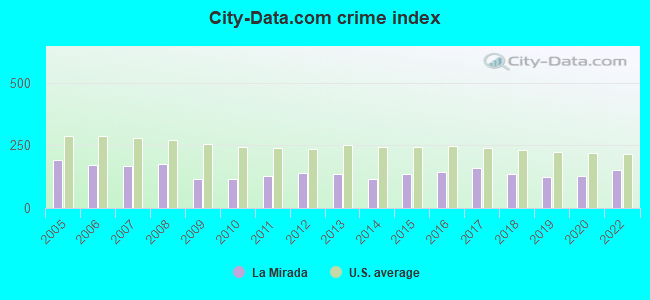
 Recent articles from our blog. Our writers, many of them Ph.D. graduates or candidates, create easy-to-read articles on a wide variety of topics.

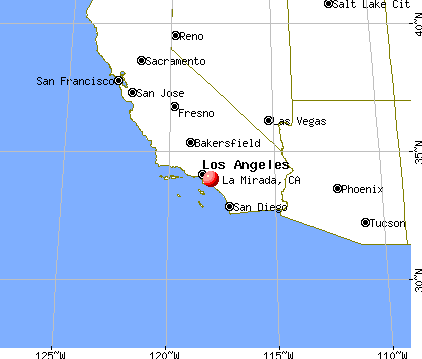
 , pop. 55,193).
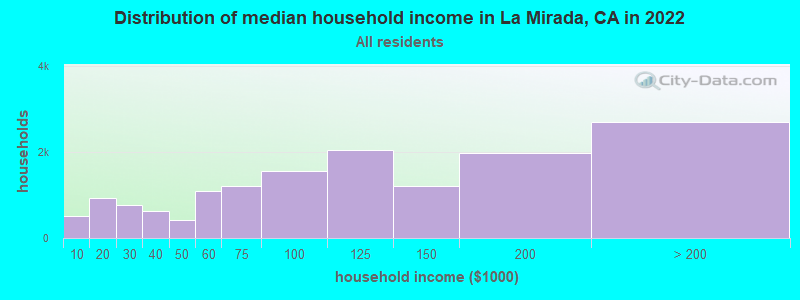
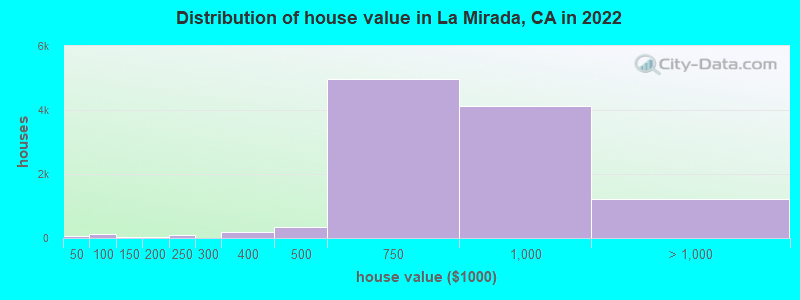
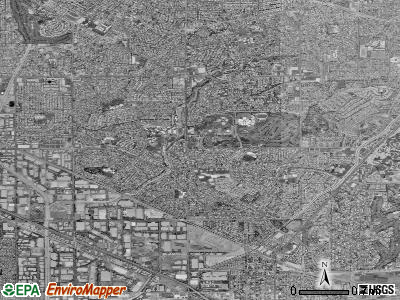
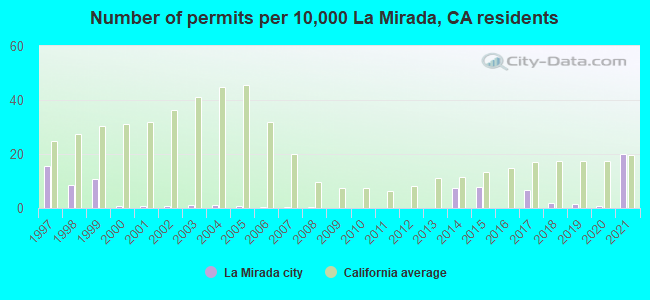
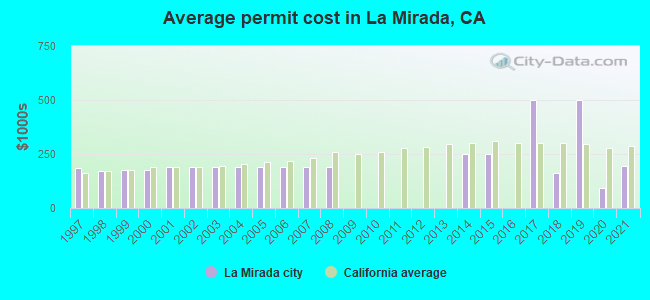
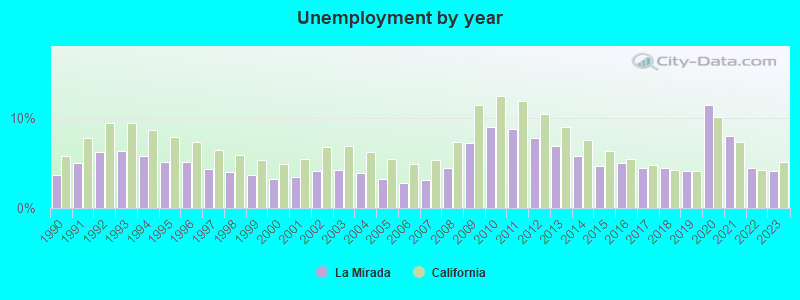
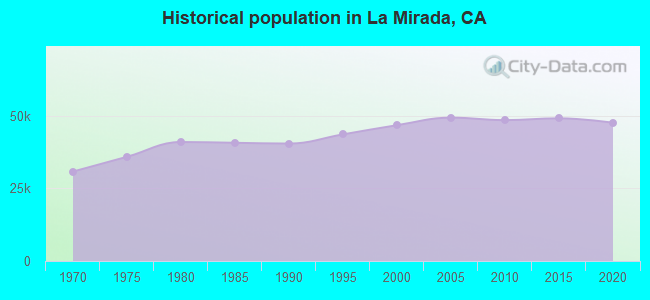
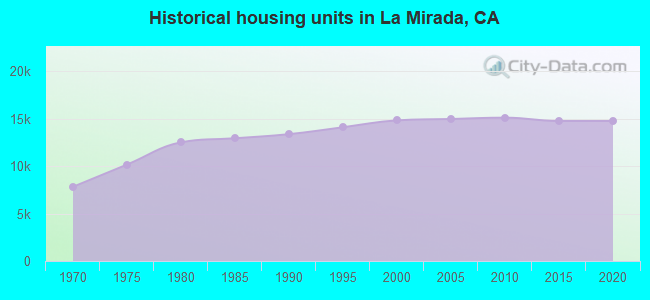
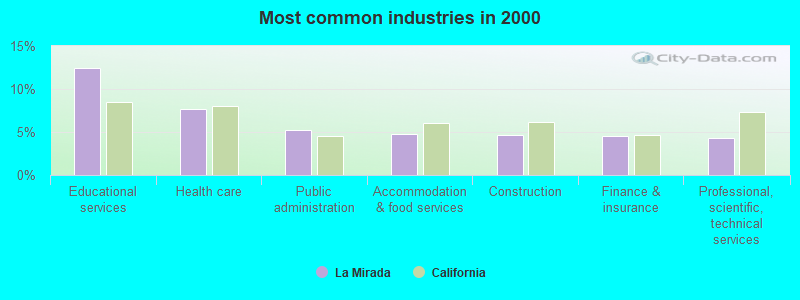
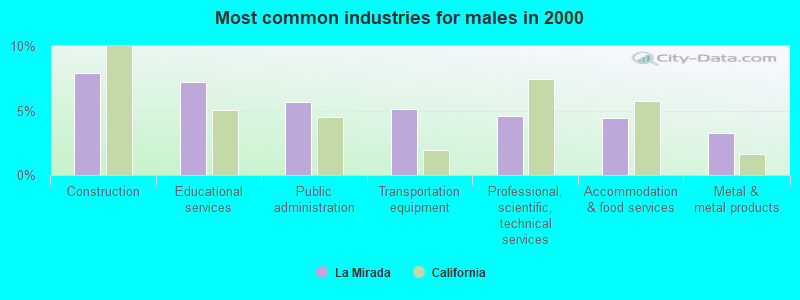
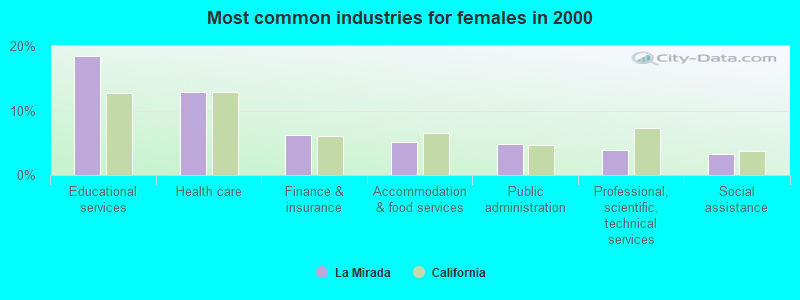
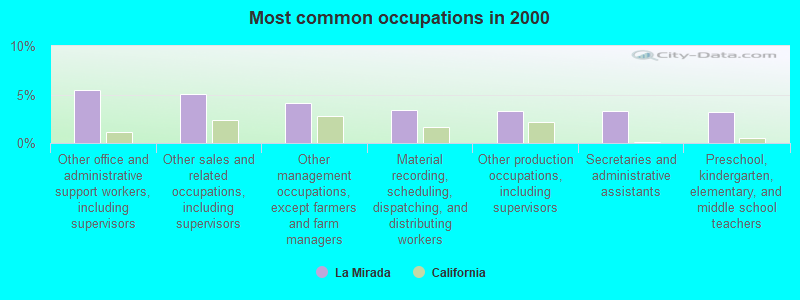
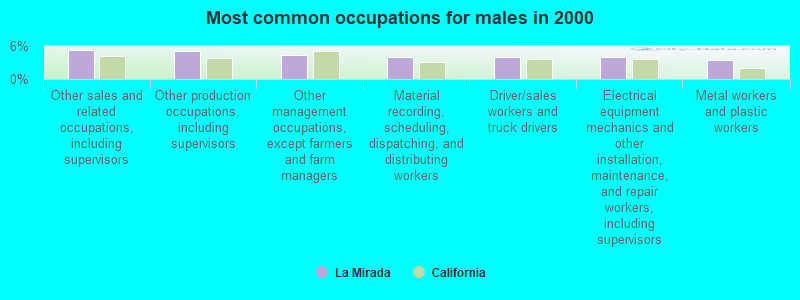
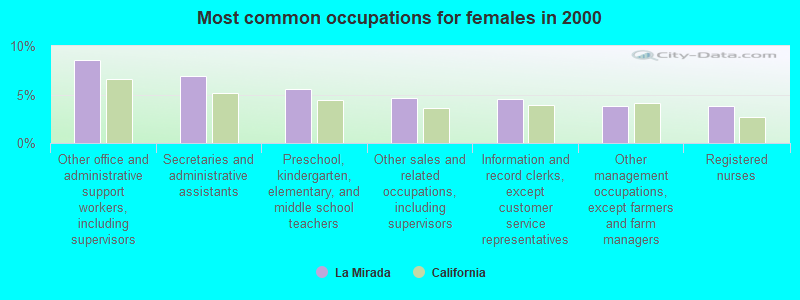
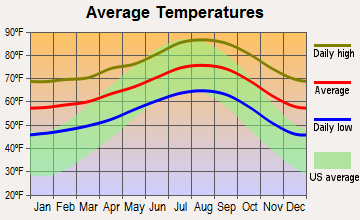
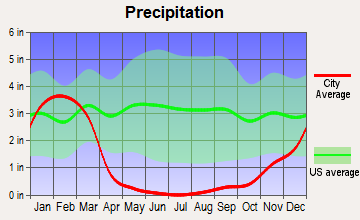
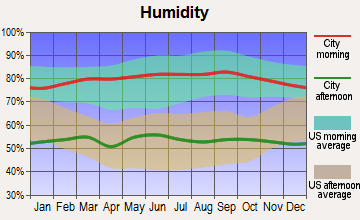
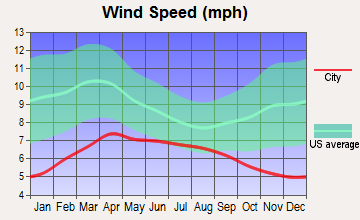
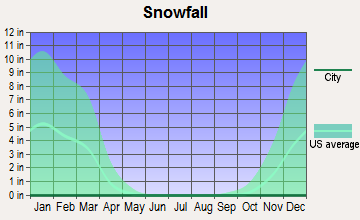
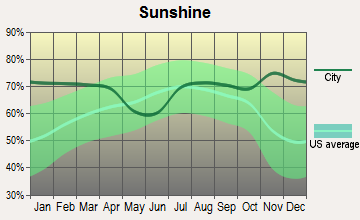
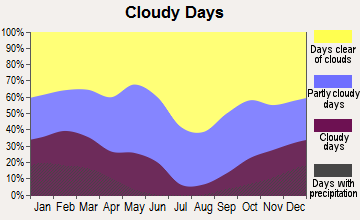
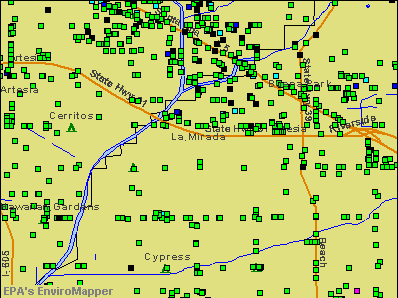

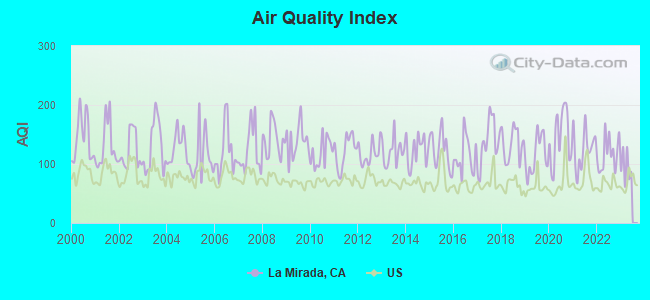
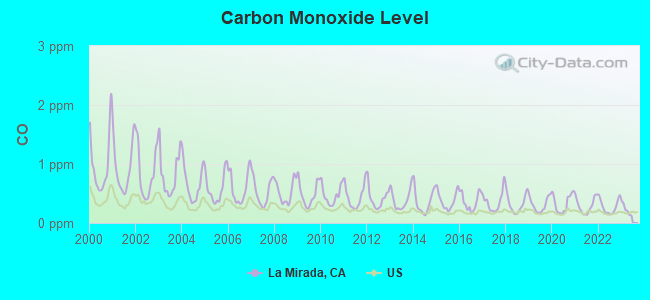
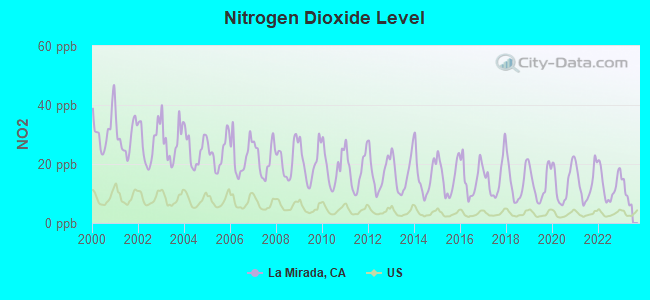
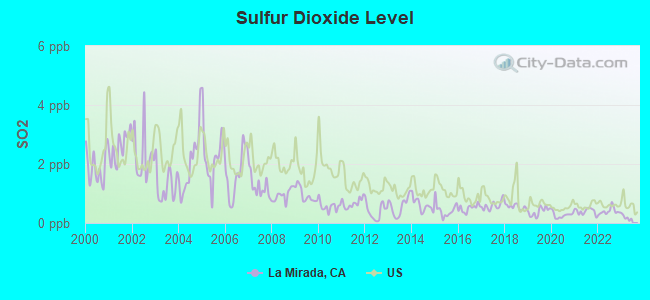
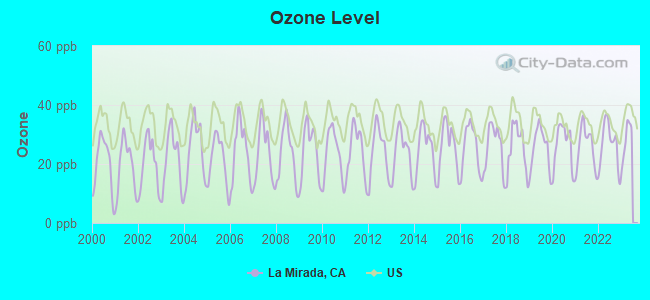
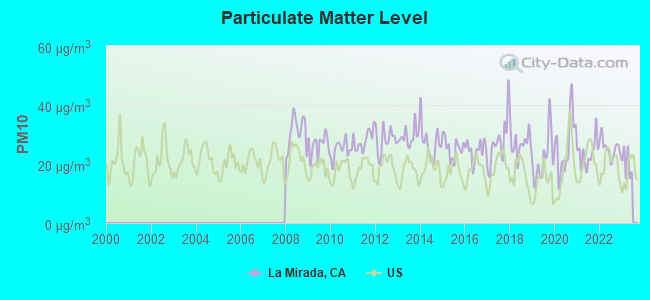
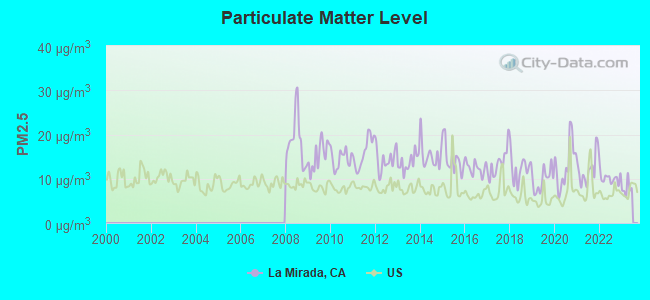
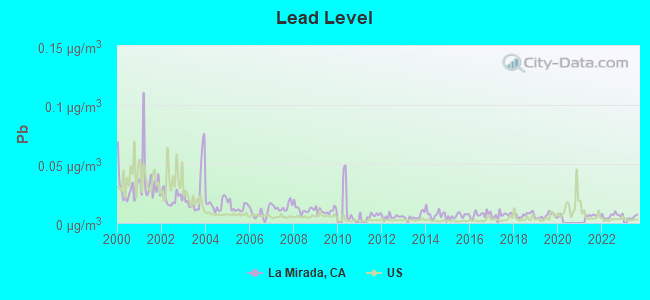
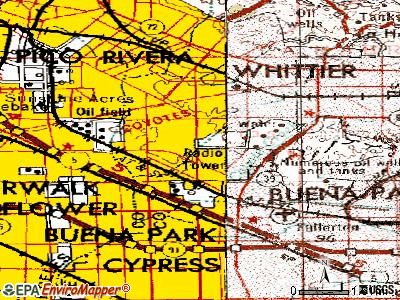
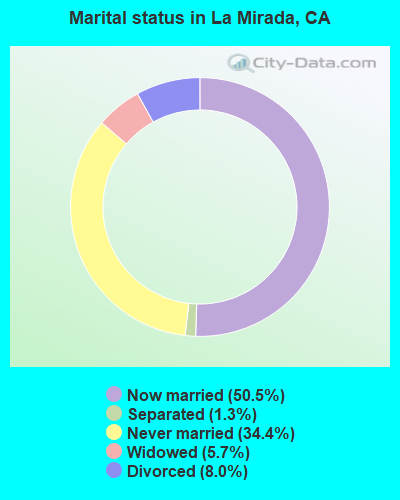
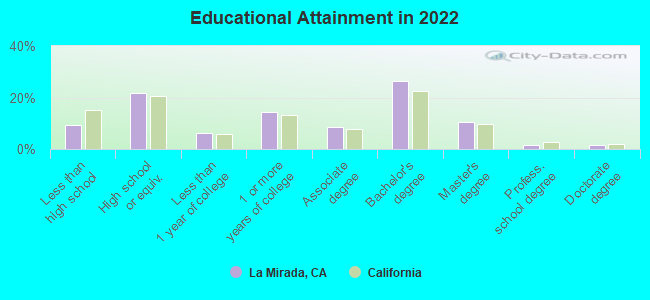
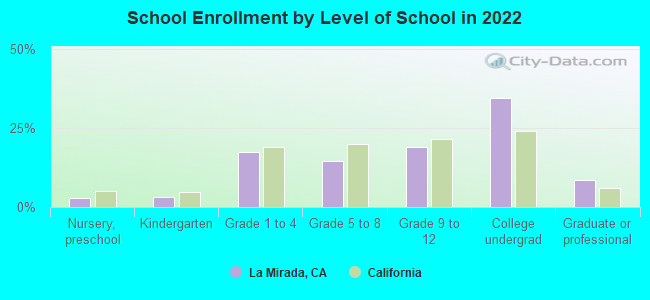
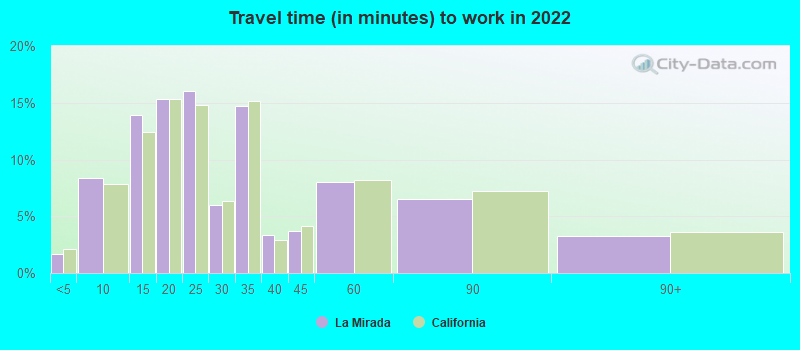
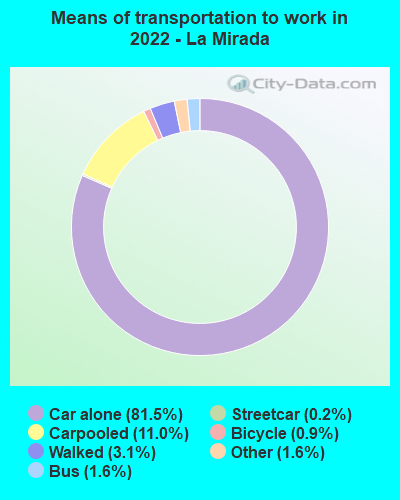


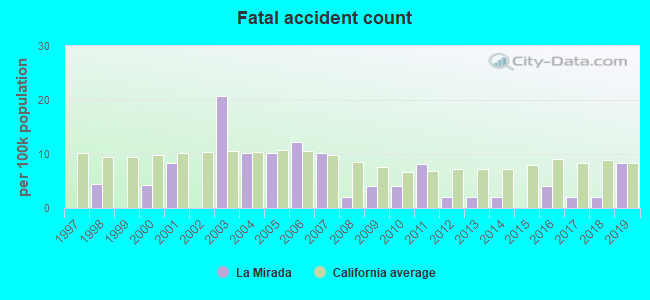
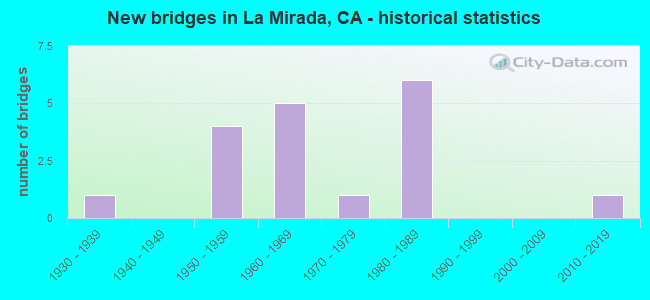
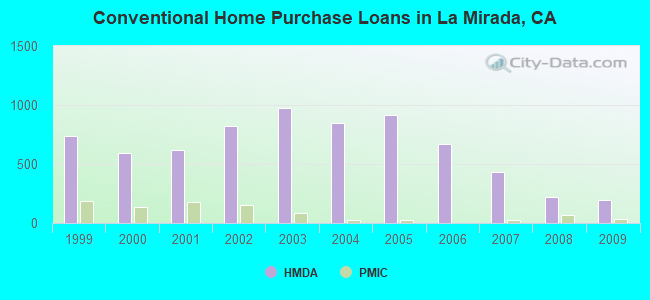
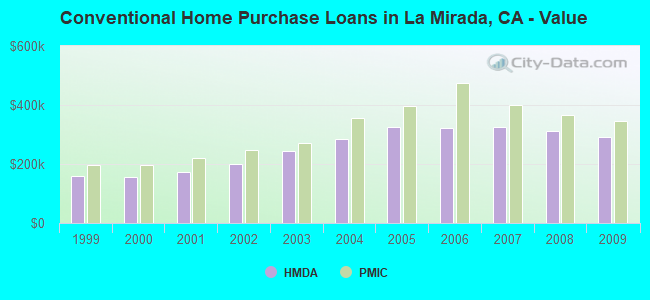
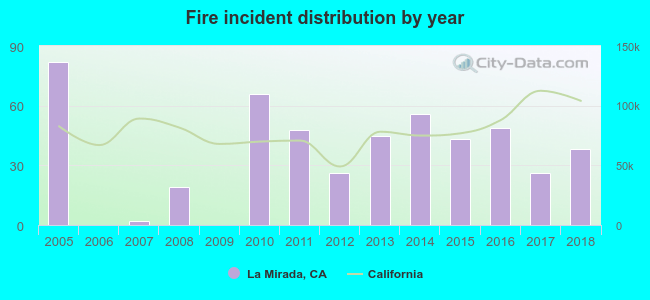 According to the data from the years 2005 - 2018 the average number of fire incidents per year is 36. The highest number of fire incidents - 82 took place in 2005, and the least - 0 in 2006. The data has a declining trend.
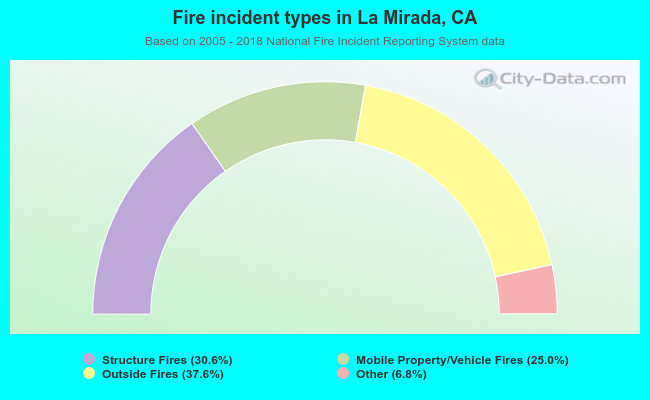 When looking into fire subcategories, the most incidents belonged to: Outside Fires (37.6%), and Structure Fires (30.6%).