Cerritos, California Submit your own pictures of this city and show them to the world
OSM Map
General Map
Google Map
MSN Map
OSM Map
General Map
Google Map
MSN Map
OSM Map
General Map
Google Map
MSN Map
OSM Map
General Map
Google Map
MSN Map
Please wait while loading the map...
Population in 2022: 47,475 (100% urban, 0% rural). Population change since 2000: -7.8%Males: 23,787 Females: 23,688
March 2022 cost of living index in Cerritos: 138.8 (high, U.S. average is 100) Percentage of residents living in poverty in 2022: 5.0%for White Non-Hispanic residents , 11.8% for Black residents , 6.8% for Hispanic or Latino residents , 18.8% for American Indian residents , 9.5% for other race residents , 3.7% for two or more races residents )
Profiles of local businesses
Business Search - 14 Million verified businesses
Data:
Median household income ($)
Median household income (% change since 2000)
Household income diversity
Ratio of average income to average house value (%)
Ratio of average income to average rent
Median household income ($) - White
Median household income ($) - Black or African American
Median household income ($) - Asian
Median household income ($) - Hispanic or Latino
Median household income ($) - American Indian and Alaska Native
Median household income ($) - Multirace
Median household income ($) - Other Race
Median household income for houses/condos with a mortgage ($)
Median household income for apartments without a mortgage ($)
Races - White alone (%)
Races - White alone (% change since 2000)
Races - Black alone (%)
Races - Black alone (% change since 2000)
Races - American Indian alone (%)
Races - American Indian alone (% change since 2000)
Races - Asian alone (%)
Races - Asian alone (% change since 2000)
Races - Hispanic (%)
Races - Hispanic (% change since 2000)
Races - Native Hawaiian and Other Pacific Islander alone (%)
Races - Native Hawaiian and Other Pacific Islander alone (% change since 2000)
Races - Two or more races (%)
Races - Two or more races (% change since 2000)
Races - Other race alone (%)
Races - Other race alone (% change since 2000)
Racial diversity
Unemployment (%)
Unemployment (% change since 2000)
Unemployment (%) - White
Unemployment (%) - Black or African American
Unemployment (%) - Asian
Unemployment (%) - Hispanic or Latino
Unemployment (%) - American Indian and Alaska Native
Unemployment (%) - Multirace
Unemployment (%) - Other Race
Population density (people per square mile)
Population - Males (%)
Population - Females (%)
Population - Males (%) - White
Population - Males (%) - Black or African American
Population - Males (%) - Asian
Population - Males (%) - Hispanic or Latino
Population - Males (%) - American Indian and Alaska Native
Population - Males (%) - Multirace
Population - Males (%) - Other Race
Population - Females (%) - White
Population - Females (%) - Black or African American
Population - Females (%) - Asian
Population - Females (%) - Hispanic or Latino
Population - Females (%) - American Indian and Alaska Native
Population - Females (%) - Multirace
Population - Females (%) - Other Race
Coronavirus confirmed cases (Apr 27, 2024)
Deaths caused by coronavirus (Apr 27, 2024)
Coronavirus confirmed cases (per 100k population) (Apr 27, 2024)
Deaths caused by coronavirus (per 100k population) (Apr 27, 2024)
Daily increase in number of cases (Apr 27, 2024)
Weekly increase in number of cases (Apr 27, 2024)
Cases doubled (in days) (Apr 27, 2024)
Hospitalized patients (Apr 18, 2022)
Negative test results (Apr 18, 2022)
Total test results (Apr 18, 2022)
COVID Vaccine doses distributed (per 100k population) (Sep 19, 2023)
COVID Vaccine doses administered (per 100k population) (Sep 19, 2023)
COVID Vaccine doses distributed (Sep 19, 2023)
COVID Vaccine doses administered (Sep 19, 2023)
Likely homosexual households (%)
Likely homosexual households (% change since 2000)
Likely homosexual households - Lesbian couples (%)
Likely homosexual households - Lesbian couples (% change since 2000)
Likely homosexual households - Gay men (%)
Likely homosexual households - Gay men (% change since 2000)
Cost of living index
Median gross rent ($)
Median contract rent ($)
Median monthly housing costs ($)
Median house or condo value ($)
Median house or condo value ($ change since 2000)
Mean house or condo value by units in structure - 1, detached ($)
Mean house or condo value by units in structure - 1, attached ($)
Mean house or condo value by units in structure - 2 ($)
Mean house or condo value by units in structure by units in structure - 3 or 4 ($)
Mean house or condo value by units in structure - 5 or more ($)
Mean house or condo value by units in structure - Boat, RV, van, etc. ($)
Mean house or condo value by units in structure - Mobile home ($)
Median house or condo value ($) - White
Median house or condo value ($) - Black or African American
Median house or condo value ($) - Asian
Median house or condo value ($) - Hispanic or Latino
Median house or condo value ($) - American Indian and Alaska Native
Median house or condo value ($) - Multirace
Median house or condo value ($) - Other Race
Median resident age
Resident age diversity
Median resident age - Males
Median resident age - Females
Median resident age - White
Median resident age - Black or African American
Median resident age - Asian
Median resident age - Hispanic or Latino
Median resident age - American Indian and Alaska Native
Median resident age - Multirace
Median resident age - Other Race
Median resident age - Males - White
Median resident age - Males - Black or African American
Median resident age - Males - Asian
Median resident age - Males - Hispanic or Latino
Median resident age - Males - American Indian and Alaska Native
Median resident age - Males - Multirace
Median resident age - Males - Other Race
Median resident age - Females - White
Median resident age - Females - Black or African American
Median resident age - Females - Asian
Median resident age - Females - Hispanic or Latino
Median resident age - Females - American Indian and Alaska Native
Median resident age - Females - Multirace
Median resident age - Females - Other Race
Commute - mean travel time to work (minutes)
Travel time to work - Less than 5 minutes (%)
Travel time to work - Less than 5 minutes (% change since 2000)
Travel time to work - 5 to 9 minutes (%)
Travel time to work - 5 to 9 minutes (% change since 2000)
Travel time to work - 10 to 19 minutes (%)
Travel time to work - 10 to 19 minutes (% change since 2000)
Travel time to work - 20 to 29 minutes (%)
Travel time to work - 20 to 29 minutes (% change since 2000)
Travel time to work - 30 to 39 minutes (%)
Travel time to work - 30 to 39 minutes (% change since 2000)
Travel time to work - 40 to 59 minutes (%)
Travel time to work - 40 to 59 minutes (% change since 2000)
Travel time to work - 60 to 89 minutes (%)
Travel time to work - 60 to 89 minutes (% change since 2000)
Travel time to work - 90 or more minutes (%)
Travel time to work - 90 or more minutes (% change since 2000)
Marital status - Never married (%)
Marital status - Now married (%)
Marital status - Separated (%)
Marital status - Widowed (%)
Marital status - Divorced (%)
Median family income ($)
Median family income (% change since 2000)
Median non-family income ($)
Median non-family income (% change since 2000)
Median per capita income ($)
Median per capita income (% change since 2000)
Median family income ($) - White
Median family income ($) - Black or African American
Median family income ($) - Asian
Median family income ($) - Hispanic or Latino
Median family income ($) - American Indian and Alaska Native
Median family income ($) - Multirace
Median family income ($) - Other Race
Median year house/condo built
Median year apartment built
Year house built - Built 2005 or later (%)
Year house built - Built 2000 to 2004 (%)
Year house built - Built 1990 to 1999 (%)
Year house built - Built 1980 to 1989 (%)
Year house built - Built 1970 to 1979 (%)
Year house built - Built 1960 to 1969 (%)
Year house built - Built 1950 to 1959 (%)
Year house built - Built 1940 to 1949 (%)
Year house built - Built 1939 or earlier (%)
Average household size
Household density (households per square mile)
Average household size - White
Average household size - Black or African American
Average household size - Asian
Average household size - Hispanic or Latino
Average household size - American Indian and Alaska Native
Average household size - Multirace
Average household size - Other Race
Occupied housing units (%)
Vacant housing units (%)
Owner occupied housing units (%)
Renter occupied housing units (%)
Vacancy status - For rent (%)
Vacancy status - For sale only (%)
Vacancy status - Rented or sold, not occupied (%)
Vacancy status - For seasonal, recreational, or occasional use (%)
Vacancy status - For migrant workers (%)
Vacancy status - Other vacant (%)
Residents with income below the poverty level (%)
Residents with income below 50% of the poverty level (%)
Children below poverty level (%)
Poor families by family type - Married-couple family (%)
Poor families by family type - Male, no wife present (%)
Poor families by family type - Female, no husband present (%)
Poverty status for native-born residents (%)
Poverty status for foreign-born residents (%)
Poverty among high school graduates not in families (%)
Poverty among people who did not graduate high school not in families (%)
Residents with income below the poverty level (%) - White
Residents with income below the poverty level (%) - Black or African American
Residents with income below the poverty level (%) - Asian
Residents with income below the poverty level (%) - Hispanic or Latino
Residents with income below the poverty level (%) - American Indian and Alaska Native
Residents with income below the poverty level (%) - Multirace
Residents with income below the poverty level (%) - Other Race
Air pollution - Air Quality Index (AQI)
Air pollution - CO
Air pollution - NO2
Air pollution - SO2
Air pollution - Ozone
Air pollution - PM10
Air pollution - PM25
Air pollution - Pb
Crime - Murders per 100,000 population
Crime - Rapes per 100,000 population
Crime - Robberies per 100,000 population
Crime - Assaults per 100,000 population
Crime - Burglaries per 100,000 population
Crime - Thefts per 100,000 population
Crime - Auto thefts per 100,000 population
Crime - Arson per 100,000 population
Crime - City-data.com crime index
Crime - Violent crime index
Crime - Property crime index
Crime - Murders per 100,000 population (5 year average)
Crime - Rapes per 100,000 population (5 year average)
Crime - Robberies per 100,000 population (5 year average)
Crime - Assaults per 100,000 population (5 year average)
Crime - Burglaries per 100,000 population (5 year average)
Crime - Thefts per 100,000 population (5 year average)
Crime - Auto thefts per 100,000 population (5 year average)
Crime - Arson per 100,000 population (5 year average)
Crime - City-data.com crime index (5 year average)
Crime - Violent crime index (5 year average)
Crime - Property crime index (5 year average)
1996 Presidential Elections Results (%) - Democratic Party (Clinton)
1996 Presidential Elections Results (%) - Republican Party (Dole)
1996 Presidential Elections Results (%) - Other
2000 Presidential Elections Results (%) - Democratic Party (Gore)
2000 Presidential Elections Results (%) - Republican Party (Bush)
2000 Presidential Elections Results (%) - Other
2004 Presidential Elections Results (%) - Democratic Party (Kerry)
2004 Presidential Elections Results (%) - Republican Party (Bush)
2004 Presidential Elections Results (%) - Other
2008 Presidential Elections Results (%) - Democratic Party (Obama)
2008 Presidential Elections Results (%) - Republican Party (McCain)
2008 Presidential Elections Results (%) - Other
2012 Presidential Elections Results (%) - Democratic Party (Obama)
2012 Presidential Elections Results (%) - Republican Party (Romney)
2012 Presidential Elections Results (%) - Other
2016 Presidential Elections Results (%) - Democratic Party (Clinton)
2016 Presidential Elections Results (%) - Republican Party (Trump)
2016 Presidential Elections Results (%) - Other
2020 Presidential Elections Results (%) - Democratic Party (Biden)
2020 Presidential Elections Results (%) - Republican Party (Trump)
2020 Presidential Elections Results (%) - Other
Ancestries Reported - Arab (%)
Ancestries Reported - Czech (%)
Ancestries Reported - Danish (%)
Ancestries Reported - Dutch (%)
Ancestries Reported - English (%)
Ancestries Reported - French (%)
Ancestries Reported - French Canadian (%)
Ancestries Reported - German (%)
Ancestries Reported - Greek (%)
Ancestries Reported - Hungarian (%)
Ancestries Reported - Irish (%)
Ancestries Reported - Italian (%)
Ancestries Reported - Lithuanian (%)
Ancestries Reported - Norwegian (%)
Ancestries Reported - Polish (%)
Ancestries Reported - Portuguese (%)
Ancestries Reported - Russian (%)
Ancestries Reported - Scotch-Irish (%)
Ancestries Reported - Scottish (%)
Ancestries Reported - Slovak (%)
Ancestries Reported - Subsaharan African (%)
Ancestries Reported - Swedish (%)
Ancestries Reported - Swiss (%)
Ancestries Reported - Ukrainian (%)
Ancestries Reported - United States (%)
Ancestries Reported - Welsh (%)
Ancestries Reported - West Indian (%)
Ancestries Reported - Other (%)
Educational Attainment - No schooling completed (%)
Educational Attainment - Less than high school (%)
Educational Attainment - High school or equivalent (%)
Educational Attainment - Less than 1 year of college (%)
Educational Attainment - 1 or more years of college (%)
Educational Attainment - Associate degree (%)
Educational Attainment - Bachelor's degree (%)
Educational Attainment - Master's degree (%)
Educational Attainment - Professional school degree (%)
Educational Attainment - Doctorate degree (%)
School Enrollment - Nursery, preschool (%)
School Enrollment - Kindergarten (%)
School Enrollment - Grade 1 to 4 (%)
School Enrollment - Grade 5 to 8 (%)
School Enrollment - Grade 9 to 12 (%)
School Enrollment - College undergrad (%)
School Enrollment - Graduate or professional (%)
School Enrollment - Not enrolled in school (%)
School enrollment - Public schools (%)
School enrollment - Private schools (%)
School enrollment - Not enrolled (%)
Median number of rooms in houses and condos
Median number of rooms in apartments
Housing units lacking complete plumbing facilities (%)
Housing units lacking complete kitchen facilities (%)
Density of houses
Urban houses (%)
Rural houses (%)
Households with people 60 years and over (%)
Households with people 65 years and over (%)
Households with people 75 years and over (%)
Households with one or more nonrelatives (%)
Households with no nonrelatives (%)
Population in households (%)
Family households (%)
Nonfamily households (%)
Population in families (%)
Family households with own children (%)
Median number of bedrooms in owner occupied houses
Mean number of bedrooms in owner occupied houses
Median number of bedrooms in renter occupied houses
Mean number of bedrooms in renter occupied houses
Median number of vehichles in owner occupied houses
Mean number of vehichles in owner occupied houses
Median number of vehichles in renter occupied houses
Mean number of vehichles in renter occupied houses
Mortgage status - with mortgage (%)
Mortgage status - with second mortgage (%)
Mortgage status - with home equity loan (%)
Mortgage status - with both second mortgage and home equity loan (%)
Mortgage status - without a mortgage (%)
Average family size
Average family size - White
Average family size - Black or African American
Average family size - Asian
Average family size - Hispanic or Latino
Average family size - American Indian and Alaska Native
Average family size - Multirace
Average family size - Other Race
Geographical mobility - Same house 1 year ago (%)
Geographical mobility - Moved within same county (%)
Geographical mobility - Moved from different county within same state (%)
Geographical mobility - Moved from different state (%)
Geographical mobility - Moved from abroad (%)
Place of birth - Born in state of residence (%)
Place of birth - Born in other state (%)
Place of birth - Native, outside of US (%)
Place of birth - Foreign born (%)
Housing units in structures - 1, detached (%)
Housing units in structures - 1, attached (%)
Housing units in structures - 2 (%)
Housing units in structures - 3 or 4 (%)
Housing units in structures - 5 to 9 (%)
Housing units in structures - 10 to 19 (%)
Housing units in structures - 20 to 49 (%)
Housing units in structures - 50 or more (%)
Housing units in structures - Mobile home (%)
Housing units in structures - Boat, RV, van, etc. (%)
House/condo owner moved in on average (years ago)
Renter moved in on average (years ago)
Year householder moved into unit - Moved in 1999 to March 2000 (%)
Year householder moved into unit - Moved in 1995 to 1998 (%)
Year householder moved into unit - Moved in 1990 to 1994 (%)
Year householder moved into unit - Moved in 1980 to 1989 (%)
Year householder moved into unit - Moved in 1970 to 1979 (%)
Year householder moved into unit - Moved in 1969 or earlier (%)
Means of transportation to work - Drove car alone (%)
Means of transportation to work - Carpooled (%)
Means of transportation to work - Public transportation (%)
Means of transportation to work - Bus or trolley bus (%)
Means of transportation to work - Streetcar or trolley car (%)
Means of transportation to work - Subway or elevated (%)
Means of transportation to work - Railroad (%)
Means of transportation to work - Ferryboat (%)
Means of transportation to work - Taxicab (%)
Means of transportation to work - Motorcycle (%)
Means of transportation to work - Bicycle (%)
Means of transportation to work - Walked (%)
Means of transportation to work - Other means (%)
Working at home (%)
Industry diversity
Most Common Industries - Agriculture, forestry, fishing and hunting, and mining (%)
Most Common Industries - Agriculture, forestry, fishing and hunting (%)
Most Common Industries - Mining, quarrying, and oil and gas extraction (%)
Most Common Industries - Construction (%)
Most Common Industries - Manufacturing (%)
Most Common Industries - Wholesale trade (%)
Most Common Industries - Retail trade (%)
Most Common Industries - Transportation and warehousing, and utilities (%)
Most Common Industries - Transportation and warehousing (%)
Most Common Industries - Utilities (%)
Most Common Industries - Information (%)
Most Common Industries - Finance and insurance, and real estate and rental and leasing (%)
Most Common Industries - Finance and insurance (%)
Most Common Industries - Real estate and rental and leasing (%)
Most Common Industries - Professional, scientific, and management, and administrative and waste management services (%)
Most Common Industries - Professional, scientific, and technical services (%)
Most Common Industries - Management of companies and enterprises (%)
Most Common Industries - Administrative and support and waste management services (%)
Most Common Industries - Educational services, and health care and social assistance (%)
Most Common Industries - Educational services (%)
Most Common Industries - Health care and social assistance (%)
Most Common Industries - Arts, entertainment, and recreation, and accommodation and food services (%)
Most Common Industries - Arts, entertainment, and recreation (%)
Most Common Industries - Accommodation and food services (%)
Most Common Industries - Other services, except public administration (%)
Most Common Industries - Public administration (%)
Occupation diversity
Most Common Occupations - Management, business, science, and arts occupations (%)
Most Common Occupations - Management, business, and financial occupations (%)
Most Common Occupations - Management occupations (%)
Most Common Occupations - Business and financial operations occupations (%)
Most Common Occupations - Computer, engineering, and science occupations (%)
Most Common Occupations - Computer and mathematical occupations (%)
Most Common Occupations - Architecture and engineering occupations (%)
Most Common Occupations - Life, physical, and social science occupations (%)
Most Common Occupations - Education, legal, community service, arts, and media occupations (%)
Most Common Occupations - Community and social service occupations (%)
Most Common Occupations - Legal occupations (%)
Most Common Occupations - Education, training, and library occupations (%)
Most Common Occupations - Arts, design, entertainment, sports, and media occupations (%)
Most Common Occupations - Healthcare practitioners and technical occupations (%)
Most Common Occupations - Health diagnosing and treating practitioners and other technical occupations (%)
Most Common Occupations - Health technologists and technicians (%)
Most Common Occupations - Service occupations (%)
Most Common Occupations - Healthcare support occupations (%)
Most Common Occupations - Protective service occupations (%)
Most Common Occupations - Fire fighting and prevention, and other protective service workers including supervisors (%)
Most Common Occupations - Law enforcement workers including supervisors (%)
Most Common Occupations - Food preparation and serving related occupations (%)
Most Common Occupations - Building and grounds cleaning and maintenance occupations (%)
Most Common Occupations - Personal care and service occupations (%)
Most Common Occupations - Sales and office occupations (%)
Most Common Occupations - Sales and related occupations (%)
Most Common Occupations - Office and administrative support occupations (%)
Most Common Occupations - Natural resources, construction, and maintenance occupations (%)
Most Common Occupations - Farming, fishing, and forestry occupations (%)
Most Common Occupations - Construction and extraction occupations (%)
Most Common Occupations - Installation, maintenance, and repair occupations (%)
Most Common Occupations - Production, transportation, and material moving occupations (%)
Most Common Occupations - Production occupations (%)
Most Common Occupations - Transportation occupations (%)
Most Common Occupations - Material moving occupations (%)
People in Group quarters - Institutionalized population (%)
People in Group quarters - Correctional institutions (%)
People in Group quarters - Federal prisons and detention centers (%)
People in Group quarters - Halfway houses (%)
People in Group quarters - Local jails and other confinement facilities (including police lockups) (%)
People in Group quarters - Military disciplinary barracks (%)
People in Group quarters - State prisons (%)
People in Group quarters - Other types of correctional institutions (%)
People in Group quarters - Nursing homes (%)
People in Group quarters - Hospitals/wards, hospices, and schools for the handicapped (%)
People in Group quarters - Hospitals/wards and hospices for chronically ill (%)
People in Group quarters - Hospices or homes for chronically ill (%)
People in Group quarters - Military hospitals or wards for chronically ill (%)
People in Group quarters - Other hospitals or wards for chronically ill (%)
People in Group quarters - Hospitals or wards for drug/alcohol abuse (%)
People in Group quarters - Mental (Psychiatric) hospitals or wards (%)
People in Group quarters - Schools, hospitals, or wards for the mentally retarded (%)
People in Group quarters - Schools, hospitals, or wards for the physically handicapped (%)
People in Group quarters - Institutions for the deaf (%)
People in Group quarters - Institutions for the blind (%)
People in Group quarters - Orthopedic wards and institutions for the physically handicapped (%)
People in Group quarters - Wards in general hospitals for patients who have no usual home elsewhere (%)
People in Group quarters - Wards in military hospitals for patients who have no usual home elsewhere (%)
People in Group quarters - Juvenile institutions (%)
People in Group quarters - Long-term care (%)
People in Group quarters - Homes for abused, dependent, and neglected children (%)
People in Group quarters - Residential treatment centers for emotionally disturbed children (%)
People in Group quarters - Training schools for juvenile delinquents (%)
People in Group quarters - Short-term care, detention or diagnostic centers for delinquent children (%)
People in Group quarters - Type of juvenile institution unknown (%)
People in Group quarters - Noninstitutionalized population (%)
People in Group quarters - College dormitories (includes college quarters off campus) (%)
People in Group quarters - Military quarters (%)
People in Group quarters - On base (%)
People in Group quarters - Barracks, unaccompanied personnel housing (UPH), (Enlisted/Officer), ;and similar group living quarters for military personnel (%)
People in Group quarters - Transient quarters for temporary residents (%)
People in Group quarters - Military ships (%)
People in Group quarters - Group homes (%)
People in Group quarters - Homes or halfway houses for drug/alcohol abuse (%)
People in Group quarters - Homes for the mentally ill (%)
People in Group quarters - Homes for the mentally retarded (%)
People in Group quarters - Homes for the physically handicapped (%)
People in Group quarters - Other group homes (%)
People in Group quarters - Religious group quarters (%)
People in Group quarters - Dormitories (%)
People in Group quarters - Agriculture workers' dormitories on farms (%)
People in Group quarters - Job Corps and vocational training facilities (%)
People in Group quarters - Other workers' dormitories (%)
People in Group quarters - Crews of maritime vessels (%)
People in Group quarters - Other nonhousehold living situations (%)
People in Group quarters - Other noninstitutional group quarters (%)
Residents speaking English at home (%)
Residents speaking English at home - Born in the United States (%)
Residents speaking English at home - Native, born elsewhere (%)
Residents speaking English at home - Foreign born (%)
Residents speaking Spanish at home (%)
Residents speaking Spanish at home - Born in the United States (%)
Residents speaking Spanish at home - Native, born elsewhere (%)
Residents speaking Spanish at home - Foreign born (%)
Residents speaking other language at home (%)
Residents speaking other language at home - Born in the United States (%)
Residents speaking other language at home - Native, born elsewhere (%)
Residents speaking other language at home - Foreign born (%)
Class of Workers - Employee of private company (%)
Class of Workers - Self-employed in own incorporated business (%)
Class of Workers - Private not-for-profit wage and salary workers (%)
Class of Workers - Local government workers (%)
Class of Workers - State government workers (%)
Class of Workers - Federal government workers (%)
Class of Workers - Self-employed workers in own not incorporated business and Unpaid family workers (%)
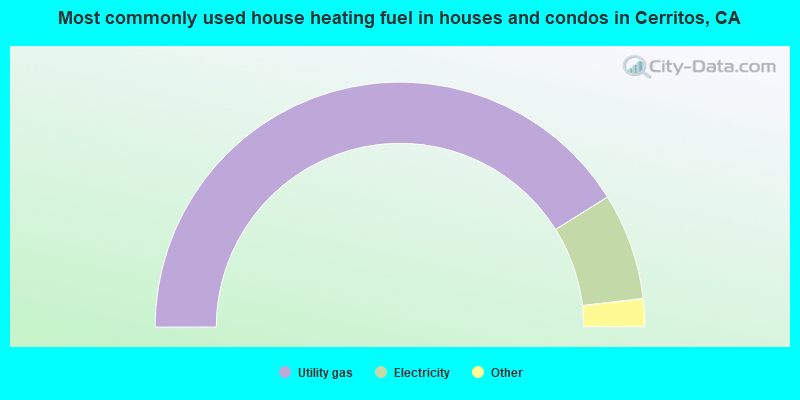
House heating fuel used in houses and condos - Utility gas (%)
House heating fuel used in houses and condos - Bottled, tank, or LP gas (%)
House heating fuel used in houses and condos - Electricity (%)
House heating fuel used in houses and condos - Fuel oil, kerosene, etc. (%)
House heating fuel used in houses and condos - Coal or coke (%)
House heating fuel used in houses and condos - Wood (%)
House heating fuel used in houses and condos - Solar energy (%)
House heating fuel used in houses and condos - Other fuel (%)
House heating fuel used in houses and condos - No fuel used (%)
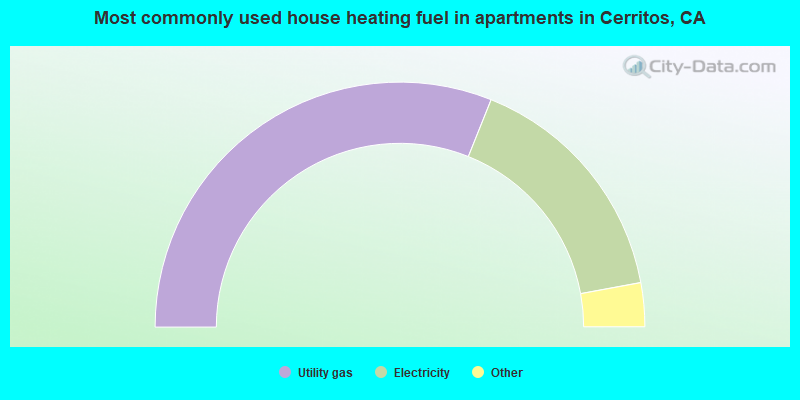
House heating fuel used in apartments - Utility gas (%)
House heating fuel used in apartments - Bottled, tank, or LP gas (%)
House heating fuel used in apartments - Electricity (%)
House heating fuel used in apartments - Fuel oil, kerosene, etc. (%)
House heating fuel used in apartments - Coal or coke (%)
House heating fuel used in apartments - Wood (%)
House heating fuel used in apartments - Solar energy (%)
House heating fuel used in apartments - Other fuel (%)
House heating fuel used in apartments - No fuel used (%)
Armed forces status - In Armed Forces (%)
Armed forces status - Civilian (%)
Armed forces status - Civilian - Veteran (%)
Armed forces status - Civilian - Nonveteran (%)
Fatal accidents locations in years 2005-2021
Fatal accidents locations in 2005
Fatal accidents locations in 2006
Fatal accidents locations in 2007
Fatal accidents locations in 2008
Fatal accidents locations in 2009
Fatal accidents locations in 2010
Fatal accidents locations in 2011
Fatal accidents locations in 2012
Fatal accidents locations in 2013
Fatal accidents locations in 2014
Fatal accidents locations in 2015
Fatal accidents locations in 2016
Fatal accidents locations in 2017
Fatal accidents locations in 2018
Fatal accidents locations in 2019
Fatal accidents locations in 2020
Fatal accidents locations in 2021
Alcohol use - People drinking some alcohol every month (%)
Alcohol use - People not drinking at all (%)
Alcohol use - Average days/month drinking alcohol
Alcohol use - Average drinks/week
Alcohol use - Average days/year people drink much
Audiometry - Average condition of hearing (%)
Audiometry - People that can hear a whisper from across a quiet room (%)
Audiometry - People that can hear normal voice from across a quiet room (%)
Audiometry - Ears ringing, roaring, buzzing (%)
Audiometry - Had a job exposure to loud noise (%)
Audiometry - Had off-work exposure to loud noise (%)
Blood Pressure & Cholesterol - Has high blood pressure (%)
Blood Pressure & Cholesterol - Checking blood pressure at home (%)
Blood Pressure & Cholesterol - Frequently checking blood cholesterol (%)
Blood Pressure & Cholesterol - Has high cholesterol level (%)
Consumer Behavior - Money monthly spent on food at supermarket/grocery store
Consumer Behavior - Money monthly spent on food at other stores
Consumer Behavior - Money monthly spent on eating out
Consumer Behavior - Money monthly spent on carryout/delivered foods
Consumer Behavior - Income spent on food at supermarket/grocery store (%)
Consumer Behavior - Income spent on food at other stores (%)
Consumer Behavior - Income spent on eating out (%)
Consumer Behavior - Income spent on carryout/delivered foods (%)
Current Health Status - General health condition (%)
Current Health Status - Blood donors (%)
Current Health Status - Has blood ever tested for HIV virus (%)
Current Health Status - Left-handed people (%)
Dermatology - People using sunscreen (%)
Diabetes - Diabetics (%)
Diabetes - Had a blood test for high blood sugar (%)
Diabetes - People taking insulin (%)
Diet Behavior & Nutrition - Diet health (%)
Diet Behavior & Nutrition - Milk product consumption (# of products/month)
Diet Behavior & Nutrition - Meals not home prepared (#/week)
Diet Behavior & Nutrition - Meals from fast food or pizza place (#/week)
Diet Behavior & Nutrition - Ready-to-eat foods (#/month)
Diet Behavior & Nutrition - Frozen meals/pizza (#/month)
Drug Use - People that ever used marijuana or hashish (%)
Drug Use - Ever used hard drugs (%)
Drug Use - Ever used any form of cocaine (%)
Drug Use - Ever used heroin (%)
Drug Use - Ever used methamphetamine (%)
Health Insurance - People covered by health insurance (%)
Kidney Conditions-Urology - Avg. # of times urinating at night
Medical Conditions - People with asthma (%)
Medical Conditions - People with anemia (%)
Medical Conditions - People with psoriasis (%)
Medical Conditions - People with overweight (%)
Medical Conditions - Elderly people having difficulties in thinking or remembering (%)
Medical Conditions - People who ever received blood transfusion (%)
Medical Conditions - People having trouble seeing even with glass/contacts (%)
Medical Conditions - People with arthritis (%)
Medical Conditions - People with gout (%)
Medical Conditions - People with congestive heart failure (%)
Medical Conditions - People with coronary heart disease (%)
Medical Conditions - People with angina pectoris (%)
Medical Conditions - People who ever had heart attack (%)
Medical Conditions - People who ever had stroke (%)
Medical Conditions - People with emphysema (%)
Medical Conditions - People with thyroid problem (%)
Medical Conditions - People with chronic bronchitis (%)
Medical Conditions - People with any liver condition (%)
Medical Conditions - People who ever had cancer or malignancy (%)
Mental Health - People who have little interest in doing things (%)
Mental Health - People feeling down, depressed, or hopeless (%)
Mental Health - People who have trouble sleeping or sleeping too much (%)
Mental Health - People feeling tired or having little energy (%)
Mental Health - People with poor appetite or overeating (%)
Mental Health - People feeling bad about themself (%)
Mental Health - People who have trouble concentrating on things (%)
Mental Health - People moving or speaking slowly or too fast (%)
Mental Health - People having thoughts they would be better off dead (%)
Oral Health - Average years since last visit a dentist
Oral Health - People embarrassed because of mouth (%)
Oral Health - People with gum disease (%)
Oral Health - General health of teeth and gums (%)
Oral Health - Average days a week using dental floss/device
Oral Health - Average days a week using mouthwash for dental problem
Oral Health - Average number of teeth
Pesticide Use - Households using pesticides to control insects (%)
Pesticide Use - Households using pesticides to kill weeds (%)
Physical Activity - People doing vigorous-intensity work activities (%)
Physical Activity - People doing moderate-intensity work activities (%)
Physical Activity - People walking or bicycling (%)
Physical Activity - People doing vigorous-intensity recreational activities (%)
Physical Activity - People doing moderate-intensity recreational activities (%)
Physical Activity - Average hours a day doing sedentary activities
Physical Activity - Average hours a day watching TV or videos
Physical Activity - Average hours a day using computer
Physical Functioning - People having limitations keeping them from working (%)
Physical Functioning - People limited in amount of work they can do (%)
Physical Functioning - People that need special equipment to walk (%)
Physical Functioning - People experiencing confusion/memory problems (%)
Physical Functioning - People requiring special healthcare equipment (%)
Prescription Medications - Average number of prescription medicines taking
Preventive Aspirin Use - Adults 40+ taking low-dose aspirin (%)
Reproductive Health - Vaginal deliveries (%)
Reproductive Health - Cesarean deliveries (%)
Reproductive Health - Deliveries resulted in a live birth (%)
Reproductive Health - Pregnancies resulted in a delivery (%)
Reproductive Health - Women breastfeeding newborns (%)
Reproductive Health - Women that had a hysterectomy (%)
Reproductive Health - Women that had both ovaries removed (%)
Reproductive Health - Women that have ever taken birth control pills (%)
Reproductive Health - Women taking birth control pills (%)
Reproductive Health - Women that have ever used Depo-Provera or injectables (%)
Reproductive Health - Women that have ever used female hormones (%)
Sexual Behavior - People 18+ that ever had sex (vaginal, anal, or oral) (%)
Sexual Behavior - Males 18+ that ever had vaginal sex with a woman (%)
Sexual Behavior - Males 18+ that ever performed oral sex on a woman (%)
Sexual Behavior - Males 18+ that ever had anal sex with a woman (%)
Sexual Behavior - Males 18+ that ever had any sex with a man (%)
Sexual Behavior - Females 18+ that ever had vaginal sex with a man (%)
Sexual Behavior - Females 18+ that ever performed oral sex on a man (%)
Sexual Behavior - Females 18+ that ever had anal sex with a man (%)
Sexual Behavior - Females 18+ that ever had any kind of sex with a woman (%)
Sexual Behavior - Average age people first had sex
Sexual Behavior - Average number of female sex partners in lifetime (males 18+)
Sexual Behavior - Average number of female vaginal sex partners in lifetime (males 18+)
Sexual Behavior - Average age people first performed oral sex on a woman (18+)
Sexual Behavior - Average number of woman performed oral sex on in lifetime (18+)
Sexual Behavior - Average number of male sex partners in lifetime (males 18+)
Sexual Behavior - Average number of male anal sex partners in lifetime (males 18+)
Sexual Behavior - Average age people first performed oral sex on a man (18+)
Sexual Behavior - Average number of male oral sex partners in lifetime (18+)
Sexual Behavior - People using protection when performing oral sex (%)
Sexual Behavior - Average number of times people have vaginal or anal sex a year
Sexual Behavior - People having sex without condom (%)
Sexual Behavior - Average number of male sex partners in lifetime (females 18+)
Sexual Behavior - Average number of male vaginal sex partners in lifetime (females 18+)
Sexual Behavior - Average number of female sex partners in lifetime (females 18+)
Sexual Behavior - Circumcised males 18+ (%)
Sleep Disorders - Average hours sleeping at night
Sleep Disorders - People that has trouble sleeping (%)
Smoking-Cigarette Use - People smoking cigarettes (%)
Taste & Smell - People 40+ having problems with smell (%)
Taste & Smell - People 40+ having problems with taste (%)
Taste & Smell - People 40+ that ever had wisdom teeth removed (%)
Taste & Smell - People 40+ that ever had tonsils teeth removed (%)
Taste & Smell - People 40+ that ever had a loss of consciousness because of a head injury (%)
Taste & Smell - People 40+ that ever had a broken nose or other serious injury to face or skull (%)
Taste & Smell - People 40+ that ever had two or more sinus infections (%)
Weight - Average height (inches)
Weight - Average weight (pounds)
Weight - Average BMI
Weight - People that are obese (%)
Weight - People that ever were obese (%)
Weight - People trying to lose weight (%)
29,047 60.6% Asian alone 6,755 14.1% Hispanic 5,836 12.2% White alone 3,751 7.8% Black alone 2,291 4.8% Two or more races 321 0.7% Other race alone 166 0.3% Native Hawaiian and Other 79 0.2% American Indian alone
According to our research of California and other state lists, there were 18 registered sex offenders living in Cerritos, California as of April 26, 2024 . The ratio of all residents to sex offenders in Cerritos is 2,789 to 1.The ratio of registered sex offenders to all residents in this city is much lower than the state average.
The City-Data.com crime index weighs serious crimes and violent crimes more heavily. Higher means more crime, U.S. average is 246.1. It adjusts for the number of visitors and daily workers commuting into cities.
- means the value is smaller than the state average.
- means the value is about the same as the state average.
- means the value is bigger than the state average.
- means the value is much bigger than the state average.
Crime rate in Cerritos detailed stats: murders, rapes, robberies, assaults, burglaries, thefts, arson Officers per 1,000 residents here:
0.02California average:
1.98
Latest news from Cerritos, CA collected exclusively by city-data.com from local newspapers, TV, and radio stations
Ancestries: American (2.2%), Italian (1.1%).
Current Local Time:
Land area: 8.62 square miles.
Population density: 5,508 people per square mile (average).
20,221 residents are foreign born (36.5% Asia ).
This city:
42.2%California:
26.5%
Median real estate property taxes paid for housing units with mortgages in 2022: $6,673 (0.7%)Median real estate property taxes paid for housing units with no mortgage in 2022: $4,256 (0.5%)
Nearest city with pop. 200,000+: Long Beach, CA
Nearest city with pop. 1,000,000+: Los Angeles, CA
Nearest cities:
Latitude: 33.87 N, Longitude: 118.07 W
Daytime population change due to commuting: +11,715 (+24.4%)Workers who live and work in this city: 5,450 (24.7%)
Property values in Cerritos, CA
Single-family new house construction building permits:
2021: 1 building , cost: $76,0002007: 8 buildings , average cost: $387,6002006: 8 buildings , average cost: $387,6002005: 15 buildings , average cost: $387,6002004: 15 buildings , average cost: $387,6002003: 13 buildings , average cost: $387,6002002: 13 buildings , average cost: $387,6002001: 9 buildings , average cost: $387,6002000: 15 buildings , average cost: $387,600Unemployment in December 2023:
Most common occupations in Cerritos, CA (%)
Both Males Females
Other sales and related occupations, including supervisors (7.1%)
Other office and administrative support workers, including supervisors (5.0%)
Other management occupations, except farmers and farm managers (4.9%)
Computer specialists (4.6%)
Engineers (4.1%)
Registered nurses (4.0%)
Accountants and auditors (3.8%)
Other sales and related occupations, including supervisors (8.6%)
Engineers (7.2%)
Computer specialists (6.7%)
Other management occupations, except farmers and farm managers (6.0%)
Other production occupations, including supervisors (3.6%)
Sales representatives, services, wholesale and manufacturing (3.6%)
Top executives (3.3%)
Registered nurses (7.7%)
Other office and administrative support workers, including supervisors (7.3%)
Other sales and related occupations, including supervisors (5.5%)
Accountants and auditors (5.1%)
Secretaries and administrative assistants (4.9%)
Preschool, kindergarten, elementary, and middle school teachers (4.5%)
Bookkeeping, accounting, and auditing clerks (3.9%)
Earthquake activity:
Cerritos-area historical earthquake activity is significantly above California state average. It is 6894% greater than the overall U.S. average. On 7/21/1952 at 11:52:14, a magnitude 7.7 (7.7 UK, Class: Major, Intensity: VIII - XII) earthquake occurred 94.6 miles away from Cerritos center, causing $50,000,000 total damage On 6/28/1992 at 11:57:34, a magnitude 7.6 (6.2 MB, 7.6 MS, 7.3 MW, Depth: 0.7 mi) earthquake occurred 90.7 miles away from Cerritos center, causing 3 deaths ( 1 shaking deaths, 2 other deaths) and 400 injuries, causing $100,000,000 total damage and $40,000,000 insured lossesOn 10/16/1999 at 09:46:44, a magnitude 7.4 (6.3 MB, 7.4 MS, 7.2 MW, 7.3 ML) earthquake occurred 103.6 miles away from the city center On 11/4/1927 at 13:51:53, a magnitude 7.5 (7.5 UK) earthquake occurred 184.0 miles away from Cerritos center On 1/17/1994 at 12:30:55, a magnitude 6.8 (6.4 MB, 6.8 MS, 6.7 MW, Depth: 11.4 mi, Class: Strong, Intensity: VII - IX) earthquake occurred 35.2 miles away from the city center, causing 60 deaths ( 60 shaking deaths) and 7000 injuriesOn 4/21/1918 at 22:32:30, a magnitude 6.8 (6.8 UK) earthquake occurred 36.3 miles away from the city center Magnitude types: body-wave magnitude (MB), local magnitude (ML), surface-wave magnitude (MS), moment magnitude (MW) Natural disasters: The number of natural disasters in Los Angeles County (57) is a lot greater than the US average (15).Major Disasters (Presidential) Declared: 27Emergencies Declared: 3Fires: 37, Floods: 16, Storms: 9, Winter Storms: 6, Landslides: 5, Mudslides: 5, Earthquakes: 3, Freeze: 1, Heavy Rain: 1, Hurricane: 1, Snow: 1, Tornado: 1, Wind: 1, Other: 1 (Note: some incidents may be assigned to more than one category). Main business address for: IMPCO TECHNOLOGIES INC MOTOR VEHICLE PARTS & ACCESSORIES ).
Hospitals in Cerritos: COLLEGE HOSPITAL (10802 COLLEGE PLACE) Dialysis Facilities in Cerritos: CERRITOS DIALYSIS CENTER, LLC (19222 PIONEER BLVD., SUITE 101) Home Health Centers in Cerritos: ACCORD HOME HEALTH SERVICES (1777 CENTER COURT DR, SUITE 250) ANGEL CITY FAMILY CARE SERVICES INC (12750 CENTER COURT DRIVE STE 140) CRESCENT HEALTHCARE CERRITOS (19222 S PIONEER BLVD) ERG HOME HEALTH PROVIDER, INC (11385 E 183RD ST) FIRST CHOICE HOME HEALTH SERVI (11829 EAST SOUTH STREET, SUITE 101) HEALTH VIEW HOME HEALTH (17785 CENTER COURT DRIVE, SUITE 325) HOME CARE LINK HEALTH SERVICES (17315 STUDEBAKER RD STE 315) LIVE OAK CARE CORP (11556 SOUTH ST SUITE 34-35) NEW VISION HOME HEALTH AGENCY, INC (12750 CENTER COURT DRIVE, SUITE 250) PRIVILEGE HOME SERVICES, INC (17215 STUDEBAKER ROAD, SUITE 105) Amtrak stations near Cerritos: 9 miles: FULLERTON (120 E. SANTA FE AVE.) Services: ticket office, fully wheelchair accessible, enclosed waiting area, public restrooms, public payphones, full-service food facilities, free short-term parking, paid long-term parking, taxi stand, public transit connection.
10 miles: LONG BEACH (601 N. LONG BEACH BLVD.) - Bus Station Services: fully wheelchair accessible, public restrooms, public payphones, full-service food facilities, paid short-term parking, paid long-term parking, call for taxi service, public transit connection.
12 miles: ANAHEIM (2150 KATELLA AVE.) Services: ticket office, fully wheelchair accessible, enclosed waiting area, public restrooms, public payphones, vending machines, free short-term parking, free long-term parking, call for car rental service, call for taxi service.
Colleges/Universities in Cerritos: Fremont College Full-time enrollment: 632; Location: 18000 Studebaker Road Suite 900A; Private, for-profit; Website: www.fremont.edu)
PCI College Full-time enrollment: 53; Location: 17215 Studebaker Rd #310; Private, for-profit; Website: www.pci-ed.com)
Colleges/universities with over 2000 students nearest to Cerritos:
Cerritos College (about 3 miles; Norwalk, CA ; Full-time enrollment: 13,090)
Cypress College (about 4 miles; Cypress, CA ; FT enrollment: 8,732)
Biola University (about 4 miles; La Mirada, CA ; FT enrollment: 5,325)
Long Beach City College (about 5 miles; Long Beach, CA ; FT enrollment: 15,602)
Trident University International (about 5 miles; Cypress, CA ; FT enrollment: 5,974)
California State University-Long Beach (about 7 miles; Long Beach, CA ; FT enrollment: 28,287)
El Camino College-Compton Center (about 9 miles; Compton, CA ; FT enrollment: 4,506)
Public high schools in Cerritos: CERRITOS HIGH Students: 1,541, Location: 12500 E. 183RD ST.., Grades: 9-12)TRACY (WILBUR) HIGH (CONTINUATION) Students: 129, Location: 12222 CUESTA DR., Grades: 9-12)ABC SECONDARY (ALTERNATIVE) Students: 48, Location: 16534 S. CARMENITA RD., Grades: 7-12)GAHR (RICHARD) HIGH Location: 11111 ARTESIA BLVD., Grades: 9-12)
WHITNEY (GRETCHEN) HIGH Location: 16800 SHOEMAKER AVE., Grades: 7-12)
Private high schools in Cerritos: VALLEY CHRISTIAN SCHOOL SYSTEM Students: 1,196, Location: 10818 ARTESIA BLVD, Grades: PK-12)
BROMAN SCHOOL Students: 6, Location: 13545 ACORO PL, Grades: 6-11)
Biggest public elementary/middle schools in Cerritos: CARMENITA MIDDLE Students: 623, Location: 13435 E. 166TH ST., Grades: 7-8)CERRITOS ELEMENTARY Students: 432, Location: 13600 E. 183RD ST., Grades: KG-6)BRAGG ELEMENTARY Students: 429, Location: 11501 BOS ST., Grades: KG-6)CARVER (CHARLES J.) ELEMENTARY Location: 19200 E. ELY ST., Grades: KG-6)
GONSALVES (JOE A.) ELEMENTARY Location: 13650 PARK ST., Grades: KG-6)
HASKELL (PLINY FISK) MIDDLE Location: 11525 DEL AMO BLVD., Grades: 7-8)
JUAREZ (BENITO) ELEMENTARY Location: 11939 ACLARE ST., Grades: KG-6)
LEAL (FRANK C.) ELEMENTARY Location: 12920 DROXFORD ST., Grades: KG-6)
NIXON (PATRICIA) ELEMENTARY Location: 19600 JACOB AVE., Grades: KG-6)
STOWERS(CECIL B.) ELEMENTARY Location: 13350 BEACH ST., Grades: KG-6)
See full list of schools located in Cerritos Library in Cerritos: CERRITOS PUBLIC LIBRARY Operating income: $5,680,449; Location: 18025 BLOOMFIELD AVE.; 226,960 books ; 6,976 audio materials ; 12,816 video materials ; 26 local licensed databases ; 387 print serial subscriptions ; 2 electronic serial subscriptions )
Notable locations in Cerritos: (A) , Cerritos Iron-Wood Golf Course (B) , Cerritos Auto Square (C) , Cerritos City Hall (D) , Cerritos Public Library (E) , American Medical Response Cerritos (F) , Cerritos Sheriffs Station (G) , Los Angeles County Fire Department Station 35 (H) , Los Angeles County Fire Department Station 30 (I) . Display/hide their locations on the map
Shopping Centers: (1) , Cerritos Plaza Shopping Center (2) , Los Cerritos Shopping Center (3) , Lincoln Station Shopping Center (4) , Cerritos Towne Center Shopping Center (5) , Best Plaza Shopping Center (6) . Display/hide their locations on the map
Main business address in Cerritos: (A) . Display/hide its location on the map
Church in Cerritos: (A) . Display/hide its location on the map
Cemetery: (1) . Display/hide its location on the map
Creek: (A) . Display/hide its location on the map
Parks in Cerritos include: (1) , Ecology Park (2) , Reservoir Hill Park (3) , Bettencourt Park (4) , Saddleback Park (5) , Rainbow Park (6) , Brookhaven Park (7) , Cerritos Park East (8) , Cerritos Regional County Park (9) . Display/hide their locations on the map
Tourist attractions:
Birthplace of: Chad Allen (actor) - Actor, Eddie Lewis (American soccer) - Football player, Jorge Salcedo - Soccer player-coach, Morris Chestnut - Actor, Tim Walton - College softball coach, Steve Shak - Soccer player, Andrew Oddie - College basketball player (Long Beach State 49ers), Casper Ware - Basketball player, Peter Vagenas - Major League Soccer player (Los Angeles, born : Feb 6, 1978), Quinton Jones - Player of and football.
Los Angeles County has a predicted average indoor radon screening level between 2 and 4 pCi/L (pico curies per liter) - Moderate Potential Drinking water stations with addresses in Cerritos that have no violations reported:
CERRITOS - CITY, WATER DEPT. (Population served: 49,041, Primary Water Source Type: Purch surface water)
Average household size: This city:
3.1 peopleCalifornia:
2.9 people
Percentage of family households: This city:
86.0%Whole state:
68.7%
Percentage of households with unmarried partners: This city:
2.2%Whole state:
7.2%
Likely homosexual households (counted as self-reported same-sex unmarried-partner households)
Lesbian couples: 0.3% of all households Gay men: 0.1% of all households
People in group quarters in Cerritos in 2010:
60 people in group homes intended for adults
18 people in nursing facilities/skilled-nursing facilities
17 people in residential treatment centers for adults
5 people in workers' group living quarters and job corps centers
4 people in other noninstitutional facilities
People in group quarters in Cerritos in 2000:
30 people in nursing homes
29 people in homes or halfway houses for drug/alcohol abuse
13 people in homes for the mentally retarded
11 people in other nonhousehold living situations
6 people in homes for the physically handicapped
4 people in other noninstitutional group quarters
Banks with most branches in Cerritos (2011 data):
Wells Fargo Bank, National Association: Cerritos Mall Branch at 18712 Gridley Road, branch established on 1972/04/17; Cerritos Branch at 13355 South Street, branch established on 1961/07/28. Info updated 2011/04/05: Bank assets: $1,161,490.0 mil, Deposits: $905,653.0 mil, headquarters in Sioux Falls, SD, positive income , 6395 total offices , Holding Company: Wells Fargo & Company
JPMorgan Chase Bank, National Association: Cerritos Branch at 11900 South Street, branch established on 2007/11/19; Cerritos Branch at 13223 South Street, branch established on 1957/11/29. Info updated 2011/11/10: Bank assets: $1,811,678.0 mil, Deposits: $1,190,738.0 mil, headquarters in Columbus, OH, positive income , International Specialization, 5577 total offices , Holding Company: Jpmorgan Chase & Co.
Bank of America, National Association: Artesia And Norwalk Branch at 12221 Artesia Boulevard, branch established on 1970/11/30; Cerritos Financial Center Branch at 18641 South Gridley Road, branch established on 1952/02/23. Info updated 2009/11/18: Bank assets: $1,451,969.3 mil, Deposits: $1,077,176.8 mil, headquarters in Charlotte, NC, positive income , 5782 total offices , Holding Company: Bank Of America Corporation
First Choice Bank: at 17414 Carmenita Road, branch established on 2005/08/18. Info updated 2009/12/28: Bank assets: $247.7 mil, Deposits: $212.4 mil, local headquarters , positive income , Commercial Lending Specialization, 2 total offices
East West Bank: Cerritos Branch at 11812 East South Street, branch established on 2001/09/10. Info updated 2010/06/14: Bank assets: $21,962.4 mil, Deposits: $17,501.8 mil, headquarters in Pasadena, CA, positive income , Commercial Lending Specialization, 131 total offices , Holding Company: East West Bancorp, Inc.
Hanmi Bank: Cerritos-South Branch at 11900 South Street, Suite 109, branch established on 1998/10/26. Info updated 2010/04/01: Bank assets: $2,739.6 mil, Deposits: $2,377.7 mil, headquarters in Los Angeles, CA, positive income , Commercial Lending Specialization, 28 total offices , Holding Company: Hanmi Financial Corporation
Gateway Business Bank: at 18000 Studebaker Road, Suite 550, branch established on 1997/03/10. Info updated 2006/11/03: Bank assets: $201.3 mil, Deposits: $173.3 mil, local headquarters , negative income in the last year , Commercial Lending Specialization, 3 total offices , Holding Company: Gateway Bancorp
Comerica Bank: Cerritos Branch at 11355 South Street, branch established on 2007/12/03. Info updated 2011/07/29: Bank assets: $60,970.5 mil, Deposits: $48,300.9 mil, headquarters in Dallas, TX, positive income , Commercial Lending Specialization, 497 total offices , Holding Company: Comerica Incorporated
U.S. Bank National Association: Cerritos Branch at 11350 South St, branch established on 1957/10/16. Info updated 2012/01/30: Bank assets: $330,470.8 mil, Deposits: $236,091.5 mil, headquarters in Cincinnati, OH, positive income , 3121 total offices , Holding Company: U.S. Bancorp
4 other banks with 4 local branches
For population 15 years and over in Cerritos:
Never married: 28.1%Now married: 57.2%Separated: 1.5%Widowed: 6.6%Divorced: 6.6% For population 25 years and over in Cerritos:
High school or higher: 94.0%Bachelor's degree or higher: 55.2%Graduate or professional degree: 20.1%Unemployed: 3.3%Mean travel time to work (commute): 26.3 minutes
Education Gini index (Inequality in education) Here:
10.9California average:
15.5
Religion statistics for Cerritos, CA (based on Los Angeles County data)
Religion Adherents Congregations Catholic 3,542,994 275 Evangelical Protestant 814,611 3,249 Other 451,594 1,023 Mainline Protestant 229,056 860 Black Protestant 112,338 290 Orthodox 63,517 76 None 4,604,495 -
Source: Clifford Grammich, Kirk Hadaway, Richard Houseal, Dale E.Jones, Alexei Krindatch, Richie Stanley and Richard H.Taylor. 2012. 2010 U.S.Religion Census: Religious Congregations & Membership Study. Association of Statisticians of American Religious Bodies. Jones, Dale E., et al. 2002. Congregations and Membership in the United States 2000. Nashville, TN: Glenmary Research Center. Graphs represent county-level data
Food Environment Statistics: Number of grocery stores : 2,084Los Angeles County :
2.12 / 10,000 pop.California :
2.14 / 10,000 pop.
Number of supercenters and club stores : 32This county :
0.03 / 10,000 pop.California :
0.04 / 10,000 pop.
Number of convenience stores (no gas) : 567Los Angeles County :
0.58 / 10,000 pop.California :
0.62 / 10,000 pop.
Number of convenience stores (with gas) : 1,206Los Angeles County :
1.23 / 10,000 pop.California :
1.49 / 10,000 pop.
Number of full-service restaurants : 7,008Los Angeles County :
7.15 / 10,000 pop.California :
7.42 / 10,000 pop.
Adult diabetes rate : Los Angeles County :
7.5%California :
7.3%
Adult obesity rate : This county :
20.4%California :
21.3%
Low-income preschool obesity rate : Here :
18.6%California :
17.9%
Health and Nutrition: Healthy diet rate : Here:
57.5%California:
49.4%
Average overall health of teeth and gums : This city:
53.1%California:
48.0%
Average BMI : This city:
26.3California:
28.1
People feeling badly about themselves : Cerritos:
14.2%California:
20.2%
People not drinking alcohol at all : Cerritos:
19.3%California:
11.2%
Average hours sleeping at night : Overweight people : Cerritos:
25.6%State:
31.5%
General health condition : Average condition of hearing : This city:
83.0%California:
80.9%
More about Health and Nutrition of Cerritos, CA Residents
Local government employment and payroll (March 2022)
Function
Full-time employees
Monthly full-time payroll
Average yearly full-time wage
Part-time employees
Monthly part-time payroll
Other and Unallocable
97 $699,491 $86,535 20 $37,409 Other Government Administration
38 $187,965 $59,357 104 $208,142 Financial Administration
30 $233,321 $93,328 3 $8,934 Local Libraries
22 $156,514 $85,371 74 $84,314 Parks and Recreation
19 $129,472 $81,772 153 $108,704 Water Supply
18 $125,229 $83,486 0 $0 Streets and Highways
8 $36,955 $55,433 0 $0 Police - Other
8 $70,147 $105,221 52 $53,005 Welfare
5 $38,861 $93,266 18 $17,980
Totals for Government
245 $1,677,955 $82,186 424 $518,488
Cerritos government finances - Expenditure in 2017 (per resident):
Construction - Housing and Community Development: $4,090,000 ($86.15)
Central Staff Services: $321,000 ($6.76)Current Operations - Water Utilities: $21,145,000 ($445.39)
Central Staff Services: $14,531,000 ($306.08)Police Protection: $12,926,000 ($272.27)Parks and Recreation: $10,149,000 ($213.78)Electric Utilities: $8,465,000 ($178.30)Regular Highways: $7,426,000 ($156.42)Libraries: $3,357,000 ($70.71)Solid Waste Management: $2,699,000 ($56.85)Sewerage: $2,422,000 ($51.02)Transit Utilities: $1,806,000 ($38.04)Financial Administration: $1,071,000 ($22.56)Judicial and Legal Services: $344,000 ($7.25)Protective Inspection and Regulation - Other: $337,000 ($7.10)Electric Utilities - Interest on Debt: $1,078,000 ($22.71)
General - Interest on Debt: $86,000 ($1.81)
Intergovernmental to Local - Other - Police Protection: $13,341,000 ($281.01)
Other - Regular Highways: $1,146,000 ($24.14)Other - Water Utilities: $584,000 ($12.30)Other Capital Outlay - Central Staff Services: $4,243,000 ($89.37)
Financial Administration: $465,000 ($9.79)Police Protection: $33,000 ($0.70)Parks and Recreation: $5,000 ($0.11)General - Other: $4,000 ($0.08)Regular Highways: $3,000 ($0.06)Water Utilities - Interest on Debt: $168,000 ($3.54)
Cerritos government finances - Revenue in 2017 (per resident):
Charges - Parks and Recreation: $1,691,000 ($35.62)
Other: $1,473,000 ($31.03)Sewerage: $1,224,000 ($25.78)Regular Highways: $934,000 ($19.67)Federal Intergovernmental - Housing and Community Development: $24,000 ($0.51)
Local Intergovernmental - Other: $23,000 ($0.48)
Miscellaneous - Rents: $2,499,000 ($52.64)
Interest Earnings: $1,436,000 ($30.25)Fines and Forfeits: $681,000 ($14.34)Special Assessments: $662,000 ($13.94)General Revenue - Other: $576,000 ($12.13)Revenue - Water Utilities: $14,960,000 ($315.11)
Electric Utilities: $8,715,000 ($183.57)Transit Utilities: $81,000 ($1.71)State Intergovernmental - Highways: $934,000 ($19.67)
Other: $659,000 ($13.88)General Local Government Support: $22,000 ($0.46)Tax - General Sales and Gross Receipts: $35,363,000 ($744.88)
Property: $11,053,000 ($232.82)Public Utilities Sales: $2,666,000 ($56.16)Other Selective Sales: $1,187,000 ($25.00)Occupation and Business License - Other: $1,064,000 ($22.41)Other: $715,000 ($15.06)Documentary and Stock Transfer: $224,000 ($4.72)Other License: $35,000 ($0.74)
Cerritos government finances - Debt in 2017 (per resident):
Long Term Debt - Beginning Outstanding - Unspecified Public Purpose: $11,315,000 ($238.34)
Outstanding Unspecified Public Purpose: $11,005,000 ($231.81)Retired Unspecified Public Purpose: $310,000 ($6.53)
Cerritos government finances - Cash and Securities in 2017 (per resident):
Bond Funds - Cash and Securities: $56,000 ($1.18)
Other Funds - Cash and Securities: $136,329,000 ($2871.60)
2.98% of this county's 2021 resident taxpayers lived in other counties in 2020 ($81,235 average adjusted gross income )
Here:
2.98%California average:
5.19%
0.01% of residents moved from foreign countries ($155 average AGI )Los Angeles County:
0.01%California average:
0.03%
Top counties from which taxpayers relocated into this county between 2020 and 2021:
4.68% of this county's 2020 resident taxpayers moved to other counties in 2021 ($97,324 average adjusted gross income )
Here:
4.68%California average:
6.14%
0.01% of residents moved to foreign countries ($196 average AGI )Los Angeles County:
0.01%California average:
0.02%
Top counties to which taxpayers relocated from this county between 2020 and 2021:
Businesses in Cerritos, CA
Name Count Name Count
ALDO 2 Journeys 1 AMF Bowling 1 Justice 1 AT&T 2 KFC 2 Abercrombie & Fitch 1 Kincaid 1 Abercrombie Kids 1 Kohl's 1 Aeropostale 1 Kroger 1 American Eagle Outfitters 2 LA Fitness 2 Apple Store 1 La-Z-Boy 1 Avenue 1 LensCrafters 1 Baja Fresh Mexican Grill 1 Macy's 1 Bakers 1 MasterBrand Cabinets 4 Bally Total Fitness 1 Mazda 1 Banana Republic 1 McDonald's 2 Baskin-Robbins 1 Men's Wearhouse 1 Bath & Body Works 2 Motherhood Maternity 2 Bebe 1 New York & Co 1 Blockbuster 1 Nike 12 Burlington Coat Factory 1 Nissan 1 CVS 2 Nordstrom 1 Cache 1 OfficeMax 1 Carl\s Jr. 1 Olive Garden 1 Charlotte Russe 1 Pac Sun 1 Chevrolet 1 Panda Express 2 Chick-Fil-A 1 Panera Bread 1 Chipotle 1 Payless 2 Chuck E. Cheese's 1 Quiznos 1 Cinnabon 1 RadioShack 1 Cold Stone Creamery 1 Red Robin 1 Curves 1 SAS Shoes 1 DHL 2 Sears 2 Dairy Queen 1 Sephora 1 DressBarn 1 Sheraton 1 Dressbarn 1 Sprint Nextel 1 Express 1 Staples 1 FedEx 11 Starbucks 3 Finish Line 1 T-Mobile 8 Firestone Complete Auto Care 1 T.G.I. Driday's 1 Foot Locker 1 T.J.Maxx 1 Forever 21 1 Target 2 GNC 2 The Limited 1 GameStop 3 The Room Place 2 Gap 1 Toyota 1 Gymboree 1 Toys"R"Us 3 H&R Block 2 Trader Joe's 1 Hollister Co. 1 U-Haul 1 Home Depot 1 UPS 12 HomeTown Buffet 1 Vans 2 Honda 1 Verizon Wireless 1 Hot Topic 1 Victoria's Secret 1 Jamba Juice 1 Volkswagen 1 Jones New York 3 Walmart 1
Strongest AM radio stations in Cerritos:
KFI (640 AM; 50 kW; LOS ANGELES, CA; Owner: CAPSTAR TX LIMITED PARTNERSHIP)
KTNQ (1020 AM; 50 kW; LOS ANGELES, CA; Owner: KTNQ-AM LICENSE CORP.)
KXTA (1150 AM; 50 kW; LOS ANGELES, CA; Owner: CITICASTERS LICENSES, L.P.)
KLAC (570 AM; 50 kW; LOS ANGELES, CA; Owner: AMFM RADIO LICENSES, L.L.C.)
KFWB (980 AM; 50 kW; LOS ANGELES, CA; Owner: INFINITY BROADCASTING OPERATIONS, INC.)
KNX (1070 AM; 50 kW; LOS ANGELES, CA; Owner: INFINITY BROADCASTING OPERATIONS, INC.)
KDIS (1110 AM; 50 kW; PASADENA, CA; Owner: ABC,INC.)
KMPC (1540 AM; 50 kW; LOS ANGELES, CA; Owner: ROSE CITY RADIO CORPORATION)
KBLA (1580 AM; 50 kW; SANTA MONICA, CA)
KPLS (830 AM; 50 kW; ORANGE, CA; Owner: CRN LICENSES, LLC)
KSPN (710 AM; 50 kW; LOS ANGELES, CA; Owner: KABC-AM RADIO, INC.)
KLTX (1390 AM; 5 kW; LONG BEACH, CA; Owner: HI-FAVOR BROADCASTING, LLC)
KXMX (1190 AM; 25 kW; ANAHEIM, CA; Owner: NEW INSPIRATION BROADCASTING COMPANY)
Strongest FM radio stations in Cerritos:
KZLA-FM (93.9 FM; LOS ANGELES, CA; Owner: EMMIS RADIO LICENSE CORPORATION)
KPWR (105.9 FM; LOS ANGELES, CA; Owner: EMMIS RADIO LICENSE CORPORATION)
KLSX (97.1 FM; LOS ANGELES, CA; Owner: INFINITY BROADCASTING OPERATIONS, INC.)
KUSC (91.5 FM; LOS ANGELES, CA; Owner: UNIVERSITY OF SOUTHERN CALIFORNIA)
KKLA-FM (99.5 FM; LOS ANGELES, CA; Owner: NEW INSPIRATION BROADCASTING CO., INC.)
KCBS-FM (93.1 FM; LOS ANGELES, CA; Owner: INFINITY BROADCASTING OPERATIONS, INC.)
KSCA (101.9 FM; GLENDALE, CA; Owner: HBC LICENSE CORPORATION)
KLOS (95.5 FM; LOS ANGELES, CA; Owner: KLOS-FM RADIO, INC.)
K212FA (90.3 FM; TEMPLE CITY, CA; Owner: EDUCATIONAL MEDIA FOUNDATION)
KOST (103.5 FM; LOS ANGELES, CA; Owner: CAPSTAR TX LIMITED PARTNERSHIP)
KLAX-FM (97.9 FM; EAST LOS ANGELES, CA; Owner: KLAX LICENSING, INC.)
KRTH-FM (101.1 FM; LOS ANGELES, CA; Owner: INFINITY BROADCASTING OPERATIONS, INC.)
KIIS-FM (102.7 FM; LOS ANGELES, CA; Owner: CITICASTERS LICENSES, L.P.)
KLVE (107.5 FM; LOS ANGELES, CA; Owner: KLVE-FM LICENSE CORP.)
KPCC (89.3 FM; PASADENA, CA; Owner: PASADENA AREA COMMUNITY COLLEGE DISTRICT)
KHHT (92.3 FM; LOS ANGELES, CA; Owner: AMFM RADIO LICENSES, L.L.C.)
KKBT (100.3 FM; LOS ANGELES, CA; Owner: RADIO ONE LICENSES, LLC)
KBIG-FM (104.3 FM; LOS ANGELES, CA; Owner: AMFM RADIO LICENSES, L.L.C.)
KMZT-FM (105.1 FM; LOS ANGELES, CA; Owner: MOUNT WILSON FM BROADCASTERS, INC.)
KTWV (94.7 FM; LOS ANGELES, CA; Owner: INFINITY BROADCASTING OPERATIONS, INC.)
TV broadcast stations around Cerritos:
KTRO-LP (Channel 50; LANCASTER, CA; Owner: ROBERT D. ADELMAN)
KCBS-TV (Channel 2; LOS ANGELES, CA; Owner: CBS BROADCASTING INC.)
KTLA-TV (Channel 5; LOS ANGELES, CA; Owner: KTLA INC.)
KABC-TV (Channel 7; LOS ANGELES, CA; Owner: ABC HOLDING COMPANY, INC.)
KCAL-TV (Channel 9; LOS ANGELES, CA; Owner: VIACOM TELEVISION STATIONS GROUP OF LOS ANGELES LLC)
KNBC (Channel 4; LOS ANGELES, CA; Owner: NBC SUBSIDIARY (KNBC-TV), INC.)
KMEX-TV (Channel 34; LOS ANGELES, CA; Owner: KMEX LICENSE PARTNERSHIP, G.P.)
KAZA-TV (Channel 54; AVALON, CA; Owner: PAPPAS SOUTHERN CALIFORNIA LICENSE LLC)
KDOC-TV (Channel 56; ANAHEIM, CA; Owner: GOLDEN ORANGE BROADCASTING CO., INC.)
KOCE-TV (Channel 50; HUNTINGTON BEACH, CA; Owner: BD. OF TRUSTEES, COAST COMMUNITY COLLEGE DIST.)
KSCI (Channel 18; LONG BEACH, CA; Owner: KSLS, INC.)
KXLA (Channel 44; RANCHO PALOS VERDES, CA; Owner: RANCHO PALOS VERDES BROADCASTERS, INC.)
KCET (Channel 28; LOS ANGELES, CA; Owner: COMMUNITY TELEVISION OF SOUTHERN CALIFORNIA)
KFTR (Channel 46; ONTARIO, CA; Owner: TELEFUTURA LOS ANGELES LLC)
National Bridge Inventory (NBI) Statistics 56 Number of bridges728ft / 222m Total length4,434,270 Total average daily traffic255,709 Total average daily truck traffic
New bridges - historical statistics
1 1940-1949 4 1950-1959 49 1960-1969 1 1970-1979 1 1990-1999
See full National Bridge Inventory statistics for Cerritos, CA
Home Mortgage Disclosure Act Aggregated Statistics For Year 2009(Based on 13 full tracts) A) FHA, FSA/RHS & VA B) Conventional C) Refinancings D) Home Improvement Loans E) Loans on Dwellings For 5+ Families F) Non-occupant Loans on G) Loans On Manufactured Number Average Value Number Average Value Number Average Value Number Average Value Number Average Value Number Average Value Number Average Value
LOANS ORIGINATED 42 $425,837 240 $353,898 1,354 $314,511 66 $232,241 2 $1,344,000 85 $289,135 0 $0 APPLICATIONS APPROVED, NOT ACCEPTED 7 $396,286 18 $365,934 172 $353,323 18 $113,717 0 $0 7 $276,571 1 $200,000 APPLICATIONS DENIED 16 $397,875 41 $338,789 415 $346,162 27 $142,177 0 $0 27 $224,878 1 $73,000 APPLICATIONS WITHDRAWN 8 $415,250 61 $366,697 264 $349,811 18 $179,333 0 $0 10 $271,786 0 $0 FILES CLOSED FOR INCOMPLETENESS 8 $402,568 11 $408,437 104 $346,398 14 $192,133 0 $0 6 $176,667 0 $0
Aggregated Statistics For Year 2008(Based on 13 full tracts) A) FHA, FSA/RHS & VA B) Conventional C) Refinancings D) Home Improvement Loans E) Loans on Dwellings For 5+ Families F) Non-occupant Loans on G) Loans On Manufactured Number Average Value Number Average Value Number Average Value Number Average Value Number Average Value Number Average Value Number Average Value
LOANS ORIGINATED 23 $521,668 242 $360,650 605 $316,532 84 $155,870 2 $5,548,000 73 $295,265 7 $66,000 APPLICATIONS APPROVED, NOT ACCEPTED 4 $427,000 67 $345,207 142 $326,233 20 $131,736 0 $0 15 $273,533 4 $64,250 APPLICATIONS DENIED 11 $479,182 64 $372,046 371 $381,402 56 $148,995 1 $525,000 30 $320,605 0 $0 APPLICATIONS WITHDRAWN 5 $400,400 50 $381,066 198 $326,877 20 $238,039 0 $0 13 $272,371 0 $0 FILES CLOSED FOR INCOMPLETENESS 3 $553,667 14 $385,986 56 $424,741 9 $260,222 0 $0 2 $400,000 0 $0
Aggregated Statistics For Year 2007(Based on 13 full tracts) A) FHA, FSA/RHS & VA B) Conventional C) Refinancings D) Home Improvement Loans E) Loans on Dwellings For 5+ Families F) Non-occupant Loans on G) Loans On Manufactured Number Average Value Number Average Value Number Average Value Number Average Value Number Average Value Number Average Value Number Average Value
LOANS ORIGINATED 2 $233,500 414 $386,336 1,130 $363,037 163 $245,127 2 $325,000 114 $340,642 5 $67,800 APPLICATIONS APPROVED, NOT ACCEPTED 0 $0 111 $385,956 251 $389,723 38 $218,613 0 $0 17 $358,294 7 $114,130 APPLICATIONS DENIED 0 $0 180 $371,404 632 $407,948 95 $242,991 0 $0 46 $350,978 11 $69,633 APPLICATIONS WITHDRAWN 0 $0 78 $404,003 263 $403,941 34 $318,377 1 $862,000 21 $382,612 0 $0 FILES CLOSED FOR INCOMPLETENESS 0 $0 32 $428,015 117 $401,204 6 $253,447 0 $0 11 $360,225 0 $0
Aggregated Statistics For Year 2006(Based on 13 full tracts) A) FHA, FSA/RHS & VA B) Conventional C) Refinancings D) Home Improvement Loans E) Loans on Dwellings For 5+ Families F) Non-occupant Loans on G) Loans On Manufactured Number Average Value Number Average Value Number Average Value Number Average Value Number Average Value Number Average Value Number Average Value
LOANS ORIGINATED 0 $0 683 $381,207 1,480 $361,897 228 $243,900 3 $751,000 118 $313,262 8 $86,250 APPLICATIONS APPROVED, NOT ACCEPTED 0 $0 167 $346,646 342 $372,397 43 $258,452 0 $0 27 $374,097 6 $63,162 APPLICATIONS DENIED 0 $0 245 $395,769 657 $402,351 132 $221,675 2 $1,260,000 39 $318,987 14 $64,143 APPLICATIONS WITHDRAWN 2 $253,375 133 $402,118 470 $409,809 58 $270,872 0 $0 24 $349,775 1 $119,000 FILES CLOSED FOR INCOMPLETENESS 0 $0 18 $356,968 107 $434,529 18 $237,568 0 $0 8 $356,750 0 $0
Aggregated Statistics For Year 2005(Based on 13 full tracts) A) FHA, FSA/RHS & VA B) Conventional C) Refinancings D) Home Improvement Loans E) Loans on Dwellings For 5+ Families F) Non-occupant Loans on G) Loans On Manufactured Number Average Value Number Average Value Number Average Value Number Average Value Number Average Value Number Average Value Number Average Value
LOANS ORIGINATED 0 $0 915 $367,838 1,787 $338,759 267 $215,713 4 $547,750 170 $285,248 6 $176,500 APPLICATIONS APPROVED, NOT ACCEPTED 0 $0 224 $345,891 328 $343,397 30 $172,230 0 $0 30 $295,946 10 $93,393 APPLICATIONS DENIED 0 $0 290 $347,264 742 $363,664 122 $220,257 0 $0 73 $312,363 11 $77,909 APPLICATIONS WITHDRAWN 1 $199,000 167 $359,582 574 $344,367 72 $187,679 1 $8,995,500 31 $297,532 6 $130,500 FILES CLOSED FOR INCOMPLETENESS 0 $0 58 $356,943 173 $392,591 16 $177,562 0 $0 13 $323,758 0 $0
Aggregated Statistics For Year 2004(Based on 13 full tracts) A) FHA, FSA/RHS & VA B) Conventional C) Refinancings D) Home Improvement Loans E) Loans on Dwellings For 5+ Families F) Non-occupant Loans on G) Loans On Manufactured Number Average Value Number Average Value Number Average Value Number Average Value Number Average Value Number Average Value Number Average Value
LOANS ORIGINATED 2 $387,000 888 $326,105 2,498 $280,069 212 $187,034 2 $464,000 185 $258,309 2 $139,000 APPLICATIONS APPROVED, NOT ACCEPTED 1 $262,000 160 $312,481 472 $276,965 37 $204,858 0 $0 53 $258,050 3 $93,333 APPLICATIONS DENIED 0 $0 211 $296,612 695 $296,245 117 $165,122 0 $0 59 $266,075 13 $72,769 APPLICATIONS WITHDRAWN 3 $233,300 152 $340,131 688 $297,592 53 $167,875 0 $0 39 $298,362 0 $0 FILES CLOSED FOR INCOMPLETENESS 0 $0 34 $320,671 166 $306,252 24 $127,500 0 $0 6 $201,000 0 $0
Aggregated Statistics For Year 2003(Based on 13 full tracts) A) FHA, FSA/RHS & VA B) Conventional C) Refinancings D) Home Improvement Loans E) Loans on Dwellings For 5+ Families F) Non-occupant Loans on Number Average Value Number Average Value Number Average Value Number Average Value Number Average Value Number Average Value
LOANS ORIGINATED 17 $228,621 1,026 $269,719 5,690 $220,943 121 $84,315 4 $599,500 355 $195,831 APPLICATIONS APPROVED, NOT ACCEPTED 1 $162,000 154 $256,613 861 $234,914 28 $67,390 0 $0 61 $245,741 APPLICATIONS DENIED 1 $192,000 191 $249,527 981 $239,234 78 $70,355 0 $0 65 $218,563 APPLICATIONS WITHDRAWN 5 $165,962 138 $265,378 886 $230,435 23 $75,814 0 $0 48 $177,620 FILES CLOSED FOR INCOMPLETENESS 1 $298,000 46 $296,255 239 $227,481 10 $91,400 0 $0 18 $221,087
Aggregated Statistics For Year 2002(Based on 13 full tracts) A) FHA, FSA/RHS & VA B) Conventional C) Refinancings D) Home Improvement Loans E) Loans on Dwellings For 5+ Families F) Non-occupant Loans on Number Average Value Number Average Value Number Average Value Number Average Value Number Average Value Number Average Value
LOANS ORIGINATED 26 $171,051 951 $229,560 3,764 $212,206 85 $64,951 4 $361,500 205 $180,669 APPLICATIONS APPROVED, NOT ACCEPTED 3 $184,333 133 $246,831 634 $206,404 19 $67,892 0 $0 39 $184,912 APPLICATIONS DENIED 3 $165,333 148 $209,535 760 $216,836 68 $38,557 0 $0 56 $203,764 APPLICATIONS WITHDRAWN 8 $182,979 122 $207,525 590 $218,402 41 $50,390 2 $380,000 25 $164,598 FILES CLOSED FOR INCOMPLETENESS 3 $158,667 43 $241,244 284 $225,904 3 $25,333 0 $0 3 $191,000
Aggregated Statistics For Year 2001(Based on 13 full tracts) A) FHA, FSA/RHS & VA B) Conventional C) Refinancings D) Home Improvement Loans E) Loans on Dwellings For 5+ Families F) Non-occupant Loans on Number Average Value Number Average Value Number Average Value Number Average Value Number Average Value Number Average Value
LOANS ORIGINATED 80 $169,208 905 $196,134 2,483 $191,163 113 $43,026 4 $2,183,000 137 $172,606 APPLICATIONS APPROVED, NOT ACCEPTED 12 $205,478 135 $210,522 420 $185,814 29 $34,413 0 $0 21 $151,662 APPLICATIONS DENIED 27 $117,772 144 $194,232 679 $177,711 82 $48,145 0 $0 27 $159,221 APPLICATIONS WITHDRAWN 14 $131,214 112 $168,552 515 $199,093 48 $53,977 0 $0 16 $162,623 FILES CLOSED FOR INCOMPLETENESS 2 $183,000 40 $195,211 164 $201,900 6 $53,330 0 $0 9 $152,433
Aggregated Statistics For Year 2000(Based on 13 full tracts) A) FHA, FSA/RHS & VA B) Conventional C) Refinancings D) Home Improvement Loans E) Loans on Dwellings For 5+ Families F) Non-occupant Loans on Number Average Value Number Average Value Number Average Value Number Average Value Number Average Value Number Average Value
LOANS ORIGINATED 96 $113,401 866 $181,926 632 $153,361 104 $39,815 4 $411,238 69 $144,517 APPLICATIONS APPROVED, NOT ACCEPTED 8 $148,750 105 $208,212 125 $154,875 44 $44,883 0 $0 11 $119,545 APPLICATIONS DENIED 7 $142,564 128 $208,021 356 $166,515 72 $45,566 0 $0 14 $133,571 APPLICATIONS WITHDRAWN 10 $105,800 116 $172,590 180 $160,437 20 $40,849 0 $0 16 $132,737 FILES CLOSED FOR INCOMPLETENESS 17 $101,342 46 $199,791 91 $202,390 4 $46,250 1 $1,245,000 9 $196,212
Aggregated Statistics For Year 1999(Based on 7 full and 6 partial tracts) A) FHA, FSA/RHS & VA B) Conventional C) Refinancings D) Home Improvement Loans E) Loans on Dwellings For 5+ Families F) Non-occupant Loans on Number Average Value Number Average Value Number Average Value Number Average Value Number Average Value Number Average Value
LOANS ORIGINATED 53 $140,284 720 $192,855 1,180 $165,871 126 $31,462 3 $85,547 93 $144,130 APPLICATIONS APPROVED, NOT ACCEPTED 1 $121,830 85 $189,125 219 $160,145 51 $35,271 0 $0 17 $142,191 APPLICATIONS DENIED 9 $130,381 130 $200,567 360 $157,386 109 $26,774 0 $0 26 $146,139 APPLICATIONS WITHDRAWN 15 $121,719 137 $192,548 304 $159,941 15 $71,587 1 $105,680 13 $143,446 FILES CLOSED FOR INCOMPLETENESS 4 $158,512 40 $207,463 127 $176,565 2 $85,700 0 $0 7 $145,736
Detailed mortgage data for all 13 tracts in Cerritos, CA
Private Mortgage Insurance Companies Aggregated Statistics For Year 2009(Based on 9 full tracts) A) Conventional B) Refinancings Number Average Value Number Average Value
LOANS ORIGINATED 14 $381,197 3 $417,937 APPLICATIONS APPROVED, NOT ACCEPTED 7 $354,857 2 $507,000 APPLICATIONS DENIED 1 $472,000 1 $412,000 APPLICATIONS WITHDRAWN 3 $388,000 1 $392,000 FILES CLOSED FOR INCOMPLETENESS 1 $240,000 0 $0
Aggregated Statistics For Year 2008(Based on 13 full tracts) A) Conventional B) Refinancings Number Average Value Number Average Value
LOANS ORIGINATED 32 $408,474 9 $448,092 APPLICATIONS APPROVED, NOT ACCEPTED 11 $464,636 14 $455,614 APPLICATIONS DENIED 0 $0 4 $456,000 APPLICATIONS WITHDRAWN 3 $355,667 0 $0 FILES CLOSED FOR INCOMPLETENESS 1 $417,000 0 $0
Aggregated Statistics For Year 2007(Based on 12 full tracts) A) Conventional B) Refinancings C) Non-occupant Loans on Number Average Value Number Average Value Number Average Value
LOANS ORIGINATED 16 $459,738 15 $505,121 2 $344,500 APPLICATIONS APPROVED, NOT ACCEPTED 4 $449,000 7 $437,546 1 $743,000 APPLICATIONS DENIED 1 $702,000 0 $0 0 $0 APPLICATIONS WITHDRAWN 4 $413,000 2 $569,000 2 $484,500 FILES CLOSED FOR INCOMPLETENESS 0 $0 0 $0 0 $0
Aggregated Statistics For Year 2006(Based on 9 full tracts) A) Conventional B) Refinancings C) Non-occupant Loans on Number Average Value Number Average Value Number Average Value
LOANS ORIGINATED 13 $431,283 7 $493,714 1 $495,000 APPLICATIONS APPROVED, NOT ACCEPTED 3 $368,667 2 $505,500 0 $0 APPLICATIONS DENIED 0 $0 0 $0 0 $0 APPLICATIONS WITHDRAWN 0 $0 1 $535,000 0 $0 FILES CLOSED FOR INCOMPLETENESS 0 $0 0 $0 0 $0
Aggregated Statistics For Year 2005(Based on 9 full tracts) A) Conventional B) Refinancings C) Non-occupant Loans on Number Average Value Number Average Value Number Average Value
LOANS ORIGINATED 9 $369,444 12 $454,228 1 $329,000 APPLICATIONS APPROVED, NOT ACCEPTED 1 $527,000 2 $366,930 0 $0 APPLICATIONS DENIED 1 $440,000 0 $0 0 $0 APPLICATIONS WITHDRAWN 0 $0 1 $440,000 0 $0 FILES CLOSED FOR INCOMPLETENESS 0 $0 0 $0 0 $0
Aggregated Statistics For Year 2004(Based on 12 full tracts) A) Conventional B) Refinancings C) Non-occupant Loans on Number Average Value Number Average Value Number Average Value
LOANS ORIGINATED 23 $388,541 13 $338,210 1 $360,820 APPLICATIONS APPROVED, NOT ACCEPTED 9 $341,758 10 $331,683 1 $360,820 APPLICATIONS DENIED 0 $0 0 $0 0 $0 APPLICATIONS WITHDRAWN 3 $419,000 2 $306,000 0 $0 FILES CLOSED FOR INCOMPLETENESS 2 $377,000 2 $327,000 0 $0
Aggregated Statistics For Year 2003(Based on 13 full tracts) A) Conventional B) Refinancings C) Non-occupant Loans on Number Average Value Number Average Value Number Average Value
LOANS ORIGINATED 62 $287,791 47 $289,794 2 $299,500 APPLICATIONS APPROVED, NOT ACCEPTED 20 $296,162 24 $283,012 1 $275,000 APPLICATIONS DENIED 5 $296,600 2 $271,500 1 $324,000 APPLICATIONS WITHDRAWN 6 $312,167 2 $315,500 0 $0 FILES CLOSED FOR INCOMPLETENESS 1 $293,000 0 $0 0 $0
Aggregated Statistics For Year 2002(Based on 13 full tracts) A) Conventional B) Refinancings C) Non-occupant Loans on Number Average Value Number Average Value Number Average Value
LOANS ORIGINATED 108 $257,579 61 $268,096 2 $217,500 APPLICATIONS APPROVED, NOT ACCEPTED 34 $259,311 33 $250,845 2 $237,000 APPLICATIONS DENIED 2 $352,325 4 $235,000 0 $0 APPLICATIONS WITHDRAWN 9 $273,186 11 $230,182 0 $0 FILES CLOSED FOR INCOMPLETENESS 3 $93,647 1 $222,000 0 $0
Aggregated Statistics For Year 2001(Based on 13 full tracts) A) Conventional B) Refinancings C) Non-occupant Loans on Number Average Value Number Average Value Number Average Value
LOANS ORIGINATED 125 $215,192 77 $244,209 4 $155,500 APPLICATIONS APPROVED, NOT ACCEPTED 21 $209,277 24 $213,200 1 $125,000 APPLICATIONS DENIED 6 $214,253 6 $263,000 0 $0 APPLICATIONS WITHDRAWN 4 $245,250 2 $136,970 0 $0 FILES CLOSED FOR INCOMPLETENESS 1 $279,860 0 $0 0 $0
Aggregated Statistics For Year 2000(Based on 13 full tracts) A) Conventional B) Refinancings C) Non-occupant Loans on Number Average Value Number Average Value Number Average Value
LOANS ORIGINATED 137 $217,599 44 $241,700 5 $167,200 APPLICATIONS APPROVED, NOT ACCEPTED 31 $237,833 18 $217,422 1 $239,000 APPLICATIONS DENIED 7 $181,714 2 $187,500 0 $0 APPLICATIONS WITHDRAWN 0 $0 4 $279,442 0 $0 FILES CLOSED FOR INCOMPLETENESS 2 $295,000 1 $129,940 0 $0
Aggregated Statistics For Year 1999(Based on 7 full and 6 partial tracts) A) Conventional B) Refinancings C) Non-occupant Loans on Number Average Value Number Average Value Number Average Value
LOANS ORIGINATED 154 $220,061 83 $208,935 4 $158,300 APPLICATIONS APPROVED, NOT ACCEPTED 24 $206,262 31 $219,204 0 $0 APPLICATIONS DENIED 11 $221,637 8 $217,018 0 $0 APPLICATIONS WITHDRAWN 9 $237,759 4 $221,962 0 $0 FILES CLOSED FOR INCOMPLETENESS 4 $215,495 4 $182,858 0 $0
Most common first names in Cerritos, CA among deceased individuals Name Count Lived (average)
Mary 59 79.1 years John 51 77.5 years Robert 50 73.0 years James 39 73.5 years Joseph 38 76.1 years William 34 75.7 years Charles 27 75.0 years Maria 26 82.4 years Ruth 25 84.9 years Virginia 24 82.1 years
Most common last names in Cerritos, CA among deceased individuals Last name Count Lived (average)
Kim 56 77.0 years Lee 51 76.6 years Garcia 19 75.5 years Chang 19 80.1 years Chen 16 75.3 years Park 15 75.1 years Williams 14 76.1 years Smith 14 81.6 years Patel 14 71.8 years Johnson 12 74.2 years
Cerritos compared to California state average:
Unemployed percentage significantly below state average. Hispanic race population percentage significantly below state average. Median age significantly above state average. Renting percentage significantly below state average. Length of stay since moving in significantly above state average. Number of rooms per house above state average. Percentage of population with a bachelor's degree or higher above state average.
#11 on the list of "Top 101 cities where residents moved in more then 10 years ago (10,000+ households)"
#16 on the list of "Top 101 cities with the most local government spending on current operations of parks and recreation per resident (population 10,000+)"
#16 on the list of "Top 101 cities with the most residents born in Taiwan (population 500+)"
#18 on the list of "Top 101 cities with the most residents born in Korea (population 500+)"
#21 on the list of "Top 101 cities with the most local government spending on current operations of libraries per resident (population 10,000+)"
#23 on the list of "Top 101 cities with the most residents born in Eastern Asia (population 500+)"
#27 on the list of "Top 101 cities with the most residents born in Asia (population 500+)"
#29 on the list of "Top 100 cities with oldest residents (pop. 50,000+)"
#30 on the list of "Top 100 cities with highest percentage of foreign-born residents (pop. 50,000+)"
#47 on the list of "Top 101 cities with largest percentage of females in occupations: health diagnosing and treating practitioners and other technical occupations (population 5,000+)"
#47 on the list of "Top 100 cities with highest median house value (pop. 50,000+)"
#56 on the list of "Top 101 cities with the most residents born in China (population 500+)"
#61 on the list of "Top 101 cities with the most residents born in Philippines (population 500+)"
#63 on the list of "Top 100 cities with declining populations from 2000 to 2014 (pop. 50,000+)"
#76 on the list of "Top 101 cities with the most residents born in South Eastern Asia (population 500+)"
#85 on the list of "Top 100 cities with highest median household income (pop. 50,000+)"
#85 on the list of "Top 100 cities with highest percentage of college students (pop. 50,000+)"
#99 on the list of "Top 100 cities with highest ratio of median house value to median household income (pop. 50,000+)"
#1 on the list of "Top 101 counties with the most Evangelical Protestant congregations"
#1 on the list of "Top 101 counties with the most Mainline Protestant congregations"
#1 on the list of "Top 101 counties with the most Orthodox adherents"
#1 on the list of "Top 101 counties with the highest ground withdrawal of fresh water for public supply (pop. 50,000+)"
#1 on the list of "Top 101 counties with the most Catholic adherents (pop. 50,000+)"
Top Patent Applicants
Alan De La Rama (43)
Lemuel S. Park (32)
James M. Nagashima (24)
George John (23)
Peter Steven Bui (21)
Puneet Nanda (21)
Man-Wing Tang (20)
Jayesh R. Bhakta (19)
Kapil Chaudhry (18)
Rajendra Kumar (16)
Total of 745 patent applications in 2008-2024.
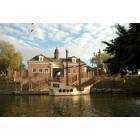

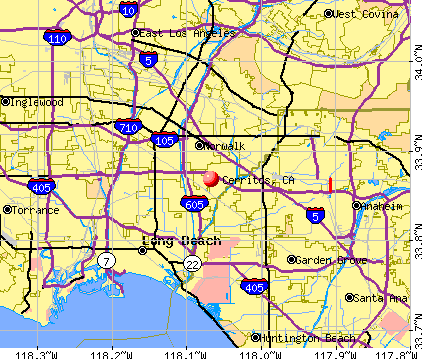


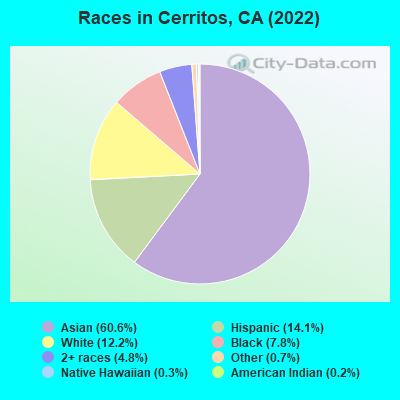
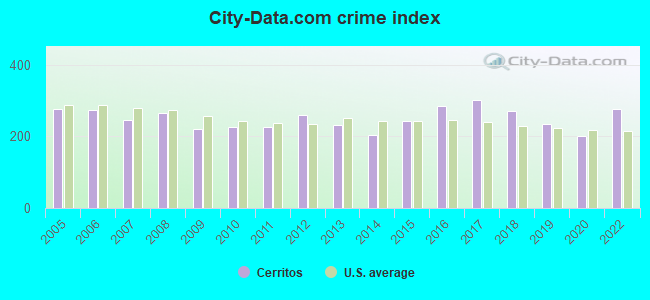
 Recent articles from our blog. Our writers, many of them Ph.D. graduates or candidates, create easy-to-read articles on a wide variety of topics.

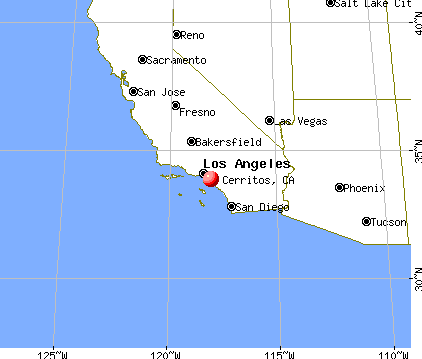
 (6.8 miles
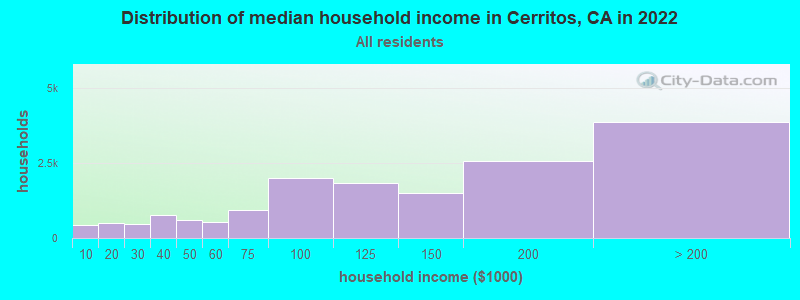

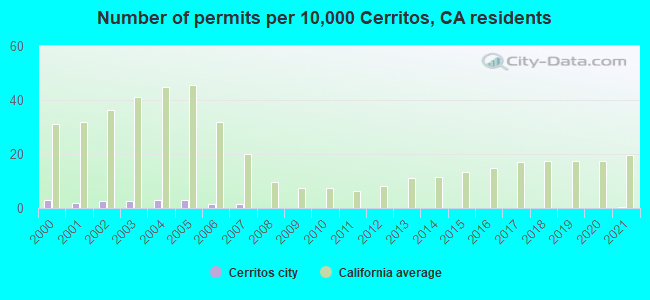
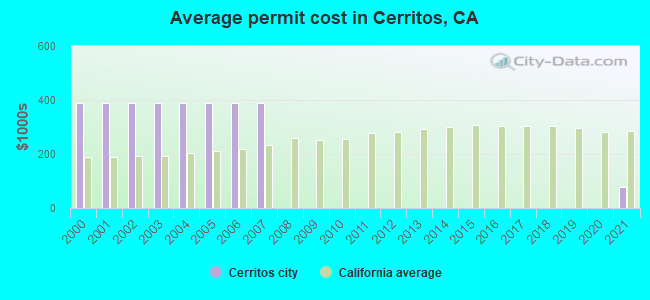
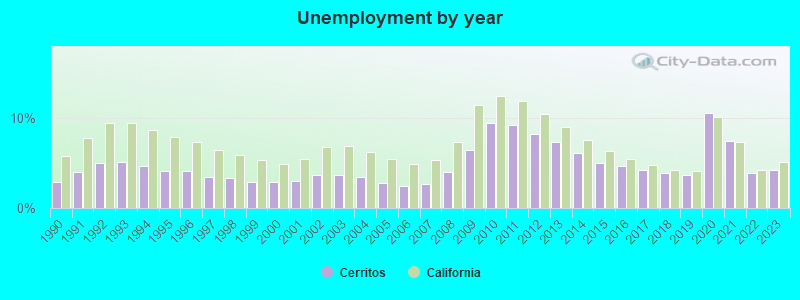
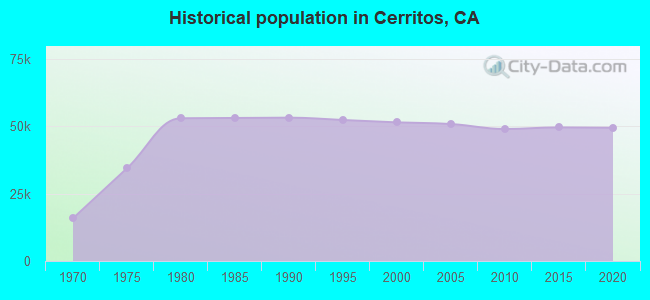
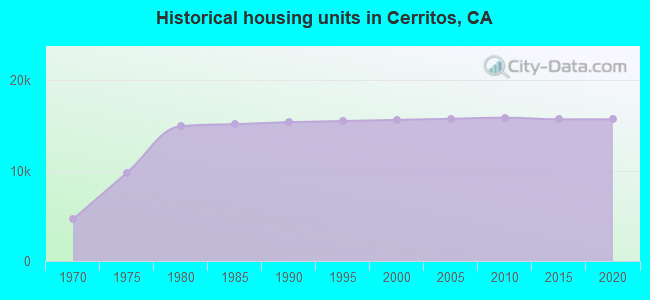
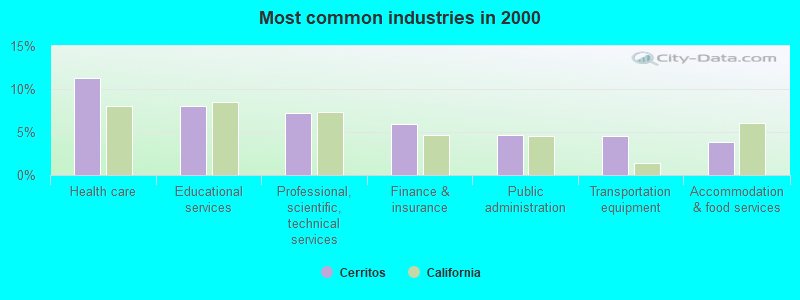
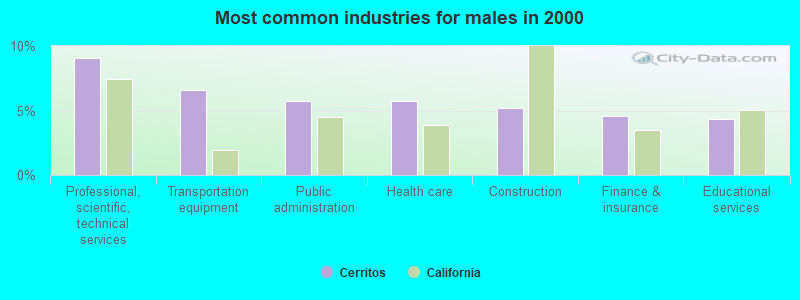
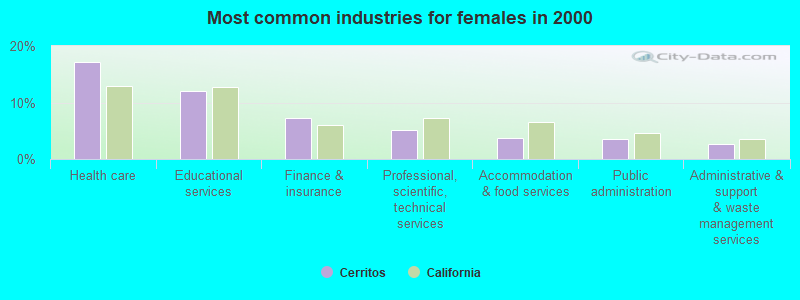
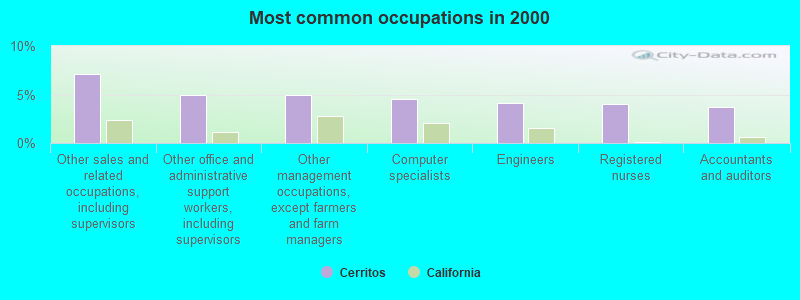
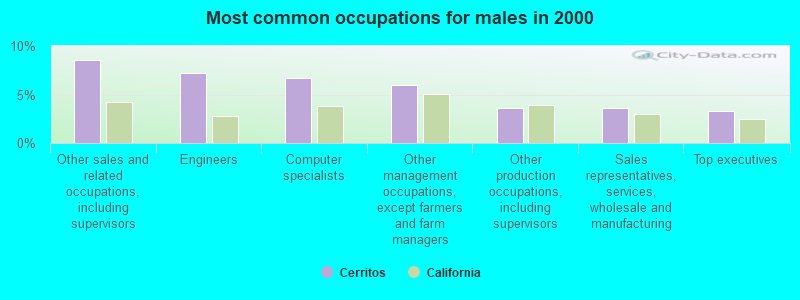
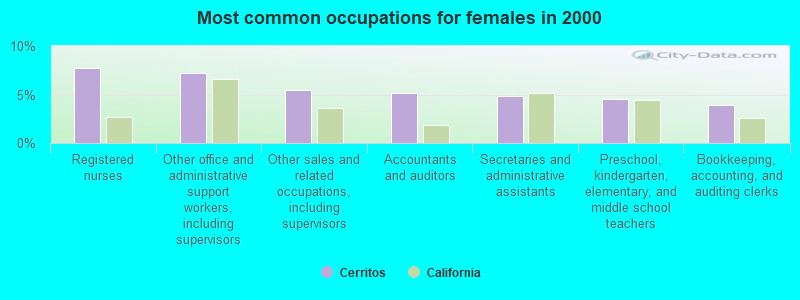
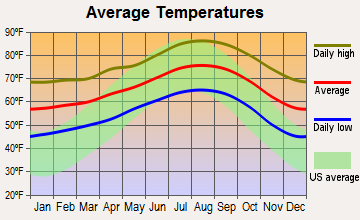
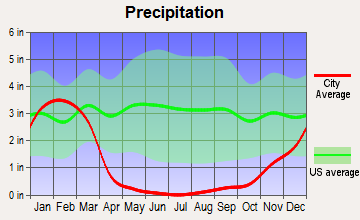
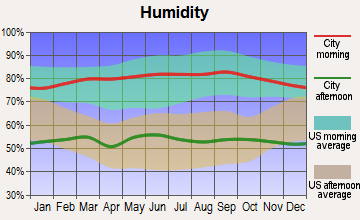
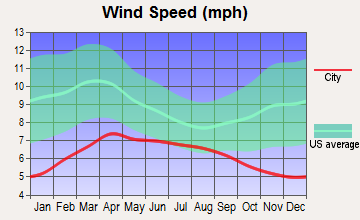
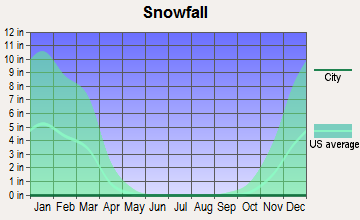
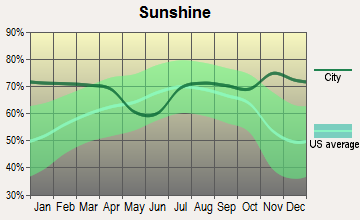
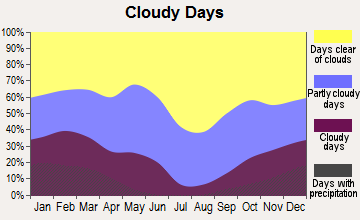


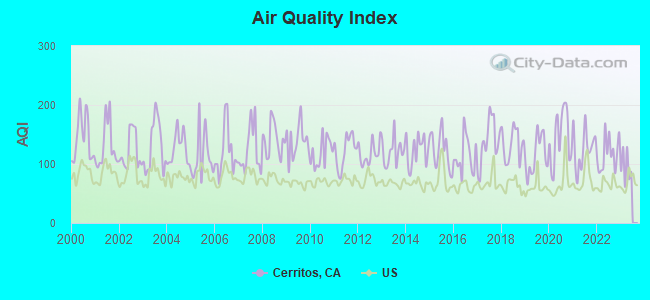
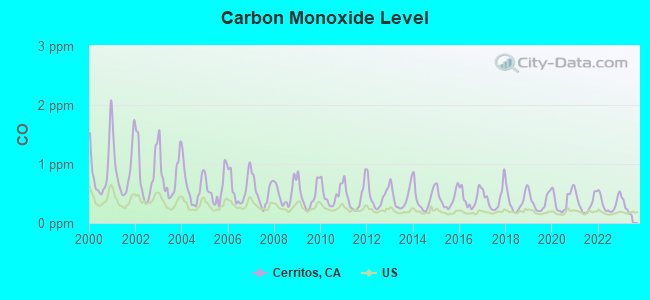
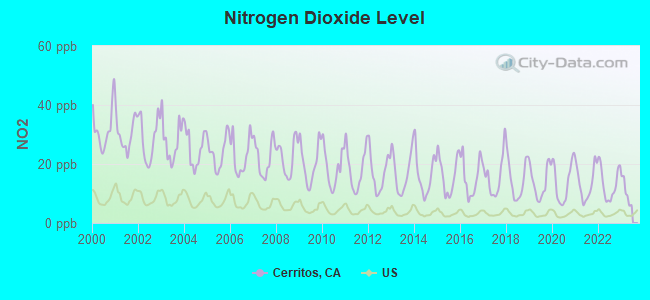
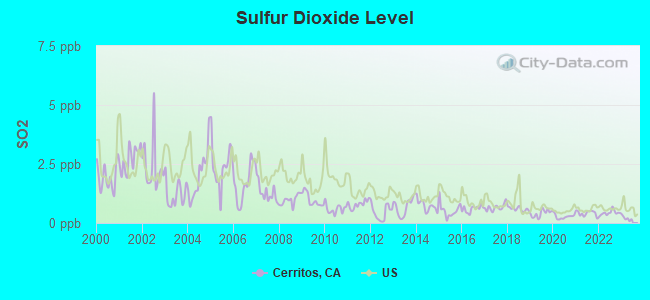
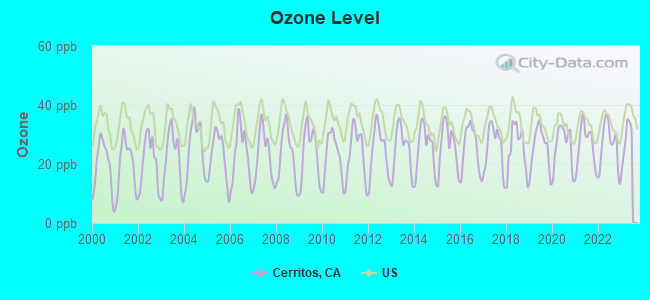
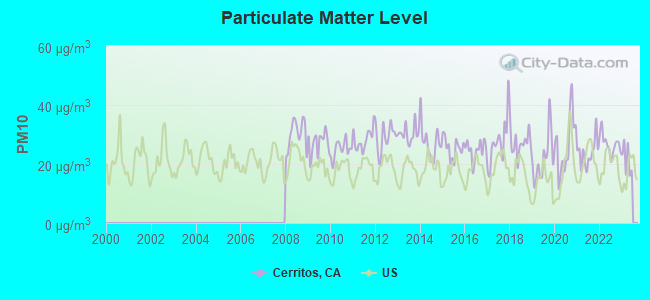
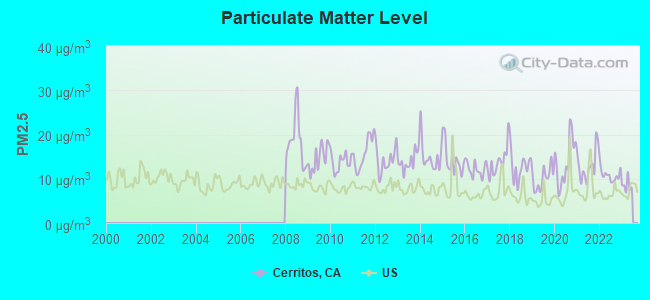
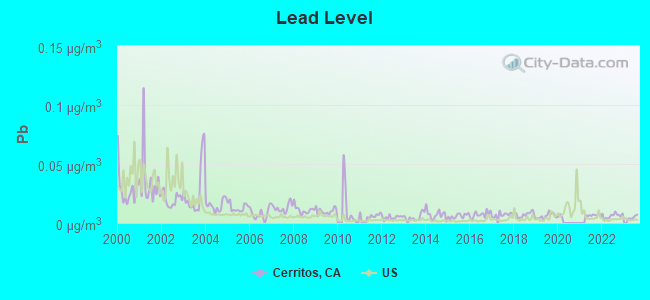
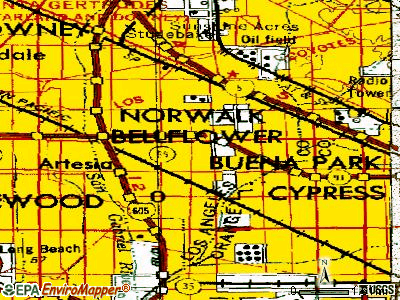
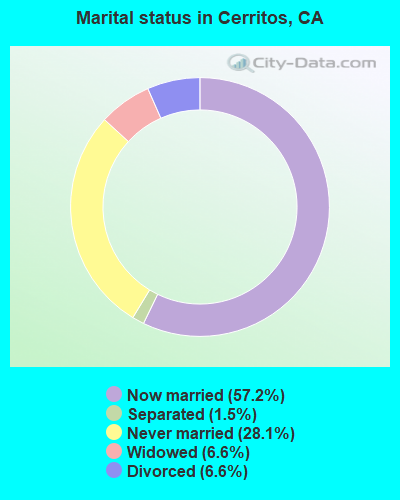
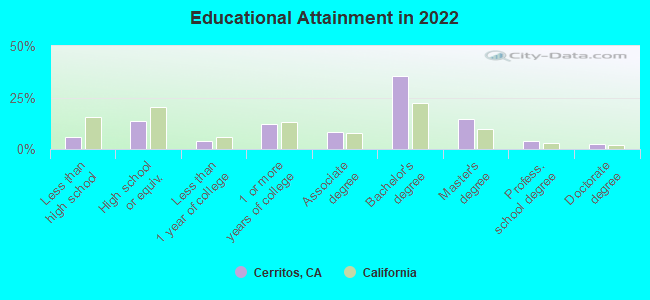
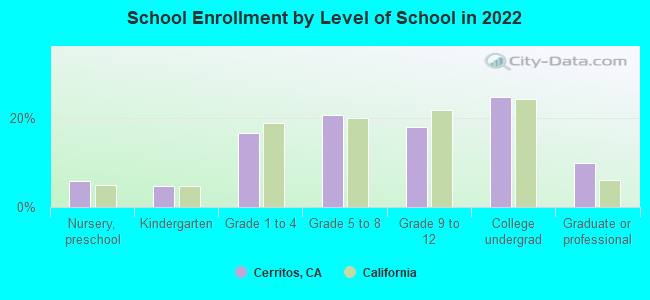
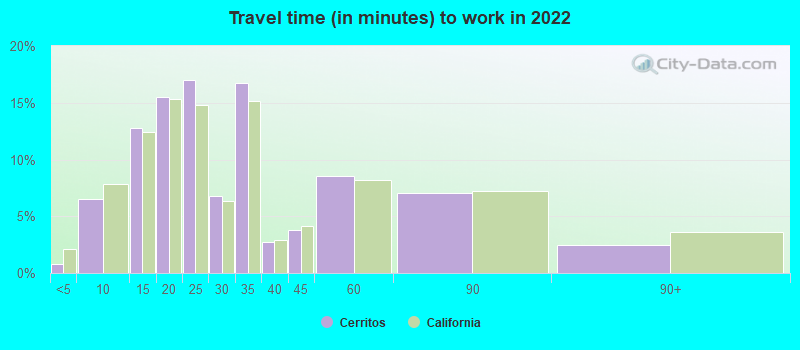
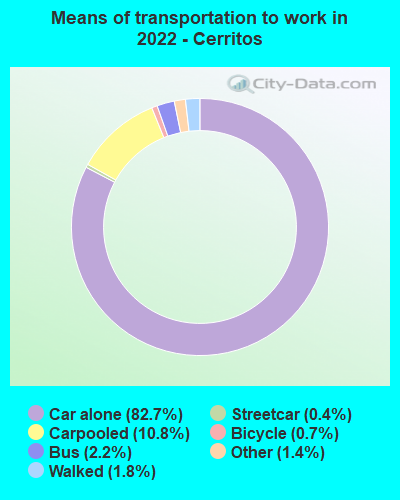


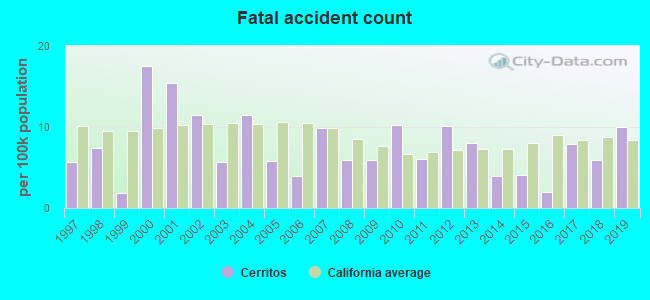
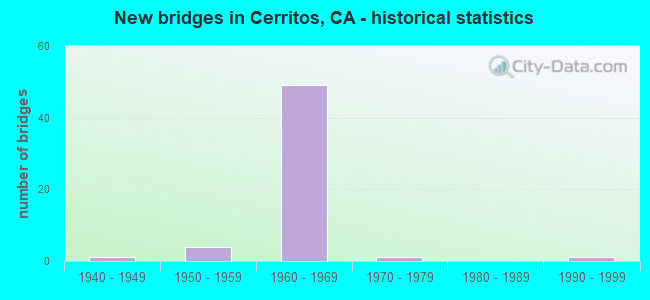
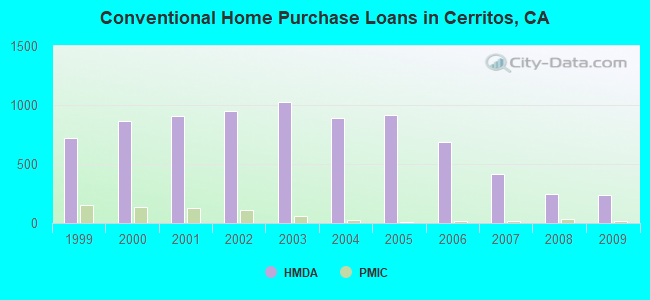
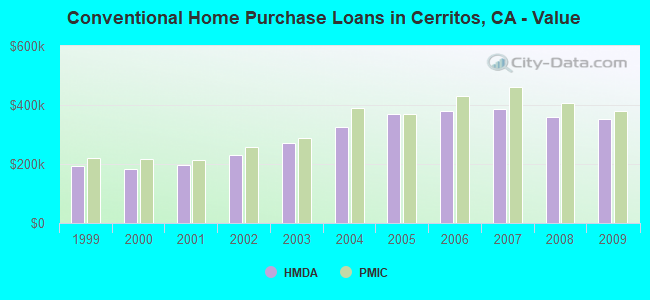
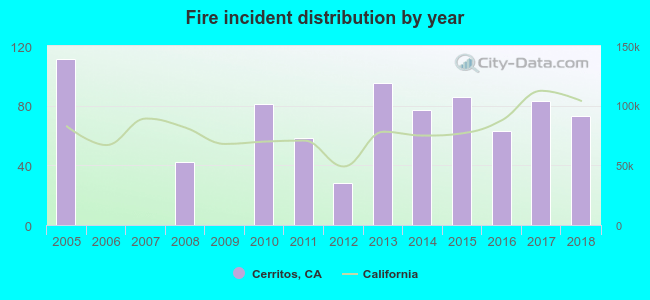 According to the data from the years 2005 - 2018 the average number of fires per year is 57. The highest number of reported fires - 111 took place in 2005, and the least - 0 in 2006. The data has a declining trend.
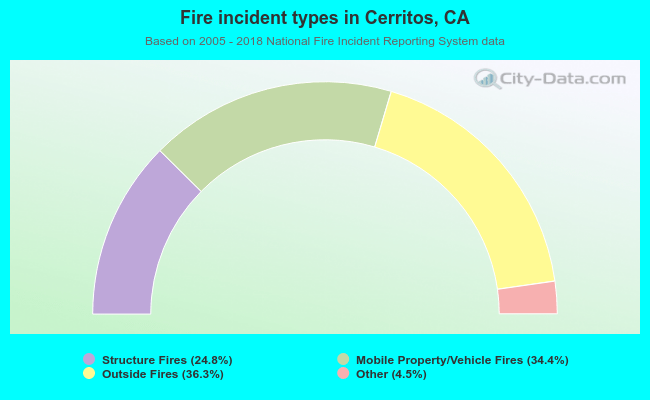 When looking into fire subcategories, the most incidents belonged to: Outside Fires (36.3%), and Mobile Property/Vehicle Fires (34.4%).