Cypress, California Submit your own pictures of this city and show them to the world
OSM Map
General Map
Google Map
MSN Map
OSM Map
General Map
Google Map
MSN Map
OSM Map
General Map
Google Map
MSN Map
OSM Map
General Map
Google Map
MSN Map
Please wait while loading the map...
Population in 2022: 49,243 (100% urban, 0% rural). Population change since 2000: +6.5%Males: 23,903 Females: 25,340
March 2022 cost of living index in Cypress: 88.5 (less than average, U.S. average is 100) Percentage of residents living in poverty in 2022: 7.3%for White Non-Hispanic residents , 9.7% for Black residents , 8.5% for Hispanic or Latino residents , 3.4% for American Indian residents , 15.9% for Native Hawaiian and other Pacific Islander residents , 9.4% for other race residents , 7.5% for two or more races residents )
Profiles of local businesses
Business Search - 14 Million verified businesses
Data:
Median household income ($)
Median household income (% change since 2000)
Household income diversity
Ratio of average income to average house value (%)
Ratio of average income to average rent
Median household income ($) - White
Median household income ($) - Black or African American
Median household income ($) - Asian
Median household income ($) - Hispanic or Latino
Median household income ($) - American Indian and Alaska Native
Median household income ($) - Multirace
Median household income ($) - Other Race
Median household income for houses/condos with a mortgage ($)
Median household income for apartments without a mortgage ($)
Races - White alone (%)
Races - White alone (% change since 2000)
Races - Black alone (%)
Races - Black alone (% change since 2000)
Races - American Indian alone (%)
Races - American Indian alone (% change since 2000)
Races - Asian alone (%)
Races - Asian alone (% change since 2000)
Races - Hispanic (%)
Races - Hispanic (% change since 2000)
Races - Native Hawaiian and Other Pacific Islander alone (%)
Races - Native Hawaiian and Other Pacific Islander alone (% change since 2000)
Races - Two or more races (%)
Races - Two or more races (% change since 2000)
Races - Other race alone (%)
Races - Other race alone (% change since 2000)
Racial diversity
Unemployment (%)
Unemployment (% change since 2000)
Unemployment (%) - White
Unemployment (%) - Black or African American
Unemployment (%) - Asian
Unemployment (%) - Hispanic or Latino
Unemployment (%) - American Indian and Alaska Native
Unemployment (%) - Multirace
Unemployment (%) - Other Race
Population density (people per square mile)
Population - Males (%)
Population - Females (%)
Population - Males (%) - White
Population - Males (%) - Black or African American
Population - Males (%) - Asian
Population - Males (%) - Hispanic or Latino
Population - Males (%) - American Indian and Alaska Native
Population - Males (%) - Multirace
Population - Males (%) - Other Race
Population - Females (%) - White
Population - Females (%) - Black or African American
Population - Females (%) - Asian
Population - Females (%) - Hispanic or Latino
Population - Females (%) - American Indian and Alaska Native
Population - Females (%) - Multirace
Population - Females (%) - Other Race
Coronavirus confirmed cases (Apr 27, 2024)
Deaths caused by coronavirus (Apr 27, 2024)
Coronavirus confirmed cases (per 100k population) (Apr 27, 2024)
Deaths caused by coronavirus (per 100k population) (Apr 27, 2024)
Daily increase in number of cases (Apr 27, 2024)
Weekly increase in number of cases (Apr 27, 2024)
Cases doubled (in days) (Apr 27, 2024)
Hospitalized patients (Apr 18, 2022)
Negative test results (Apr 18, 2022)
Total test results (Apr 18, 2022)
COVID Vaccine doses distributed (per 100k population) (Sep 19, 2023)
COVID Vaccine doses administered (per 100k population) (Sep 19, 2023)
COVID Vaccine doses distributed (Sep 19, 2023)
COVID Vaccine doses administered (Sep 19, 2023)
Likely homosexual households (%)
Likely homosexual households (% change since 2000)
Likely homosexual households - Lesbian couples (%)
Likely homosexual households - Lesbian couples (% change since 2000)
Likely homosexual households - Gay men (%)
Likely homosexual households - Gay men (% change since 2000)
Cost of living index
Median gross rent ($)
Median contract rent ($)
Median monthly housing costs ($)
Median house or condo value ($)
Median house or condo value ($ change since 2000)
Mean house or condo value by units in structure - 1, detached ($)
Mean house or condo value by units in structure - 1, attached ($)
Mean house or condo value by units in structure - 2 ($)
Mean house or condo value by units in structure by units in structure - 3 or 4 ($)
Mean house or condo value by units in structure - 5 or more ($)
Mean house or condo value by units in structure - Boat, RV, van, etc. ($)
Mean house or condo value by units in structure - Mobile home ($)
Median house or condo value ($) - White
Median house or condo value ($) - Black or African American
Median house or condo value ($) - Asian
Median house or condo value ($) - Hispanic or Latino
Median house or condo value ($) - American Indian and Alaska Native
Median house or condo value ($) - Multirace
Median house or condo value ($) - Other Race
Median resident age
Resident age diversity
Median resident age - Males
Median resident age - Females
Median resident age - White
Median resident age - Black or African American
Median resident age - Asian
Median resident age - Hispanic or Latino
Median resident age - American Indian and Alaska Native
Median resident age - Multirace
Median resident age - Other Race
Median resident age - Males - White
Median resident age - Males - Black or African American
Median resident age - Males - Asian
Median resident age - Males - Hispanic or Latino
Median resident age - Males - American Indian and Alaska Native
Median resident age - Males - Multirace
Median resident age - Males - Other Race
Median resident age - Females - White
Median resident age - Females - Black or African American
Median resident age - Females - Asian
Median resident age - Females - Hispanic or Latino
Median resident age - Females - American Indian and Alaska Native
Median resident age - Females - Multirace
Median resident age - Females - Other Race
Commute - mean travel time to work (minutes)
Travel time to work - Less than 5 minutes (%)
Travel time to work - Less than 5 minutes (% change since 2000)
Travel time to work - 5 to 9 minutes (%)
Travel time to work - 5 to 9 minutes (% change since 2000)
Travel time to work - 10 to 19 minutes (%)
Travel time to work - 10 to 19 minutes (% change since 2000)
Travel time to work - 20 to 29 minutes (%)
Travel time to work - 20 to 29 minutes (% change since 2000)
Travel time to work - 30 to 39 minutes (%)
Travel time to work - 30 to 39 minutes (% change since 2000)
Travel time to work - 40 to 59 minutes (%)
Travel time to work - 40 to 59 minutes (% change since 2000)
Travel time to work - 60 to 89 minutes (%)
Travel time to work - 60 to 89 minutes (% change since 2000)
Travel time to work - 90 or more minutes (%)
Travel time to work - 90 or more minutes (% change since 2000)
Marital status - Never married (%)
Marital status - Now married (%)
Marital status - Separated (%)
Marital status - Widowed (%)
Marital status - Divorced (%)
Median family income ($)
Median family income (% change since 2000)
Median non-family income ($)
Median non-family income (% change since 2000)
Median per capita income ($)
Median per capita income (% change since 2000)
Median family income ($) - White
Median family income ($) - Black or African American
Median family income ($) - Asian
Median family income ($) - Hispanic or Latino
Median family income ($) - American Indian and Alaska Native
Median family income ($) - Multirace
Median family income ($) - Other Race
Median year house/condo built
Median year apartment built
Year house built - Built 2005 or later (%)
Year house built - Built 2000 to 2004 (%)
Year house built - Built 1990 to 1999 (%)
Year house built - Built 1980 to 1989 (%)
Year house built - Built 1970 to 1979 (%)
Year house built - Built 1960 to 1969 (%)
Year house built - Built 1950 to 1959 (%)
Year house built - Built 1940 to 1949 (%)
Year house built - Built 1939 or earlier (%)
Average household size
Household density (households per square mile)
Average household size - White
Average household size - Black or African American
Average household size - Asian
Average household size - Hispanic or Latino
Average household size - American Indian and Alaska Native
Average household size - Multirace
Average household size - Other Race
Occupied housing units (%)
Vacant housing units (%)
Owner occupied housing units (%)
Renter occupied housing units (%)
Vacancy status - For rent (%)
Vacancy status - For sale only (%)
Vacancy status - Rented or sold, not occupied (%)
Vacancy status - For seasonal, recreational, or occasional use (%)
Vacancy status - For migrant workers (%)
Vacancy status - Other vacant (%)
Residents with income below the poverty level (%)
Residents with income below 50% of the poverty level (%)
Children below poverty level (%)
Poor families by family type - Married-couple family (%)
Poor families by family type - Male, no wife present (%)
Poor families by family type - Female, no husband present (%)
Poverty status for native-born residents (%)
Poverty status for foreign-born residents (%)
Poverty among high school graduates not in families (%)
Poverty among people who did not graduate high school not in families (%)
Residents with income below the poverty level (%) - White
Residents with income below the poverty level (%) - Black or African American
Residents with income below the poverty level (%) - Asian
Residents with income below the poverty level (%) - Hispanic or Latino
Residents with income below the poverty level (%) - American Indian and Alaska Native
Residents with income below the poverty level (%) - Multirace
Residents with income below the poverty level (%) - Other Race
Air pollution - Air Quality Index (AQI)
Air pollution - CO
Air pollution - NO2
Air pollution - SO2
Air pollution - Ozone
Air pollution - PM10
Air pollution - PM25
Air pollution - Pb
Crime - Murders per 100,000 population
Crime - Rapes per 100,000 population
Crime - Robberies per 100,000 population
Crime - Assaults per 100,000 population
Crime - Burglaries per 100,000 population
Crime - Thefts per 100,000 population
Crime - Auto thefts per 100,000 population
Crime - Arson per 100,000 population
Crime - City-data.com crime index
Crime - Violent crime index
Crime - Property crime index
Crime - Murders per 100,000 population (5 year average)
Crime - Rapes per 100,000 population (5 year average)
Crime - Robberies per 100,000 population (5 year average)
Crime - Assaults per 100,000 population (5 year average)
Crime - Burglaries per 100,000 population (5 year average)
Crime - Thefts per 100,000 population (5 year average)
Crime - Auto thefts per 100,000 population (5 year average)
Crime - Arson per 100,000 population (5 year average)
Crime - City-data.com crime index (5 year average)
Crime - Violent crime index (5 year average)
Crime - Property crime index (5 year average)
1996 Presidential Elections Results (%) - Democratic Party (Clinton)
1996 Presidential Elections Results (%) - Republican Party (Dole)
1996 Presidential Elections Results (%) - Other
2000 Presidential Elections Results (%) - Democratic Party (Gore)
2000 Presidential Elections Results (%) - Republican Party (Bush)
2000 Presidential Elections Results (%) - Other
2004 Presidential Elections Results (%) - Democratic Party (Kerry)
2004 Presidential Elections Results (%) - Republican Party (Bush)
2004 Presidential Elections Results (%) - Other
2008 Presidential Elections Results (%) - Democratic Party (Obama)
2008 Presidential Elections Results (%) - Republican Party (McCain)
2008 Presidential Elections Results (%) - Other
2012 Presidential Elections Results (%) - Democratic Party (Obama)
2012 Presidential Elections Results (%) - Republican Party (Romney)
2012 Presidential Elections Results (%) - Other
2016 Presidential Elections Results (%) - Democratic Party (Clinton)
2016 Presidential Elections Results (%) - Republican Party (Trump)
2016 Presidential Elections Results (%) - Other
2020 Presidential Elections Results (%) - Democratic Party (Biden)
2020 Presidential Elections Results (%) - Republican Party (Trump)
2020 Presidential Elections Results (%) - Other
Ancestries Reported - Arab (%)
Ancestries Reported - Czech (%)
Ancestries Reported - Danish (%)
Ancestries Reported - Dutch (%)
Ancestries Reported - English (%)
Ancestries Reported - French (%)
Ancestries Reported - French Canadian (%)
Ancestries Reported - German (%)
Ancestries Reported - Greek (%)
Ancestries Reported - Hungarian (%)
Ancestries Reported - Irish (%)
Ancestries Reported - Italian (%)
Ancestries Reported - Lithuanian (%)
Ancestries Reported - Norwegian (%)
Ancestries Reported - Polish (%)
Ancestries Reported - Portuguese (%)
Ancestries Reported - Russian (%)
Ancestries Reported - Scotch-Irish (%)
Ancestries Reported - Scottish (%)
Ancestries Reported - Slovak (%)
Ancestries Reported - Subsaharan African (%)
Ancestries Reported - Swedish (%)
Ancestries Reported - Swiss (%)
Ancestries Reported - Ukrainian (%)
Ancestries Reported - United States (%)
Ancestries Reported - Welsh (%)
Ancestries Reported - West Indian (%)
Ancestries Reported - Other (%)
Educational Attainment - No schooling completed (%)
Educational Attainment - Less than high school (%)
Educational Attainment - High school or equivalent (%)
Educational Attainment - Less than 1 year of college (%)
Educational Attainment - 1 or more years of college (%)
Educational Attainment - Associate degree (%)
Educational Attainment - Bachelor's degree (%)
Educational Attainment - Master's degree (%)
Educational Attainment - Professional school degree (%)
Educational Attainment - Doctorate degree (%)
School Enrollment - Nursery, preschool (%)
School Enrollment - Kindergarten (%)
School Enrollment - Grade 1 to 4 (%)
School Enrollment - Grade 5 to 8 (%)
School Enrollment - Grade 9 to 12 (%)
School Enrollment - College undergrad (%)
School Enrollment - Graduate or professional (%)
School Enrollment - Not enrolled in school (%)
School enrollment - Public schools (%)
School enrollment - Private schools (%)
School enrollment - Not enrolled (%)
Median number of rooms in houses and condos
Median number of rooms in apartments
Housing units lacking complete plumbing facilities (%)
Housing units lacking complete kitchen facilities (%)
Density of houses
Urban houses (%)
Rural houses (%)
Households with people 60 years and over (%)
Households with people 65 years and over (%)
Households with people 75 years and over (%)
Households with one or more nonrelatives (%)
Households with no nonrelatives (%)
Population in households (%)
Family households (%)
Nonfamily households (%)
Population in families (%)
Family households with own children (%)
Median number of bedrooms in owner occupied houses
Mean number of bedrooms in owner occupied houses
Median number of bedrooms in renter occupied houses
Mean number of bedrooms in renter occupied houses
Median number of vehichles in owner occupied houses
Mean number of vehichles in owner occupied houses
Median number of vehichles in renter occupied houses
Mean number of vehichles in renter occupied houses
Mortgage status - with mortgage (%)
Mortgage status - with second mortgage (%)
Mortgage status - with home equity loan (%)
Mortgage status - with both second mortgage and home equity loan (%)
Mortgage status - without a mortgage (%)
Average family size
Average family size - White
Average family size - Black or African American
Average family size - Asian
Average family size - Hispanic or Latino
Average family size - American Indian and Alaska Native
Average family size - Multirace
Average family size - Other Race
Geographical mobility - Same house 1 year ago (%)
Geographical mobility - Moved within same county (%)
Geographical mobility - Moved from different county within same state (%)
Geographical mobility - Moved from different state (%)
Geographical mobility - Moved from abroad (%)
Place of birth - Born in state of residence (%)
Place of birth - Born in other state (%)
Place of birth - Native, outside of US (%)
Place of birth - Foreign born (%)
Housing units in structures - 1, detached (%)
Housing units in structures - 1, attached (%)
Housing units in structures - 2 (%)
Housing units in structures - 3 or 4 (%)
Housing units in structures - 5 to 9 (%)
Housing units in structures - 10 to 19 (%)
Housing units in structures - 20 to 49 (%)
Housing units in structures - 50 or more (%)
Housing units in structures - Mobile home (%)
Housing units in structures - Boat, RV, van, etc. (%)
House/condo owner moved in on average (years ago)
Renter moved in on average (years ago)
Year householder moved into unit - Moved in 1999 to March 2000 (%)
Year householder moved into unit - Moved in 1995 to 1998 (%)
Year householder moved into unit - Moved in 1990 to 1994 (%)
Year householder moved into unit - Moved in 1980 to 1989 (%)
Year householder moved into unit - Moved in 1970 to 1979 (%)
Year householder moved into unit - Moved in 1969 or earlier (%)
Means of transportation to work - Drove car alone (%)
Means of transportation to work - Carpooled (%)
Means of transportation to work - Public transportation (%)
Means of transportation to work - Bus or trolley bus (%)
Means of transportation to work - Streetcar or trolley car (%)
Means of transportation to work - Subway or elevated (%)
Means of transportation to work - Railroad (%)
Means of transportation to work - Ferryboat (%)
Means of transportation to work - Taxicab (%)
Means of transportation to work - Motorcycle (%)
Means of transportation to work - Bicycle (%)
Means of transportation to work - Walked (%)
Means of transportation to work - Other means (%)
Working at home (%)
Industry diversity
Most Common Industries - Agriculture, forestry, fishing and hunting, and mining (%)
Most Common Industries - Agriculture, forestry, fishing and hunting (%)
Most Common Industries - Mining, quarrying, and oil and gas extraction (%)
Most Common Industries - Construction (%)
Most Common Industries - Manufacturing (%)
Most Common Industries - Wholesale trade (%)
Most Common Industries - Retail trade (%)
Most Common Industries - Transportation and warehousing, and utilities (%)
Most Common Industries - Transportation and warehousing (%)
Most Common Industries - Utilities (%)
Most Common Industries - Information (%)
Most Common Industries - Finance and insurance, and real estate and rental and leasing (%)
Most Common Industries - Finance and insurance (%)
Most Common Industries - Real estate and rental and leasing (%)
Most Common Industries - Professional, scientific, and management, and administrative and waste management services (%)
Most Common Industries - Professional, scientific, and technical services (%)
Most Common Industries - Management of companies and enterprises (%)
Most Common Industries - Administrative and support and waste management services (%)
Most Common Industries - Educational services, and health care and social assistance (%)
Most Common Industries - Educational services (%)
Most Common Industries - Health care and social assistance (%)
Most Common Industries - Arts, entertainment, and recreation, and accommodation and food services (%)
Most Common Industries - Arts, entertainment, and recreation (%)
Most Common Industries - Accommodation and food services (%)
Most Common Industries - Other services, except public administration (%)
Most Common Industries - Public administration (%)
Occupation diversity
Most Common Occupations - Management, business, science, and arts occupations (%)
Most Common Occupations - Management, business, and financial occupations (%)
Most Common Occupations - Management occupations (%)
Most Common Occupations - Business and financial operations occupations (%)
Most Common Occupations - Computer, engineering, and science occupations (%)
Most Common Occupations - Computer and mathematical occupations (%)
Most Common Occupations - Architecture and engineering occupations (%)
Most Common Occupations - Life, physical, and social science occupations (%)
Most Common Occupations - Education, legal, community service, arts, and media occupations (%)
Most Common Occupations - Community and social service occupations (%)
Most Common Occupations - Legal occupations (%)
Most Common Occupations - Education, training, and library occupations (%)
Most Common Occupations - Arts, design, entertainment, sports, and media occupations (%)
Most Common Occupations - Healthcare practitioners and technical occupations (%)
Most Common Occupations - Health diagnosing and treating practitioners and other technical occupations (%)
Most Common Occupations - Health technologists and technicians (%)
Most Common Occupations - Service occupations (%)
Most Common Occupations - Healthcare support occupations (%)
Most Common Occupations - Protective service occupations (%)
Most Common Occupations - Fire fighting and prevention, and other protective service workers including supervisors (%)
Most Common Occupations - Law enforcement workers including supervisors (%)
Most Common Occupations - Food preparation and serving related occupations (%)
Most Common Occupations - Building and grounds cleaning and maintenance occupations (%)
Most Common Occupations - Personal care and service occupations (%)
Most Common Occupations - Sales and office occupations (%)
Most Common Occupations - Sales and related occupations (%)
Most Common Occupations - Office and administrative support occupations (%)
Most Common Occupations - Natural resources, construction, and maintenance occupations (%)
Most Common Occupations - Farming, fishing, and forestry occupations (%)
Most Common Occupations - Construction and extraction occupations (%)
Most Common Occupations - Installation, maintenance, and repair occupations (%)
Most Common Occupations - Production, transportation, and material moving occupations (%)
Most Common Occupations - Production occupations (%)
Most Common Occupations - Transportation occupations (%)
Most Common Occupations - Material moving occupations (%)
People in Group quarters - Institutionalized population (%)
People in Group quarters - Correctional institutions (%)
People in Group quarters - Federal prisons and detention centers (%)
People in Group quarters - Halfway houses (%)
People in Group quarters - Local jails and other confinement facilities (including police lockups) (%)
People in Group quarters - Military disciplinary barracks (%)
People in Group quarters - State prisons (%)
People in Group quarters - Other types of correctional institutions (%)
People in Group quarters - Nursing homes (%)
People in Group quarters - Hospitals/wards, hospices, and schools for the handicapped (%)
People in Group quarters - Hospitals/wards and hospices for chronically ill (%)
People in Group quarters - Hospices or homes for chronically ill (%)
People in Group quarters - Military hospitals or wards for chronically ill (%)
People in Group quarters - Other hospitals or wards for chronically ill (%)
People in Group quarters - Hospitals or wards for drug/alcohol abuse (%)
People in Group quarters - Mental (Psychiatric) hospitals or wards (%)
People in Group quarters - Schools, hospitals, or wards for the mentally retarded (%)
People in Group quarters - Schools, hospitals, or wards for the physically handicapped (%)
People in Group quarters - Institutions for the deaf (%)
People in Group quarters - Institutions for the blind (%)
People in Group quarters - Orthopedic wards and institutions for the physically handicapped (%)
People in Group quarters - Wards in general hospitals for patients who have no usual home elsewhere (%)
People in Group quarters - Wards in military hospitals for patients who have no usual home elsewhere (%)
People in Group quarters - Juvenile institutions (%)
People in Group quarters - Long-term care (%)
People in Group quarters - Homes for abused, dependent, and neglected children (%)
People in Group quarters - Residential treatment centers for emotionally disturbed children (%)
People in Group quarters - Training schools for juvenile delinquents (%)
People in Group quarters - Short-term care, detention or diagnostic centers for delinquent children (%)
People in Group quarters - Type of juvenile institution unknown (%)
People in Group quarters - Noninstitutionalized population (%)
People in Group quarters - College dormitories (includes college quarters off campus) (%)
People in Group quarters - Military quarters (%)
People in Group quarters - On base (%)
People in Group quarters - Barracks, unaccompanied personnel housing (UPH), (Enlisted/Officer), ;and similar group living quarters for military personnel (%)
People in Group quarters - Transient quarters for temporary residents (%)
People in Group quarters - Military ships (%)
People in Group quarters - Group homes (%)
People in Group quarters - Homes or halfway houses for drug/alcohol abuse (%)
People in Group quarters - Homes for the mentally ill (%)
People in Group quarters - Homes for the mentally retarded (%)
People in Group quarters - Homes for the physically handicapped (%)
People in Group quarters - Other group homes (%)
People in Group quarters - Religious group quarters (%)
People in Group quarters - Dormitories (%)
People in Group quarters - Agriculture workers' dormitories on farms (%)
People in Group quarters - Job Corps and vocational training facilities (%)
People in Group quarters - Other workers' dormitories (%)
People in Group quarters - Crews of maritime vessels (%)
People in Group quarters - Other nonhousehold living situations (%)
People in Group quarters - Other noninstitutional group quarters (%)
Residents speaking English at home (%)
Residents speaking English at home - Born in the United States (%)
Residents speaking English at home - Native, born elsewhere (%)
Residents speaking English at home - Foreign born (%)
Residents speaking Spanish at home (%)
Residents speaking Spanish at home - Born in the United States (%)
Residents speaking Spanish at home - Native, born elsewhere (%)
Residents speaking Spanish at home - Foreign born (%)
Residents speaking other language at home (%)
Residents speaking other language at home - Born in the United States (%)
Residents speaking other language at home - Native, born elsewhere (%)
Residents speaking other language at home - Foreign born (%)
Class of Workers - Employee of private company (%)
Class of Workers - Self-employed in own incorporated business (%)
Class of Workers - Private not-for-profit wage and salary workers (%)
Class of Workers - Local government workers (%)
Class of Workers - State government workers (%)
Class of Workers - Federal government workers (%)
Class of Workers - Self-employed workers in own not incorporated business and Unpaid family workers (%)
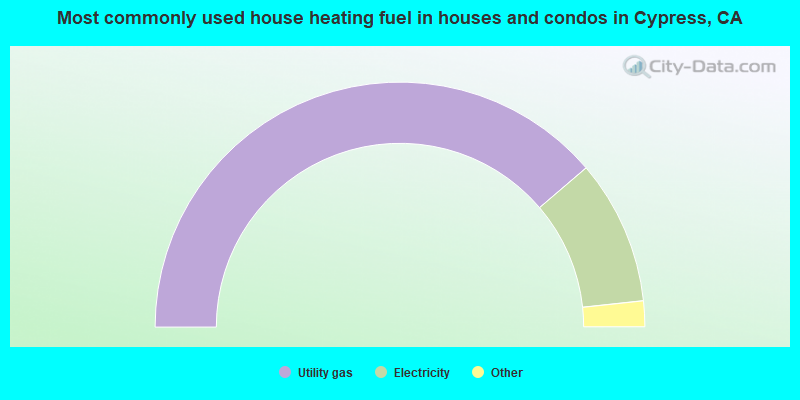
House heating fuel used in houses and condos - Utility gas (%)
House heating fuel used in houses and condos - Bottled, tank, or LP gas (%)
House heating fuel used in houses and condos - Electricity (%)
House heating fuel used in houses and condos - Fuel oil, kerosene, etc. (%)
House heating fuel used in houses and condos - Coal or coke (%)
House heating fuel used in houses and condos - Wood (%)
House heating fuel used in houses and condos - Solar energy (%)
House heating fuel used in houses and condos - Other fuel (%)
House heating fuel used in houses and condos - No fuel used (%)
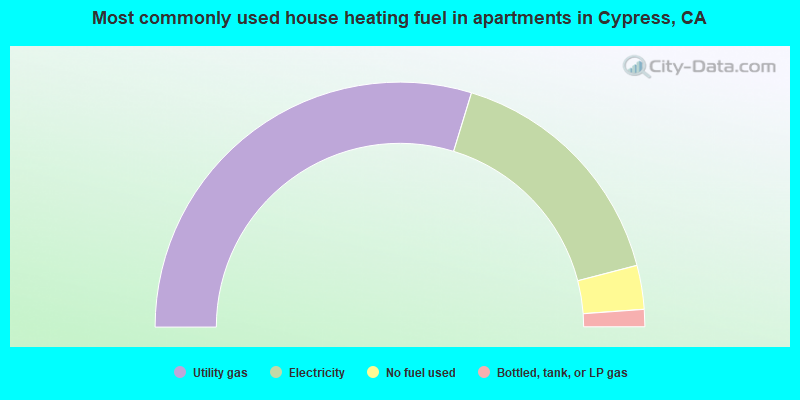
House heating fuel used in apartments - Utility gas (%)
House heating fuel used in apartments - Bottled, tank, or LP gas (%)
House heating fuel used in apartments - Electricity (%)
House heating fuel used in apartments - Fuel oil, kerosene, etc. (%)
House heating fuel used in apartments - Coal or coke (%)
House heating fuel used in apartments - Wood (%)
House heating fuel used in apartments - Solar energy (%)
House heating fuel used in apartments - Other fuel (%)
House heating fuel used in apartments - No fuel used (%)
Armed forces status - In Armed Forces (%)
Armed forces status - Civilian (%)
Armed forces status - Civilian - Veteran (%)
Armed forces status - Civilian - Nonveteran (%)
Fatal accidents locations in years 2005-2021
Fatal accidents locations in 2005
Fatal accidents locations in 2006
Fatal accidents locations in 2007
Fatal accidents locations in 2008
Fatal accidents locations in 2009
Fatal accidents locations in 2010
Fatal accidents locations in 2011
Fatal accidents locations in 2012
Fatal accidents locations in 2013
Fatal accidents locations in 2014
Fatal accidents locations in 2015
Fatal accidents locations in 2016
Fatal accidents locations in 2017
Fatal accidents locations in 2018
Fatal accidents locations in 2019
Fatal accidents locations in 2020
Fatal accidents locations in 2021
Alcohol use - People drinking some alcohol every month (%)
Alcohol use - People not drinking at all (%)
Alcohol use - Average days/month drinking alcohol
Alcohol use - Average drinks/week
Alcohol use - Average days/year people drink much
Audiometry - Average condition of hearing (%)
Audiometry - People that can hear a whisper from across a quiet room (%)
Audiometry - People that can hear normal voice from across a quiet room (%)
Audiometry - Ears ringing, roaring, buzzing (%)
Audiometry - Had a job exposure to loud noise (%)
Audiometry - Had off-work exposure to loud noise (%)
Blood Pressure & Cholesterol - Has high blood pressure (%)
Blood Pressure & Cholesterol - Checking blood pressure at home (%)
Blood Pressure & Cholesterol - Frequently checking blood cholesterol (%)
Blood Pressure & Cholesterol - Has high cholesterol level (%)
Consumer Behavior - Money monthly spent on food at supermarket/grocery store
Consumer Behavior - Money monthly spent on food at other stores
Consumer Behavior - Money monthly spent on eating out
Consumer Behavior - Money monthly spent on carryout/delivered foods
Consumer Behavior - Income spent on food at supermarket/grocery store (%)
Consumer Behavior - Income spent on food at other stores (%)
Consumer Behavior - Income spent on eating out (%)
Consumer Behavior - Income spent on carryout/delivered foods (%)
Current Health Status - General health condition (%)
Current Health Status - Blood donors (%)
Current Health Status - Has blood ever tested for HIV virus (%)
Current Health Status - Left-handed people (%)
Dermatology - People using sunscreen (%)
Diabetes - Diabetics (%)
Diabetes - Had a blood test for high blood sugar (%)
Diabetes - People taking insulin (%)
Diet Behavior & Nutrition - Diet health (%)
Diet Behavior & Nutrition - Milk product consumption (# of products/month)
Diet Behavior & Nutrition - Meals not home prepared (#/week)
Diet Behavior & Nutrition - Meals from fast food or pizza place (#/week)
Diet Behavior & Nutrition - Ready-to-eat foods (#/month)
Diet Behavior & Nutrition - Frozen meals/pizza (#/month)
Drug Use - People that ever used marijuana or hashish (%)
Drug Use - Ever used hard drugs (%)
Drug Use - Ever used any form of cocaine (%)
Drug Use - Ever used heroin (%)
Drug Use - Ever used methamphetamine (%)
Health Insurance - People covered by health insurance (%)
Kidney Conditions-Urology - Avg. # of times urinating at night
Medical Conditions - People with asthma (%)
Medical Conditions - People with anemia (%)
Medical Conditions - People with psoriasis (%)
Medical Conditions - People with overweight (%)
Medical Conditions - Elderly people having difficulties in thinking or remembering (%)
Medical Conditions - People who ever received blood transfusion (%)
Medical Conditions - People having trouble seeing even with glass/contacts (%)
Medical Conditions - People with arthritis (%)
Medical Conditions - People with gout (%)
Medical Conditions - People with congestive heart failure (%)
Medical Conditions - People with coronary heart disease (%)
Medical Conditions - People with angina pectoris (%)
Medical Conditions - People who ever had heart attack (%)
Medical Conditions - People who ever had stroke (%)
Medical Conditions - People with emphysema (%)
Medical Conditions - People with thyroid problem (%)
Medical Conditions - People with chronic bronchitis (%)
Medical Conditions - People with any liver condition (%)
Medical Conditions - People who ever had cancer or malignancy (%)
Mental Health - People who have little interest in doing things (%)
Mental Health - People feeling down, depressed, or hopeless (%)
Mental Health - People who have trouble sleeping or sleeping too much (%)
Mental Health - People feeling tired or having little energy (%)
Mental Health - People with poor appetite or overeating (%)
Mental Health - People feeling bad about themself (%)
Mental Health - People who have trouble concentrating on things (%)
Mental Health - People moving or speaking slowly or too fast (%)
Mental Health - People having thoughts they would be better off dead (%)
Oral Health - Average years since last visit a dentist
Oral Health - People embarrassed because of mouth (%)
Oral Health - People with gum disease (%)
Oral Health - General health of teeth and gums (%)
Oral Health - Average days a week using dental floss/device
Oral Health - Average days a week using mouthwash for dental problem
Oral Health - Average number of teeth
Pesticide Use - Households using pesticides to control insects (%)
Pesticide Use - Households using pesticides to kill weeds (%)
Physical Activity - People doing vigorous-intensity work activities (%)
Physical Activity - People doing moderate-intensity work activities (%)
Physical Activity - People walking or bicycling (%)
Physical Activity - People doing vigorous-intensity recreational activities (%)
Physical Activity - People doing moderate-intensity recreational activities (%)
Physical Activity - Average hours a day doing sedentary activities
Physical Activity - Average hours a day watching TV or videos
Physical Activity - Average hours a day using computer
Physical Functioning - People having limitations keeping them from working (%)
Physical Functioning - People limited in amount of work they can do (%)
Physical Functioning - People that need special equipment to walk (%)
Physical Functioning - People experiencing confusion/memory problems (%)
Physical Functioning - People requiring special healthcare equipment (%)
Prescription Medications - Average number of prescription medicines taking
Preventive Aspirin Use - Adults 40+ taking low-dose aspirin (%)
Reproductive Health - Vaginal deliveries (%)
Reproductive Health - Cesarean deliveries (%)
Reproductive Health - Deliveries resulted in a live birth (%)
Reproductive Health - Pregnancies resulted in a delivery (%)
Reproductive Health - Women breastfeeding newborns (%)
Reproductive Health - Women that had a hysterectomy (%)
Reproductive Health - Women that had both ovaries removed (%)
Reproductive Health - Women that have ever taken birth control pills (%)
Reproductive Health - Women taking birth control pills (%)
Reproductive Health - Women that have ever used Depo-Provera or injectables (%)
Reproductive Health - Women that have ever used female hormones (%)
Sexual Behavior - People 18+ that ever had sex (vaginal, anal, or oral) (%)
Sexual Behavior - Males 18+ that ever had vaginal sex with a woman (%)
Sexual Behavior - Males 18+ that ever performed oral sex on a woman (%)
Sexual Behavior - Males 18+ that ever had anal sex with a woman (%)
Sexual Behavior - Males 18+ that ever had any sex with a man (%)
Sexual Behavior - Females 18+ that ever had vaginal sex with a man (%)
Sexual Behavior - Females 18+ that ever performed oral sex on a man (%)
Sexual Behavior - Females 18+ that ever had anal sex with a man (%)
Sexual Behavior - Females 18+ that ever had any kind of sex with a woman (%)
Sexual Behavior - Average age people first had sex
Sexual Behavior - Average number of female sex partners in lifetime (males 18+)
Sexual Behavior - Average number of female vaginal sex partners in lifetime (males 18+)
Sexual Behavior - Average age people first performed oral sex on a woman (18+)
Sexual Behavior - Average number of woman performed oral sex on in lifetime (18+)
Sexual Behavior - Average number of male sex partners in lifetime (males 18+)
Sexual Behavior - Average number of male anal sex partners in lifetime (males 18+)
Sexual Behavior - Average age people first performed oral sex on a man (18+)
Sexual Behavior - Average number of male oral sex partners in lifetime (18+)
Sexual Behavior - People using protection when performing oral sex (%)
Sexual Behavior - Average number of times people have vaginal or anal sex a year
Sexual Behavior - People having sex without condom (%)
Sexual Behavior - Average number of male sex partners in lifetime (females 18+)
Sexual Behavior - Average number of male vaginal sex partners in lifetime (females 18+)
Sexual Behavior - Average number of female sex partners in lifetime (females 18+)
Sexual Behavior - Circumcised males 18+ (%)
Sleep Disorders - Average hours sleeping at night
Sleep Disorders - People that has trouble sleeping (%)
Smoking-Cigarette Use - People smoking cigarettes (%)
Taste & Smell - People 40+ having problems with smell (%)
Taste & Smell - People 40+ having problems with taste (%)
Taste & Smell - People 40+ that ever had wisdom teeth removed (%)
Taste & Smell - People 40+ that ever had tonsils teeth removed (%)
Taste & Smell - People 40+ that ever had a loss of consciousness because of a head injury (%)
Taste & Smell - People 40+ that ever had a broken nose or other serious injury to face or skull (%)
Taste & Smell - People 40+ that ever had two or more sinus infections (%)
Weight - Average height (inches)
Weight - Average weight (pounds)
Weight - Average BMI
Weight - People that are obese (%)
Weight - People that ever were obese (%)
Weight - People trying to lose weight (%)
19,000 38.3% Asian alone 16,031 32.3% White alone 10,139 20.5% Hispanic 2,873 5.8% Two or more races 1,480 3.0% Black alone 309 0.6% Other race alone 133 0.3% Native Hawaiian and Other 14 0.03% American Indian alone
According to our research of California and other state lists, there were 27 registered sex offenders living in Cypress, California as of April 27, 2024 . The ratio of all residents to sex offenders in Cypress is 1,837 to 1.The ratio of registered sex offenders to all residents in this city is much lower than the state average.
Officers per 1,000 residents here:
1.06California average:
2.30
Latest news from Cypress, CA collected exclusively by city-data.com from local newspapers, TV, and radio stations
Ancestries: American (5.9%), English (3.1%), European (2.9%), German (2.2%), Irish (1.7%), Lebanese (1.0%).
Current Local Time:
Land area: 6.61 square miles.
Population density: 7,447 people per square mile (high).
15,198 residents are foreign born (23.1% Asia , 4.8% Latin America ).
This city:
30.7%California:
26.5%
Median real estate property taxes paid for housing units with mortgages in 2022: $6,165 (0.7%)Median real estate property taxes paid for housing units with no mortgage in 2022: $3,730 (0.4%)
Nearest city with pop. 50,000+: Buena Park, CA
Nearest city with pop. 200,000+: Long Beach, CA
Nearest city with pop. 1,000,000+: Los Angeles, CA
Nearest cities:
Latitude: 33.82 N, Longitude: 118.04 W
Daytime population change due to commuting: +3,403 (+6.9%)Workers who live and work in this city: 6,103 (25.6%)
Single-family new house construction building permits:
2022: 7 buildings , average cost: $162,0002021: 8 buildings , average cost: $144,4002020: 2 buildings , average cost: $267,5002019: 190 buildings , average cost: $184,7002018: 173 buildings , average cost: $132,4002017: 128 buildings , average cost: $227,8002016: 133 buildings , average cost: $231,6002015: 6 buildings , average cost: $235,7002014: 41 buildings , average cost: $175,5002013: 16 buildings , average cost: $253,0002012: 43 buildings , average cost: $159,1002011: 10 buildings , average cost: $188,7002009: 45 buildings , average cost: $219,6002008: 2 buildings , average cost: $480,4002007: 22 buildings , average cost: $261,8002006: 4 buildings , average cost: $226,0002005: 98 buildings , average cost: $169,6002004: 33 buildings , average cost: $206,9002003: 127 buildings , average cost: $227,4002002: 27 buildings , average cost: $129,1002001: 48 buildings , average cost: $135,0002000: 34 buildings , average cost: $220,6001999: 43 buildings , average cost: $129,3001998: 16 buildings , average cost: $138,6001997: 19 buildings , average cost: $169,300Unemployment in December 2023:
Population change in the 1990s: +3,450 (+8.1%).
Most common occupations in Cypress, CA (%)
Both Males Females
Other management occupations, except farmers and farm managers (6.2%)
Other office and administrative support workers, including supervisors (4.9%)
Other sales and related occupations, including supervisors (4.7%)
Preschool, kindergarten, elementary, and middle school teachers (3.7%)
Computer specialists (3.5%)
Secretaries and administrative assistants (3.2%)
Electrical equipment mechanics and other installation, maintenance, and repair workers, including supervisors (3.0%)
Other management occupations, except farmers and farm managers (7.9%)
Electrical equipment mechanics and other installation, maintenance, and repair workers, including supervisors (5.6%)
Other sales and related occupations, including supervisors (4.5%)
Computer specialists (4.4%)
Engineers (4.1%)
Other production occupations, including supervisors (4.0%)
Sales representatives, services, wholesale and manufacturing (3.7%)
Other office and administrative support workers, including supervisors (7.2%)
Secretaries and administrative assistants (6.8%)
Preschool, kindergarten, elementary, and middle school teachers (6.2%)
Other sales and related occupations, including supervisors (4.8%)
Other management occupations, except farmers and farm managers (4.2%)
Information and record clerks, except customer service representatives (4.1%)
Registered nurses (3.9%)
Earthquake activity:
Cypress-area historical earthquake activity is significantly above California state average. It is 6850% greater than the overall U.S. average. On 7/21/1952 at 11:52:14, a magnitude 7.7 (7.7 UK, Class: Major, Intensity: VIII - XII) earthquake occurred 98.4 miles away from Cypress center, causing $50,000,000 total damage On 6/28/1992 at 11:57:34, a magnitude 7.6 (6.2 MB, 7.6 MS, 7.3 MW, Depth: 0.7 mi) earthquake occurred 90.0 miles away from Cypress center, causing 3 deaths ( 1 shaking deaths, 2 other deaths) and 400 injuries, causing $100,000,000 total damage and $40,000,000 insured lossesOn 10/16/1999 at 09:46:44, a magnitude 7.4 (6.3 MB, 7.4 MS, 7.2 MW, 7.3 ML) earthquake occurred 103.7 miles away from Cypress center On 11/4/1927 at 13:51:53, a magnitude 7.5 (7.5 UK) earthquake occurred 186.9 miles away from the city center On 4/21/1918 at 22:32:30, a magnitude 6.8 (6.8 UK, Class: Strong, Intensity: VII - IX) earthquake occurred 34.4 miles away from the city center On 1/17/1994 at 12:30:55, a magnitude 6.8 (6.4 MB, 6.8 MS, 6.7 MW, Depth: 11.4 mi) earthquake occurred 38.6 miles away from Cypress center, causing 60 deaths ( 60 shaking deaths) and 7000 injuriesMagnitude types: body-wave magnitude (MB), local magnitude (ML), surface-wave magnitude (MS), moment magnitude (MW) Natural disasters: The number of natural disasters in Orange County (32) is a lot greater than the US average (15).Major Disasters (Presidential) Declared: 22Emergencies Declared: 2Floods: 15, Fires: 13, Storms: 9, Landslides: 6, Winter Storms: 6, Mudslides: 5, Earthquakes: 2, Heavy Rain: 1, Hurricane: 1, Snow: 1, Tornado: 1, Wind: 1, Other: 1 (Note: some incidents may be assigned to more than one category). Main business address for: PACIFICARE HEALTH SYSTEMS INC /DE/ HOSPITAL & MEDICAL SERVICE PLANS ), YAMAHA MOTOR RECEIVABLES CORP ASSET-BACKED SECURITIES ), UNIVERSAL ELECTRONICS INC HOUSEHOLD AUDIO & VIDEO EQUIPMENT ).
Hospitals and medical centers in Cypress: DE LEON HOME - CYPRESS (5031 CITATION) JENYMEL'S HOME (6321 ROSEMARY DRIVE) LIFE CARE SOLUTIONS (6360 GATE WAY DRIVE)
ST LUKE'S HOME HEALTH SERVICES, INC (5721 LINCOLN AVE, UNIT P)
Amtrak stations near Cypress: 8 miles: FULLERTON (120 E. SANTA FE AVE.) Services: ticket office, fully wheelchair accessible, enclosed waiting area, public restrooms, public payphones, full-service food facilities, free short-term parking, paid long-term parking, taxi stand, public transit connection.
9 miles: ANAHEIM (2150 KATELLA AVE.) Services: ticket office, fully wheelchair accessible, enclosed waiting area, public restrooms, public payphones, vending machines, free short-term parking, free long-term parking, call for car rental service, call for taxi service.
10 miles: LONG BEACH (601 N. LONG BEACH BLVD.) - Bus Station Services: fully wheelchair accessible, public restrooms, public payphones, full-service food facilities, paid short-term parking, paid long-term parking, call for taxi service, public transit connection.
Colleges/Universities in Cypress: Cypress College Full-time enrollment: 8,732; Location: 9200 Valley View; Public; Website: www.cypresscollege.edu)
Trident University International Full-time enrollment: 5,974; Location: 5757 Plaza Drive, Suite 100; Private, for-profit; Website: www.trident.edu/; Offers Doctor's degree )
Other colleges/universities with over 2000 students near Cypress:
California State University-Long Beach (about 5 miles; Long Beach, CA ; Full-time enrollment: 28,287)
Long Beach City College (about 6 miles; Long Beach, CA ; FT enrollment: 15,602)
Cerritos College (about 6 miles; Norwalk, CA ; FT enrollment: 13,090)
Biola University (about 7 miles; La Mirada, CA ; FT enrollment: 5,325)
Golden West College (about 7 miles; Huntington Beach, CA ; FT enrollment: 7,358)
West Coast University-Orange County (about 8 miles; Anaheim, CA ; FT enrollment: 2,464)
Fullerton College (about 9 miles; Fullerton, CA ; FT enrollment: 11,124)
Public high schools in Cypress: CYPRESS HIGH Students: 1,713, Location: 9801 VALLEY VIEW ST., Grades: 9-12)OXFORD ACADEMY Students: 945, Location: 5172 ORANGE AVE., Grades: 7-12)Private high schools in Cypress: ALTON SCHOOL Students: 36, Location: 5400 MYRA AVE, Grades: 8-12)DEL SOL SCHOOL Students: 36, Location: 5340 MYRA AVE, Grades: UG-12)WISDOM MISSION SCHOOL Students: 16, Location: 4545 MYRA AVE, Grades: 7-12)
Public elementary/middle schools in Cypress: LEXINGTON JUNIOR HIGH Students: 1,052, Location: 4351 ORANGE AVE., Grades: 7-8)MARGARET LANDELL ELEMENTARY Students: 400, Location: 9739 DENNI ST., Grades: KG-6)A. E. ARNOLD ELEMENTARY Students: 385, Location: 9281 DENNI ST., Grades: KG-6)JULIET MORRIS ELEMENTARY Students: 379, Location: 9952 GRAHAM ST., Grades: KG-6)CLARA J. KING ELEMENTARY Students: 303, Location: 8710 MOODY ST., Grades: KG-6)FRANK VESSELS ELEMENTARY Students: 279, Location: 5900 CATHY AVE, Grades: KG-6)Private elementary/middle schools in Cypress: GRACE CHRISTIAN SCHOOL Students: 398, Location: 5100 CERRITOS AVE BLDG A, Grades: PK-8)
ST IRENAEUS PARISH SCHOOL Students: 329, Location: 9201 GRINDLAY ST, Grades: KG-8)
CALVARY CHAPEL CHRISTIAN SCHOOL OF CYPRESS Students: 172, Location: 5202 LINCOLN AVE, Grades: PK-6)
CYPRESS MONTESSORI ACADEMY Students: 35, Location: 8622 LA SALLE ST, Grades: KG-T1)
See full list of schools located in Cypress
Notable locations in Cypress: (A) , Los Alamitos Racetrack (B) , Cypress City Hall (C) , Cypress Branch Orange County Public Library (D) , Orange County Fire Authority Station 17 (E) . Display/hide their locations on the map
Shopping Centers: (1) , Cypress Square Shopping Center (2) , Cypress Plaza East Shopping Center (3) . Display/hide their locations on the map
Main business address in Cypress include: (A) , YAMAHA MOTOR RECEIVABLES CORP (B) , UNIVERSAL ELECTRONICS INC (C) . Display/hide their locations on the map
Churches in Cypress include: (A) , Holy Cross Lutheran Church (B) , Korean Rejoice Baptist Church of Cypress (C) , Saint Irenaeus Catholic Church (D) . Display/hide their locations on the map
Cemetery: (1) . Display/hide its location on the map
Parks in Cypress include: (1) , Cedar Glen Park (2) , Darrell Essex Park (3) , Eucalyptus Park (4) , Leylandi Park (5) , Oak Knoll Park (6) , Peppertree Park (7) , Pinewood Park (8) , Veterans Park (9) . Display/hide their locations on the map
Birthplace of: John Stamos - Film actor, Tiger Woods - (born 1975), golfer, Marko Cavka - 2005 NFL player (New York Jets, born : Apr 4, 1981), Amy Fruhwirth - Professional golfer, Dominique Ricks - College basketball player (Long Beach State 49ers).
Orange County has a predicted average indoor radon screening level less than 2 pCi/L (pico curies per liter) - Low Potential Average household size: This city:
3.0 peopleCalifornia:
2.9 people
Percentage of family households: This city:
80.7%Whole state:
68.7%
Percentage of households with unmarried partners: This city:
3.8%Whole state:
7.2%
Likely homosexual households (counted as self-reported same-sex unmarried-partner households)
Lesbian couples: 0.4% of all households Gay men: 0.1% of all households
People in group quarters in Cypress in 2010:
420 people in workers' group living quarters and job corps centers
64 people in group homes intended for adults
14 people in residential treatment centers for adults
4 people in other noninstitutional facilities
People in group quarters in Cypress in 2000:
189 people in other group homes
41 people in other nonhousehold living situations
35 people in homes for the mentally retarded
21 people in homes or halfway houses for drug/alcohol abuse
20 people in other noninstitutional group quarters
10 people in religious group quarters
5 people in nursing homes
Banks with branches in Cypress (2011 data):
Bank of America, National Association: Cypress Branch at 9801 Walker Street, branch established on 1968/06/06. Info updated 2009/11/18: Bank assets: $1,451,969.3 mil, Deposits: $1,077,176.8 mil, headquarters in Charlotte, NC, positive income , 5782 total offices , Holding Company: Bank Of America Corporation
Citibank, National Association: 10081 Valley View St Branch at 10081 Valley View St, branch established on 1927/01/01. Info updated 2012/01/10: Bank assets: $1,288,658.0 mil, Deposits: $882,541.0 mil, headquarters in Sioux Falls, SD, positive income , International Specialization, 1048 total offices , Holding Company: Citigroup Inc.
Union Bank, National Association: Cypress Branch at 4125 Ball Road, branch established on 1996/09/01. Info updated 2011/09/01: Bank assets: $88,967.5 mil, Deposits: $65,286.4 mil, headquarters in San Francisco, CA, positive income , Commercial Lending Specialization, 403 total offices , Holding Company: Mitsubishi Ufj Financial Group, Inc.
Comerica Bank: Cypress Branch at 6812 Katella Avenue, branch established on 2005/12/21. Info updated 2011/07/29: Bank assets: $60,970.5 mil, Deposits: $48,300.9 mil, headquarters in Dallas, TX, positive income , Commercial Lending Specialization, 497 total offices , Holding Company: Comerica Incorporated
For population 15 years and over in Cypress:
Never married: 31.3%Now married: 55.0%Separated: 1.1%Widowed: 4.8%Divorced: 7.8% For population 25 years and over in Cypress:
High school or higher: 90.6%Bachelor's degree or higher: 48.5%Graduate or professional degree: 17.3%Unemployed: 3.2%Mean travel time to work (commute): 24.6 minutes
Education Gini index (Inequality in education) Here:
13.3California average:
15.5
Religion statistics for Cypress, CA (based on Orange County data)
Religion Adherents Congregations Catholic 797,473 67 Evangelical Protestant 345,893 894 Other 141,815 329 Mainline Protestant 76,574 202 Orthodox 13,406 19 Black Protestant 2,424 8 None 1,632,647 -
Source: Clifford Grammich, Kirk Hadaway, Richard Houseal, Dale E.Jones, Alexei Krindatch, Richie Stanley and Richard H.Taylor. 2012. 2010 U.S.Religion Census: Religious Congregations & Membership Study. Association of Statisticians of American Religious Bodies. Jones, Dale E., et al. 2002. Congregations and Membership in the United States 2000. Nashville, TN: Glenmary Research Center. Graphs represent county-level data
Food Environment Statistics: Number of grocery stores : 530Orange County :
1.78 / 10,000 pop.California :
2.14 / 10,000 pop.
Number of supercenters and club stores : 18This county :
0.06 / 10,000 pop.State :
0.04 / 10,000 pop.
Number of convenience stores (no gas) : 147This county :
0.49 / 10,000 pop.California :
0.62 / 10,000 pop.
Number of convenience stores (with gas) : 434Here :
1.46 / 10,000 pop.State :
1.49 / 10,000 pop.
Number of full-service restaurants : 2,438Orange County :
8.19 / 10,000 pop.California :
7.42 / 10,000 pop.
Adult diabetes rate : Orange County :
6.3%California :
7.3%
Adult obesity rate : Orange County :
18.5%California :
21.3%
Low-income preschool obesity rate : Orange County :
16.4%State :
17.9%
Health and Nutrition:
Average overall health of teeth and gums : Here:
49.9%California:
48.0%
People feeling badly about themselves : This city:
19.6%California:
20.2%
People not drinking alcohol at all : Here:
13.1%California:
11.2%
Average hours sleeping at night : Cypress:
6.8California:
6.8
General health condition : Average condition of hearing : This city:
80.8%California:
80.9%
More about Health and Nutrition of Cypress, CA Residents
Local government employment and payroll (March 2022)
Function
Full-time employees
Monthly full-time payroll
Average yearly full-time wage
Part-time employees
Monthly part-time payroll
Police Protection - Officers
50 $473,831 $113,719 0 $0 Police - Other
17 $155,810 $109,984 6 $7,441 Streets and Highways
14 $95,822 $82,133 6 $11,558 Parks and Recreation
13 $91,589 $84,544 45 $35,310 Financial Administration
13 $126,526 $116,793 0 $0 Other Government Administration
11 $81,638 $89,060 0 $0 Other and Unallocable
10 $96,072 $115,286 0 $0 Solid Waste Management
2 $12,034 $72,204 0 $0 Sewerage
1 $5,203 $62,436 0 $0
Totals for Government
131 $1,138,526 $104,292 57 $54,309
Cypress government finances - Expenditure in 2017 (per resident):
Construction - Regular Highways: $6,695,000 ($135.96)
Housing and Community Development: $3,684,000 ($74.81)Sewerage: $982,000 ($19.94)Central Staff Services: $504,000 ($10.23)Current Operations - Police Protection: $15,503,000 ($314.83)
Parks and Recreation: $6,400,000 ($129.97)Central Staff Services: $4,886,000 ($99.22)Regular Highways: $3,731,000 ($75.77)Protective Inspection and Regulation - Other: $1,703,000 ($34.58)Financial Administration: $1,230,000 ($24.98)Health - Other: $585,000 ($11.88)Sewerage: $310,000 ($6.30)Solid Waste Management: $185,000 ($3.76)Housing and Community Development: $181,000 ($3.68)Libraries: $19,000 ($0.39)General - Other: $5,000 ($0.10)General - Interest on Debt: $60,000 ($1.22)
Intergovernmental to Local - Other - Parks and Recreation: $206,000 ($4.18)
Other Capital Outlay - Police Protection: $105,000 ($2.13)
Total Salaries and Wages: $1,189,000 ($24.15)
Cypress government finances - Revenue in 2017 (per resident):
Charges - Other: $2,887,000 ($58.63)
Sewerage: $1,740,000 ($35.33)Parks and Recreation: $1,502,000 ($30.50)Regular Highways: $1,089,000 ($22.11)Federal Intergovernmental - Other: $922,000 ($18.72)
Housing and Community Development: $114,000 ($2.32)Local Intergovernmental - Other: $1,191,000 ($24.19)
Miscellaneous - General Revenue - Other: $973,000 ($19.76)
Interest Earnings: $902,000 ($18.32)Fines and Forfeits: $308,000 ($6.25)Rents: $98,000 ($1.99)State Intergovernmental - Highways: $989,000 ($20.08)
Other: $644,000 ($13.08)General Local Government Support: $28,000 ($0.57)Tax - Property: $13,679,000 ($277.79)
General Sales and Gross Receipts: $11,451,000 ($232.54)Other Selective Sales: $2,711,000 ($55.05)Public Utilities Sales: $1,666,000 ($33.83)Occupation and Business License - Other: $1,079,000 ($21.91)Other License: $770,000 ($15.64)Other: $501,000 ($10.17)Documentary and Stock Transfer: $337,000 ($6.84)
Cypress government finances - Debt in 2017 (per resident):
Long Term Debt - Beginning Outstanding - Unspecified Public Purpose: $1,340,000 ($27.21)
Outstanding Unspecified Public Purpose: $920,000 ($18.68)Outstanding Nonguaranteed - Industrial Revenue: $905,000 ($18.38)Beginning Outstanding - Public Debt for Private Purpose: $905,000 ($18.38)Retired Unspecified Public Purpose: $420,000 ($8.53)
Cypress government finances - Cash and Securities in 2017 (per resident):
Bond Funds - Cash and Securities: $66,644,000 ($1353.37)
Other Funds - Cash and Securities: $48,917,000 ($993.38)
Sinking Funds - Cash and Securities: $1,818,000 ($36.92)
4.86% of this county's 2021 resident taxpayers lived in other counties in 2020 ($95,983 average adjusted gross income )
Here:
4.86%California average:
5.19%
0.01% of residents moved from foreign countries ($132 average AGI )Orange County:
0.01%California average:
0.03%
Top counties from which taxpayers relocated into this county between 2020 and 2021:
5.71% of this county's 2020 resident taxpayers moved to other counties in 2021 ($106,828 average adjusted gross income )
Here:
5.71%California average:
6.14%
0.01% of residents moved to foreign countries ($180 average AGI )Orange County:
0.01%California average:
0.02%
Top counties to which taxpayers relocated from this county between 2020 and 2021:
Businesses in Cypress, CA
Name Count Name Count
7-Eleven 1 Kroger 1 AutoZone 1 Marriott 1 Baja Fresh Mexican Grill 1 McDonald's 1 Baskin-Robbins 2 New Balance 1 Big O Tires 1 Nike 2 Blockbuster 1 OfficeMax 1 CVS 1 Olive Garden 1 Carl\s Jr. 2 Panda Express 1 Costco 1 Payless 1 Curves 1 Pizza Hut 2 Dairy Queen 1 Quiznos 1 Domino's Pizza 1 RadioShack 2 El Pollo Loco 1 Red Robin 1 FedEx 8 Rite Aid 1 GNC 1 Sprint Nextel 1 GameStop 1 Staples 1 H&R Block 2 Starbucks 2 Hilton 1 T-Mobile 4 Home Depot 1 Taco Bell 2 Homestead Studio Suites 1 Target 1 Hyatt 1 U-Haul 1 IHOP 1 UPS 4 Jack In The Box 1 Vans 1 Jamba Juice 1 Verizon Wireless 1 KFC 1 Walgreens 1 Kohl's 1 Wendy's 1
Strongest AM radio stations in Cypress:
KFI (640 AM; 50 kW; LOS ANGELES, CA; Owner: CAPSTAR TX LIMITED PARTNERSHIP)
KTNQ (1020 AM; 50 kW; LOS ANGELES, CA; Owner: KTNQ-AM LICENSE CORP.)
KLAC (570 AM; 50 kW; LOS ANGELES, CA; Owner: AMFM RADIO LICENSES, L.L.C.)
KXTA (1150 AM; 50 kW; LOS ANGELES, CA; Owner: CITICASTERS LICENSES, L.P.)
KNX (1070 AM; 50 kW; LOS ANGELES, CA; Owner: INFINITY BROADCASTING OPERATIONS, INC.)
KFWB (980 AM; 50 kW; LOS ANGELES, CA; Owner: INFINITY BROADCASTING OPERATIONS, INC.)
KDIS (1110 AM; 50 kW; PASADENA, CA; Owner: ABC,INC.)
KPLS (830 AM; 50 kW; ORANGE, CA; Owner: CRN LICENSES, LLC)
KMPC (1540 AM; 50 kW; LOS ANGELES, CA; Owner: ROSE CITY RADIO CORPORATION)
KBLA (1580 AM; 50 kW; SANTA MONICA, CA)
KSPN (710 AM; 50 kW; LOS ANGELES, CA; Owner: KABC-AM RADIO, INC.)
KXMX (1190 AM; 25 kW; ANAHEIM, CA; Owner: NEW INSPIRATION BROADCASTING COMPANY)
KVNR (1480 AM; 5 kW; SANTA ANA, CA; Owner: LBI RADIO LICENSE CORP.)
Strongest FM radio stations in Cypress:
KLAX-FM (97.9 FM; EAST LOS ANGELES, CA; Owner: KLAX LICENSING, INC.)
KZLA-FM (93.9 FM; LOS ANGELES, CA; Owner: EMMIS RADIO LICENSE CORPORATION)
KPWR (105.9 FM; LOS ANGELES, CA; Owner: EMMIS RADIO LICENSE CORPORATION)
KLSX (97.1 FM; LOS ANGELES, CA; Owner: INFINITY BROADCASTING OPERATIONS, INC.)
KCBS-FM (93.1 FM; LOS ANGELES, CA; Owner: INFINITY BROADCASTING OPERATIONS, INC.)
KUSC (91.5 FM; LOS ANGELES, CA; Owner: UNIVERSITY OF SOUTHERN CALIFORNIA)
KKLA-FM (99.5 FM; LOS ANGELES, CA; Owner: NEW INSPIRATION BROADCASTING CO., INC.)
KSCA (101.9 FM; GLENDALE, CA; Owner: HBC LICENSE CORPORATION)
KLOS (95.5 FM; LOS ANGELES, CA; Owner: KLOS-FM RADIO, INC.)
K212FA (90.3 FM; TEMPLE CITY, CA; Owner: EDUCATIONAL MEDIA FOUNDATION)
KOST (103.5 FM; LOS ANGELES, CA; Owner: CAPSTAR TX LIMITED PARTNERSHIP)
KRTH-FM (101.1 FM; LOS ANGELES, CA; Owner: INFINITY BROADCASTING OPERATIONS, INC.)
KIIS-FM (102.7 FM; LOS ANGELES, CA; Owner: CITICASTERS LICENSES, L.P.)
KLVE (107.5 FM; LOS ANGELES, CA; Owner: KLVE-FM LICENSE CORP.)
KPCC (89.3 FM; PASADENA, CA; Owner: PASADENA AREA COMMUNITY COLLEGE DISTRICT)
KHHT (92.3 FM; LOS ANGELES, CA; Owner: AMFM RADIO LICENSES, L.L.C.)
KKBT (100.3 FM; LOS ANGELES, CA; Owner: RADIO ONE LICENSES, LLC)
KBIG-FM (104.3 FM; LOS ANGELES, CA; Owner: AMFM RADIO LICENSES, L.L.C.)
KMZT-FM (105.1 FM; LOS ANGELES, CA; Owner: MOUNT WILSON FM BROADCASTERS, INC.)
KTWV (94.7 FM; LOS ANGELES, CA; Owner: INFINITY BROADCASTING OPERATIONS, INC.)
TV broadcast stations around Cypress:
KTRO-LP (Channel 50; LANCASTER, CA; Owner: ROBERT D. ADELMAN)
KCBS-TV (Channel 2; LOS ANGELES, CA; Owner: CBS BROADCASTING INC.)
KTLA-TV (Channel 5; LOS ANGELES, CA; Owner: KTLA INC.)
KABC-TV (Channel 7; LOS ANGELES, CA; Owner: ABC HOLDING COMPANY, INC.)
KCAL-TV (Channel 9; LOS ANGELES, CA; Owner: VIACOM TELEVISION STATIONS GROUP OF LOS ANGELES LLC)
KNBC (Channel 4; LOS ANGELES, CA; Owner: NBC SUBSIDIARY (KNBC-TV), INC.)
National Bridge Inventory (NBI) Statistics 11 Number of bridges89ft / 27.4m Total length133,745 Total average daily traffic1,335 Total average daily truck traffic293,865 Total future (year 2040) average daily traffic
New bridges - historical statistics
8 1950-1959 1 1970-1979 1 1980-1989 1 1990-1999
See full National Bridge Inventory statistics for Cypress, CA
Home Mortgage Disclosure Act Aggregated Statistics For Year 2009(Based on 8 full and 5 partial tracts) A) FHA, FSA/RHS & VA B) Conventional C) Refinancings D) Home Improvement Loans F) Non-occupant Loans on G) Loans On Manufactured Number Average Value Number Average Value Number Average Value Number Average Value Number Average Value Number Average Value
LOANS ORIGINATED 89 $405,711 240 $332,960 1,197 $304,483 62 $226,738 54 $244,606 2 $193,795 APPLICATIONS APPROVED, NOT ACCEPTED 2 $472,120 23 $303,730 145 $327,602 11 $79,646 6 $284,363 3 $151,593 APPLICATIONS DENIED 8 $446,051 33 $317,265 323 $340,929 15 $127,500 34 $267,380 8 $47,234 APPLICATIONS WITHDRAWN 8 $408,851 38 $365,852 213 $317,052 12 $236,955 14 $317,989 0 $0 FILES CLOSED FOR INCOMPLETENESS 1 $441,030 5 $359,698 72 $361,192 2 $245,365 5 $271,886 0 $0
Aggregated Statistics For Year 2008(Based on 8 full and 5 partial tracts) A) FHA, FSA/RHS & VA B) Conventional C) Refinancings D) Home Improvement Loans E) Loans on Dwellings For 5+ Families F) Non-occupant Loans on G) Loans On Manufactured Number Average Value Number Average Value Number Average Value Number Average Value Number Average Value Number Average Value Number Average Value
LOANS ORIGINATED 26 $407,283 249 $330,178 504 $303,244 61 $127,810 4 $11,742,945 42 $284,554 7 $67,036 APPLICATIONS APPROVED, NOT ACCEPTED 7 $424,383 38 $361,966 123 $305,023 10 $81,936 0 $0 8 $316,511 11 $78,271 APPLICATIONS DENIED 7 $405,887 50 $336,690 289 $353,910 45 $81,126 0 $0 19 $356,856 20 $77,451 APPLICATIONS WITHDRAWN 5 $402,134 42 $345,179 132 $361,075 8 $139,138 2 $7,000,000 10 $282,916 0 $0 FILES CLOSED FOR INCOMPLETENESS 1 $483,970 8 $313,256 37 $368,734 8 $175,356 0 $0 4 $346,000 0 $0
Aggregated Statistics For Year 2007(Based on 8 full and 5 partial tracts) A) FHA, FSA/RHS & VA B) Conventional C) Refinancings D) Home Improvement Loans E) Loans on Dwellings For 5+ Families F) Non-occupant Loans on G) Loans On Manufactured Number Average Value Number Average Value Number Average Value Number Average Value Number Average Value Number Average Value Number Average Value
LOANS ORIGINATED 0 $0 448 $332,131 871 $338,687 136 $191,088 9 $3,203,913 81 $340,718 13 $77,840 APPLICATIONS APPROVED, NOT ACCEPTED 0 $0 98 $315,314 208 $327,267 35 $195,939 0 $0 16 $322,594 15 $84,360 APPLICATIONS DENIED 0 $0 125 $340,929 460 $382,822 65 $181,006 0 $0 37 $345,510 19 $91,032 APPLICATIONS WITHDRAWN 1 $204,960 56 $376,593 175 $342,821 16 $156,134 0 $0 17 $375,385 0 $0 FILES CLOSED FOR INCOMPLETENESS 0 $0 24 $380,940 58 $372,332 9 $287,886 0 $0 7 $313,429 0 $0
Aggregated Statistics For Year 2006(Based on 8 full and 5 partial tracts) A) FHA, FSA/RHS & VA B) Conventional C) Refinancings D) Home Improvement Loans E) Loans on Dwellings For 5+ Families F) Non-occupant Loans on G) Loans On Manufactured Number Average Value Number Average Value Number Average Value Number Average Value Number Average Value Number Average Value Number Average Value
LOANS ORIGINATED 1 $361,000 678 $346,109 1,133 $329,490 197 $191,596 3 $3,001,607 106 $348,055 11 $90,009 APPLICATIONS APPROVED, NOT ACCEPTED 0 $0 113 $316,087 190 $345,547 28 $155,872 0 $0 18 $331,582 8 $88,740 APPLICATIONS DENIED 0 $0 205 $327,470 410 $371,479 72 $202,634 0 $0 38 $328,723 17 $82,031 APPLICATIONS WITHDRAWN 0 $0 93 $371,698 329 $352,679 31 $256,547 0 $0 20 $413,727 1 $24,170 FILES CLOSED FOR INCOMPLETENESS 0 $0 25 $307,985 63 $380,468 11 $312,637 0 $0 3 $276,013 0 $0
Aggregated Statistics For Year 2005(Based on 8 full and 5 partial tracts) B) Conventional C) Refinancings D) Home Improvement Loans E) Loans on Dwellings For 5+ Families F) Non-occupant Loans on G) Loans On Manufactured Number Average Value Number Average Value Number Average Value Number Average Value Number Average Value Number Average Value
LOANS ORIGINATED 705 $351,642 1,505 $316,719 224 $184,861 3 $3,560,407 142 $298,124 19 $94,366 APPLICATIONS APPROVED, NOT ACCEPTED 135 $313,367 239 $334,821 26 $198,992 0 $0 22 $274,538 14 $89,899 APPLICATIONS DENIED 195 $308,996 456 $339,540 65 $169,158 0 $0 34 $330,690 48 $95,995 APPLICATIONS WITHDRAWN 114 $342,814 477 $338,464 59 $219,318 0 $0 24 $327,153 4 $98,630 FILES CLOSED FOR INCOMPLETENESS 38 $332,676 130 $364,547 8 $191,836 0 $0 5 $198,470 0 $0
Aggregated Statistics For Year 2004(Based on 8 full and 5 partial tracts) A) FHA, FSA/RHS & VA B) Conventional C) Refinancings D) Home Improvement Loans E) Loans on Dwellings For 5+ Families F) Non-occupant Loans on G) Loans On Manufactured Number Average Value Number Average Value Number Average Value Number Average Value Number Average Value Number Average Value Number Average Value
LOANS ORIGINATED 5 $262,544 802 $315,376 1,908 $265,591 216 $171,049 7 $4,154,919 164 $261,447 20 $87,442 APPLICATIONS APPROVED, NOT ACCEPTED 0 $0 141 $264,001 294 $278,187 38 $181,866 0 $0 26 $263,777 31 $89,071 APPLICATIONS DENIED 0 $0 183 $316,067 451 $289,411 95 $121,923 0 $0 32 $304,526 27 $93,437 APPLICATIONS WITHDRAWN 1 $274,430 106 $309,458 525 $271,527 45 $150,872 1 $2,875,000 20 $265,875 0 $0 FILES CLOSED FOR INCOMPLETENESS 0 $0 46 $342,890 127 $272,947 7 $147,969 0 $0 6 $323,377 0 $0
Aggregated Statistics For Year 2003(Based on 8 full and 5 partial tracts) A) FHA, FSA/RHS & VA B) Conventional C) Refinancings D) Home Improvement Loans E) Loans on Dwellings For 5+ Families F) Non-occupant Loans on Number Average Value Number Average Value Number Average Value Number Average Value Number Average Value Number Average Value
LOANS ORIGINATED 9 $249,612 918 $248,230 4,215 $220,775 108 $86,117 2 $541,145 200 $211,648 APPLICATIONS APPROVED, NOT ACCEPTED 1 $225,000 107 $212,419 525 $218,798 34 $57,774 0 $0 31 $214,137 APPLICATIONS DENIED 1 $255,770 150 $225,718 616 $226,310 50 $55,004 1 $2,300,000 30 $215,591 APPLICATIONS WITHDRAWN 2 $251,690 77 $251,637 590 $223,690 14 $65,336 0 $0 27 $184,527 FILES CLOSED FOR INCOMPLETENESS 0 $0 25 $276,891 148 $234,986 9 $67,014 0 $0 7 $172,714
Aggregated Statistics For Year 2002(Based on 6 full and 5 partial tracts) A) FHA, FSA/RHS & VA B) Conventional C) Refinancings D) Home Improvement Loans E) Loans on Dwellings For 5+ Families F) Non-occupant Loans on Number Average Value Number Average Value Number Average Value Number Average Value Number Average Value Number Average Value
LOANS ORIGINATED 30 $202,961 646 $206,403 2,276 $195,469 66 $56,173 6 $2,169,348 131 $178,675 APPLICATIONS APPROVED, NOT ACCEPTED 7 $170,921 69 $214,255 323 $199,645 15 $37,591 0 $0 18 $197,119 APPLICATIONS DENIED 3 $245,853 87 $218,760 377 $185,152 44 $34,723 1 $256,540 22 $179,583 APPLICATIONS WITHDRAWN 2 $223,190 64 $225,424 365 $195,921 21 $77,346 0 $0 16 $191,574 FILES CLOSED FOR INCOMPLETENESS 2 $206,440 19 $228,302 165 $204,478 0 $0 0 $0 8 $166,220
Aggregated Statistics For Year 2001(Based on 6 full and 5 partial tracts) A) FHA, FSA/RHS & VA B) Conventional C) Refinancings D) Home Improvement Loans E) Loans on Dwellings For 5+ Families F) Non-occupant Loans on Number Average Value Number Average Value Number Average Value Number Average Value Number Average Value Number Average Value
LOANS ORIGINATED 98 $195,034 516 $186,535 1,720 $176,494 85 $40,135 2 $2,038,870 94 $175,030 APPLICATIONS APPROVED, NOT ACCEPTED 5 $201,630 55 $164,398 220 $161,544 15 $80,789 0 $0 14 $153,953 APPLICATIONS DENIED 7 $222,316 86 $154,004 424 $164,892 47 $34,421 0 $0 23 $185,547 APPLICATIONS WITHDRAWN 9 $208,068 43 $168,017 328 $177,954 18 $56,245 0 $0 12 $180,688 FILES CLOSED FOR INCOMPLETENESS 0 $0 18 $235,050 94 $192,842 0 $0 1 $4,000,000 5 $228,570
Aggregated Statistics For Year 2000(Based on 6 full and 5 partial tracts) A) FHA, FSA/RHS & VA B) Conventional C) Refinancings D) Home Improvement Loans E) Loans on Dwellings For 5+ Families F) Non-occupant Loans on Number Average Value Number Average Value Number Average Value Number Average Value Number Average Value Number Average Value
LOANS ORIGINATED 74 $182,563 576 $169,075 405 $130,001 90 $39,490 4 $427,552 39 $157,143 APPLICATIONS APPROVED, NOT ACCEPTED 13 $154,227 68 $153,750 73 $130,983 35 $37,160 0 $0 2 $110,610 APPLICATIONS DENIED 6 $186,705 93 $173,806 203 $121,985 49 $31,594 1 $1,844,090 13 $104,027 APPLICATIONS WITHDRAWN 8 $167,992 66 $143,776 113 $125,504 20 $27,279 0 $0 6 $80,060 FILES CLOSED FOR INCOMPLETENESS 3 $199,693 24 $159,180 46 $187,449 1 $16,300 2 $1,297,500 2 $109,430
Aggregated Statistics For Year 1999(Based on 6 full and 7 partial tracts) A) FHA, FSA/RHS & VA B) Conventional C) Refinancings D) Home Improvement Loans E) Loans on Dwellings For 5+ Families F) Non-occupant Loans on Number Average Value Number Average Value Number Average Value Number Average Value Number Average Value Number Average Value
LOANS ORIGINATED 112 $163,312 545 $178,033 1,006 $156,951 90 $31,442 5 $2,260,968 85 $136,119 APPLICATIONS APPROVED, NOT ACCEPTED 5 $180,880 66 $152,978 188 $165,153 38 $36,750 0 $0 23 $140,961 APPLICATIONS DENIED 12 $154,330 122 $122,866 335 $131,203 48 $29,268 0 $0 20 $103,460 APPLICATIONS WITHDRAWN 10 $147,930 78 $155,526 220 $148,049 19 $36,024 1 $3,435,780 9 $122,331 FILES CLOSED FOR INCOMPLETENESS 2 $159,025 15 $149,724 92 $152,443 7 $45,596 2 $1,961,160 3 $90,007
Detailed mortgage data for all 13 tracts in Cypress, CA
Private Mortgage Insurance Companies Aggregated Statistics For Year 2009(Based on 7 full and 5 partial tracts) A) Conventional B) Refinancings Number Average Value Number Average Value
LOANS ORIGINATED 21 $368,475 10 $338,133 APPLICATIONS APPROVED, NOT ACCEPTED 5 $334,636 6 $371,965 APPLICATIONS DENIED 0 $0 4 $320,382 APPLICATIONS WITHDRAWN 1 $460,200 0 $0 FILES CLOSED FOR INCOMPLETENESS 4 $317,670 1 $539,940
Aggregated Statistics For Year 2008(Based on 8 full and 5 partial tracts) A) Conventional B) Refinancings C) Non-occupant Loans on Number Average Value Number Average Value Number Average Value
LOANS ORIGINATED 44 $390,181 15 $384,889 1 $417,000 APPLICATIONS APPROVED, NOT ACCEPTED 11 $411,564 6 $484,502 0 $0 APPLICATIONS DENIED 3 $356,007 2 $386,465 1 $354,910 APPLICATIONS WITHDRAWN 1 $662,000 3 $407,453 0 $0 FILES CLOSED FOR INCOMPLETENESS 2 $559,740 1 $307,440 0 $0
Aggregated Statistics For Year 2007(Based on 7 full and 4 partial tracts) A) Conventional B) Refinancings Number Average Value Number Average Value
LOANS ORIGINATED 8 $367,774 8 $538,432 APPLICATIONS APPROVED, NOT ACCEPTED 5 $390,790 5 $483,228 APPLICATIONS DENIED 1 $480,000 0 $0 APPLICATIONS WITHDRAWN 1 $675,000 1 $567,580 FILES CLOSED FOR INCOMPLETENESS 0 $0 0 $0
Aggregated Statistics For Year 2006(Based on 8 full and 4 partial tracts) A) Conventional B) Refinancings C) Non-occupant Loans on Number Average Value Number Average Value Number Average Value
LOANS ORIGINATED 18 $487,683 8 $498,860 1 $585,000 APPLICATIONS APPROVED, NOT ACCEPTED 1 $427,640 4 $413,835 0 $0 APPLICATIONS DENIED 1 $387,880 0 $0 0 $0 APPLICATIONS WITHDRAWN 0 $0 0 $0 0 $0 FILES CLOSED FOR INCOMPLETENESS 0 $0 0 $0 0 $0
Aggregated Statistics For Year 2005(Based on 7 full and 4 partial tracts) A) Conventional B) Refinancings Number Average Value Number Average Value
LOANS ORIGINATED 15 $435,135 13 $407,778 APPLICATIONS APPROVED, NOT ACCEPTED 2 $539,640 0 $0 APPLICATIONS DENIED 0 $0 0 $0 APPLICATIONS WITHDRAWN 0 $0 2 $440,685 FILES CLOSED FOR INCOMPLETENESS 0 $0 1 $267,430
Aggregated Statistics For Year 2004(Based on 6 full and 5 partial tracts) A) Conventional B) Refinancings C) Non-occupant Loans on Number Average Value Number Average Value Number Average Value
LOANS ORIGINATED 24 $346,357 12 $312,470 3 $325,110 APPLICATIONS APPROVED, NOT ACCEPTED 7 $311,491 3 $379,890 0 $0 APPLICATIONS DENIED 0 $0 0 $0 0 $0 APPLICATIONS WITHDRAWN 0 $0 0 $0 0 $0 FILES CLOSED FOR INCOMPLETENESS 1 $288,690 0 $0 0 $0
Aggregated Statistics For Year 2003(Based on 8 full and 5 partial tracts) A) Conventional B) Refinancings C) Non-occupant Loans on Number Average Value Number Average Value Number Average Value
LOANS ORIGINATED 63 $296,567 43 $261,431 4 $225,260 APPLICATIONS APPROVED, NOT ACCEPTED 13 $297,294 20 $263,145 0 $0 APPLICATIONS DENIED 2 $195,665 3 $252,607 0 $0 APPLICATIONS WITHDRAWN 4 $337,175 6 $319,078 0 $0 FILES CLOSED FOR INCOMPLETENESS 1 $231,550 0 $0 0 $0
Aggregated Statistics For Year 2002(Based on 6 full and 5 partial tracts) A) Conventional B) Refinancings C) Non-occupant Loans on Number Average Value Number Average Value Number Average Value
LOANS ORIGINATED 71 $249,891 53 $233,104 2 $253,130 APPLICATIONS APPROVED, NOT ACCEPTED 15 $260,219 31 $243,663 1 $170,670 APPLICATIONS DENIED 2 $233,245 2 $274,340 0 $0 APPLICATIONS WITHDRAWN 6 $248,260 6 $224,683 1 $228,930 FILES CLOSED FOR INCOMPLETENESS 1 $265,000 0 $0 0 $0
Aggregated Statistics For Year 2001(Based on 6 full and 5 partial tracts) A) Conventional B) Refinancings C) Non-occupant Loans on Number Average Value Number Average Value Number Average Value
LOANS ORIGINATED 93 $229,643 99 $225,134 0 $0 APPLICATIONS APPROVED, NOT ACCEPTED 16 $202,747 28 $224,624 0 $0 APPLICATIONS DENIED 5 $185,348 4 $223,548 2 $208,165 APPLICATIONS WITHDRAWN 6 $221,182 5 $203,864 0 $0 FILES CLOSED FOR INCOMPLETENESS 0 $0 0 $0 0 $0
Aggregated Statistics For Year 2000(Based on 6 full and 5 partial tracts) A) Conventional B) Refinancings C) Non-occupant Loans on Number Average Value Number Average Value Number Average Value
LOANS ORIGINATED 116 $211,764 39 $212,795 2 $278,380 APPLICATIONS APPROVED, NOT ACCEPTED 28 $187,880 14 $197,434 0 $0 APPLICATIONS DENIED 7 $219,434 3 $194,000 0 $0 APPLICATIONS WITHDRAWN 1 $195,380 3 $256,690 0 $0 FILES CLOSED FOR INCOMPLETENESS 1 $176,000 0 $0 0 $0
Aggregated Statistics For Year 1999(Based on 6 full and 7 partial tracts) A) Conventional B) Refinancings C) Non-occupant Loans on Number Average Value Number Average Value Number Average Value
LOANS ORIGINATED 146 $196,237 73 $183,192 1 $124,920 APPLICATIONS APPROVED, NOT ACCEPTED 20 $174,208 16 $217,839 0 $0 APPLICATIONS DENIED 6 $198,835 4 $147,972 0 $0 APPLICATIONS WITHDRAWN 2 $304,030 3 $182,983 0 $0 FILES CLOSED FOR INCOMPLETENESS 2 $162,645 3 $187,970 0 $0
Fire-safe hotels and motels in Cypress, California:
Hyatt House Cypress / Anaheim, 5905 Corporate Ave, Cypress, California 90630 Phone: (714) 828-4000, Fax: (714) 229-0566
Royal Inn, 6112 Lincoln Ave, Cypress, California 90630 Phone: (714) 995-7500
Extended Stay America - Orange County - Cypress, 5990 Corporate Ave, Cypress, California 90630 Phone: (714) 761-2766, Fax: (714) 761-1786
Hampton Inn Los Angeles/Orange County/Cypress, 10990 Yamaha Way, Cypress, California 90630 Phone: (714) 527-2900, Fax: (714) 527-3174
Quality Inn & Suites Cypress, 5651 Lincoln Ave, Cypress, California 90630 Phone: (714) 821-8011, Fax: (714) 527-2979
Rodeway Inn, 5311 Lincoln Ave, Cypress, California 90630 Phone: (714) 952-9388, Fax: (714) 952-4265
All 6 fire-safe hotels and motels in Cypress, California
Most common first names in Cypress, CA among deceased individuals Name Count Lived (average)
John 156 71.8 years Mary 147 78.5 years William 140 73.1 years Robert 119 70.0 years James 92 68.2 years Charles 74 70.1 years Margaret 72 78.0 years George 68 74.6 years Dorothy 67 77.0 years Helen 67 80.5 years
Most common last names in Cypress, CA among deceased individuals Last name Count Lived (average)
Smith 56 73.8 years Brown 32 70.3 years Miller 31 74.2 years Johnson 31 74.2 years Jones 31 73.2 years Williams 26 72.6 years Hall 20 73.9 years Thompson 20 72.5 years Anderson 17 71.1 years Martinez 17 77.1 years
Cypress compared to California state average:
Unemployed percentage significantly below state average. Hispanic race population percentage below state average. Median age above state average. Length of stay since moving in significantly above state average. Percentage of population with a bachelor's degree or higher above state average.
#35 on the list of "Top 101 cities with the most residents born in Korea (population 500+)"
#72 on the list of "Top 101 cities with the most residents born in Taiwan (population 500+)"
#76 on the list of "Top 101 cities where residents moved in more then 10 years ago (10,000+ households)"
#85 on the list of "Top 101 cities with the most residents born in Eastern Asia (population 500+)"
#4 on the list of "Top 101 counties with the highest total withdrawal of fresh water for public supply"
#5 on the list of "Top 101 counties with the most Catholic adherents"
#6 on the list of "Top 101 counties with the highest ground withdrawal of fresh water for public supply"
#7 on the list of "Top 101 counties with the most Evangelical Protestant adherents"
#8 on the list of "Top 101 counties with the highest Particulate Matter (PM2.5 ) Annual air pollution readings in 2012 (µg/m3 )"
Top Patent Applicants
Young-Chun Jeung (32)
Nitinkumar R. Patel (25)
Seung Yup Chu (22)
Alexander Rabinovich (19)
Murat E. Veysoglu (9)
Erik Hatch (8)
Seung Y. Chu (7)
Robert D. Stultz (7)
Joseph Yang (7)
Kazuyoshi Shinozaki (6)
Total of 454 patent applications in 2008-2024.
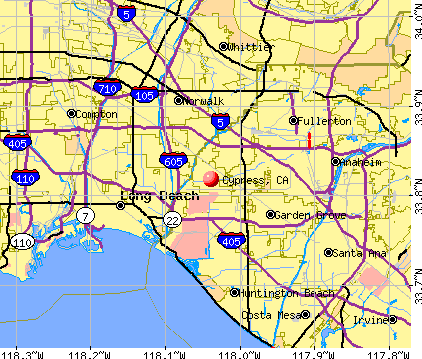


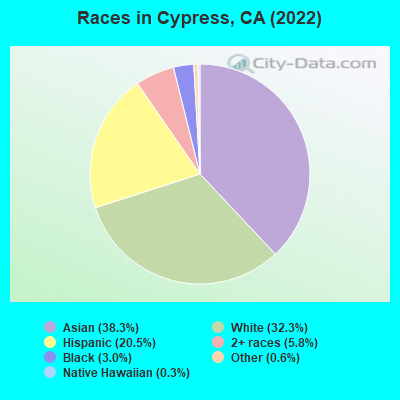
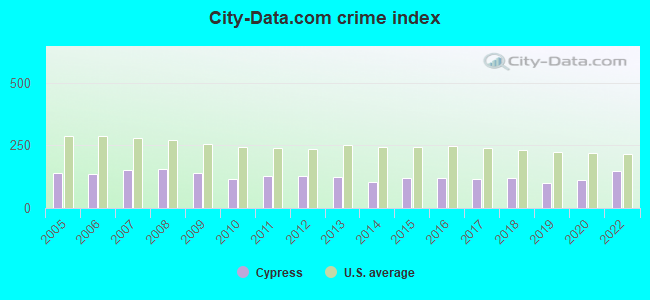
 Recent articles from our blog. Our writers, many of them Ph.D. graduates or candidates, create easy-to-read articles on a wide variety of topics.

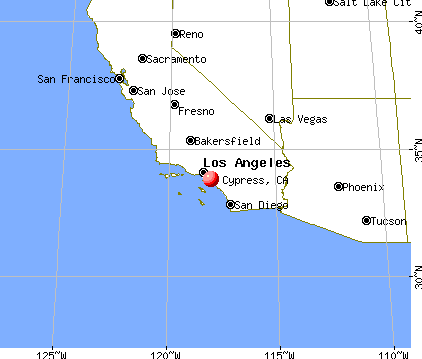
 (3.3 miles
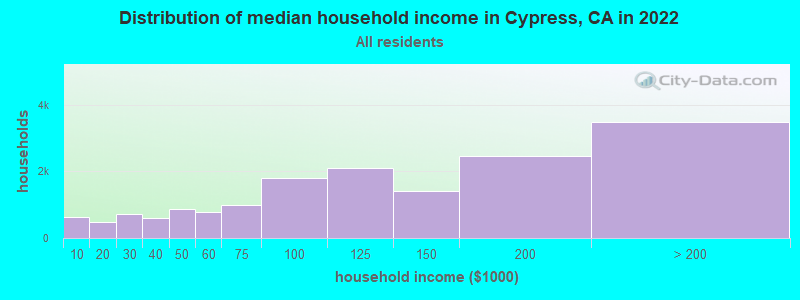
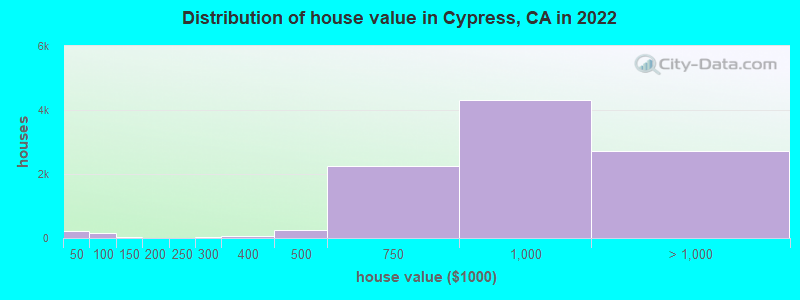
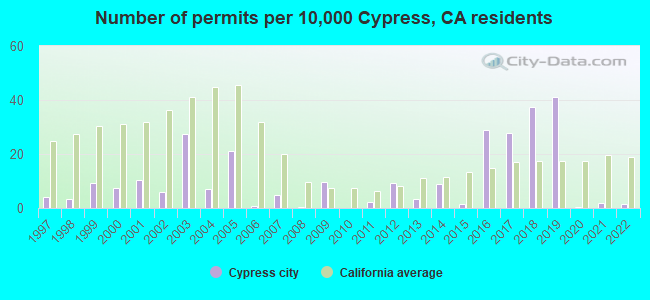
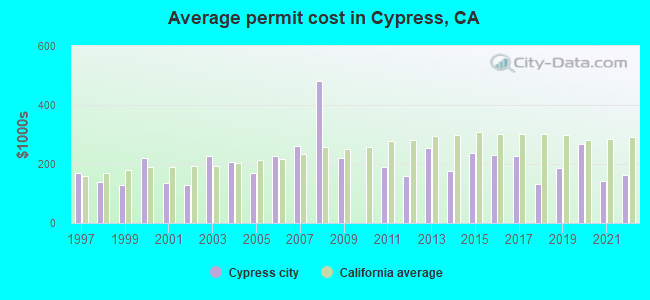
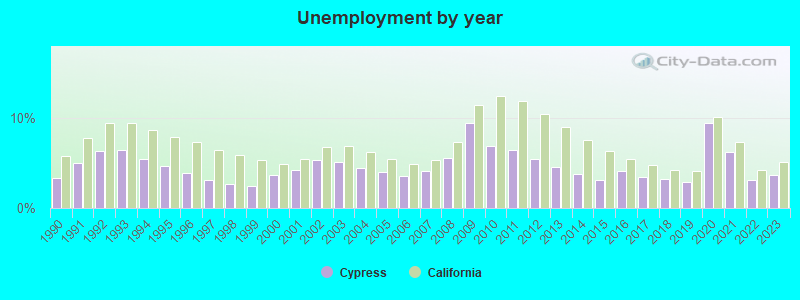
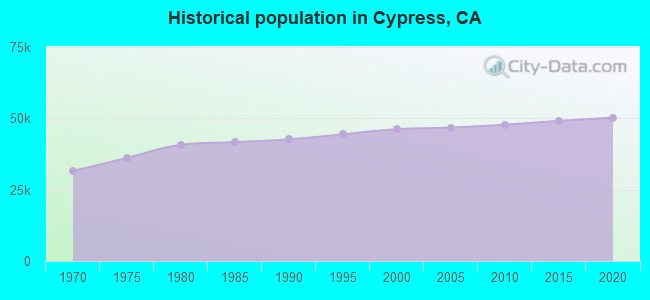
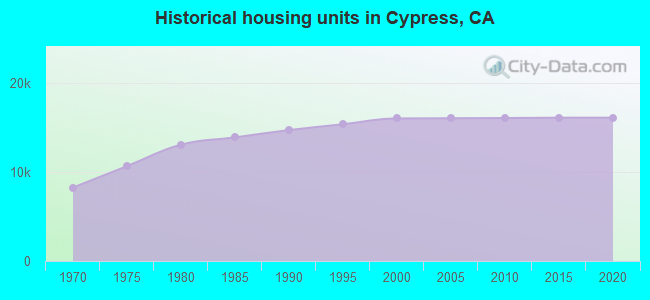
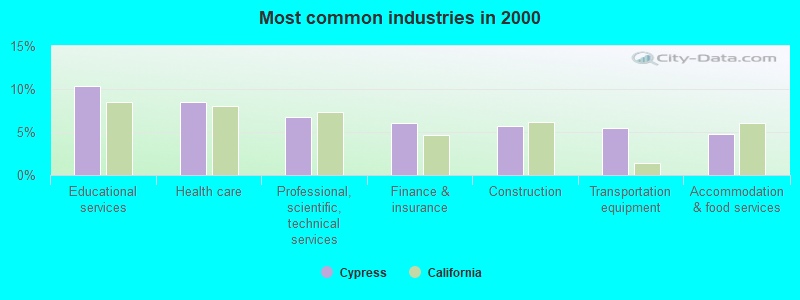
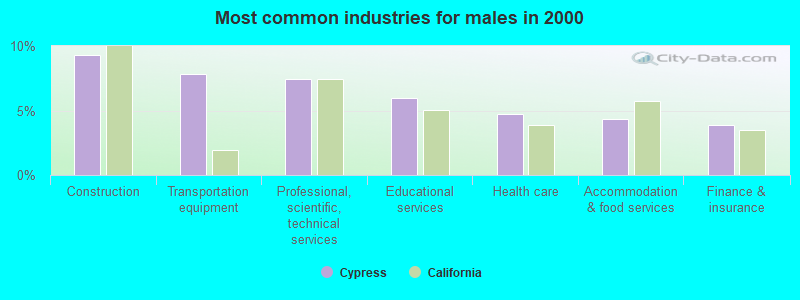
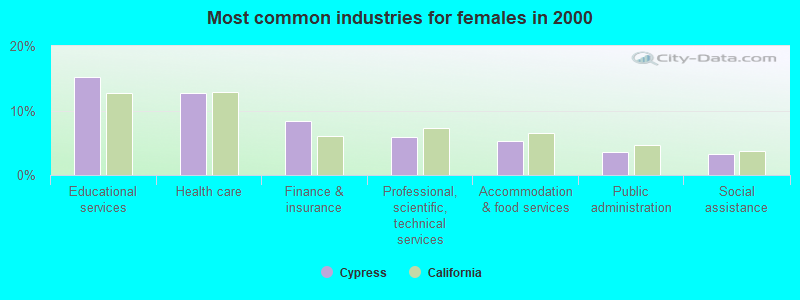
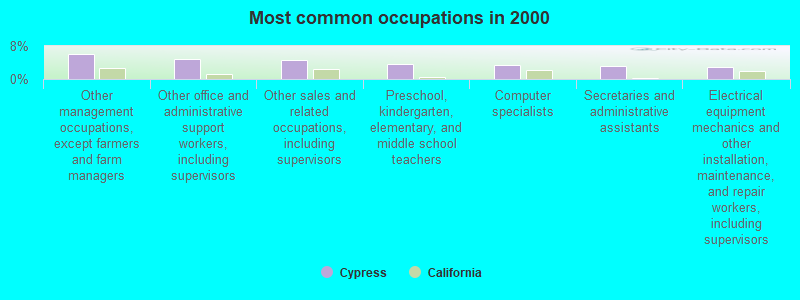
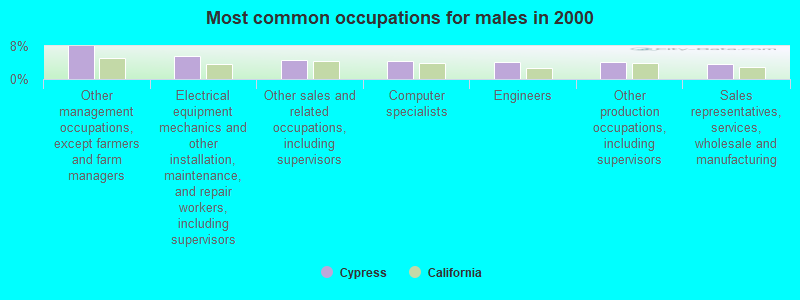
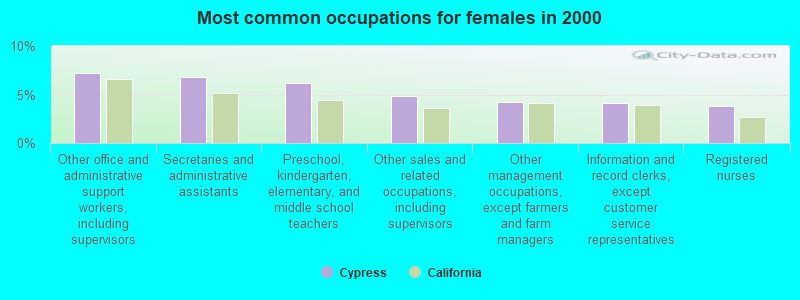
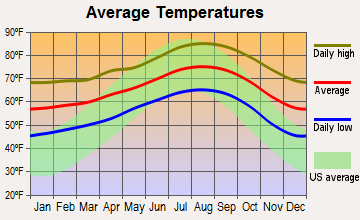
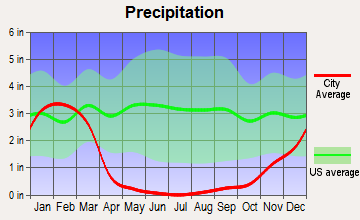
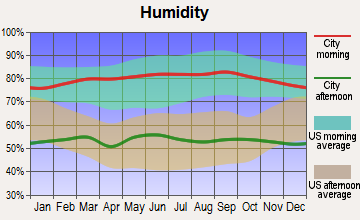
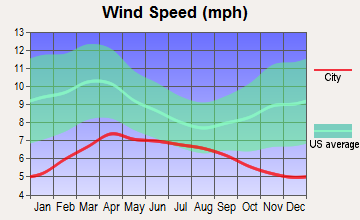
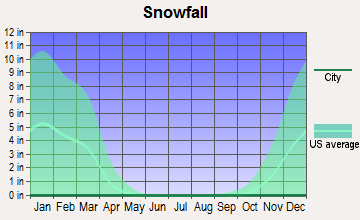
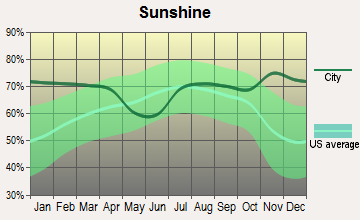
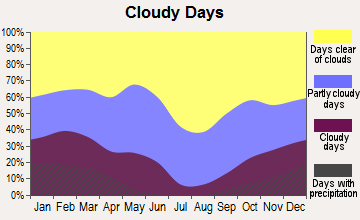
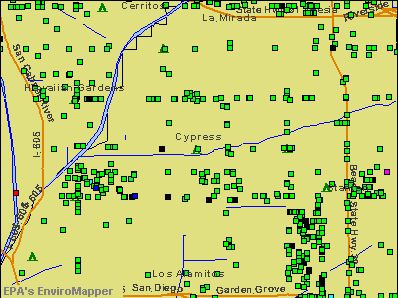

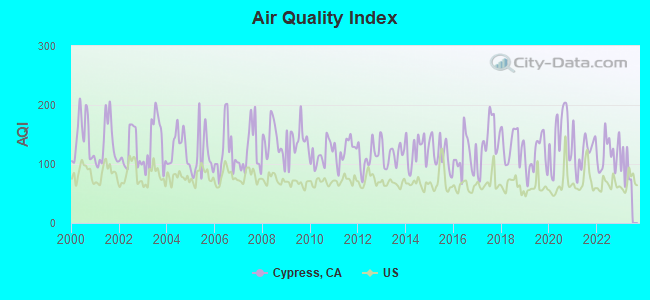
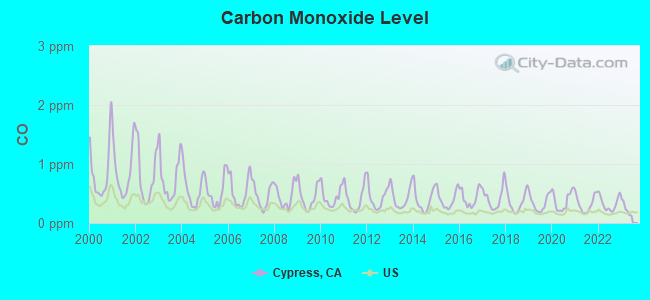
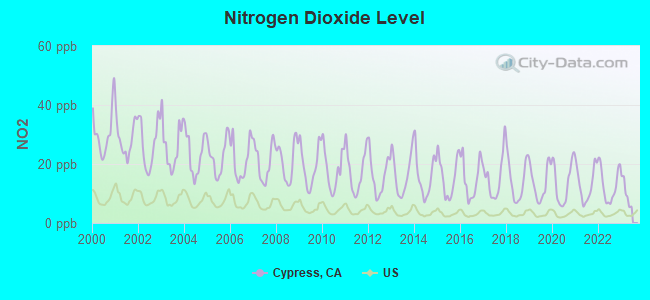
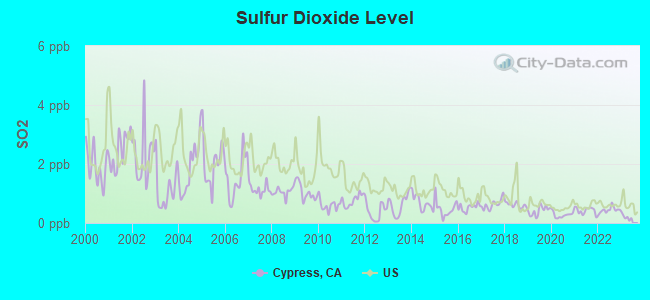
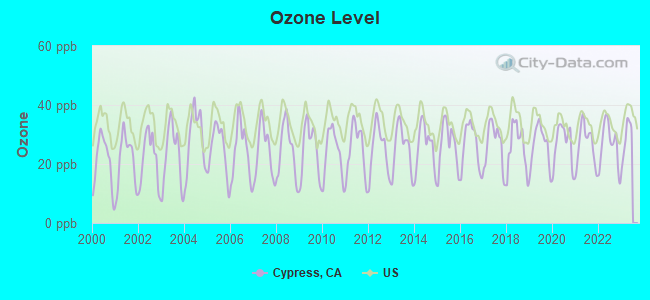
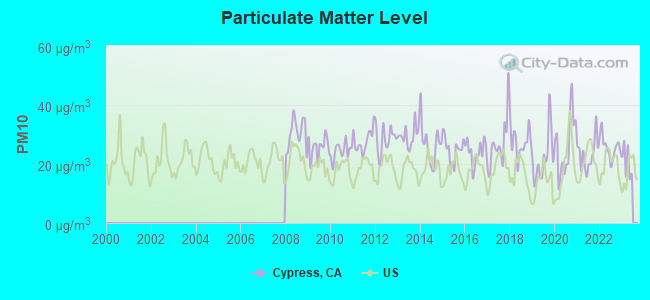
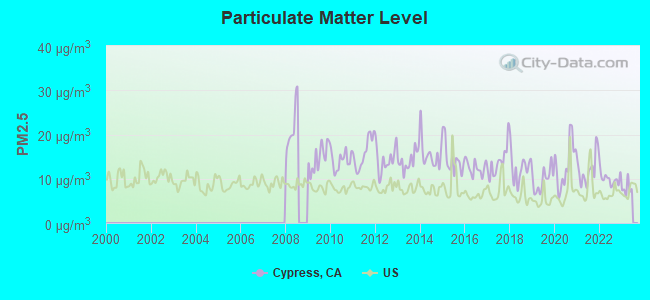

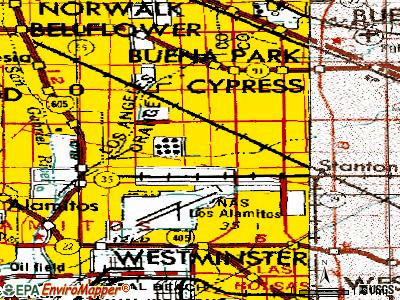
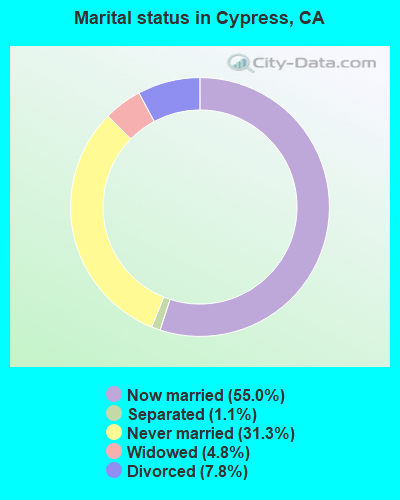
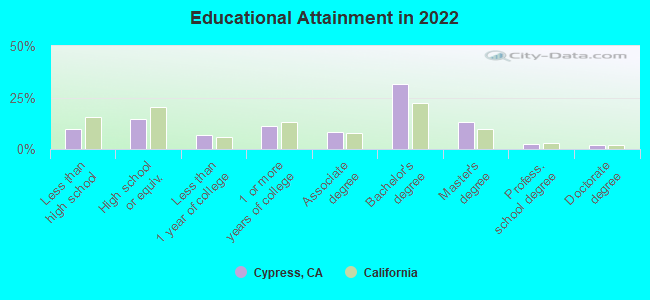
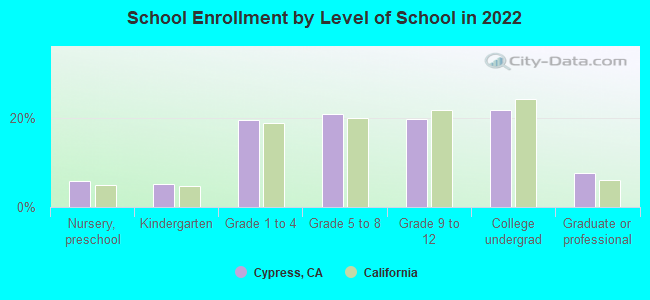
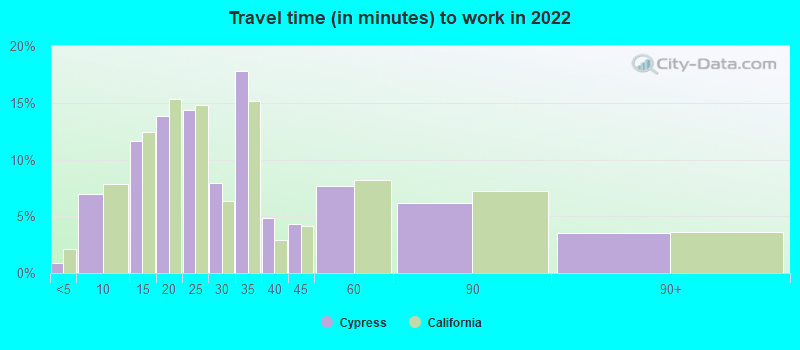
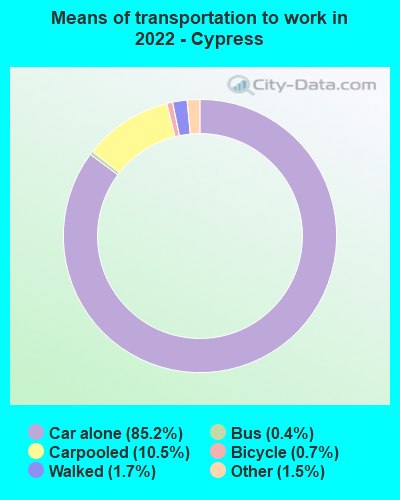


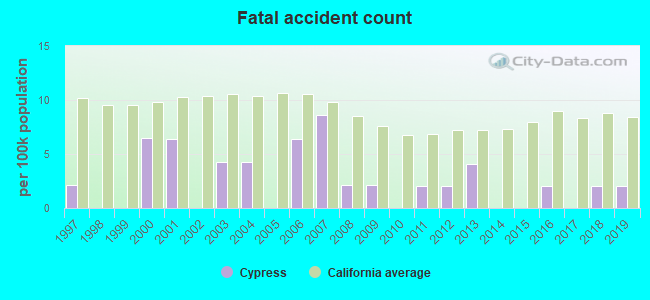
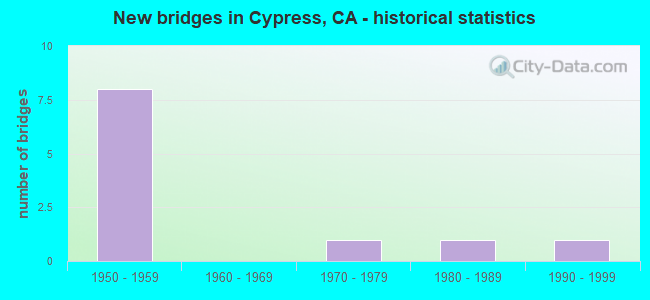
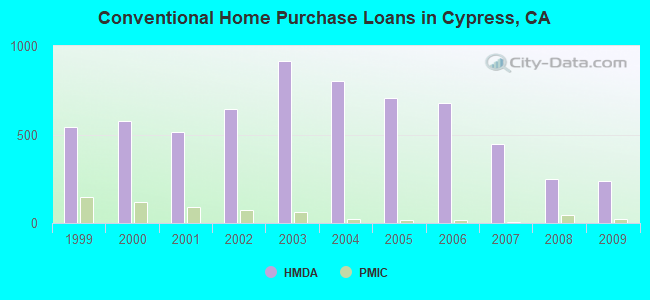
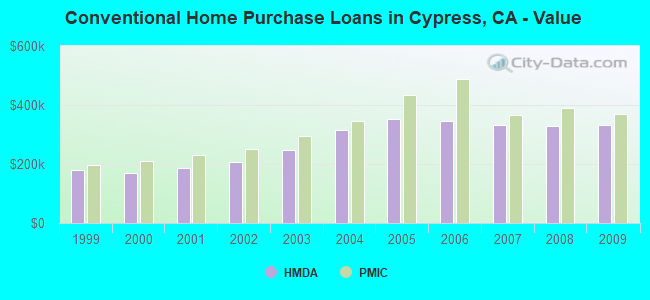
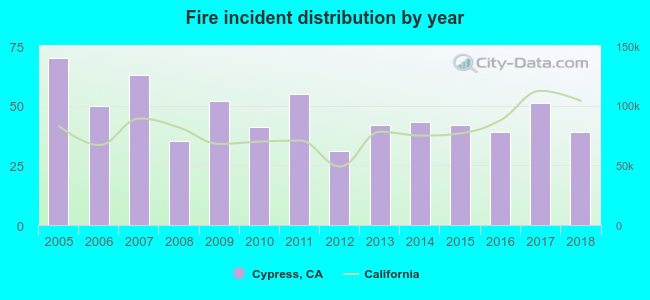 According to the data from the years 2005 - 2018 the average number of fires per year is 47. The highest number of fire incidents - 70 took place in 2005, and the least - 31 in 2012. The data has a declining trend.
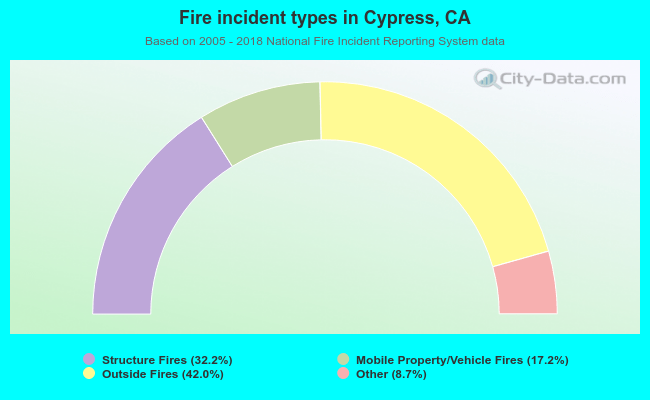 When looking into fire subcategories, the most reports belonged to: Outside Fires (42.0%), and Structure Fires (32.2%).