Lakewood, California Submit your own pictures of this city and show them to the world
OSM Map
General Map
Google Map
MSN Map
OSM Map
General Map
Google Map
MSN Map
OSM Map
General Map
Google Map
MSN Map
OSM Map
General Map
Google Map
MSN Map
Please wait while loading the map...
Population in 2022: 79,063 (100% urban, 0% rural). Population change since 2000: -0.4%Males: 39,027 Females: 40,036
March 2022 cost of living index in Lakewood: 139.4 (high, U.S. average is 100) Percentage of residents living in poverty in 2022: 6.7%for White Non-Hispanic residents , 7.0% for Black residents , 6.2% for Hispanic or Latino residents , 9.2% for American Indian residents , 2.3% for Native Hawaiian and other Pacific Islander residents , 9.9% for other race residents , 4.1% for two or more races residents )
Profiles of local businesses
Business Search - 14 Million verified businesses
Data:
Median household income ($)
Median household income (% change since 2000)
Household income diversity
Ratio of average income to average house value (%)
Ratio of average income to average rent
Median household income ($) - White
Median household income ($) - Black or African American
Median household income ($) - Asian
Median household income ($) - Hispanic or Latino
Median household income ($) - American Indian and Alaska Native
Median household income ($) - Multirace
Median household income ($) - Other Race
Median household income for houses/condos with a mortgage ($)
Median household income for apartments without a mortgage ($)
Races - White alone (%)
Races - White alone (% change since 2000)
Races - Black alone (%)
Races - Black alone (% change since 2000)
Races - American Indian alone (%)
Races - American Indian alone (% change since 2000)
Races - Asian alone (%)
Races - Asian alone (% change since 2000)
Races - Hispanic (%)
Races - Hispanic (% change since 2000)
Races - Native Hawaiian and Other Pacific Islander alone (%)
Races - Native Hawaiian and Other Pacific Islander alone (% change since 2000)
Races - Two or more races (%)
Races - Two or more races (% change since 2000)
Races - Other race alone (%)
Races - Other race alone (% change since 2000)
Racial diversity
Unemployment (%)
Unemployment (% change since 2000)
Unemployment (%) - White
Unemployment (%) - Black or African American
Unemployment (%) - Asian
Unemployment (%) - Hispanic or Latino
Unemployment (%) - American Indian and Alaska Native
Unemployment (%) - Multirace
Unemployment (%) - Other Race
Population density (people per square mile)
Population - Males (%)
Population - Females (%)
Population - Males (%) - White
Population - Males (%) - Black or African American
Population - Males (%) - Asian
Population - Males (%) - Hispanic or Latino
Population - Males (%) - American Indian and Alaska Native
Population - Males (%) - Multirace
Population - Males (%) - Other Race
Population - Females (%) - White
Population - Females (%) - Black or African American
Population - Females (%) - Asian
Population - Females (%) - Hispanic or Latino
Population - Females (%) - American Indian and Alaska Native
Population - Females (%) - Multirace
Population - Females (%) - Other Race
Coronavirus confirmed cases (Apr 27, 2024)
Deaths caused by coronavirus (Apr 27, 2024)
Coronavirus confirmed cases (per 100k population) (Apr 27, 2024)
Deaths caused by coronavirus (per 100k population) (Apr 27, 2024)
Daily increase in number of cases (Apr 27, 2024)
Weekly increase in number of cases (Apr 27, 2024)
Cases doubled (in days) (Apr 27, 2024)
Hospitalized patients (Apr 18, 2022)
Negative test results (Apr 18, 2022)
Total test results (Apr 18, 2022)
COVID Vaccine doses distributed (per 100k population) (Sep 19, 2023)
COVID Vaccine doses administered (per 100k population) (Sep 19, 2023)
COVID Vaccine doses distributed (Sep 19, 2023)
COVID Vaccine doses administered (Sep 19, 2023)
Likely homosexual households (%)
Likely homosexual households (% change since 2000)
Likely homosexual households - Lesbian couples (%)
Likely homosexual households - Lesbian couples (% change since 2000)
Likely homosexual households - Gay men (%)
Likely homosexual households - Gay men (% change since 2000)
Cost of living index
Median gross rent ($)
Median contract rent ($)
Median monthly housing costs ($)
Median house or condo value ($)
Median house or condo value ($ change since 2000)
Mean house or condo value by units in structure - 1, detached ($)
Mean house or condo value by units in structure - 1, attached ($)
Mean house or condo value by units in structure - 2 ($)
Mean house or condo value by units in structure by units in structure - 3 or 4 ($)
Mean house or condo value by units in structure - 5 or more ($)
Mean house or condo value by units in structure - Boat, RV, van, etc. ($)
Mean house or condo value by units in structure - Mobile home ($)
Median house or condo value ($) - White
Median house or condo value ($) - Black or African American
Median house or condo value ($) - Asian
Median house or condo value ($) - Hispanic or Latino
Median house or condo value ($) - American Indian and Alaska Native
Median house or condo value ($) - Multirace
Median house or condo value ($) - Other Race
Median resident age
Resident age diversity
Median resident age - Males
Median resident age - Females
Median resident age - White
Median resident age - Black or African American
Median resident age - Asian
Median resident age - Hispanic or Latino
Median resident age - American Indian and Alaska Native
Median resident age - Multirace
Median resident age - Other Race
Median resident age - Males - White
Median resident age - Males - Black or African American
Median resident age - Males - Asian
Median resident age - Males - Hispanic or Latino
Median resident age - Males - American Indian and Alaska Native
Median resident age - Males - Multirace
Median resident age - Males - Other Race
Median resident age - Females - White
Median resident age - Females - Black or African American
Median resident age - Females - Asian
Median resident age - Females - Hispanic or Latino
Median resident age - Females - American Indian and Alaska Native
Median resident age - Females - Multirace
Median resident age - Females - Other Race
Commute - mean travel time to work (minutes)
Travel time to work - Less than 5 minutes (%)
Travel time to work - Less than 5 minutes (% change since 2000)
Travel time to work - 5 to 9 minutes (%)
Travel time to work - 5 to 9 minutes (% change since 2000)
Travel time to work - 10 to 19 minutes (%)
Travel time to work - 10 to 19 minutes (% change since 2000)
Travel time to work - 20 to 29 minutes (%)
Travel time to work - 20 to 29 minutes (% change since 2000)
Travel time to work - 30 to 39 minutes (%)
Travel time to work - 30 to 39 minutes (% change since 2000)
Travel time to work - 40 to 59 minutes (%)
Travel time to work - 40 to 59 minutes (% change since 2000)
Travel time to work - 60 to 89 minutes (%)
Travel time to work - 60 to 89 minutes (% change since 2000)
Travel time to work - 90 or more minutes (%)
Travel time to work - 90 or more minutes (% change since 2000)
Marital status - Never married (%)
Marital status - Now married (%)
Marital status - Separated (%)
Marital status - Widowed (%)
Marital status - Divorced (%)
Median family income ($)
Median family income (% change since 2000)
Median non-family income ($)
Median non-family income (% change since 2000)
Median per capita income ($)
Median per capita income (% change since 2000)
Median family income ($) - White
Median family income ($) - Black or African American
Median family income ($) - Asian
Median family income ($) - Hispanic or Latino
Median family income ($) - American Indian and Alaska Native
Median family income ($) - Multirace
Median family income ($) - Other Race
Median year house/condo built
Median year apartment built
Year house built - Built 2005 or later (%)
Year house built - Built 2000 to 2004 (%)
Year house built - Built 1990 to 1999 (%)
Year house built - Built 1980 to 1989 (%)
Year house built - Built 1970 to 1979 (%)
Year house built - Built 1960 to 1969 (%)
Year house built - Built 1950 to 1959 (%)
Year house built - Built 1940 to 1949 (%)
Year house built - Built 1939 or earlier (%)
Average household size
Household density (households per square mile)
Average household size - White
Average household size - Black or African American
Average household size - Asian
Average household size - Hispanic or Latino
Average household size - American Indian and Alaska Native
Average household size - Multirace
Average household size - Other Race
Occupied housing units (%)
Vacant housing units (%)
Owner occupied housing units (%)
Renter occupied housing units (%)
Vacancy status - For rent (%)
Vacancy status - For sale only (%)
Vacancy status - Rented or sold, not occupied (%)
Vacancy status - For seasonal, recreational, or occasional use (%)
Vacancy status - For migrant workers (%)
Vacancy status - Other vacant (%)
Residents with income below the poverty level (%)
Residents with income below 50% of the poverty level (%)
Children below poverty level (%)
Poor families by family type - Married-couple family (%)
Poor families by family type - Male, no wife present (%)
Poor families by family type - Female, no husband present (%)
Poverty status for native-born residents (%)
Poverty status for foreign-born residents (%)
Poverty among high school graduates not in families (%)
Poverty among people who did not graduate high school not in families (%)
Residents with income below the poverty level (%) - White
Residents with income below the poverty level (%) - Black or African American
Residents with income below the poverty level (%) - Asian
Residents with income below the poverty level (%) - Hispanic or Latino
Residents with income below the poverty level (%) - American Indian and Alaska Native
Residents with income below the poverty level (%) - Multirace
Residents with income below the poverty level (%) - Other Race
Air pollution - Air Quality Index (AQI)
Air pollution - CO
Air pollution - NO2
Air pollution - SO2
Air pollution - Ozone
Air pollution - PM10
Air pollution - PM25
Air pollution - Pb
Crime - Murders per 100,000 population
Crime - Rapes per 100,000 population
Crime - Robberies per 100,000 population
Crime - Assaults per 100,000 population
Crime - Burglaries per 100,000 population
Crime - Thefts per 100,000 population
Crime - Auto thefts per 100,000 population
Crime - Arson per 100,000 population
Crime - City-data.com crime index
Crime - Violent crime index
Crime - Property crime index
Crime - Murders per 100,000 population (5 year average)
Crime - Rapes per 100,000 population (5 year average)
Crime - Robberies per 100,000 population (5 year average)
Crime - Assaults per 100,000 population (5 year average)
Crime - Burglaries per 100,000 population (5 year average)
Crime - Thefts per 100,000 population (5 year average)
Crime - Auto thefts per 100,000 population (5 year average)
Crime - Arson per 100,000 population (5 year average)
Crime - City-data.com crime index (5 year average)
Crime - Violent crime index (5 year average)
Crime - Property crime index (5 year average)
1996 Presidential Elections Results (%) - Democratic Party (Clinton)
1996 Presidential Elections Results (%) - Republican Party (Dole)
1996 Presidential Elections Results (%) - Other
2000 Presidential Elections Results (%) - Democratic Party (Gore)
2000 Presidential Elections Results (%) - Republican Party (Bush)
2000 Presidential Elections Results (%) - Other
2004 Presidential Elections Results (%) - Democratic Party (Kerry)
2004 Presidential Elections Results (%) - Republican Party (Bush)
2004 Presidential Elections Results (%) - Other
2008 Presidential Elections Results (%) - Democratic Party (Obama)
2008 Presidential Elections Results (%) - Republican Party (McCain)
2008 Presidential Elections Results (%) - Other
2012 Presidential Elections Results (%) - Democratic Party (Obama)
2012 Presidential Elections Results (%) - Republican Party (Romney)
2012 Presidential Elections Results (%) - Other
2016 Presidential Elections Results (%) - Democratic Party (Clinton)
2016 Presidential Elections Results (%) - Republican Party (Trump)
2016 Presidential Elections Results (%) - Other
2020 Presidential Elections Results (%) - Democratic Party (Biden)
2020 Presidential Elections Results (%) - Republican Party (Trump)
2020 Presidential Elections Results (%) - Other
Ancestries Reported - Arab (%)
Ancestries Reported - Czech (%)
Ancestries Reported - Danish (%)
Ancestries Reported - Dutch (%)
Ancestries Reported - English (%)
Ancestries Reported - French (%)
Ancestries Reported - French Canadian (%)
Ancestries Reported - German (%)
Ancestries Reported - Greek (%)
Ancestries Reported - Hungarian (%)
Ancestries Reported - Irish (%)
Ancestries Reported - Italian (%)
Ancestries Reported - Lithuanian (%)
Ancestries Reported - Norwegian (%)
Ancestries Reported - Polish (%)
Ancestries Reported - Portuguese (%)
Ancestries Reported - Russian (%)
Ancestries Reported - Scotch-Irish (%)
Ancestries Reported - Scottish (%)
Ancestries Reported - Slovak (%)
Ancestries Reported - Subsaharan African (%)
Ancestries Reported - Swedish (%)
Ancestries Reported - Swiss (%)
Ancestries Reported - Ukrainian (%)
Ancestries Reported - United States (%)
Ancestries Reported - Welsh (%)
Ancestries Reported - West Indian (%)
Ancestries Reported - Other (%)
Educational Attainment - No schooling completed (%)
Educational Attainment - Less than high school (%)
Educational Attainment - High school or equivalent (%)
Educational Attainment - Less than 1 year of college (%)
Educational Attainment - 1 or more years of college (%)
Educational Attainment - Associate degree (%)
Educational Attainment - Bachelor's degree (%)
Educational Attainment - Master's degree (%)
Educational Attainment - Professional school degree (%)
Educational Attainment - Doctorate degree (%)
School Enrollment - Nursery, preschool (%)
School Enrollment - Kindergarten (%)
School Enrollment - Grade 1 to 4 (%)
School Enrollment - Grade 5 to 8 (%)
School Enrollment - Grade 9 to 12 (%)
School Enrollment - College undergrad (%)
School Enrollment - Graduate or professional (%)
School Enrollment - Not enrolled in school (%)
School enrollment - Public schools (%)
School enrollment - Private schools (%)
School enrollment - Not enrolled (%)
Median number of rooms in houses and condos
Median number of rooms in apartments
Housing units lacking complete plumbing facilities (%)
Housing units lacking complete kitchen facilities (%)
Density of houses
Urban houses (%)
Rural houses (%)
Households with people 60 years and over (%)
Households with people 65 years and over (%)
Households with people 75 years and over (%)
Households with one or more nonrelatives (%)
Households with no nonrelatives (%)
Population in households (%)
Family households (%)
Nonfamily households (%)
Population in families (%)
Family households with own children (%)
Median number of bedrooms in owner occupied houses
Mean number of bedrooms in owner occupied houses
Median number of bedrooms in renter occupied houses
Mean number of bedrooms in renter occupied houses
Median number of vehichles in owner occupied houses
Mean number of vehichles in owner occupied houses
Median number of vehichles in renter occupied houses
Mean number of vehichles in renter occupied houses
Mortgage status - with mortgage (%)
Mortgage status - with second mortgage (%)
Mortgage status - with home equity loan (%)
Mortgage status - with both second mortgage and home equity loan (%)
Mortgage status - without a mortgage (%)
Average family size
Average family size - White
Average family size - Black or African American
Average family size - Asian
Average family size - Hispanic or Latino
Average family size - American Indian and Alaska Native
Average family size - Multirace
Average family size - Other Race
Geographical mobility - Same house 1 year ago (%)
Geographical mobility - Moved within same county (%)
Geographical mobility - Moved from different county within same state (%)
Geographical mobility - Moved from different state (%)
Geographical mobility - Moved from abroad (%)
Place of birth - Born in state of residence (%)
Place of birth - Born in other state (%)
Place of birth - Native, outside of US (%)
Place of birth - Foreign born (%)
Housing units in structures - 1, detached (%)
Housing units in structures - 1, attached (%)
Housing units in structures - 2 (%)
Housing units in structures - 3 or 4 (%)
Housing units in structures - 5 to 9 (%)
Housing units in structures - 10 to 19 (%)
Housing units in structures - 20 to 49 (%)
Housing units in structures - 50 or more (%)
Housing units in structures - Mobile home (%)
Housing units in structures - Boat, RV, van, etc. (%)
House/condo owner moved in on average (years ago)
Renter moved in on average (years ago)
Year householder moved into unit - Moved in 1999 to March 2000 (%)
Year householder moved into unit - Moved in 1995 to 1998 (%)
Year householder moved into unit - Moved in 1990 to 1994 (%)
Year householder moved into unit - Moved in 1980 to 1989 (%)
Year householder moved into unit - Moved in 1970 to 1979 (%)
Year householder moved into unit - Moved in 1969 or earlier (%)
Means of transportation to work - Drove car alone (%)
Means of transportation to work - Carpooled (%)
Means of transportation to work - Public transportation (%)
Means of transportation to work - Bus or trolley bus (%)
Means of transportation to work - Streetcar or trolley car (%)
Means of transportation to work - Subway or elevated (%)
Means of transportation to work - Railroad (%)
Means of transportation to work - Ferryboat (%)
Means of transportation to work - Taxicab (%)
Means of transportation to work - Motorcycle (%)
Means of transportation to work - Bicycle (%)
Means of transportation to work - Walked (%)
Means of transportation to work - Other means (%)
Working at home (%)
Industry diversity
Most Common Industries - Agriculture, forestry, fishing and hunting, and mining (%)
Most Common Industries - Agriculture, forestry, fishing and hunting (%)
Most Common Industries - Mining, quarrying, and oil and gas extraction (%)
Most Common Industries - Construction (%)
Most Common Industries - Manufacturing (%)
Most Common Industries - Wholesale trade (%)
Most Common Industries - Retail trade (%)
Most Common Industries - Transportation and warehousing, and utilities (%)
Most Common Industries - Transportation and warehousing (%)
Most Common Industries - Utilities (%)
Most Common Industries - Information (%)
Most Common Industries - Finance and insurance, and real estate and rental and leasing (%)
Most Common Industries - Finance and insurance (%)
Most Common Industries - Real estate and rental and leasing (%)
Most Common Industries - Professional, scientific, and management, and administrative and waste management services (%)
Most Common Industries - Professional, scientific, and technical services (%)
Most Common Industries - Management of companies and enterprises (%)
Most Common Industries - Administrative and support and waste management services (%)
Most Common Industries - Educational services, and health care and social assistance (%)
Most Common Industries - Educational services (%)
Most Common Industries - Health care and social assistance (%)
Most Common Industries - Arts, entertainment, and recreation, and accommodation and food services (%)
Most Common Industries - Arts, entertainment, and recreation (%)
Most Common Industries - Accommodation and food services (%)
Most Common Industries - Other services, except public administration (%)
Most Common Industries - Public administration (%)
Occupation diversity
Most Common Occupations - Management, business, science, and arts occupations (%)
Most Common Occupations - Management, business, and financial occupations (%)
Most Common Occupations - Management occupations (%)
Most Common Occupations - Business and financial operations occupations (%)
Most Common Occupations - Computer, engineering, and science occupations (%)
Most Common Occupations - Computer and mathematical occupations (%)
Most Common Occupations - Architecture and engineering occupations (%)
Most Common Occupations - Life, physical, and social science occupations (%)
Most Common Occupations - Education, legal, community service, arts, and media occupations (%)
Most Common Occupations - Community and social service occupations (%)
Most Common Occupations - Legal occupations (%)
Most Common Occupations - Education, training, and library occupations (%)
Most Common Occupations - Arts, design, entertainment, sports, and media occupations (%)
Most Common Occupations - Healthcare practitioners and technical occupations (%)
Most Common Occupations - Health diagnosing and treating practitioners and other technical occupations (%)
Most Common Occupations - Health technologists and technicians (%)
Most Common Occupations - Service occupations (%)
Most Common Occupations - Healthcare support occupations (%)
Most Common Occupations - Protective service occupations (%)
Most Common Occupations - Fire fighting and prevention, and other protective service workers including supervisors (%)
Most Common Occupations - Law enforcement workers including supervisors (%)
Most Common Occupations - Food preparation and serving related occupations (%)
Most Common Occupations - Building and grounds cleaning and maintenance occupations (%)
Most Common Occupations - Personal care and service occupations (%)
Most Common Occupations - Sales and office occupations (%)
Most Common Occupations - Sales and related occupations (%)
Most Common Occupations - Office and administrative support occupations (%)
Most Common Occupations - Natural resources, construction, and maintenance occupations (%)
Most Common Occupations - Farming, fishing, and forestry occupations (%)
Most Common Occupations - Construction and extraction occupations (%)
Most Common Occupations - Installation, maintenance, and repair occupations (%)
Most Common Occupations - Production, transportation, and material moving occupations (%)
Most Common Occupations - Production occupations (%)
Most Common Occupations - Transportation occupations (%)
Most Common Occupations - Material moving occupations (%)
People in Group quarters - Institutionalized population (%)
People in Group quarters - Correctional institutions (%)
People in Group quarters - Federal prisons and detention centers (%)
People in Group quarters - Halfway houses (%)
People in Group quarters - Local jails and other confinement facilities (including police lockups) (%)
People in Group quarters - Military disciplinary barracks (%)
People in Group quarters - State prisons (%)
People in Group quarters - Other types of correctional institutions (%)
People in Group quarters - Nursing homes (%)
People in Group quarters - Hospitals/wards, hospices, and schools for the handicapped (%)
People in Group quarters - Hospitals/wards and hospices for chronically ill (%)
People in Group quarters - Hospices or homes for chronically ill (%)
People in Group quarters - Military hospitals or wards for chronically ill (%)
People in Group quarters - Other hospitals or wards for chronically ill (%)
People in Group quarters - Hospitals or wards for drug/alcohol abuse (%)
People in Group quarters - Mental (Psychiatric) hospitals or wards (%)
People in Group quarters - Schools, hospitals, or wards for the mentally retarded (%)
People in Group quarters - Schools, hospitals, or wards for the physically handicapped (%)
People in Group quarters - Institutions for the deaf (%)
People in Group quarters - Institutions for the blind (%)
People in Group quarters - Orthopedic wards and institutions for the physically handicapped (%)
People in Group quarters - Wards in general hospitals for patients who have no usual home elsewhere (%)
People in Group quarters - Wards in military hospitals for patients who have no usual home elsewhere (%)
People in Group quarters - Juvenile institutions (%)
People in Group quarters - Long-term care (%)
People in Group quarters - Homes for abused, dependent, and neglected children (%)
People in Group quarters - Residential treatment centers for emotionally disturbed children (%)
People in Group quarters - Training schools for juvenile delinquents (%)
People in Group quarters - Short-term care, detention or diagnostic centers for delinquent children (%)
People in Group quarters - Type of juvenile institution unknown (%)
People in Group quarters - Noninstitutionalized population (%)
People in Group quarters - College dormitories (includes college quarters off campus) (%)
People in Group quarters - Military quarters (%)
People in Group quarters - On base (%)
People in Group quarters - Barracks, unaccompanied personnel housing (UPH), (Enlisted/Officer), ;and similar group living quarters for military personnel (%)
People in Group quarters - Transient quarters for temporary residents (%)
People in Group quarters - Military ships (%)
People in Group quarters - Group homes (%)
People in Group quarters - Homes or halfway houses for drug/alcohol abuse (%)
People in Group quarters - Homes for the mentally ill (%)
People in Group quarters - Homes for the mentally retarded (%)
People in Group quarters - Homes for the physically handicapped (%)
People in Group quarters - Other group homes (%)
People in Group quarters - Religious group quarters (%)
People in Group quarters - Dormitories (%)
People in Group quarters - Agriculture workers' dormitories on farms (%)
People in Group quarters - Job Corps and vocational training facilities (%)
People in Group quarters - Other workers' dormitories (%)
People in Group quarters - Crews of maritime vessels (%)
People in Group quarters - Other nonhousehold living situations (%)
People in Group quarters - Other noninstitutional group quarters (%)
Residents speaking English at home (%)
Residents speaking English at home - Born in the United States (%)
Residents speaking English at home - Native, born elsewhere (%)
Residents speaking English at home - Foreign born (%)
Residents speaking Spanish at home (%)
Residents speaking Spanish at home - Born in the United States (%)
Residents speaking Spanish at home - Native, born elsewhere (%)
Residents speaking Spanish at home - Foreign born (%)
Residents speaking other language at home (%)
Residents speaking other language at home - Born in the United States (%)
Residents speaking other language at home - Native, born elsewhere (%)
Residents speaking other language at home - Foreign born (%)
Class of Workers - Employee of private company (%)
Class of Workers - Self-employed in own incorporated business (%)
Class of Workers - Private not-for-profit wage and salary workers (%)
Class of Workers - Local government workers (%)
Class of Workers - State government workers (%)
Class of Workers - Federal government workers (%)
Class of Workers - Self-employed workers in own not incorporated business and Unpaid family workers (%)
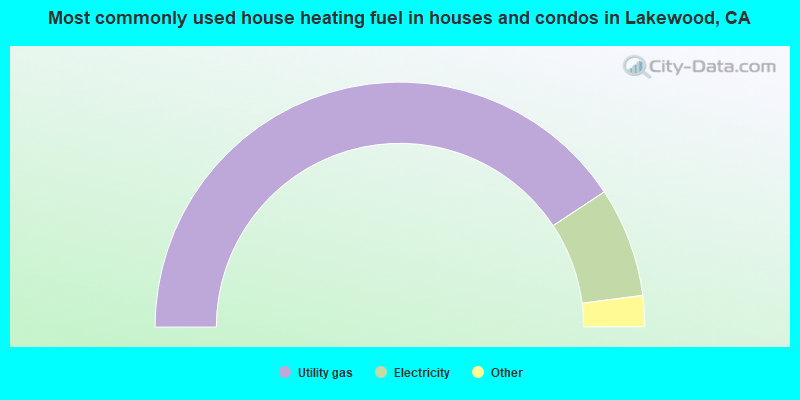
House heating fuel used in houses and condos - Utility gas (%)
House heating fuel used in houses and condos - Bottled, tank, or LP gas (%)
House heating fuel used in houses and condos - Electricity (%)
House heating fuel used in houses and condos - Fuel oil, kerosene, etc. (%)
House heating fuel used in houses and condos - Coal or coke (%)
House heating fuel used in houses and condos - Wood (%)
House heating fuel used in houses and condos - Solar energy (%)
House heating fuel used in houses and condos - Other fuel (%)
House heating fuel used in houses and condos - No fuel used (%)
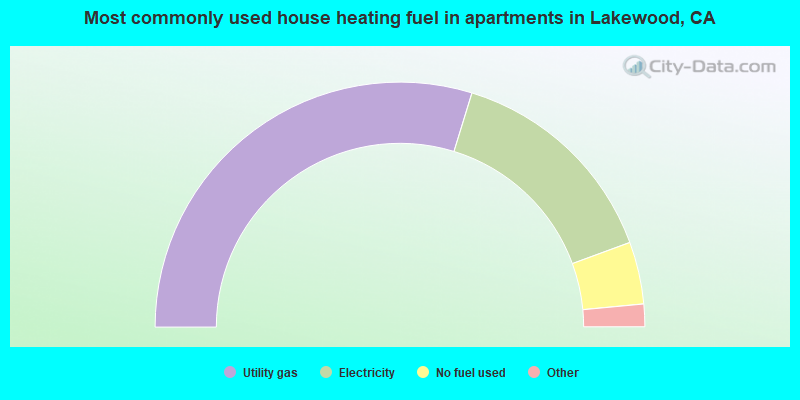
House heating fuel used in apartments - Utility gas (%)
House heating fuel used in apartments - Bottled, tank, or LP gas (%)
House heating fuel used in apartments - Electricity (%)
House heating fuel used in apartments - Fuel oil, kerosene, etc. (%)
House heating fuel used in apartments - Coal or coke (%)
House heating fuel used in apartments - Wood (%)
House heating fuel used in apartments - Solar energy (%)
House heating fuel used in apartments - Other fuel (%)
House heating fuel used in apartments - No fuel used (%)
Armed forces status - In Armed Forces (%)
Armed forces status - Civilian (%)
Armed forces status - Civilian - Veteran (%)
Armed forces status - Civilian - Nonveteran (%)
Fatal accidents locations in years 2005-2021
Fatal accidents locations in 2005
Fatal accidents locations in 2006
Fatal accidents locations in 2007
Fatal accidents locations in 2008
Fatal accidents locations in 2009
Fatal accidents locations in 2010
Fatal accidents locations in 2011
Fatal accidents locations in 2012
Fatal accidents locations in 2013
Fatal accidents locations in 2014
Fatal accidents locations in 2015
Fatal accidents locations in 2016
Fatal accidents locations in 2017
Fatal accidents locations in 2018
Fatal accidents locations in 2019
Fatal accidents locations in 2020
Fatal accidents locations in 2021
Alcohol use - People drinking some alcohol every month (%)
Alcohol use - People not drinking at all (%)
Alcohol use - Average days/month drinking alcohol
Alcohol use - Average drinks/week
Alcohol use - Average days/year people drink much
Audiometry - Average condition of hearing (%)
Audiometry - People that can hear a whisper from across a quiet room (%)
Audiometry - People that can hear normal voice from across a quiet room (%)
Audiometry - Ears ringing, roaring, buzzing (%)
Audiometry - Had a job exposure to loud noise (%)
Audiometry - Had off-work exposure to loud noise (%)
Blood Pressure & Cholesterol - Has high blood pressure (%)
Blood Pressure & Cholesterol - Checking blood pressure at home (%)
Blood Pressure & Cholesterol - Frequently checking blood cholesterol (%)
Blood Pressure & Cholesterol - Has high cholesterol level (%)
Consumer Behavior - Money monthly spent on food at supermarket/grocery store
Consumer Behavior - Money monthly spent on food at other stores
Consumer Behavior - Money monthly spent on eating out
Consumer Behavior - Money monthly spent on carryout/delivered foods
Consumer Behavior - Income spent on food at supermarket/grocery store (%)
Consumer Behavior - Income spent on food at other stores (%)
Consumer Behavior - Income spent on eating out (%)
Consumer Behavior - Income spent on carryout/delivered foods (%)
Current Health Status - General health condition (%)
Current Health Status - Blood donors (%)
Current Health Status - Has blood ever tested for HIV virus (%)
Current Health Status - Left-handed people (%)
Dermatology - People using sunscreen (%)
Diabetes - Diabetics (%)
Diabetes - Had a blood test for high blood sugar (%)
Diabetes - People taking insulin (%)
Diet Behavior & Nutrition - Diet health (%)
Diet Behavior & Nutrition - Milk product consumption (# of products/month)
Diet Behavior & Nutrition - Meals not home prepared (#/week)
Diet Behavior & Nutrition - Meals from fast food or pizza place (#/week)
Diet Behavior & Nutrition - Ready-to-eat foods (#/month)
Diet Behavior & Nutrition - Frozen meals/pizza (#/month)
Drug Use - People that ever used marijuana or hashish (%)
Drug Use - Ever used hard drugs (%)
Drug Use - Ever used any form of cocaine (%)
Drug Use - Ever used heroin (%)
Drug Use - Ever used methamphetamine (%)
Health Insurance - People covered by health insurance (%)
Kidney Conditions-Urology - Avg. # of times urinating at night
Medical Conditions - People with asthma (%)
Medical Conditions - People with anemia (%)
Medical Conditions - People with psoriasis (%)
Medical Conditions - People with overweight (%)
Medical Conditions - Elderly people having difficulties in thinking or remembering (%)
Medical Conditions - People who ever received blood transfusion (%)
Medical Conditions - People having trouble seeing even with glass/contacts (%)
Medical Conditions - People with arthritis (%)
Medical Conditions - People with gout (%)
Medical Conditions - People with congestive heart failure (%)
Medical Conditions - People with coronary heart disease (%)
Medical Conditions - People with angina pectoris (%)
Medical Conditions - People who ever had heart attack (%)
Medical Conditions - People who ever had stroke (%)
Medical Conditions - People with emphysema (%)
Medical Conditions - People with thyroid problem (%)
Medical Conditions - People with chronic bronchitis (%)
Medical Conditions - People with any liver condition (%)
Medical Conditions - People who ever had cancer or malignancy (%)
Mental Health - People who have little interest in doing things (%)
Mental Health - People feeling down, depressed, or hopeless (%)
Mental Health - People who have trouble sleeping or sleeping too much (%)
Mental Health - People feeling tired or having little energy (%)
Mental Health - People with poor appetite or overeating (%)
Mental Health - People feeling bad about themself (%)
Mental Health - People who have trouble concentrating on things (%)
Mental Health - People moving or speaking slowly or too fast (%)
Mental Health - People having thoughts they would be better off dead (%)
Oral Health - Average years since last visit a dentist
Oral Health - People embarrassed because of mouth (%)
Oral Health - People with gum disease (%)
Oral Health - General health of teeth and gums (%)
Oral Health - Average days a week using dental floss/device
Oral Health - Average days a week using mouthwash for dental problem
Oral Health - Average number of teeth
Pesticide Use - Households using pesticides to control insects (%)
Pesticide Use - Households using pesticides to kill weeds (%)
Physical Activity - People doing vigorous-intensity work activities (%)
Physical Activity - People doing moderate-intensity work activities (%)
Physical Activity - People walking or bicycling (%)
Physical Activity - People doing vigorous-intensity recreational activities (%)
Physical Activity - People doing moderate-intensity recreational activities (%)
Physical Activity - Average hours a day doing sedentary activities
Physical Activity - Average hours a day watching TV or videos
Physical Activity - Average hours a day using computer
Physical Functioning - People having limitations keeping them from working (%)
Physical Functioning - People limited in amount of work they can do (%)
Physical Functioning - People that need special equipment to walk (%)
Physical Functioning - People experiencing confusion/memory problems (%)
Physical Functioning - People requiring special healthcare equipment (%)
Prescription Medications - Average number of prescription medicines taking
Preventive Aspirin Use - Adults 40+ taking low-dose aspirin (%)
Reproductive Health - Vaginal deliveries (%)
Reproductive Health - Cesarean deliveries (%)
Reproductive Health - Deliveries resulted in a live birth (%)
Reproductive Health - Pregnancies resulted in a delivery (%)
Reproductive Health - Women breastfeeding newborns (%)
Reproductive Health - Women that had a hysterectomy (%)
Reproductive Health - Women that had both ovaries removed (%)
Reproductive Health - Women that have ever taken birth control pills (%)
Reproductive Health - Women taking birth control pills (%)
Reproductive Health - Women that have ever used Depo-Provera or injectables (%)
Reproductive Health - Women that have ever used female hormones (%)
Sexual Behavior - People 18+ that ever had sex (vaginal, anal, or oral) (%)
Sexual Behavior - Males 18+ that ever had vaginal sex with a woman (%)
Sexual Behavior - Males 18+ that ever performed oral sex on a woman (%)
Sexual Behavior - Males 18+ that ever had anal sex with a woman (%)
Sexual Behavior - Males 18+ that ever had any sex with a man (%)
Sexual Behavior - Females 18+ that ever had vaginal sex with a man (%)
Sexual Behavior - Females 18+ that ever performed oral sex on a man (%)
Sexual Behavior - Females 18+ that ever had anal sex with a man (%)
Sexual Behavior - Females 18+ that ever had any kind of sex with a woman (%)
Sexual Behavior - Average age people first had sex
Sexual Behavior - Average number of female sex partners in lifetime (males 18+)
Sexual Behavior - Average number of female vaginal sex partners in lifetime (males 18+)
Sexual Behavior - Average age people first performed oral sex on a woman (18+)
Sexual Behavior - Average number of woman performed oral sex on in lifetime (18+)
Sexual Behavior - Average number of male sex partners in lifetime (males 18+)
Sexual Behavior - Average number of male anal sex partners in lifetime (males 18+)
Sexual Behavior - Average age people first performed oral sex on a man (18+)
Sexual Behavior - Average number of male oral sex partners in lifetime (18+)
Sexual Behavior - People using protection when performing oral sex (%)
Sexual Behavior - Average number of times people have vaginal or anal sex a year
Sexual Behavior - People having sex without condom (%)
Sexual Behavior - Average number of male sex partners in lifetime (females 18+)
Sexual Behavior - Average number of male vaginal sex partners in lifetime (females 18+)
Sexual Behavior - Average number of female sex partners in lifetime (females 18+)
Sexual Behavior - Circumcised males 18+ (%)
Sleep Disorders - Average hours sleeping at night
Sleep Disorders - People that has trouble sleeping (%)
Smoking-Cigarette Use - People smoking cigarettes (%)
Taste & Smell - People 40+ having problems with smell (%)
Taste & Smell - People 40+ having problems with taste (%)
Taste & Smell - People 40+ that ever had wisdom teeth removed (%)
Taste & Smell - People 40+ that ever had tonsils teeth removed (%)
Taste & Smell - People 40+ that ever had a loss of consciousness because of a head injury (%)
Taste & Smell - People 40+ that ever had a broken nose or other serious injury to face or skull (%)
Taste & Smell - People 40+ that ever had two or more sinus infections (%)
Weight - Average height (inches)
Weight - Average weight (pounds)
Weight - Average BMI
Weight - People that are obese (%)
Weight - People that ever were obese (%)
Weight - People trying to lose weight (%)
32,475 41.1% Hispanic 20,670 26.2% White alone 13,331 16.9% Asian alone 7,190 9.1% Black alone 3,218 4.1% Two or more races 1,330 1.7% Native Hawaiian and Other 730 0.9% Other race alone 98 0.1% American Indian alone
According to our research of California and other state lists, there were 58 registered sex offenders living in Lakewood, California as of April 27, 2024 . The ratio of all residents to sex offenders in Lakewood is 1,399 to 1.The ratio of registered sex offenders to all residents in this city is lower than the state average.
The City-Data.com crime index weighs serious crimes and violent crimes more heavily. Higher means more crime, U.S. average is 246.1. It adjusts for the number of visitors and daily workers commuting into cities.
- means the value is smaller than the state average.
- means the value is about the same as the state average.
- means the value is bigger than the state average.
- means the value is much bigger than the state average.
Crime rate in Lakewood detailed stats: murders, rapes, robberies, assaults, burglaries, thefts, arson Officers per 1,000 residents here:
0.01California average:
1.98
Latest news from Lakewood, CA collected exclusively by city-data.com from local newspapers, TV, and radio stations
Ancestries: German (2.9%), Italian (2.6%), English (2.3%), American (2.2%), European (1.6%), Irish (1.6%).
Current Local Time:
Land area: 9.43 square miles.
Population density: 8,385 people per square mile (high).
16,658 residents are foreign born (11.0% Asia , 8.1% Latin America ).
This city:
20.9%California:
26.5%
Median real estate property taxes paid for housing units with mortgages in 2022: $5,817 (0.7%)Median real estate property taxes paid for housing units with no mortgage in 2022: $3,575 (0.5%)
Nearest city with pop. 200,000+: Long Beach, CA
Nearest city with pop. 1,000,000+: Los Angeles, CA
Nearest cities:
Latitude: 33.85 N, Longitude: 118.12 W
Daytime population change due to commuting: -21,376 (-27.0%)Workers who live and work in this city: 7,575 (18.4%)
Property values in Lakewood, CA
Single-family new house construction building permits:
2022: 19 buildings , average cost: $122,1002021: 14 buildings , average cost: $95,4002020: 11 buildings , average cost: $127,7002019: 7 buildings , average cost: $126,3002018: 3 buildings , average cost: $87,1002017: 4 buildings , average cost: $362,3002016: 3 buildings , average cost: $223,4002015: 72 buildings , average cost: $264,7002012: 4 buildings , average cost: $290,1002010: 18 buildings , average cost: $230,1002007: 1 building , cost: $249,3002006: 3 buildings , average cost: $249,3002005: 2 buildings , average cost: $249,3002004: 1 building , cost: $249,3002003: 1 building , cost: $249,3002002: 1 building , cost: $249,3002001: 2 buildings , average cost: $249,3002000: 3 buildings , average cost: $249,3001999: 28 buildings , average cost: $290,9001998: 19 buildings , average cost: $288,0001997: 50 buildings , average cost: $294,200Unemployment in December 2023:
Population change in the 1990s: +5,676 (+7.7%).
Most common industries in Lakewood, CA (%)
Both Males Females
Health care (12.3%)
Educational services (9.5%)
Accommodation & food services (5.7%)
Construction (5.7%)
Professional, scientific, technical services (4.8%)
Public administration (4.7%)
Other transportation, support activities, couriers (4.4%)
Construction (9.5%)
Other transportation, support activities, couriers (7.0%)
Health care (6.5%)
Transportation equipment (5.6%)
Educational services (5.2%)
Accommodation & food services (5.2%)
Professional, scientific, technical services (4.9%)
Health care (18.3%)
Educational services (13.9%)
Accommodation & food services (6.2%)
Finance & insurance (5.7%)
Professional, scientific, technical services (4.7%)
Public administration (4.6%)
Administrative & support & waste management services (4.2%)
Most common occupations in Lakewood, CA (%)
Both Males Females
Other management occupations, except farmers and farm managers (5.1%)
Cooks and food preparation workers (5.1%)
Registered nurses (3.3%)
Material recording, scheduling, dispatching, and distributing workers (3.1%)
Driver/sales workers and truck drivers (2.9%)
Other office and administrative support workers, including supervisors (2.8%)
Supervisors and other personal care and service workers, except child care workers (2.7%)
Driver/sales workers and truck drivers (5.4%)
Cooks and food preparation workers (5.1%)
Other management occupations, except farmers and farm managers (4.6%)
Electrical equipment mechanics and other installation, maintenance, and repair workers, including supervisors (4.0%)
Laborers and material movers, hand (3.8%)
Material recording, scheduling, dispatching, and distributing workers (3.8%)
Engineers (3.8%)
Registered nurses (5.9%)
Other management occupations, except farmers and farm managers (5.6%)
Cooks and food preparation workers (5.1%)
Other office and administrative support workers, including supervisors (4.9%)
Secretaries and administrative assistants (4.4%)
Cashiers (3.4%)
Supervisors and other personal care and service workers, except child care workers (3.2%)
Earthquake activity:
Lakewood-area historical earthquake activity is significantly above California state average. It is 6845% greater than the overall U.S. average. On 7/21/1952 at 11:52:14, a magnitude 7.7 (7.7 UK, Class: Major, Intensity: VIII - XII) earthquake occurred 94.2 miles away from Lakewood center, causing $50,000,000 total damage On 6/28/1992 at 11:57:34, a magnitude 7.6 (6.2 MB, 7.6 MS, 7.3 MW, Depth: 0.7 mi) earthquake occurred 94.0 miles away from the city center, causing 3 deaths ( 1 shaking deaths, 2 other deaths) and 400 injuries, causing $100,000,000 total damage and $40,000,000 insured lossesOn 10/16/1999 at 09:46:44, a magnitude 7.4 (6.3 MB, 7.4 MS, 7.2 MW, 7.3 ML) earthquake occurred 106.9 miles away from the city center On 11/4/1927 at 13:51:53, a magnitude 7.5 (7.5 UK) earthquake occurred 181.8 miles away from Lakewood center On 1/17/1994 at 12:30:55, a magnitude 6.8 (6.4 MB, 6.8 MS, 6.7 MW, Depth: 11.4 mi, Class: Strong, Intensity: VII - IX) earthquake occurred 33.7 miles away from the city center, causing 60 deaths ( 60 shaking deaths) and 7000 injuriesOn 4/21/1918 at 22:32:30, a magnitude 6.8 (6.8 UK) earthquake occurred 39.1 miles away from Lakewood center Magnitude types: body-wave magnitude (MB), local magnitude (ML), surface-wave magnitude (MS), moment magnitude (MW) Natural disasters: The number of natural disasters in Los Angeles County (57) is a lot greater than the US average (15).Major Disasters (Presidential) Declared: 27Emergencies Declared: 3Fires: 37, Floods: 16, Storms: 9, Winter Storms: 6, Landslides: 5, Mudslides: 5, Earthquakes: 3, Freeze: 1, Heavy Rain: 1, Hurricane: 1, Snow: 1, Tornado: 1, Wind: 1, Other: 1 (Note: some incidents may be assigned to more than one category). Hospitals and medical centers in Lakewood: LAKEWOOD REGIONAL MEDICAL CENTER (Proprietary, provides emergency services, 3700 E SOUTH ST) SIERRA HOUSE (12632 206TH STREET) DAVITA-LAKEWOOD DIALYSIS CENTER (4611 SILVA STREET)
ADMIRAL HOME HEALTH, INC (4010 WATSON PLAZA DRIVE SUITE 140)
JUBILEE HOME HEALTH SERVICES (4010 WATSON PLAZA DR STE 210)
RAE STAR HEALTH SYSTEMS, INC (5247 PARAMOUNT BLVD)
Heliports located in Lakewood: Amtrak stations near Lakewood: 7 miles: LONG BEACH (601 N. LONG BEACH BLVD.) - Bus Station Services: fully wheelchair accessible, public restrooms, public payphones, full-service food facilities, paid short-term parking, paid long-term parking, call for taxi service, public transit connection.
12 miles: SAN PEDRO (CATALINA TERMINAL, BERTH 95) - Bus Station Services: partially wheelchair accessible, enclosed waiting area, public restrooms, public payphones, snack bar, paid short-term parking, paid long-term parking, call for taxi service.
12 miles: FULLERTON (120 E. SANTA FE AVE.) Services: ticket office, fully wheelchair accessible, enclosed waiting area, public restrooms, public payphones, full-service food facilities, free short-term parking, paid long-term parking, taxi stand, public transit connection.
Colleges/universities with over 2000 students nearest to Lakewood:
Long Beach City College (about 2 miles; Long Beach, CA ; Full-time enrollment: 15,602)
Cerritos College (about 3 miles; Norwalk, CA ; FT enrollment: 13,090)
California State University-Long Beach (about 5 miles; Long Beach, CA ; FT enrollment: 28,287)
El Camino College-Compton Center (about 6 miles; Compton, CA ; FT enrollment: 4,506)
Cypress College (about 6 miles; Cypress, CA ; FT enrollment: 8,732)
Trident University International (about 6 miles; Cypress, CA ; FT enrollment: 5,974)
Wyotech-Long Beach (about 7 miles; Long Beach, CA ; FT enrollment: 2,453)
Public high schools in Lakewood: LAKEWOOD HIGH Students: 3,032, Location: 4400 BRIERCREST AVE., Grades: 9-12)ARTESIA HIGH Students: 1,143, Location: 12108 E. DEL AMO BLVD., Grades: 9-12)BUENA VISTA HIGH Students: 88, Location: 3717 MICHELSON ST., Grades: 9-12)PARAMOUNT ALTERNATIVE EDUCATION CENTER Students: 4, Location: 3701 MICHELSON ST., Grades: 6-12)MAYFAIR HIGH Location: 6000 N. WOODRUFF AVE., Grades: 7-12)
Private high school in Lakewood: ST JOSEPH HIGH SCHOOL Students: 679, Location: 5825 WOODRUFF AVE, Grades: 9-12, Girls only )
Biggest public elementary/middle schools in Lakewood: HOOVER MIDDLE Students: 1,015, Location: 3501 COUNTRY CLUB DR., Grades: 6-8)GOMPERS K-8 Students: 672, Location: 5206 BRIERCREST AVE., Grades: KG-8)MACARTHUR ELEMENTARY Students: 452, Location: 6011 CENTRALIA ST., Grades: KG-5)PALMS ELEMENTARY Students: 424, Location: 12445 E. 207TH ST., Grades: KG-6)RILEY ELEMENTARY Students: 404, Location: 3319 SANDWOOD ST., Grades: KG-5)HOLMES ELEMENTARY Students: 398, Location: 5020 BARLIN AVE., Grades: KG-5)WILLOW ELEMENTARY Students: 366, Location: 11733 E. 205TH ST., Grades: KG-6)CLEVELAND ELEMENTARY Students: 322, Location: 4760 HACKETT AVE., Grades: KG-5)ALOHA ELEMENTARY Students: 281, Location: 11737 E. 214TH ST., Grades: KG-6)CRAIG WILLIAMS ELEMENTARY Location: 6144 N. CLARK AVE., Grades: KG-6)
Private elementary/middle school in Lakewood: ST PANCRATIUS ELEMENTARY SCHOOL Students: 175, Location: 3601 SAINT PANCRATIUS PL, Grades: KG-8)
See full list of schools located in Lakewood
Notable locations in Lakewood: (A) , Angelo M Iacoboni Branch County of Los Angeles Public Library (B) , Lakewood City Hall (C) , George Nye Junior Branch County of Los Angeles Public Library (D) , Lakewood Sheriffs Station (E) , Los Angeles County Fire Department Station 122 (F) , Los Angeles County Fire Department Station 94 (G) , Los Angeles County Fire Department Station 45 (H) . Display/hide their locations on the map
Shopping Centers: (1) , Lakewood Square Shopping Center (2) , Lakewood Center Mall Shopping Center (3) , Color Corner Shopping Center (4) , Lakewood Marketplace Shopping Center (5) , Carwood Shopping Center (6) . Display/hide their locations on the map
Churches in Lakewood include: (A) , Church of Christ (B) , Emmanuel Church of Lakewood (C) , First Southern Baptist Church (D) , First United Methodist Church (E) , Mayfair Community Reformed Church (F) , Park Crest Christian Church (G) , Saint Timothy Lutheran Church (H) , Trinity United Methodist Church (I) . Display/hide their locations on the map
Lake: (A) . Display/hide its location on the map
Creek: (A) . Display/hide its location on the map
Parks in Lakewood include: (1) , Biscailuz Park (2) , Jose del Valle Park (3) , Mayfair Park (4) , Simon Bolivar Park (5) , Bloomfield Park (6) , Boyar Park (7) , Candleverde Park (8) , Lakewood Equestrian Center (9) . Display/hide their locations on the map
Birthplace of: Jon Weber (baseball) - Baseball player, Greg LeMond - (born 1961), cyclist, Travis d'Arnaud - Baseball player, Bobby Crosby - 2005 Major League Baseball player (Oakland Athletics, born : Jan 12, 1980), Donnie Murphy - 2005 Major League Baseball player (Kansas City Royals, born : Mar 10, 1983), Kyle Korver - NBA player (Philadelphia 76ers, born : Mar 17, 1981), Natalie Golda - Water polo player, Bryton James - Actor, Shawn Moran - Speedway rider, Travis Ramsey - Ice hockey player.
Los Angeles County has a predicted average indoor radon screening level between 2 and 4 pCi/L (pico curies per liter) - Moderate Potential Average household size: This city:
3.0 peopleCalifornia:
2.9 people
Percentage of family households: This city:
76.8%Whole state:
68.7%
Percentage of households with unmarried partners: This city:
5.8%Whole state:
7.2%
Likely homosexual households (counted as self-reported same-sex unmarried-partner households)
Lesbian couples: 0.7% of all households Gay men: 0.3% of all households
People in group quarters in Lakewood in 2010:
50 people in group homes intended for adults
34 people in other noninstitutional facilities
13 people in workers' group living quarters and job corps centers
12 people in residential treatment centers for adults
People in group quarters in Lakewood in 2000:
112 people in nursing homes
48 people in homes or halfway houses for drug/alcohol abuse
11 people in other noninstitutional group quarters
10 people in homes for the mentally ill
6 people in homes for the mentally retarded
4 people in homes for the physically handicapped
2 people in religious group quarters
Banks with most branches in Lakewood (2011 data):
Wells Fargo Bank, National Association: Lakewood Branch, Woodruff And South Branch, Hardwick Center Branch, Lakewood Pavilions Branch. Info updated 2011/04/05: Bank assets: $1,161,490.0 mil, Deposits: $905,653.0 mil, headquarters in Sioux Falls, SD, positive income , 6395 total offices , Holding Company: Wells Fargo & Company
JPMorgan Chase Bank, National Association: Lakewood Branch at 5059 Lakewood Boulevard, branch established on 1889/01/01; Lakewood Branch at 4909 Lakewood Boulevard, branch established on 1889/01/01. Info updated 2011/11/10: Bank assets: $1,811,678.0 mil, Deposits: $1,190,738.0 mil, headquarters in Columbus, OH, positive income , International Specialization, 5577 total offices , Holding Company: Jpmorgan Chase & Co.
U.S. Bank National Association: Lakewood Ralphs Branch at 20137 Pioneer Boulevard, branch established on 2001/01/05; Woodruff Avenue Vons Branch at 4226 Woodruff Avenue, branch established on 2003/11/10. Info updated 2012/01/30: Bank assets: $330,470.8 mil, Deposits: $236,091.5 mil, headquarters in Cincinnati, OH, positive income , 3121 total offices , Holding Company: U.S. Bancorp
Citibank, National Association: East Carson Street Branch at 5525 Carson Street, branch established on 1945/01/01. Info updated 2012/01/10: Bank assets: $1,288,658.0 mil, Deposits: $882,541.0 mil, headquarters in Sioux Falls, SD, positive income , International Specialization, 1048 total offices , Holding Company: Citigroup Inc.
Farmers and Merchants Bank of Long Beach: Lakewood Branch at 5101 Lakewood Boulevard, branch established on 1966/07/30. Info updated 2006/11/03: Bank assets: $4,659.3 mil, Deposits: $3,393.5 mil, headquarters in Long Beach, CA, positive income , Commercial Lending Specialization, 22 total offices , Holding Company: Palomar Enterprises, Llc
Gateway Business Bank: Lakewood Branch at 4146 Woodruff Avenue, branch established on 2002/10/21. Info updated 2006/11/03: Bank assets: $201.3 mil, Deposits: $173.3 mil, headquarters in Cerritos, CA, negative income in the last year , Commercial Lending Specialization, 3 total offices , Holding Company: Gateway Bancorp
Bank of America, National Association: Lakewood Center Branch at 4705 Silva Street, branch established on 1955/06/27. Info updated 2009/11/18: Bank assets: $1,451,969.3 mil, Deposits: $1,077,176.8 mil, headquarters in Charlotte, NC, positive income , 5782 total offices , Holding Company: Bank Of America Corporation
Union Bank, National Association: Lakewood Branch at 5910 A South Street, branch established on 1967/11/03. Info updated 2011/09/01: Bank assets: $88,967.5 mil, Deposits: $65,286.4 mil, headquarters in San Francisco, CA, positive income , Commercial Lending Specialization, 403 total offices , Holding Company: Mitsubishi Ufj Financial Group, Inc.
Bank of the West: Lakewood Branch at 5240 Clark Avenue, branch established on 1959/06/05. Info updated 2009/11/16: Bank assets: $62,408.3 mil, Deposits: $43,995.2 mil, headquarters in San Francisco, CA, positive income , 647 total offices , Holding Company: Bnp Paribas
For population 15 years and over in Lakewood:
Never married: 36.4%Now married: 48.5%Separated: 1.6%Widowed: 5.7%Divorced: 7.9% For population 25 years and over in Lakewood:
High school or higher: 90.3%Bachelor's degree or higher: 32.3%Graduate or professional degree: 11.4%Unemployed: 5.0%Mean travel time to work (commute): 25.9 minutes
Education Gini index (Inequality in education) Here:
11.9California average:
15.5
Religion statistics for Lakewood, CA (based on Los Angeles County data)
Religion Adherents Congregations Catholic 3,542,994 275 Evangelical Protestant 814,611 3,249 Other 451,594 1,023 Mainline Protestant 229,056 860 Black Protestant 112,338 290 Orthodox 63,517 76 None 4,604,495 -
Source: Clifford Grammich, Kirk Hadaway, Richard Houseal, Dale E.Jones, Alexei Krindatch, Richie Stanley and Richard H.Taylor. 2012. 2010 U.S.Religion Census: Religious Congregations & Membership Study. Association of Statisticians of American Religious Bodies. Jones, Dale E., et al. 2002. Congregations and Membership in the United States 2000. Nashville, TN: Glenmary Research Center. Graphs represent county-level data
Food Environment Statistics: Number of grocery stores : 2,084Here :
2.12 / 10,000 pop.State :
2.14 / 10,000 pop.
Number of supercenters and club stores : 32Los Angeles County :
0.03 / 10,000 pop.State :
0.04 / 10,000 pop.
Number of convenience stores (no gas) : 567This county :
0.58 / 10,000 pop.California :
0.62 / 10,000 pop.
Number of convenience stores (with gas) : 1,206Los Angeles County :
1.23 / 10,000 pop.State :
1.49 / 10,000 pop.
Number of full-service restaurants : 7,008Los Angeles County :
7.15 / 10,000 pop.State :
7.42 / 10,000 pop.
Adult diabetes rate : Los Angeles County :
7.5%State :
7.3%
Adult obesity rate : This county :
20.4%California :
21.3%
Low-income preschool obesity rate : Here :
18.6%California :
17.9%
Health and Nutrition: Healthy diet rate : Lakewood:
51.7%State:
49.4%
Average overall health of teeth and gums : This city:
50.0%California:
48.0%
People feeling badly about themselves : Lakewood:
19.2%State:
20.2%
People not drinking alcohol at all : Lakewood:
11.8%California:
11.2%
Average hours sleeping at night : Lakewood:
6.8California:
6.8
Overweight people : Lakewood:
32.3%California:
31.5%
General health condition : Lakewood:
57.8%California:
56.4%
Average condition of hearing : Lakewood:
81.0%California:
80.9%
More about Health and Nutrition of Lakewood, CA Residents
Local government employment and payroll (March 2022)
Function
Full-time employees
Monthly full-time payroll
Average yearly full-time wage
Part-time employees
Monthly part-time payroll
Parks and Recreation
55 $566,614 $123,625 115 $149,661 Other Government Administration
30 $366,106 $146,442 14 $9,236 Streets and Highways
28 $320,155 $137,209 5 $14,880 Water Supply
18 $210,545 $140,363 0 $0 Financial Administration
17 $217,080 $153,233 1 $133 Other and Unallocable
12 $132,033 $132,033 27 $81,849 Police - Other
11 $126,524 $138,026 30 $44,405 Housing and Community Development (Local)
3 $39,835 $159,340 0 $0
Totals for Government
174 $1,978,892 $136,475 192 $300,164
Lakewood government finances - Expenditure in 2017 (per resident):
Construction - Regular Highways: $4,171,000 ($52.76)
Water Utilities: $1,528,000 ($19.33)Housing and Community Development: $1,453,000 ($18.38)Parks and Recreation: $1,203,000 ($15.22)Central Staff Services: $232,000 ($2.93)Current Operations - Water Utilities: $15,180,000 ($192.00)
Police Protection: $12,267,000 ($155.15)Parks and Recreation: $12,010,000 ($151.90)Central Staff Services: $8,706,000 ($110.11)Regular Highways: $5,966,000 ($75.46)Solid Waste Management: $5,065,000 ($64.06)Protective Inspection and Regulation - Other: $2,439,000 ($30.85)Financial Administration: $2,108,000 ($26.66)Transit Utilities: $1,996,000 ($25.25)Housing and Community Development: $1,034,000 ($13.08)Health - Other: $390,000 ($4.93)General - Other: $146,000 ($1.85)General - Interest on Debt: $94,000 ($1.19)
Other Capital Outlay - Housing and Community Development: $68,000 ($0.86)
General - Other: $1,000 ($0.01)Water Utilities - Interest on Debt: $43,000 ($0.54)
Lakewood government finances - Revenue in 2017 (per resident):
Charges - Solid Waste Management: $5,430,000 ($68.68)
Other: $1,652,000 ($20.89)Parks and Recreation: $892,000 ($11.28)Federal Intergovernmental - Housing and Community Development: $346,000 ($4.38)
Other: $98,000 ($1.24)Local Intergovernmental - Other: $556,000 ($7.03)
Miscellaneous - General Revenue - Other: $2,236,000 ($28.28)
Rents: $1,150,000 ($14.55)Fines and Forfeits: $724,000 ($9.16)Interest Earnings: $514,000 ($6.50)Sale of Property: $114,000 ($1.44)Donations From Private Sources: $39,000 ($0.49)Revenue - Water Utilities: $10,808,000 ($136.70)
State Intergovernmental - Other: $4,888,000 ($61.82)
Highways: $1,508,000 ($19.07)General Local Government Support: $29,000 ($0.37)Tax - General Sales and Gross Receipts: $17,719,000 ($224.11)
Property: $14,924,000 ($188.76)Public Utilities Sales: $4,745,000 ($60.02)Other License: $1,396,000 ($17.66)Occupation and Business License - Other: $642,000 ($8.12)Documentary and Stock Transfer: $347,000 ($4.39)Other Selective Sales: $67,000 ($0.85)
Lakewood government finances - Debt in 2017 (per resident):
Long Term Debt - Beginning Outstanding - Unspecified Public Purpose: $3,510,000 ($44.39)
Outstanding Unspecified Public Purpose: $1,982,000 ($25.07)Retired Unspecified Public Purpose: $1,527,000 ($19.31)
Lakewood government finances - Cash and Securities in 2017 (per resident):
Other Funds - Cash and Securities: $65,340,000 ($826.43)
Sinking Funds - Cash and Securities: $3,171,000 ($40.11)
2.98% of this county's 2021 resident taxpayers lived in other counties in 2020 ($81,235 average adjusted gross income )
Here:
2.98%California average:
5.19%
0.01% of residents moved from foreign countries ($155 average AGI )Los Angeles County:
0.01%California average:
0.03%
Top counties from which taxpayers relocated into this county between 2020 and 2021:
4.68% of this county's 2020 resident taxpayers moved to other counties in 2021 ($97,324 average adjusted gross income )
Here:
4.68%California average:
6.14%
0.01% of residents moved to foreign countries ($196 average AGI )Los Angeles County:
0.01%California average:
0.02%
Top counties to which taxpayers relocated from this county between 2020 and 2021:
Businesses in Lakewood, CA
Name Count Name Count
24 Hour Fitness 1 Jamba Juice 1 7-Eleven 6 Jones New York 2 99 Cents Only Stores 1 Journeys 1 ALDO 1 KFC 1 AT&T 3 Kohl's 1 Aeropostale 1 Kroger 2 Albertsons 1 Lane Bryant 1 American Eagle Outfitters 1 Lane Furniture 2 Arby's 2 LensCrafters 1 AutoZone 1 Little Caesars Pizza 1 Avenue 1 Macy's 1 Baja Fresh Mexican Grill 1 Marshalls 1 Bakers 1 McDonald's 7 Baskin-Robbins 1 Motherhood Maternity 2 Bath & Body Works 1 New Balance 1 Bed Bath & Beyond 1 New York & Co 1 Blockbuster 1 Nike 9 Burger King 1 Nordstrom 1 CVS 3 OfficeMax 1 Carl\s Jr. 3 Outback 1 Casual Male XL 1 Outback Steakhouse 1 Catherines 1 Pac Sun 1 Charlotte Russe 1 Panera Bread 1 Chipotle 1 Payless 2 Chuck E. Cheese's 1 Pizza Hut 2 Church's Chicken 1 Quiznos 1 Cinnabon 1 RadioShack 3 Cold Stone Creamery 1 Red Lobster 1 Costco 1 Rite Aid 1 Dairy Queen 1 Safeway 3 Dennys 3 Sears 1 Domino's Pizza 1 Sephora 1 El Pollo Loco 3 Spencer Gifts 1 Express 1 Sprint Nextel 2 Fashion Bug 1 Starbucks 7 FedEx 5 Subway 5 Foot Locker 1 T-Mobile 9 Forever 21 1 Taco Bell 2 Fredericks Of Hollywood 1 Target 1 GNC 2 Torrid 1 GameStop 4 UPS 2 Gap 1 Vans 6 H&R Block 4 Verizon Wireless 1 Hollister Co. 1 Victoria's Secret 1 Home Depot 1 Vons 3 HomeTown Buffet 1 Walgreens 2 Hot Topic 1 Walmart 1 IHOP 1 Wendy's 1 JCPenney 1 Wet Seal 1 Jack In The Box 3 YMCA 1
Strongest AM radio stations in Lakewood:
KFI (640 AM; 50 kW; LOS ANGELES, CA; Owner: CAPSTAR TX LIMITED PARTNERSHIP)
KNX (1070 AM; 50 kW; LOS ANGELES, CA; Owner: INFINITY BROADCASTING OPERATIONS, INC.)
KTNQ (1020 AM; 50 kW; LOS ANGELES, CA; Owner: KTNQ-AM LICENSE CORP.)
KLAC (570 AM; 50 kW; LOS ANGELES, CA; Owner: AMFM RADIO LICENSES, L.L.C.)
KFWB (980 AM; 50 kW; LOS ANGELES, CA; Owner: INFINITY BROADCASTING OPERATIONS, INC.)
KXTA (1150 AM; 50 kW; LOS ANGELES, CA; Owner: CITICASTERS LICENSES, L.P.)
KLTX (1390 AM; 5 kW; LONG BEACH, CA; Owner: HI-FAVOR BROADCASTING, LLC)
KMPC (1540 AM; 50 kW; LOS ANGELES, CA; Owner: ROSE CITY RADIO CORPORATION)
KDIS (1110 AM; 50 kW; PASADENA, CA; Owner: ABC,INC.)
KBLA (1580 AM; 50 kW; SANTA MONICA, CA)
KSPN (710 AM; 50 kW; LOS ANGELES, CA; Owner: KABC-AM RADIO, INC.)
KXMX (1190 AM; 25 kW; ANAHEIM, CA; Owner: NEW INSPIRATION BROADCASTING COMPANY)
KPLS (830 AM; 50 kW; ORANGE, CA; Owner: CRN LICENSES, LLC)
Strongest FM radio stations in Lakewood:
KLAX-FM (97.9 FM; EAST LOS ANGELES, CA; Owner: KLAX LICENSING, INC.)
KKJZ (88.1 FM; LONG BEACH, CA; Owner: CALIF. STATE UNIV LONG BEACH FOUND.)
KZLA-FM (93.9 FM; LOS ANGELES, CA; Owner: EMMIS RADIO LICENSE CORPORATION)
KPWR (105.9 FM; LOS ANGELES, CA; Owner: EMMIS RADIO LICENSE CORPORATION)
KLSX (97.1 FM; LOS ANGELES, CA; Owner: INFINITY BROADCASTING OPERATIONS, INC.)
KUSC (91.5 FM; LOS ANGELES, CA; Owner: UNIVERSITY OF SOUTHERN CALIFORNIA)
KKLA-FM (99.5 FM; LOS ANGELES, CA; Owner: NEW INSPIRATION BROADCASTING CO., INC.)
KCBS-FM (93.1 FM; LOS ANGELES, CA; Owner: INFINITY BROADCASTING OPERATIONS, INC.)
KBUE (105.5 FM; LONG BEACH, CA; Owner: LBI RADIO LICENSE CORP.)
KKBT (100.3 FM; LOS ANGELES, CA; Owner: RADIO ONE LICENSES, LLC)
KRTH-FM (101.1 FM; LOS ANGELES, CA; Owner: INFINITY BROADCASTING OPERATIONS, INC.)
KSCA (101.9 FM; GLENDALE, CA; Owner: HBC LICENSE CORPORATION)
KLOS (95.5 FM; LOS ANGELES, CA; Owner: KLOS-FM RADIO, INC.)
K212FA (90.3 FM; TEMPLE CITY, CA; Owner: EDUCATIONAL MEDIA FOUNDATION)
KOST (103.5 FM; LOS ANGELES, CA; Owner: CAPSTAR TX LIMITED PARTNERSHIP)
KIIS-FM (102.7 FM; LOS ANGELES, CA; Owner: CITICASTERS LICENSES, L.P.)
KLVE (107.5 FM; LOS ANGELES, CA; Owner: KLVE-FM LICENSE CORP.)
KPCC (89.3 FM; PASADENA, CA; Owner: PASADENA AREA COMMUNITY COLLEGE DISTRICT)
KHHT (92.3 FM; LOS ANGELES, CA; Owner: AMFM RADIO LICENSES, L.L.C.)
KBIG-FM (104.3 FM; LOS ANGELES, CA; Owner: AMFM RADIO LICENSES, L.L.C.)
TV broadcast stations around Lakewood:
KTRO-LP (Channel 50; LANCASTER, CA; Owner: ROBERT D. ADELMAN)
KCBS-TV (Channel 2; LOS ANGELES, CA; Owner: CBS BROADCASTING INC.)
KTLA-TV (Channel 5; LOS ANGELES, CA; Owner: KTLA INC.)
KABC-TV (Channel 7; LOS ANGELES, CA; Owner: ABC HOLDING COMPANY, INC.)
KCAL-TV (Channel 9; LOS ANGELES, CA; Owner: VIACOM TELEVISION STATIONS GROUP OF LOS ANGELES LLC)
KNBC (Channel 4; LOS ANGELES, CA; Owner: NBC SUBSIDIARY (KNBC-TV), INC.)
KMEX-TV (Channel 34; LOS ANGELES, CA; Owner: KMEX LICENSE PARTNERSHIP, G.P.)
KAZA-TV (Channel 54; AVALON, CA; Owner: PAPPAS SOUTHERN CALIFORNIA LICENSE LLC)
KDOC-TV (Channel 56; ANAHEIM, CA; Owner: GOLDEN ORANGE BROADCASTING CO., INC.)
KOCE-TV (Channel 50; HUNTINGTON BEACH, CA; Owner: BD. OF TRUSTEES, COAST COMMUNITY COLLEGE DIST.)
KSCI (Channel 18; LONG BEACH, CA; Owner: KSLS, INC.)
National Bridge Inventory (NBI) Statistics 23 Number of bridges154ft / 47.0m Total length1,022,882 Total average daily traffic45,147 Total average daily truck traffic
New bridges - historical statistics
1 1930-1939 6 1950-1959 10 1960-1969 5 1970-1979 1 1990-1999
See full National Bridge Inventory statistics for Lakewood, CA
Home Mortgage Disclosure Act Aggregated Statistics For Year 2009(Based on 15 full and 4 partial tracts) A) FHA, FSA/RHS & VA B) Conventional C) Refinancings D) Home Improvement Loans E) Loans on Dwellings For 5+ Families F) Non-occupant Loans on G) Loans On Manufactured Number Average Value Number Average Value Number Average Value Number Average Value Number Average Value Number Average Value Number Average Value
LOANS ORIGINATED 309 $366,849 315 $281,781 1,863 $283,847 111 $213,160 3 $1,946,840 99 $220,517 0 $0 APPLICATIONS APPROVED, NOT ACCEPTED 28 $376,190 32 $277,156 192 $319,147 20 $113,611 0 $0 9 $184,493 1 $75,000 APPLICATIONS DENIED 30 $382,846 48 $308,595 498 $324,543 46 $143,854 0 $0 35 $276,160 3 $90,000 APPLICATIONS WITHDRAWN 47 $369,307 58 $297,857 390 $310,402 17 $180,004 1 $292,350 19 $221,087 0 $0 FILES CLOSED FOR INCOMPLETENESS 6 $397,230 15 $340,216 97 $320,166 7 $220,749 0 $0 2 $233,175 0 $0
Aggregated Statistics For Year 2008(Based on 15 full and 4 partial tracts) A) FHA, FSA/RHS & VA B) Conventional C) Refinancings D) Home Improvement Loans E) Loans on Dwellings For 5+ Families F) Non-occupant Loans on G) Loans On Manufactured Number Average Value Number Average Value Number Average Value Number Average Value Number Average Value Number Average Value Number Average Value
LOANS ORIGINATED 200 $397,446 441 $322,184 880 $289,683 120 $130,024 4 $4,432,160 91 $237,134 7 $73,346 APPLICATIONS APPROVED, NOT ACCEPTED 17 $366,891 99 $318,993 234 $315,877 33 $146,749 1 $700,000 22 $276,428 8 $97,260 APPLICATIONS DENIED 48 $398,284 157 $344,312 671 $358,330 128 $128,612 1 $1,200,000 58 $270,537 9 $75,747 APPLICATIONS WITHDRAWN 38 $385,598 87 $331,127 256 $319,534 30 $123,018 0 $0 23 $263,530 1 $277,000 FILES CLOSED FOR INCOMPLETENESS 11 $373,013 26 $370,799 73 $345,611 11 $125,251 0 $0 7 $251,794 0 $0
Aggregated Statistics For Year 2007(Based on 15 full and 4 partial tracts) A) FHA, FSA/RHS & VA B) Conventional C) Refinancings D) Home Improvement Loans E) Loans on Dwellings For 5+ Families F) Non-occupant Loans on G) Loans On Manufactured Number Average Value Number Average Value Number Average Value Number Average Value Number Average Value Number Average Value Number Average Value
LOANS ORIGINATED 4 $338,402 811 $309,837 1,923 $321,397 311 $204,071 13 $1,877,007 157 $279,986 3 $68,667 APPLICATIONS APPROVED, NOT ACCEPTED 0 $0 184 $310,780 441 $353,117 85 $175,122 1 $234,810 40 $286,339 10 $67,956 APPLICATIONS DENIED 1 $349,000 361 $342,030 1,220 $379,348 207 $196,439 0 $0 86 $309,640 11 $70,887 APPLICATIONS WITHDRAWN 0 $0 148 $339,459 517 $355,526 60 $227,297 1 $59,000 40 $345,383 0 $0 FILES CLOSED FOR INCOMPLETENESS 0 $0 48 $331,803 218 $364,054 17 $190,245 1 $650,000 12 $316,029 0 $0
Aggregated Statistics For Year 2006(Based on 15 full and 4 partial tracts) A) FHA, FSA/RHS & VA B) Conventional C) Refinancings D) Home Improvement Loans E) Loans on Dwellings For 5+ Families F) Non-occupant Loans on G) Loans On Manufactured Number Average Value Number Average Value Number Average Value Number Average Value Number Average Value Number Average Value Number Average Value
LOANS ORIGINATED 1 $255,480 1,513 $308,033 2,786 $320,568 474 $215,912 9 $10,408,631 238 $312,433 3 $59,117 APPLICATIONS APPROVED, NOT ACCEPTED 0 $0 295 $305,305 490 $321,116 69 $171,182 0 $0 38 $289,981 5 $62,944 APPLICATIONS DENIED 0 $0 525 $326,750 1,234 $364,067 217 $177,955 2 $461,385 76 $308,889 4 $86,290 APPLICATIONS WITHDRAWN 0 $0 253 $326,747 877 $347,543 101 $247,500 0 $0 49 $295,454 0 $0 FILES CLOSED FOR INCOMPLETENESS 0 $0 83 $292,416 201 $368,741 27 $243,168 0 $0 10 $351,332 0 $0
Aggregated Statistics For Year 2005(Based on 15 full and 4 partial tracts) A) FHA, FSA/RHS & VA B) Conventional C) Refinancings D) Home Improvement Loans E) Loans on Dwellings For 5+ Families F) Non-occupant Loans on G) Loans On Manufactured Number Average Value Number Average Value Number Average Value Number Average Value Number Average Value Number Average Value Number Average Value
LOANS ORIGINATED 2 $246,980 1,679 $302,473 3,624 $308,513 512 $192,317 19 $4,067,298 300 $280,095 6 $231,333 APPLICATIONS APPROVED, NOT ACCEPTED 0 $0 282 $299,656 579 $307,553 75 $174,871 1 $526,230 59 $307,019 3 $112,687 APPLICATIONS DENIED 1 $179,360 435 $299,589 1,114 $326,944 213 $179,848 1 $300,000 72 $328,861 7 $140,011 APPLICATIONS WITHDRAWN 0 $0 329 $291,217 1,158 $319,697 157 $197,187 1 $1,795,030 84 $299,459 1 $520,000 FILES CLOSED FOR INCOMPLETENESS 0 $0 83 $323,035 337 $328,634 26 $136,388 1 $380,060 13 $265,804 0 $0
Aggregated Statistics For Year 2004(Based on 15 full and 4 partial tracts) A) FHA, FSA/RHS & VA B) Conventional C) Refinancings D) Home Improvement Loans E) Loans on Dwellings For 5+ Families F) Non-occupant Loans on G) Loans On Manufactured Number Average Value Number Average Value Number Average Value Number Average Value Number Average Value Number Average Value Number Average Value
LOANS ORIGINATED 7 $239,970 1,698 $261,693 4,027 $255,949 561 $160,493 48 $3,128,791 304 $235,330 8 $79,249 APPLICATIONS APPROVED, NOT ACCEPTED 0 $0 261 $258,666 662 $253,734 68 $145,772 1 $500,000 58 $243,505 3 $55,000 APPLICATIONS DENIED 4 $190,232 328 $263,076 1,027 $256,021 236 $112,848 1 $170,870 69 $222,277 5 $60,746 APPLICATIONS WITHDRAWN 1 $118,110 238 $247,540 980 $256,669 136 $142,117 2 $27,234,545 38 $221,504 1 $59,110 FILES CLOSED FOR INCOMPLETENESS 0 $0 73 $287,435 484 $267,987 45 $136,233 0 $0 17 $234,198 0 $0
Aggregated Statistics For Year 2003(Based on 15 full and 4 partial tracts) A) FHA, FSA/RHS & VA B) Conventional C) Refinancings D) Home Improvement Loans E) Loans on Dwellings For 5+ Families F) Non-occupant Loans on Number Average Value Number Average Value Number Average Value Number Average Value Number Average Value Number Average Value
LOANS ORIGINATED 36 $204,684 1,644 $213,333 7,330 $199,454 220 $67,239 15 $1,137,737 424 $172,965 APPLICATIONS APPROVED, NOT ACCEPTED 3 $139,633 207 $204,673 952 $199,711 62 $82,308 0 $0 80 $194,688 APPLICATIONS DENIED 4 $193,608 254 $207,959 1,551 $212,320 138 $57,788 1 $793,280 102 $194,181 APPLICATIONS WITHDRAWN 2 $254,995 177 $220,451 1,367 $211,744 47 $48,927 1 $1,400,000 47 $157,399 FILES CLOSED FOR INCOMPLETENESS 3 $202,240 64 $232,431 324 $212,008 22 $70,236 0 $0 14 $177,084
Aggregated Statistics For Year 2002(Based on 13 full and 2 partial tracts) A) FHA, FSA/RHS & VA B) Conventional C) Refinancings D) Home Improvement Loans E) Loans on Dwellings For 5+ Families F) Non-occupant Loans on Number Average Value Number Average Value Number Average Value Number Average Value Number Average Value Number Average Value
LOANS ORIGINATED 65 $204,880 1,252 $188,780 4,365 $184,233 133 $55,980 6 $1,009,947 207 $153,666 APPLICATIONS APPROVED, NOT ACCEPTED 6 $189,447 144 $193,459 624 $184,880 46 $47,199 0 $0 42 $165,137 APPLICATIONS DENIED 7 $200,171 145 $171,698 867 $174,402 76 $46,488 1 $524,370 29 $135,088 APPLICATIONS WITHDRAWN 10 $205,473 122 $177,087 708 $186,221 41 $48,461 1 $596,000 23 $149,603 FILES CLOSED FOR INCOMPLETENESS 4 $238,000 25 $202,756 442 $185,676 4 $79,992 0 $0 7 $154,627
Aggregated Statistics For Year 2001(Based on 13 full and 2 partial tracts) A) FHA, FSA/RHS & VA B) Conventional C) Refinancings D) Home Improvement Loans E) Loans on Dwellings For 5+ Families F) Non-occupant Loans on Number Average Value Number Average Value Number Average Value Number Average Value Number Average Value Number Average Value
LOANS ORIGINATED 235 $208,505 1,041 $164,116 2,971 $167,530 122 $34,175 11 $612,846 147 $148,758 APPLICATIONS APPROVED, NOT ACCEPTED 11 $202,979 97 $164,490 435 $164,947 43 $37,628 0 $0 20 $137,330 APPLICATIONS DENIED 20 $178,352 159 $157,640 889 $156,889 116 $27,414 1 $219,930 26 $152,748 APPLICATIONS WITHDRAWN 18 $197,368 112 $160,220 697 $161,633 58 $38,262 0 $0 23 $153,002 FILES CLOSED FOR INCOMPLETENESS 7 $204,677 20 $172,988 228 $166,179 6 $44,445 2 $1,190,730 10 $132,509
Aggregated Statistics For Year 2000(Based on 13 full and 2 partial tracts) A) FHA, FSA/RHS & VA B) Conventional C) Refinancings D) Home Improvement Loans E) Loans on Dwellings For 5+ Families F) Non-occupant Loans on Number Average Value Number Average Value Number Average Value Number Average Value Number Average Value Number Average Value
LOANS ORIGINATED 228 $195,369 809 $152,612 799 $133,560 138 $34,858 5 $656,130 70 $133,062 APPLICATIONS APPROVED, NOT ACCEPTED 15 $213,057 77 $160,432 182 $128,097 92 $28,121 0 $0 9 $81,679 APPLICATIONS DENIED 27 $178,464 185 $168,440 486 $120,138 101 $31,023 3 $161,387 14 $120,184 APPLICATIONS WITHDRAWN 25 $196,185 113 $151,934 219 $110,710 25 $34,409 0 $0 3 $60,587 FILES CLOSED FOR INCOMPLETENESS 4 $156,455 45 $153,710 120 $159,744 4 $30,775 1 $584,700 4 $98,312
Aggregated Statistics For Year 1999(Based on 10 full and 7 partial tracts) A) FHA, FSA/RHS & VA B) Conventional C) Refinancings D) Home Improvement Loans E) Loans on Dwellings For 5+ Families F) Non-occupant Loans on Number Average Value Number Average Value Number Average Value Number Average Value Number Average Value Number Average Value
LOANS ORIGINATED 402 $177,607 774 $142,289 1,650 $131,203 204 $27,708 11 $445,286 133 $115,368 APPLICATIONS APPROVED, NOT ACCEPTED 13 $156,427 82 $153,956 314 $137,090 111 $26,773 6 $156,000 22 $113,680 APPLICATIONS DENIED 46 $173,076 182 $162,296 696 $119,141 157 $26,789 5 $121,168 40 $115,388 APPLICATIONS WITHDRAWN 34 $155,332 112 $140,211 409 $131,376 20 $33,732 3 $211,990 17 $139,112 FILES CLOSED FOR INCOMPLETENESS 10 $171,135 21 $150,513 174 $147,892 4 $31,772 5 $3,877,550 7 $109,493
Detailed mortgage data for all 19 tracts in Lakewood, CA
Private Mortgage Insurance Companies Aggregated Statistics For Year 2009(Based on 15 full and 4 partial tracts) A) Conventional B) Refinancings Number Average Value Number Average Value
LOANS ORIGINATED 63 $341,903 22 $362,759 APPLICATIONS APPROVED, NOT ACCEPTED 25 $360,864 17 $399,025 APPLICATIONS DENIED 10 $308,704 10 $338,841 APPLICATIONS WITHDRAWN 3 $315,970 1 $314,780 FILES CLOSED FOR INCOMPLETENESS 3 $362,900 1 $325,000
Aggregated Statistics For Year 2008(Based on 15 full and 4 partial tracts) A) Conventional B) Refinancings C) Non-occupant Loans on Number Average Value Number Average Value Number Average Value
LOANS ORIGINATED 199 $375,497 32 $411,338 0 $0 APPLICATIONS APPROVED, NOT ACCEPTED 58 $384,158 36 $468,330 2 $210,000 APPLICATIONS DENIED 25 $385,569 6 $406,667 4 $407,648 APPLICATIONS WITHDRAWN 10 $365,783 10 $420,177 0 $0 FILES CLOSED FOR INCOMPLETENESS 2 $372,000 1 $465,000 0 $0
Aggregated Statistics For Year 2007(Based on 15 full and 4 partial tracts) A) Conventional B) Refinancings C) Non-occupant Loans on Number Average Value Number Average Value Number Average Value
LOANS ORIGINATED 47 $429,974 38 $470,376 3 $392,333 APPLICATIONS APPROVED, NOT ACCEPTED 9 $395,053 16 $468,093 1 $548,180 APPLICATIONS DENIED 3 $356,483 1 $262,430 0 $0 APPLICATIONS WITHDRAWN 6 $468,325 5 $544,286 0 $0 FILES CLOSED FOR INCOMPLETENESS 1 $437,000 1 $472,000 0 $0
Aggregated Statistics For Year 2006(Based on 13 full and 4 partial tracts) A) Conventional B) Refinancings C) Non-occupant Loans on Number Average Value Number Average Value Number Average Value
LOANS ORIGINATED 17 $532,472 21 $499,161 2 $478,305 APPLICATIONS APPROVED, NOT ACCEPTED 3 $515,500 4 $444,838 0 $0 APPLICATIONS DENIED 5 $551,990 0 $0 0 $0 APPLICATIONS WITHDRAWN 3 $465,790 2 $402,200 0 $0 FILES CLOSED FOR INCOMPLETENESS 0 $0 0 $0 0 $0
Aggregated Statistics For Year 2005(Based on 14 full and 4 partial tracts) A) Conventional B) Refinancings C) Non-occupant Loans on Number Average Value Number Average Value Number Average Value
LOANS ORIGINATED 28 $423,726 34 $401,519 2 $361,030 APPLICATIONS APPROVED, NOT ACCEPTED 4 $393,282 5 $411,880 0 $0 APPLICATIONS DENIED 1 $180,670 1 $477,000 0 $0 APPLICATIONS WITHDRAWN 4 $370,538 0 $0 2 $358,625 FILES CLOSED FOR INCOMPLETENESS 1 $374,000 0 $0 0 $0
Aggregated Statistics For Year 2004(Based on 15 full and 4 partial tracts) A) Conventional B) Refinancings C) Non-occupant Loans on Number Average Value Number Average Value Number Average Value
LOANS ORIGINATED 48 $335,656 36 $318,075 5 $327,032 APPLICATIONS APPROVED, NOT ACCEPTED 16 $331,949 34 $280,525 1 $425,620 APPLICATIONS DENIED 5 $297,854 0 $0 0 $0 APPLICATIONS WITHDRAWN 3 $362,313 4 $279,900 0 $0 FILES CLOSED FOR INCOMPLETENESS 1 $470,000 1 $327,000 0 $0
Aggregated Statistics For Year 2003(Based on 15 full and 4 partial tracts) A) Conventional B) Refinancings C) Non-occupant Loans on Number Average Value Number Average Value Number Average Value
LOANS ORIGINATED 156 $282,900 191 $255,248 8 $286,620 APPLICATIONS APPROVED, NOT ACCEPTED 34 $267,536 79 $253,586 5 $251,058 APPLICATIONS DENIED 3 $282,333 3 $274,000 0 $0 APPLICATIONS WITHDRAWN 7 $260,851 12 $267,637 3 $201,273 FILES CLOSED FOR INCOMPLETENESS 1 $234,000 3 $273,600 0 $0
Aggregated Statistics For Year 2002(Based on 13 full and 2 partial tracts) A) Conventional B) Refinancings C) Non-occupant Loans on Number Average Value Number Average Value Number Average Value
LOANS ORIGINATED 232 $249,716 212 $237,512 6 $247,087 APPLICATIONS APPROVED, NOT ACCEPTED 39 $235,920 87 $229,243 1 $54,380 APPLICATIONS DENIED 7 $250,391 5 $287,600 0 $0 APPLICATIONS WITHDRAWN 4 $163,390 17 $228,228 1 $140,330 FILES CLOSED FOR INCOMPLETENESS 3 $236,000 2 $203,920 0 $0
Aggregated Statistics For Year 2001(Based on 13 full and 2 partial tracts) A) Conventional B) Refinancings C) Non-occupant Loans on Number Average Value Number Average Value Number Average Value
LOANS ORIGINATED 266 $221,092 255 $213,991 8 $185,912 APPLICATIONS APPROVED, NOT ACCEPTED 42 $209,150 55 $209,822 2 $186,665 APPLICATIONS DENIED 11 $232,664 8 $210,238 0 $0 APPLICATIONS WITHDRAWN 9 $207,906 5 $244,490 0 $0 FILES CLOSED FOR INCOMPLETENESS 2 $162,000 2 $205,000 2 $162,000
Aggregated Statistics For Year 2000(Based on 13 full and 2 partial tracts) A) Conventional B) Refinancings C) Non-occupant Loans on Number Average Value Number Average Value Number Average Value
LOANS ORIGINATED 211 $196,106 81 $183,425 7 $171,170 APPLICATIONS APPROVED, NOT ACCEPTED 35 $186,661 29 $197,112 1 $159,000 APPLICATIONS DENIED 14 $212,856 5 $223,800 0 $0 APPLICATIONS WITHDRAWN 5 $247,678 5 $194,594 0 $0 FILES CLOSED FOR INCOMPLETENESS 2 $181,000 0 $0 0 $0
Aggregated Statistics For Year 1999(Based on 10 full and 7 partial tracts) A) Conventional B) Refinancings C) Non-occupant Loans on Number Average Value Number Average Value Number Average Value
LOANS ORIGINATED 283 $179,358 270 $172,845 5 $126,190 APPLICATIONS APPROVED, NOT ACCEPTED 29 $167,390 82 $170,532 2 $142,095 APPLICATIONS DENIED 25 $182,470 13 $173,683 1 $105,350 APPLICATIONS WITHDRAWN 12 $163,852 17 $165,853 0 $0 FILES CLOSED FOR INCOMPLETENESS 4 $213,930 5 $175,326 0 $0
Most common first names in Lakewood, CA among deceased individuals Name Count Lived (average)
John 451 73.6 years Mary 391 78.3 years Robert 369 70.2 years William 348 72.8 years James 274 70.5 years Charles 221 73.1 years George 217 74.6 years Helen 168 77.7 years Margaret 167 78.7 years Ruth 153 77.2 years
Most common last names in Lakewood, CA among deceased individuals Last name Count Lived (average)
Smith 167 75.3 years Johnson 122 74.8 years Brown 87 73.9 years Jones 87 76.6 years Miller 83 73.0 years Williams 72 75.7 years Davis 71 76.2 years Anderson 69 77.7 years Wilson 68 73.9 years White 53 77.3 years
Lakewood compared to California state average:
Unemployed percentage significantly below state average. Black race population percentage above state average. Median age above state average. Renting percentage below state average. House age above state average. Lakewood, CA compared to other similar cities:
#11 on the list of "Top 101 cities with the smallest house values disparities (population 50,000+)"
#17 on the list of "Top 101 cities with largest percentage of males in occupations: fire fighting and prevention workers including supervisors (population 50,000+)"
#17 on the list of "Top 100 most racially diverse cities (pop. 50,000+)"
#22 on the list of "Top 101 cities with largest percentage of males in industries: transportation and warehousing (population 50,000+)"
#24 on the list of "Top 101 cities with the largest percentage of one, detached housing units in structures (20,000+ housing units)"
#26 on the list of "Top 101 cities with the largest percentage of likely lesbian couples (counted as self-reported female-female unmarried-partner households) (population 50,000+)"
#31 on the list of "Top 101 cities with largest percentage of males in occupations: health technologists and technicians (population 50,000+)"
#35 on the list of "Top 101 cities with largest percentage of males in occupations: community and social service occupations (population 50,000+)"
#37 on the list of "Top 101 cities with largest percentage of females in occupations: office and administrative support occupations (population 50,000+)"
#45 on the list of "Top 101 cities with the least people having Doctorate degrees (population 50,000+)"
#56 on the list of "Top 101 cities with largest percentage of females in industries: information (population 50,000+)"
#61 on the list of "Top 101 cities with largest percentage of males in industries: arts, entertainment, and recreation (population 50,000+)"
#63 on the list of "Top 100 low-educated but high-earning cities (pop. 50,000+)"
#64 on the list of "Top 101 cities with fewest building permits per 10,000 residents (population 50,000+)"
#68 on the list of "Top 101 cities that people commute from (largest negative percentage daily daytime population change due to commuting) (population 50,000+)"
#74 on the list of "Top 101 cities with the lowest average snowfall in a year (population 50,000+)"
#85 on the list of "Top 101 cities with the largest percentage of likely homosexual households (counted as self-reported same-sex unmarried-partner households) (population 50,000+)"
#90 on the list of "Top 101 cities with largest percentage of males in occupations: architecture and engineering occupations (population 50,000+)"
#95 on the list of "Top 101 cities with largest percentage of females in occupations: health diagnosing and treating practitioners and other technical occupations (population 50,000+)"
#95 on the list of "Top 101 cities with largest percentage of females in industries: public administration (population 50,000+)"
#1 on the list of "Top 101 counties with the most Evangelical Protestant congregations"
#1 on the list of "Top 101 counties with the most Mainline Protestant congregations"
#1 on the list of "Top 101 counties with the most Orthodox adherents"
#1 on the list of "Top 101 counties with the highest ground withdrawal of fresh water for public supply (pop. 50,000+)"
#1 on the list of "Top 101 counties with the most Catholic adherents (pop. 50,000+)"
Top Patent Applicants
Matthew Ibarra (16)
Louis J. Finkle (13)
Chong Pak (12)
Joseph Kelly (10)
Ioulia Smorchkova (9)
Albert Romo (8)
Arin N. Holecek (7)
William P. Keith (7)
Jonathan Isaac Strietzel (4)
Richard W. Parks (4)
Total of 270 patent applications in 2008-2024.
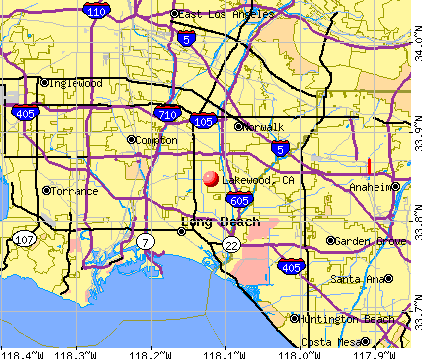


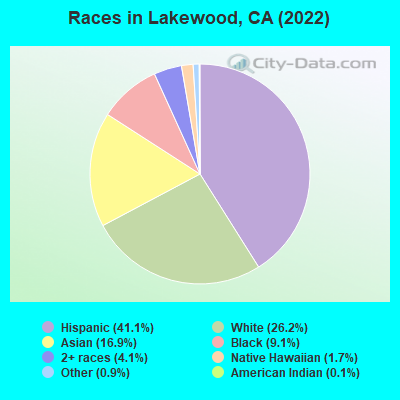
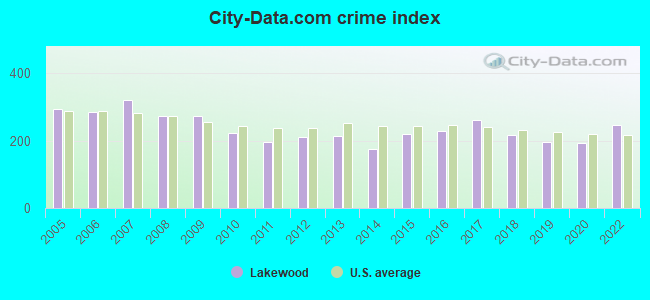
 Recent articles from our blog. Our writers, many of them Ph.D. graduates or candidates, create easy-to-read articles on a wide variety of topics.

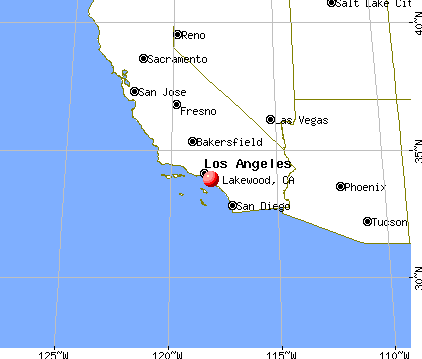
 (3.7 miles
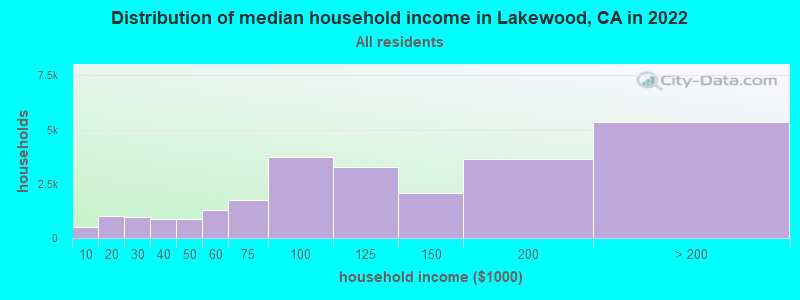
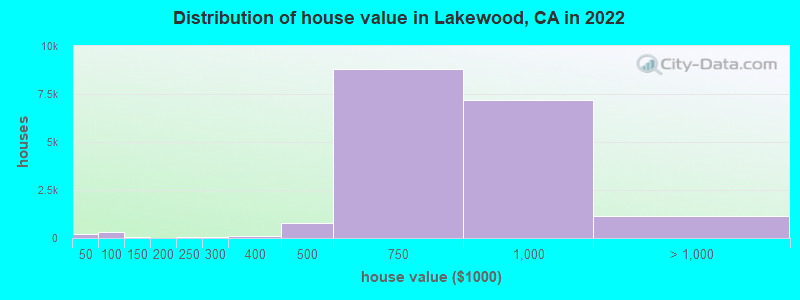
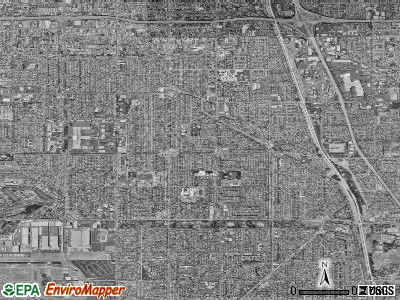
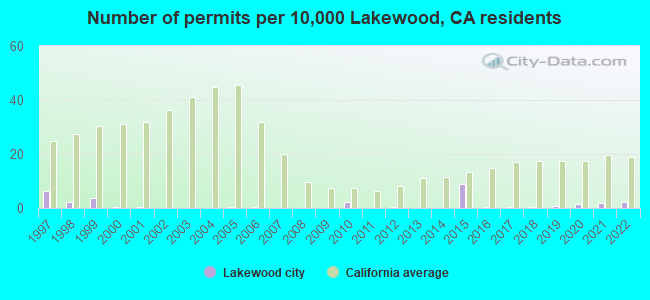
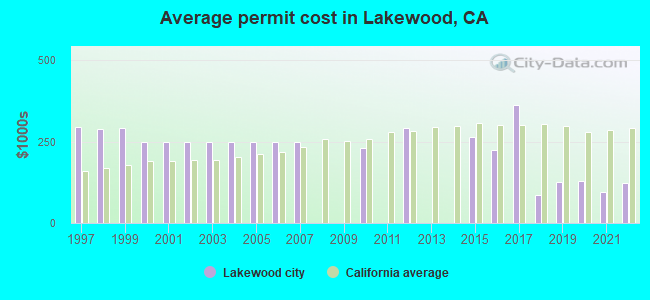
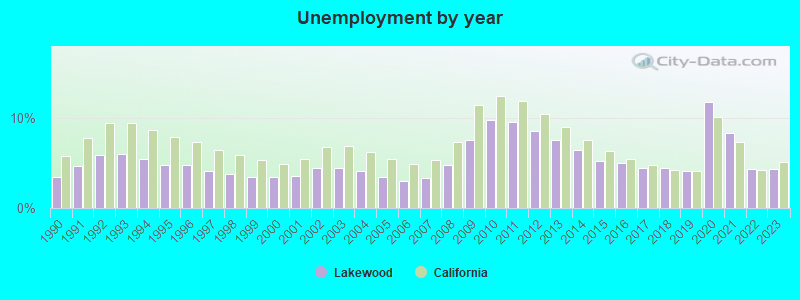
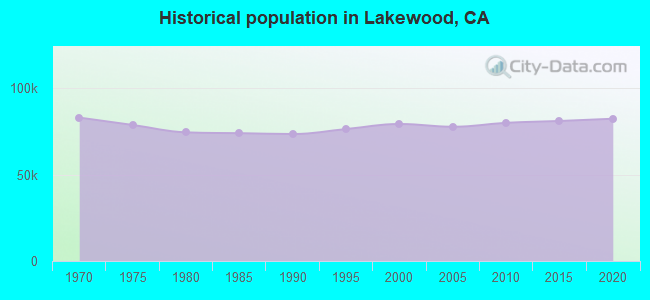
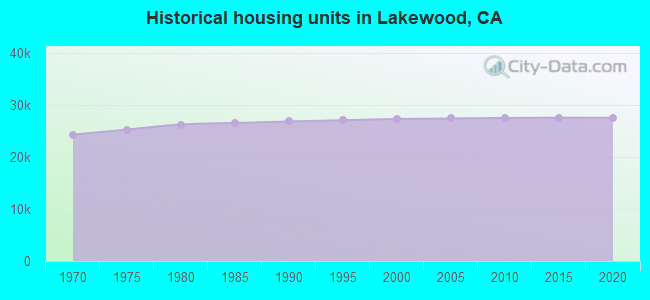
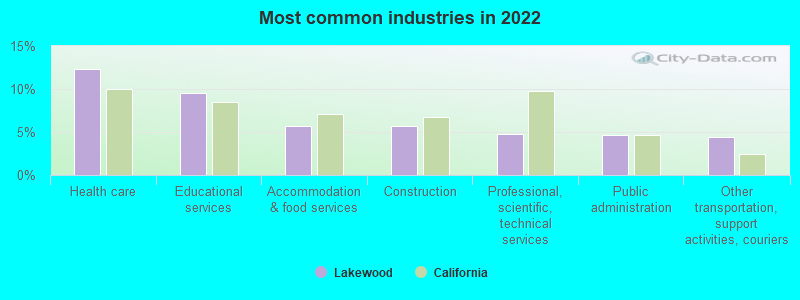
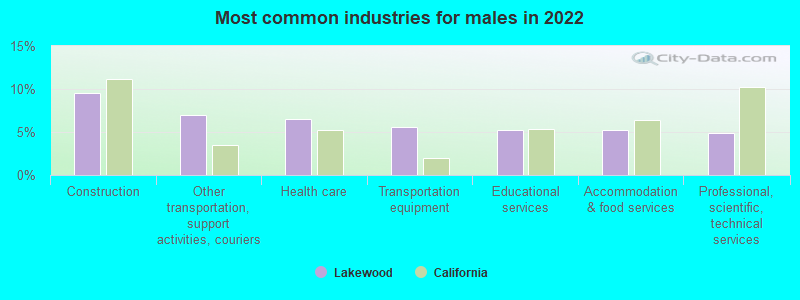
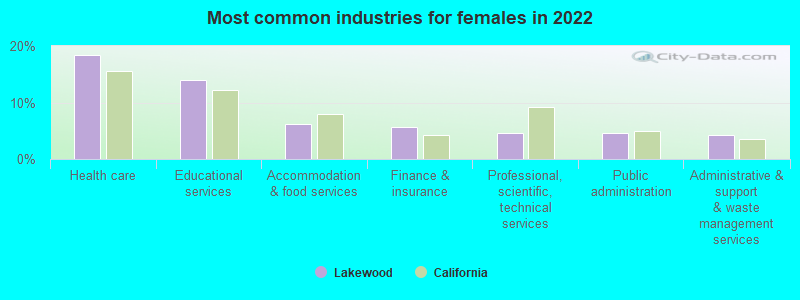
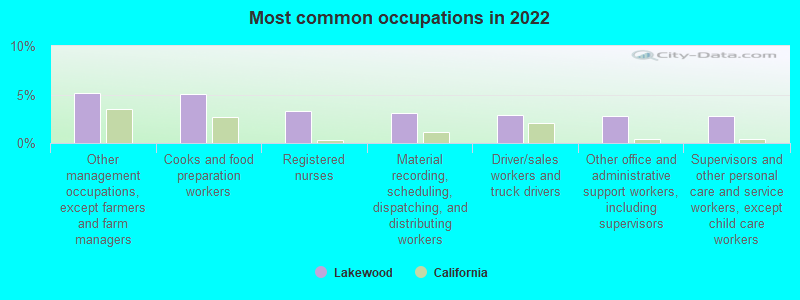
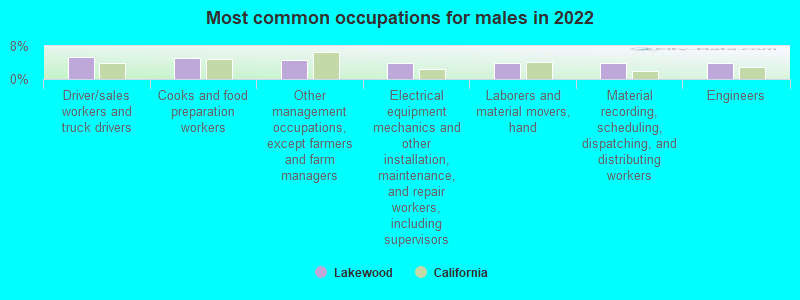
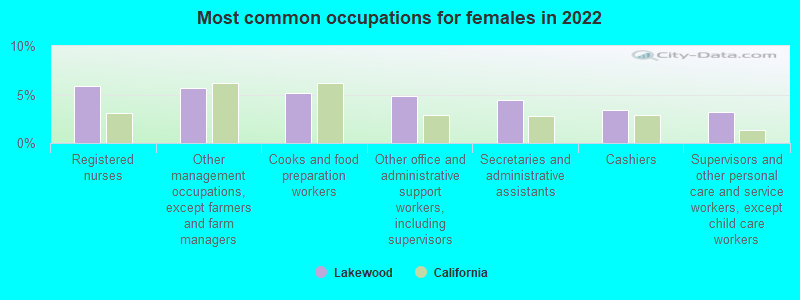
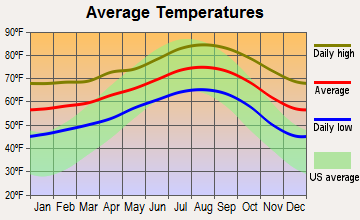
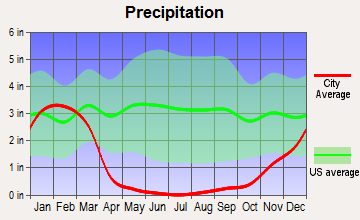
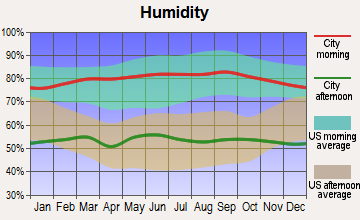
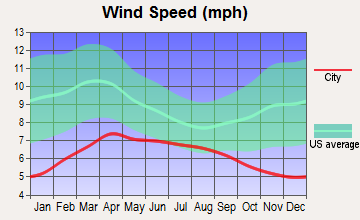
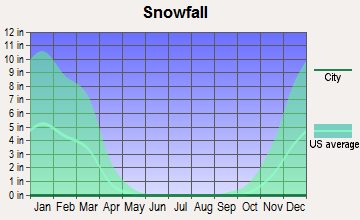
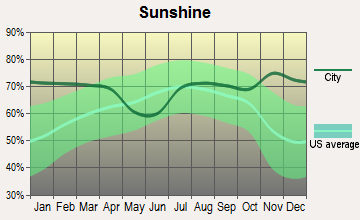
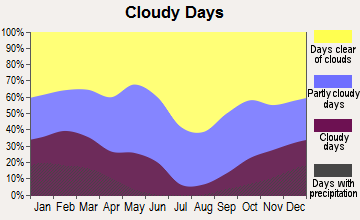
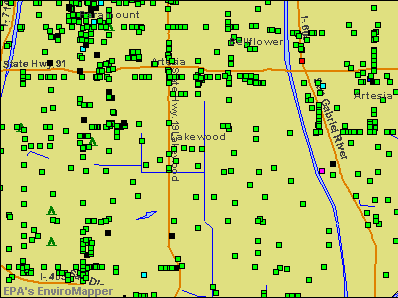

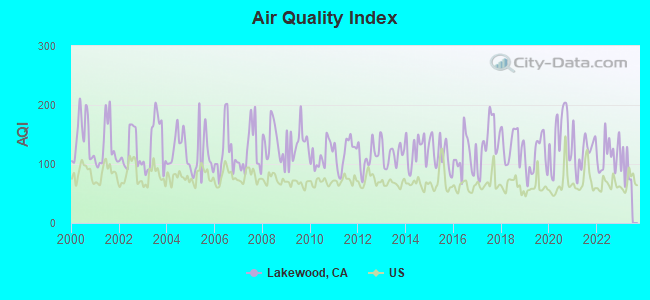
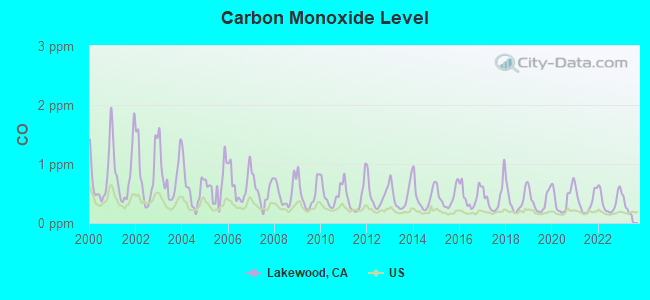
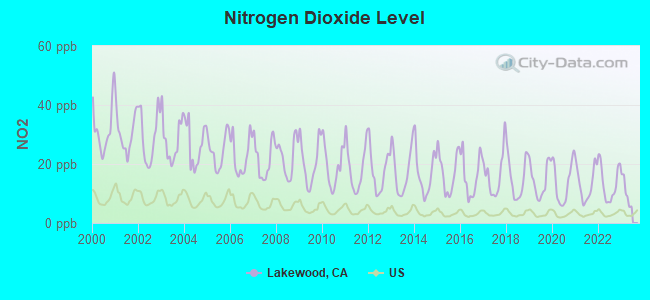
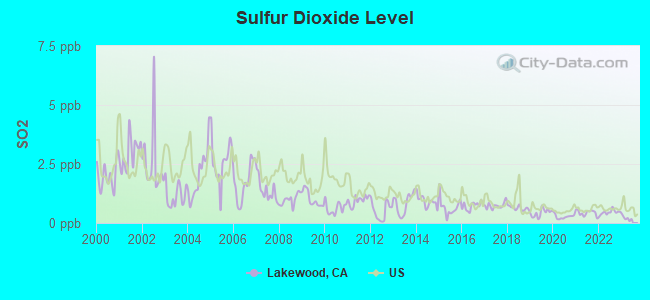
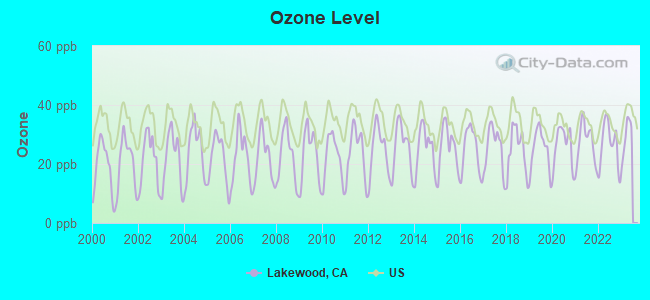
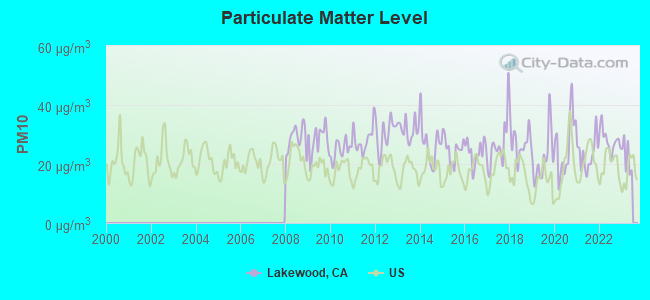
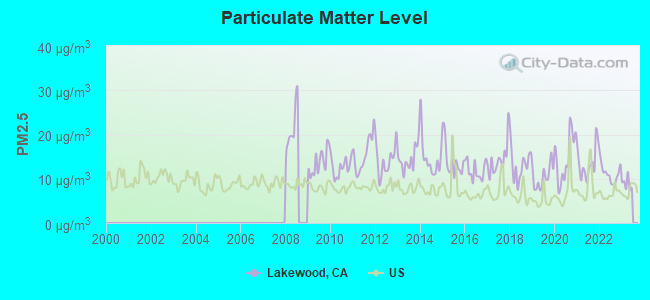
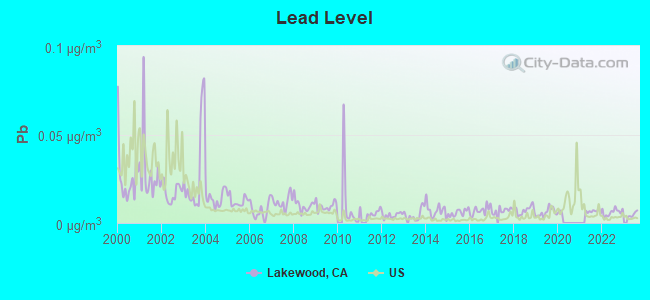
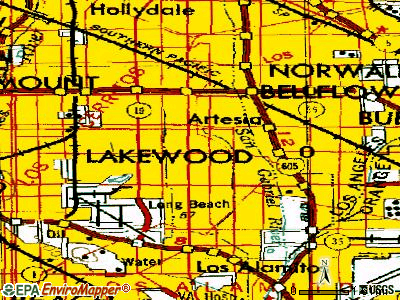
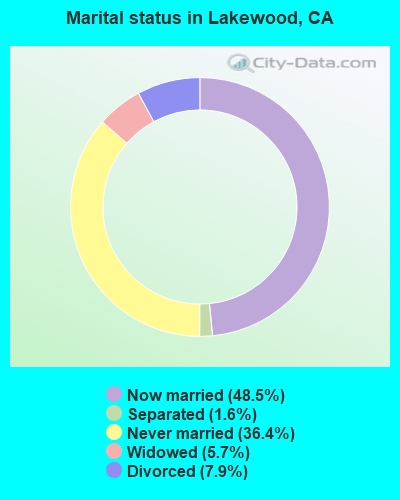
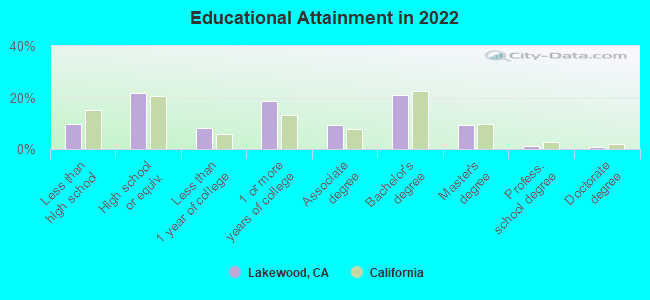
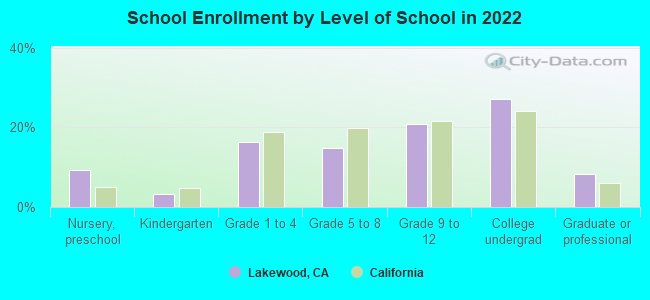
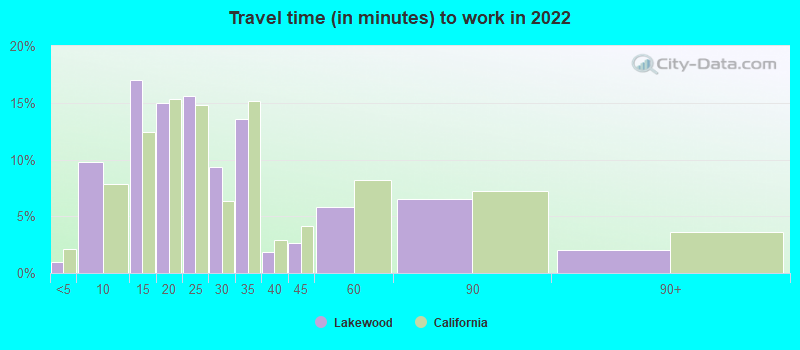
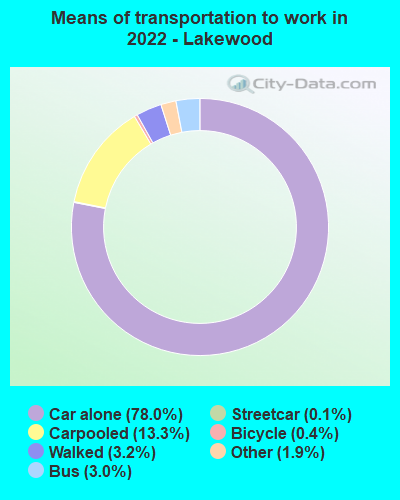


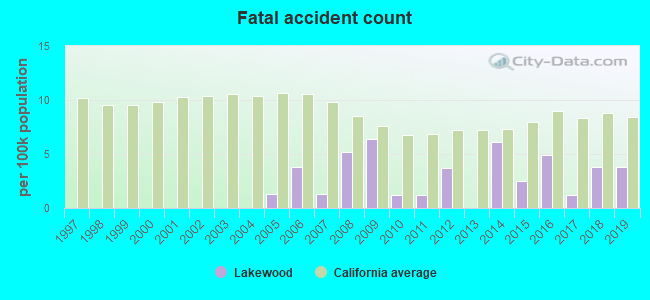
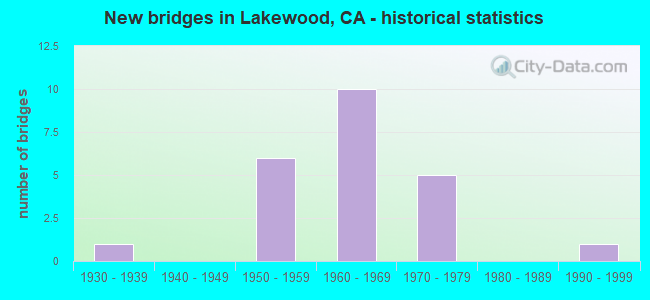
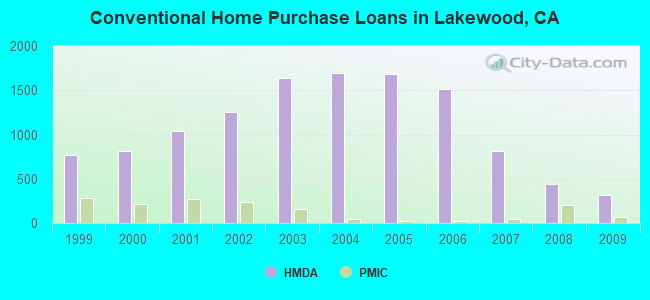
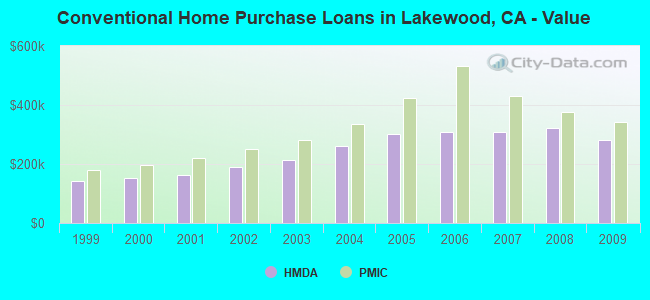
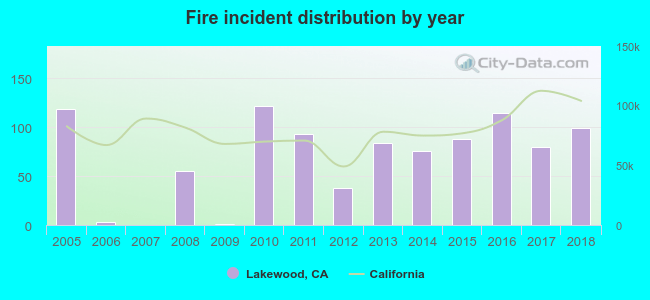 Based on the data from the years 2005 - 2018 the average number of fire incidents per year is 70. The highest number of reported fire incidents - 122 took place in 2010, and the least - 0 in 2007. The data has a dropping trend.
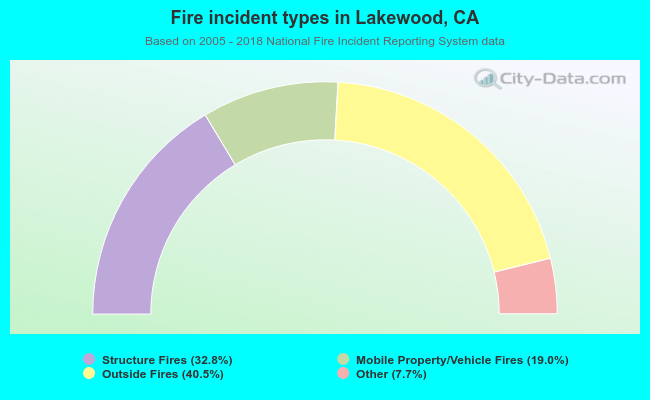 When looking into fire subcategories, the most reports belonged to: Outside Fires (40.5%), and Structure Fires (32.8%).