East La Mirada, California
Submit your own pictures of this place and show them to the world
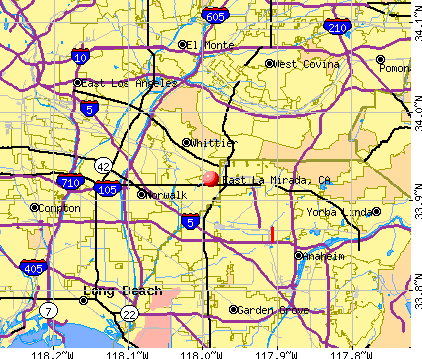
- OSM Map
- General Map
- Google Map
- MSN Map
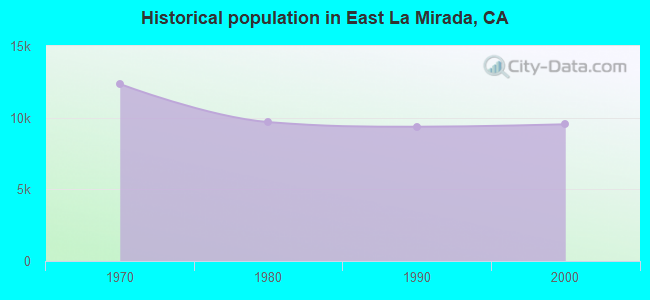
Population change since 2000: +2.3%
| Males: 4,955 | |
| Females: 4,802 |
| Median resident age: | 37.2 years |
| California median age: | 37.9 years |
Zip codes: 90604.
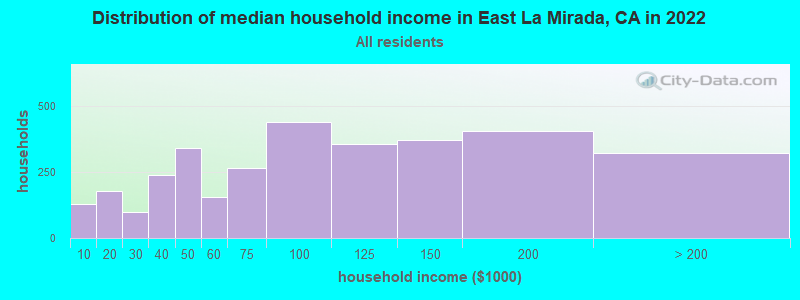
| East La Mirada: | $100,610 |
| CA: | $91,551 |
Estimated per capita income in 2022: $43,025 (it was $20,613 in 2000)
East La Mirada CDP income, earnings, and wages data
Estimated median house or condo value in 2022: $846,800 (it was $211,700 in 2000)
| East La Mirada: | $846,800 |
| CA: | $715,900 |
Mean prices in 2022: all housing units: over $1,000,000; detached houses: over $1,000,000; townhouses or other attached units: $750,854; in 2-unit structures: over $1,000,000; in 3-to-4-unit structures: $791,642; in 5-or-more-unit structures: $738,503; mobile homes: $205,184; occupied boats, rvs, vans, etc.: $276,239
Median gross rent in 2022: $1,834.
East La Mirada, CA residents, houses, and apartments details
(5.3% for White Non-Hispanic residents, 8.4% for Hispanic or Latino residents, 13.7% for other race residents, 0.8% for two or more races residents)
Detailed information about poverty and poor residents in East La Mirada, CA
Compare current foreclosures near East La Mirada, CA:
| Photo | Address | Area | Beds / Baths | Price | Details |
|---|---|---|---|---|---|

|
#1
Hawkstone Ave
Whittier, CA 90605
|
1,444 sq. feet
|
2 baths 4 beds |
$674,900
|
show details |

|
#2
E Norma Ave
West Covina, CA 91791
|
1,134 sq. feet
|
2 baths 3 beds |
$599,000
|
show details |

|
#3
Millbury Ave
Baldwin Park, CA 91706
|
1,632 sq. feet
|
2 baths 4 beds |
$869,000
|
show details |

|
#4
E Holton St
West Covina, CA 91791
|
- sq. feet
|
2 baths 3 beds |
$450,000
|
show details |

|
#5
Norwalk Blvd Apt
Hawaiian Gardens, CA 90716
|
800 sq. feet
|
2 baths 1 beds |
show details | |

|
#6
And 6111 Northside Drive
Los Angeles, CA 90022
|
1,329 sq. feet
|
4 baths 3 beds |
show details | |

|
#7
Bohlig Rd Apt 45
Los Angeles, CA 90032
|
813 sq. feet
|
2 baths 2 beds |
show details | |

|
#8
E Jackson Ave Unit C
Anaheim, CA 92806
|
1,266 sq. feet
|
2 baths 3 beds |
show details | |

|
#9
Mira Mar Ave
Long Beach, CA 90814
|
1,902 sq. feet
|
2 baths 4 beds |
show details | |

|
#10
Dunrobin Ave
Downey, CA 90242
|
3,000 sq. feet
|
4 baths 8 beds |
show details |
| Photo | Address | Area | Beds / Baths | Price | Details |
|---|---|---|---|---|---|

|
#11
E 60th St
Los Angeles, CA 90001
|
1,883 sq. feet
|
3 baths 5 beds |
show details | |

|
#12
Elburg St Unit A
Paramount, CA 90723
|
1,131 sq. feet
|
2 baths 3 beds |
show details | |

|
#13
W Arbor St # 57
Long Beach, CA 90805
|
1,585 sq. feet
|
2 baths 3 beds |
show details | |

|
#14
Redondo Avenue, Units 5-8
Long Beach, CA 90804
|
3,360 sq. feet
|
4 baths 8 beds |
show details | |

|
#15
Clarissa St
Garden Grove, CA 92840
|
1,098 sq. feet
|
2 baths 3 beds |
show details | |

|
#16
E 91st St
Los Angeles, CA 90002
|
1,694 sq. feet
|
2 baths 5 beds |
show details | |

|
#17
E Poppy St
Long Beach, CA 90805
|
1,091 sq. feet
|
2 baths 2 beds |
show details | |

|
#18
E Turin Ave
Anaheim, CA 92805
|
1,436 sq. feet
|
2 baths 3 beds |
show details | |

|
#19
S Pintado Dr
Diamond Bar, CA 91765
|
1,465 sq. feet
|
2 baths 4 beds |
show details | |

|
#20
E Palmerstone St
Compton, CA 90221
|
1,410 sq. feet
|
2 baths 3 beds |
show details |
| Photo | Address | Area | Beds / Baths | Price | Details |
|---|---|---|---|---|---|

|
#21
Faust Ave
Long Beach, CA 90808
|
1,434 sq. feet
|
2 baths 3 beds |
show details | |

|
#22
Maie Ave
Los Angeles, CA 90001
|
860 sq. feet
|
1 baths 2 beds |
show details | |

|
#23
N Fickett St
Los Angeles, CA 90033
|
944 sq. feet
|
2 baths 2 beds |
show details | |

|
#24
Gettysburg Dr
Norwalk, CA 90650
|
1,136 sq. feet
|
1 baths 3 beds |
show details | |

|
#25
E Victoria Ave
Montebello, CA 90640
|
1,025 sq. feet
|
1 baths 2 beds |
show details | |

|
#26
Boer Ave
Whittier, CA 90606
|
864 sq. feet
|
1 baths 2 beds |
show details | |

|
#27
N Mott St
Los Angeles, CA 90033
|
784 sq. feet
|
1 baths 3 beds |
show details | |

|
#28
E 92nd St
Los Angeles, CA 90002
|
2,290 sq. feet
|
2 baths 4 beds |
show details | |

|
#29
E Oshkosh Ave
Anaheim, CA 92806
|
2,850 sq. feet
|
3 baths 5 beds |
show details | |

|
#30
Riata St
Midway City, CA 92655
|
1,039 sq. feet
|
1 baths 3 beds |
show details |
| Photo | Address | Area | Beds / Baths | Price | Details |
|---|---|---|---|---|---|

|
#31
E 59th St
Long Beach, CA 90805
|
1,036 sq. feet
|
1 baths 2 beds |
show details | |

|
#32
Jeffrey Ave
Cerritos, CA 90703
|
2,175 sq. feet
|
3 baths 4 beds |
show details | |

|
#33
Virginia St
Lynwood, CA 90262
|
1,548 sq. feet
|
2 baths 3 beds |
show details | |

|
#34
Camulos St
Los Angeles, CA 90033
|
1,222 sq. feet
|
2 baths 4 beds |
show details | |

|
#35
N Adelon Ln
Compton, CA 90221
|
1,900 sq. feet
|
3 baths 3 beds |
show details | |

|
#36
Meadow View Dr
Pomona, CA 91766
|
1,538 sq. feet
|
2 baths 4 beds |
show details | |

|
#37
Adams Way
Buena Park, CA 90620
|
1,548 sq. feet
|
1 baths 3 beds |
show details | |

|
#38
Walnut Dr
Los Angeles, CA 90001
|
944 sq. feet
|
1 baths 3 beds |
show details | |

|
#39
Ibex Ave
Cerritos, CA 90703
|
2,424 sq. feet
|
3 baths 4 beds |
show details | |

|
#40
N Myrtlewood Ave
West Covina, CA 91791
|
1,854 sq. feet
|
3 baths 3 beds |
show details |
| Photo | Address | Area | Beds / Baths | Price | Details |
|---|---|---|---|---|---|

|
#41
Margaret Ave
Los Angeles, CA 90022
|
1,192 sq. feet
|
1 baths 3 beds |
show details | |

|
#42
N Durrell Ave
Azusa, CA 91702
|
1,225 sq. feet
|
1 baths 3 beds |
show details | |

|
#43
Molette St
Norwalk, CA 90650
|
1,082 sq. feet
|
1 baths 4 beds |
show details | |

|
#44
Shoemaker Ave
Whittier, CA 90605
|
1,484 sq. feet
|
1 baths 2 beds |
show details | |

|
#45
Topaz Ave
La Habra, CA 90631
|
2,481 sq. feet
|
3 baths 5 beds |
show details | |

|
#46
Del Amo Blvd
Lakewood, CA 90712
|
1,371 sq. feet
|
2 baths 4 beds |
show details | |

|
#47
E 33rd St
Los Angeles, CA 90011
|
887 sq. feet
|
2 baths 4 beds |
show details | |

|
#48
E 215th Pl
Carson, CA 90745
|
1,225 sq. feet
|
2 baths 4 beds |
show details | |

|
#49
E 113th St
Los Angeles, CA 90059
|
1,085 sq. feet
|
1 baths 3 beds |
show details | |

|
Check over 1 million property listings on Foreclosure.com!
|
browse all offers | |||

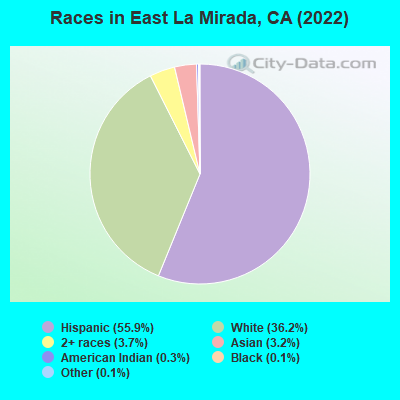
- 6,12855.9%Hispanic
- 3,97236.2%White alone
- 4093.7%Two or more races
- 3533.2%Asian alone
- 320.3%American Indian alone
- 140.1%Black alone
- 130.1%Other race alone
 Recent articles from our blog. Our writers, many of them Ph.D. graduates or candidates, create easy-to-read articles on a wide variety of topics.

 | So, where do all the white people live then? (230 replies) |
| Any neighborhoods or cities with true diversity? (35 replies) |
| Why do people say they love L.A., (38 replies) |
| How is the "Quality of Life" in and around L.A. ? (105 replies) |
| Los Angeles suburbs.... (58 replies) |
| Need to find a good place to live in North OC (4 replies) |
Latest news from East La Mirada, CA collected exclusively by city-data.com from local newspapers, TV, and radio stations
Ancestries: German (4.5%), Italian (4.4%), American (4.2%), Irish (3.7%), English (1.7%), European (1.1%).
Current Local Time: PST time zone
Elevation: 222 feet
Land area: 1.11 square miles.
Population density: 8,756 people per square mile (high).
1,627 residents are foreign born (10.6% Latin America, 1.9% Asia, 1.6% Europe).
| This place: | 14.8% |
| California: | 100.0% |
Median real estate property taxes paid for housing units with mortgages in 2022: $3,998 (0.7%)
Median real estate property taxes paid for housing units with no mortgage in 2022: $3,145 (0.5%)
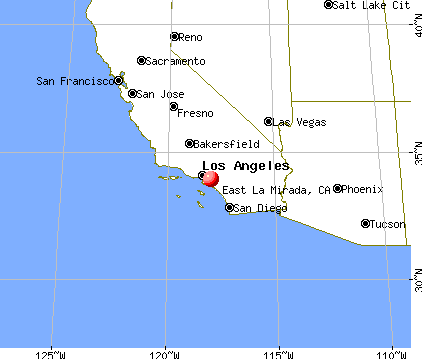
Nearest city with pop. 50,000+: La Habra, CA  (2.2 miles , pop. 58,974).
Nearest city with pop. 200,000+: Anaheim, CA (8.3 miles , pop. 328,014).
Nearest city with pop. 1,000,000+: Los Angeles, CA (24.9 miles , pop. 3,694,820).
Nearest cities:
), ), ), Latitude: 33.92 N, Longitude: 117.99 W
Daytime population change due to commuting: -4,276 (-39.0%)
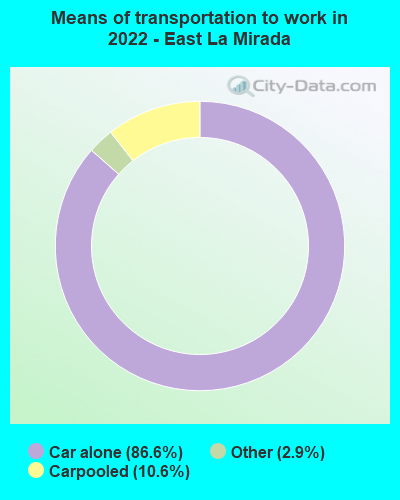
Workers who live and work in this place: 402 (7.7%)
Property values in East La Mirada, CA
| Here: | 5.0% |
| California: | 5.1% |
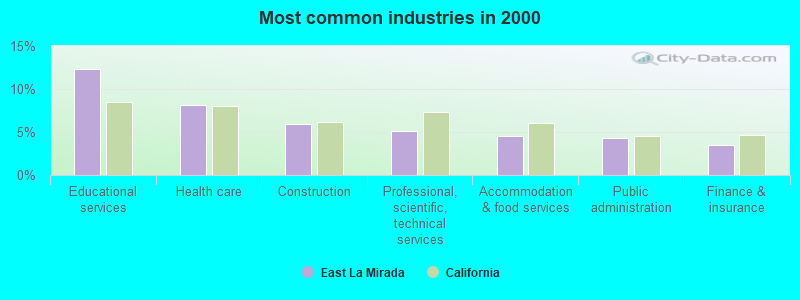
- Educational services (12.4%)
- Health care (8.1%)
- Construction (5.9%)
- Professional, scientific, technical services (5.1%)
- Accommodation & food services (4.6%)
- Public administration (4.3%)
- Finance & insurance (3.4%)
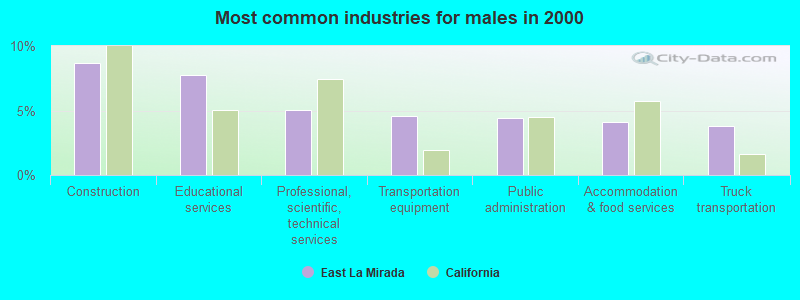
- Construction (8.7%)
- Educational services (7.7%)
- Professional, scientific, technical services (5.1%)
- Transportation equipment (4.6%)
- Public administration (4.4%)
- Accommodation & food services (4.1%)
- Truck transportation (3.8%)
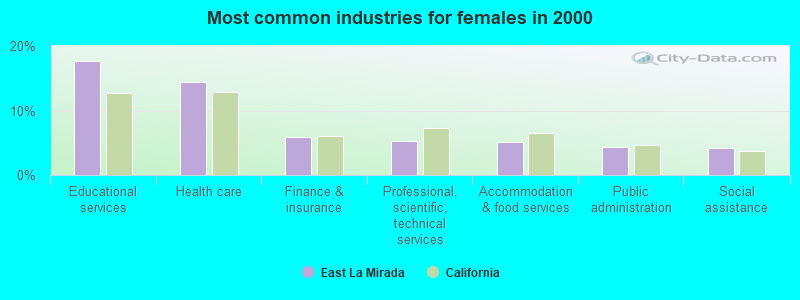
- Educational services (17.7%)
- Health care (14.4%)
- Finance & insurance (5.9%)
- Professional, scientific, technical services (5.2%)
- Accommodation & food services (5.1%)
- Public administration (4.3%)
- Social assistance (4.2%)
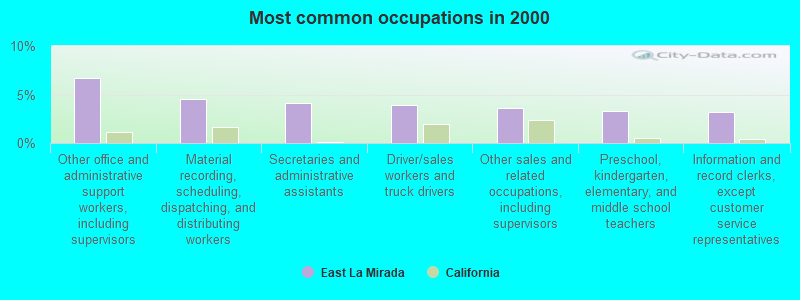
- Other office and administrative support workers, including supervisors (6.7%)
- Material recording, scheduling, dispatching, and distributing workers (4.5%)
- Secretaries and administrative assistants (4.2%)
- Driver/sales workers and truck drivers (3.9%)
- Other sales and related occupations, including supervisors (3.6%)
- Preschool, kindergarten, elementary, and middle school teachers (3.3%)
- Information and record clerks, except customer service representatives (3.2%)
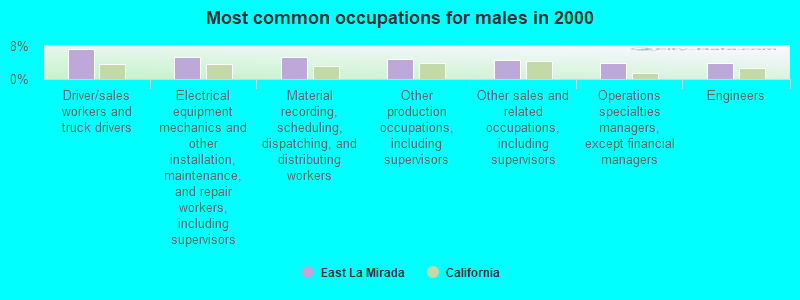
- Driver/sales workers and truck drivers (7.3%)
- Electrical equipment mechanics and other installation, maintenance, and repair workers, including supervisors (5.4%)
- Material recording, scheduling, dispatching, and distributing workers (5.4%)
- Other production occupations, including supervisors (4.8%)
- Other sales and related occupations, including supervisors (4.7%)
- Operations specialties managers, except financial managers (4.0%)
- Engineers (4.0%)

- Other office and administrative support workers, including supervisors (12.1%)
- Secretaries and administrative assistants (8.7%)
- Information and record clerks, except customer service representatives (6.1%)
- Preschool, kindergarten, elementary, and middle school teachers (4.9%)
- Material recording, scheduling, dispatching, and distributing workers (3.4%)
- Health technologists and technicians (3.3%)
- Other food preparation and serving workers, including supervisors (3.3%)
Average climate in East La Mirada, California
Based on data reported by over 4,000 weather stations


(lower is better)
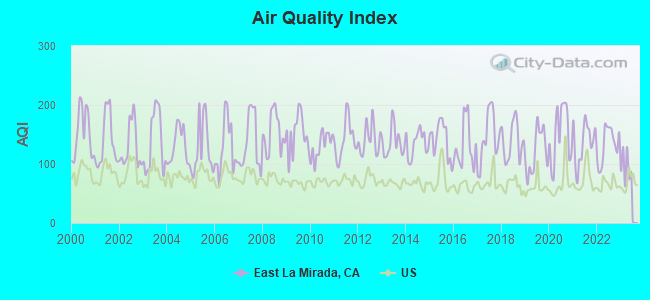
Air Quality Index (AQI) level in 2022 was 133. This is significantly worse than average.
| City: | 133 |
| U.S.: | 73 |
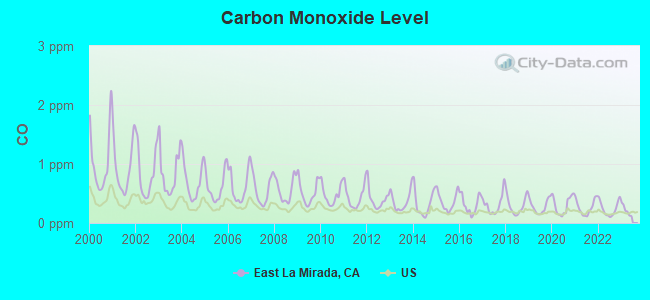
Carbon Monoxide (CO) [ppm] level in 2022 was 0.245. This is about average. Closest monitor was 2.1 miles away from the city center.
| City: | 0.245 |
| U.S.: | 0.251 |
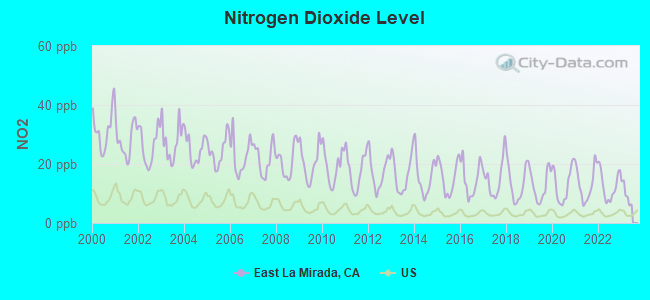
Nitrogen Dioxide (NO2) [ppb] level in 2022 was 12.6. This is significantly worse than average. Closest monitor was 2.1 miles away from the city center.
| City: | 12.6 |
| U.S.: | 5.1 |
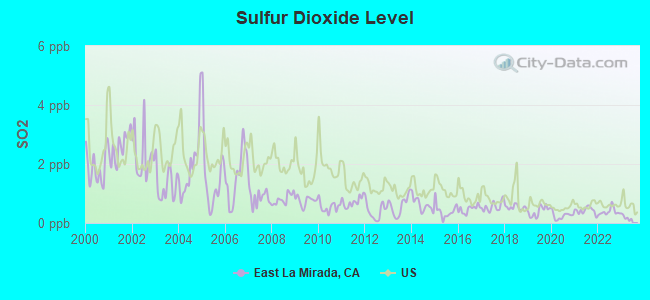
Sulfur Dioxide (SO2) [ppb] level in 2022 was 0.384. This is significantly better than average. Closest monitor was 2.1 miles away from the city center.
| City: | 0.384 |
| U.S.: | 1.515 |
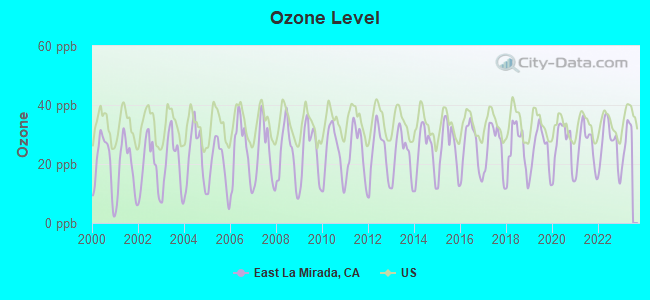
Ozone [ppb] level in 2022 was 26.8. This is better than average. Closest monitor was 2.1 miles away from the city center.
| City: | 26.8 |
| U.S.: | 33.3 |
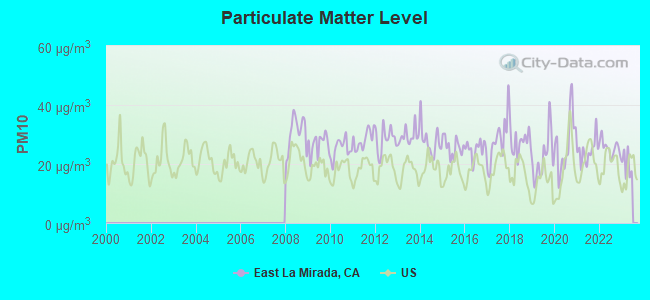
Particulate Matter (PM10) [µg/m3] level in 2022 was 25.6. This is worse than average. Closest monitor was 7.1 miles away from the city center.
| City: | 25.6 |
| U.S.: | 19.2 |
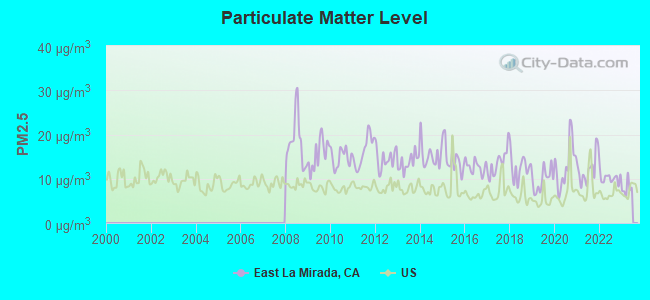
Particulate Matter (PM2.5) [µg/m3] level in 2022 was 10.2. This is worse than average. Closest monitor was 7.1 miles away from the city center.
| City: | 10.2 |
| U.S.: | 8.1 |
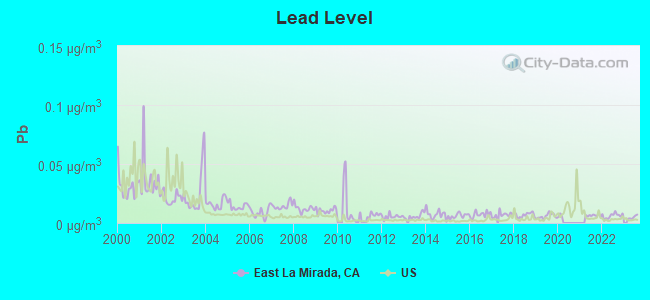
Lead (Pb) [µg/m3] level in 2022 was 0.00615. This is significantly better than average. Closest monitor was 2.1 miles away from the city center.
| City: | 0.00615 |
| U.S.: | 0.00931 |
Earthquake activity:
East La Mirada-area historical earthquake activity is significantly above California state average. It is 6993% greater than the overall U.S. average.On 7/21/1952 at 11:52:14, a magnitude 7.7 (7.7 UK, Class: Major, Intensity: VIII - XII) earthquake occurred 94.1 miles away from the city center, causing $50,000,000 total damage
On 6/28/1992 at 11:57:34, a magnitude 7.6 (6.2 MB, 7.6 MS, 7.3 MW, Depth: 0.7 mi) earthquake occurred 85.4 miles away from the city center, causing 3 deaths (1 shaking deaths, 2 other deaths) and 400 injuries, causing $100,000,000 total damage and $40,000,000 insured losses
On 10/16/1999 at 09:46:44, a magnitude 7.4 (6.3 MB, 7.4 MS, 7.2 MW, 7.3 ML) earthquake occurred 97.8 miles away from the city center
On 11/4/1927 at 13:51:53, a magnitude 7.5 (7.5 UK) earthquake occurred 186.6 miles away from the city center
On 4/21/1918 at 22:32:30, a magnitude 6.8 (6.8 UK, Class: Strong, Intensity: VII - IX) earthquake occurred 32.5 miles away from East La Mirada center
On 1/17/1994 at 12:30:55, a magnitude 6.8 (6.4 MB, 6.8 MS, 6.7 MW, Depth: 11.4 mi) earthquake occurred 37.2 miles away from the city center, causing 60 deaths (60 shaking deaths) and 7000 injuries
Magnitude types: body-wave magnitude (MB), local magnitude (ML), surface-wave magnitude (MS), moment magnitude (MW)
Natural disasters:
The number of natural disasters in Los Angeles County (57) is a lot greater than the US average (15).Major Disasters (Presidential) Declared: 27
Emergencies Declared: 3
Causes of natural disasters: Fires: 37, Floods: 16, Storms: 9, Winter Storms: 6, Landslides: 5, Mudslides: 5, Earthquakes: 3, Freeze: 1, Heavy Rain: 1, Hurricane: 1, Snow: 1, Tornado: 1, Wind: 1, Other: 1 (Note: some incidents may be assigned to more than one category).
Hospitals and medical centers near East La Mirada:
- SUNSHINE EXTENDED SERVICES INC (Home Health Center, about 1 miles away; LA HABRA, CA)
- G M HOME III (Hospital, about 2 miles away; LA MIRADA, CA)
- WHITTIER KIDNEY DIALYSIS CENTER (Dialysis Facility, about 2 miles away; WHITTIER, CA)
- WHITTIER HILLS HEALTH CARE CTR (Nursing Home, about 2 miles away; WHITTIER, CA)
- PRESBYTERIAN INTERCOMMUNITY HOSPITAL HOME HEALTH (Home Health Center, about 2 miles away; LA MIRADA, CA)
- VNA HOME HEALTH CARE INC (Home Health Center, about 2 miles away; LA MIRADA, CA)
- HOSPICE OF PRESBYTERIAN (Hospital, about 2 miles away; LA MIRADA, CA)
Amtrak stations near East La Mirada:
- 6 miles: FULLERTON (120 E. SANTA FE AVE.) . Services: ticket office, fully wheelchair accessible, enclosed waiting area, public restrooms, public payphones, full-service food facilities, free short-term parking, paid long-term parking, taxi stand, public transit connection.
- 11 miles: ANAHEIM (2150 KATELLA AVE.) . Services: ticket office, fully wheelchair accessible, enclosed waiting area, public restrooms, public payphones, vending machines, free short-term parking, free long-term parking, call for car rental service, call for taxi service.
- 15 miles: SANTA ANA (1000 E. SANTA ANA BLVD.) . Services: ticket office, fully wheelchair accessible, enclosed waiting area, public restrooms, public payphones, snack bar, free short-term parking, free long-term parking, call for car rental service, taxi stand, intercity bus service, public transit connection.
Colleges/universities with over 2000 students nearest to East La Mirada:
- Biola University (about 3 miles; La Mirada, CA; Full-time enrollment: 5,325)
- Fullerton College (about 6 miles; Fullerton, CA; FT enrollment: 11,124)
- Hacienda La Puente Adult Education (about 7 miles; La Puente, CA; FT enrollment: 2,750)
- California State University-Fullerton (about 7 miles; Fullerton, CA; FT enrollment: 28,947)
- Cerritos College (about 7 miles; Norwalk, CA; FT enrollment: 13,090)
- Cypress College (about 7 miles; Cypress, CA; FT enrollment: 8,732)
- Rio Hondo College (about 8 miles; Whittier, CA; FT enrollment: 9,610)
Points of interest:
Notable location: Los Angeles County Fire Department Station 15 (A). Display/hide its location on the map
| This place: | 3.0 people |
| California: | 2.9 people |
| This place: | 76.1% |
| Whole state: | 68.7% |
| This place: | 6.6% |
| Whole state: | 7.2% |
Likely homosexual households (counted as self-reported same-sex unmarried-partner households)
- Lesbian couples: 0.4% of all households
- Gay men: 0.2% of all households
7 people in workers' group living quarters and job corps centers in 2010
19 people in homes for the mentally retarded in 2000
13 people in institutions for the deaf in 2000
For population 15 years and over in East La Mirada:
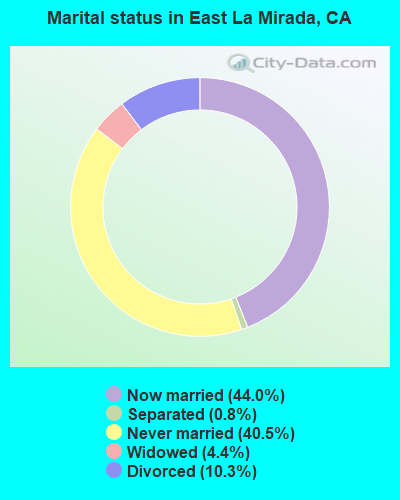
- Never married: 40.5%
- Now married: 44.0%
- Separated: 0.8%
- Widowed: 4.4%
- Divorced: 10.3%
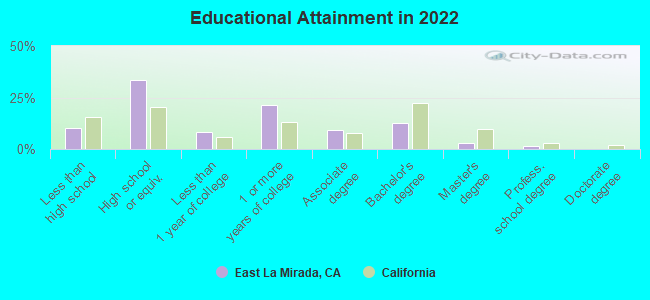
For population 25 years and over in East La Mirada:
- High school or higher: 87.0%
- Bachelor's degree or higher: 14.3%
- Graduate or professional degree: 3.5%
- Unemployed: 5.8%
- Mean travel time to work (commute): 27.1 minutes
| Here: | 10.6 |
| California average: | 15.5 |


Graphs represent county-level data. Detailed 2008 Election Results
Religion statistics for East La Mirada, CA (based on Los Angeles County data)


| Religion | Adherents | Congregations |
|---|---|---|
| Catholic | 3,542,994 | 275 |
| Evangelical Protestant | 814,611 | 3,249 |
| Other | 451,594 | 1,023 |
| Mainline Protestant | 229,056 | 860 |
| Black Protestant | 112,338 | 290 |
| Orthodox | 63,517 | 76 |
| None | 4,604,495 | - |
Food Environment Statistics:
| Los Angeles County: | 2.12 / 10,000 pop. |
| California: | 2.14 / 10,000 pop. |
| This county: | 0.03 / 10,000 pop. |
| State: | 0.04 / 10,000 pop. |
| Here: | 0.58 / 10,000 pop. |
| State: | 0.62 / 10,000 pop. |
| Los Angeles County: | 1.23 / 10,000 pop. |
| California: | 1.49 / 10,000 pop. |
| Here: | 7.15 / 10,000 pop. |
| California: | 7.42 / 10,000 pop. |
| Here: | 7.5% |
| California: | 7.3% |
| Los Angeles County: | 20.4% |
| California: | 21.3% |
| Here: | 18.6% |
| California: | 17.9% |
2.98% of this county's 2021 resident taxpayers lived in other counties in 2020 ($81,235 average adjusted gross income)
| Here: | 2.98% |
| California average: | 5.19% |
0.01% of residents moved from foreign countries ($155 average AGI)
Los Angeles County: 0.01% California average: 0.03%
Top counties from which taxpayers relocated into this county between 2020 and 2021:
| from Orange County, CA | |
| from San Bernardino County, CA | |
| from Riverside County, CA |
4.68% of this county's 2020 resident taxpayers moved to other counties in 2021 ($97,324 average adjusted gross income)
| Here: | 4.68% |
| California average: | 6.14% |
0.01% of residents moved to foreign countries ($196 average AGI)
Los Angeles County: 0.01% California average: 0.02%
Top counties to which taxpayers relocated from this county between 2020 and 2021:
| to Orange County, CA | |
| to San Bernardino County, CA | |
| to Riverside County, CA |
Businesses in East La Mirada, CA
- McDonald's: 1
Strongest AM radio stations in East La Mirada:
- KFI (640 AM; 50 kW; LOS ANGELES, CA; Owner: CAPSTAR TX LIMITED PARTNERSHIP)
- KTNQ (1020 AM; 50 kW; LOS ANGELES, CA; Owner: KTNQ-AM LICENSE CORP.)
- KXTA (1150 AM; 50 kW; LOS ANGELES, CA; Owner: CITICASTERS LICENSES, L.P.)
- KLAC (570 AM; 50 kW; LOS ANGELES, CA; Owner: AMFM RADIO LICENSES, L.L.C.)
- KDIS (1110 AM; 50 kW; PASADENA, CA; Owner: ABC,INC.)
- KFWB (980 AM; 50 kW; LOS ANGELES, CA; Owner: INFINITY BROADCASTING OPERATIONS, INC.)
- KMPC (1540 AM; 50 kW; LOS ANGELES, CA; Owner: ROSE CITY RADIO CORPORATION)
- KPLS (830 AM; 50 kW; ORANGE, CA; Owner: CRN LICENSES, LLC)
- KNX (1070 AM; 50 kW; LOS ANGELES, CA; Owner: INFINITY BROADCASTING OPERATIONS, INC.)
- KALI (900 AM; 6 kW; WEST COVINA, CA; Owner: MULTICULTURAL RADIO BROADCASTING, INC.)
- KBLA (1580 AM; 50 kW; SANTA MONICA, CA)
- KXMX (1190 AM; 25 kW; ANAHEIM, CA; Owner: NEW INSPIRATION BROADCASTING COMPANY)
- KSPN (710 AM; 50 kW; LOS ANGELES, CA; Owner: KABC-AM RADIO, INC.)
Strongest FM radio stations in East La Mirada:
- KCBS-FM (93.1 FM; LOS ANGELES, CA; Owner: INFINITY BROADCASTING OPERATIONS, INC.)
- KZLA-FM (93.9 FM; LOS ANGELES, CA; Owner: EMMIS RADIO LICENSE CORPORATION)
- KPWR (105.9 FM; LOS ANGELES, CA; Owner: EMMIS RADIO LICENSE CORPORATION)
- KLSX (97.1 FM; LOS ANGELES, CA; Owner: INFINITY BROADCASTING OPERATIONS, INC.)
- KSCA (101.9 FM; GLENDALE, CA; Owner: HBC LICENSE CORPORATION)
- KLOS (95.5 FM; LOS ANGELES, CA; Owner: KLOS-FM RADIO, INC.)
- KOST (103.5 FM; LOS ANGELES, CA; Owner: CAPSTAR TX LIMITED PARTNERSHIP)
- K212FA (90.3 FM; TEMPLE CITY, CA; Owner: EDUCATIONAL MEDIA FOUNDATION)
- KUSC (91.5 FM; LOS ANGELES, CA; Owner: UNIVERSITY OF SOUTHERN CALIFORNIA)
- KKLA-FM (99.5 FM; LOS ANGELES, CA; Owner: NEW INSPIRATION BROADCASTING CO., INC.)
- KIIS-FM (102.7 FM; LOS ANGELES, CA; Owner: CITICASTERS LICENSES, L.P.)
- KLVE (107.5 FM; LOS ANGELES, CA; Owner: KLVE-FM LICENSE CORP.)
- KPCC (89.3 FM; PASADENA, CA; Owner: PASADENA AREA COMMUNITY COLLEGE DISTRICT)
- KHHT (92.3 FM; LOS ANGELES, CA; Owner: AMFM RADIO LICENSES, L.L.C.)
- KBIG-FM (104.3 FM; LOS ANGELES, CA; Owner: AMFM RADIO LICENSES, L.L.C.)
- KTWV (94.7 FM; LOS ANGELES, CA; Owner: INFINITY BROADCASTING OPERATIONS, INC.)
- KMZT-FM (105.1 FM; LOS ANGELES, CA; Owner: MOUNT WILSON FM BROADCASTERS, INC.)
- KPFK (90.7 FM; LOS ANGELES, CA; Owner: PACIFICA FOUNDATION, INC)
- K216EM (91.1 FM; ARCADIA, CA; Owner: LIFE ON THE WAY COMMUNICATIONS, INC.)
- KRTH-FM (101.1 FM; LOS ANGELES, CA; Owner: INFINITY BROADCASTING OPERATIONS, INC.)
TV broadcast stations around East La Mirada:
- KCBS-TV (Channel 2; LOS ANGELES, CA; Owner: CBS BROADCASTING INC.)
- KTRO-LP (Channel 50; LANCASTER, CA; Owner: ROBERT D. ADELMAN)
- KTLA-TV (Channel 5; LOS ANGELES, CA; Owner: KTLA INC.)
- KABC-TV (Channel 7; LOS ANGELES, CA; Owner: ABC HOLDING COMPANY, INC.)
- KCAL-TV (Channel 9; LOS ANGELES, CA; Owner: VIACOM TELEVISION STATIONS GROUP OF LOS ANGELES LLC)
- KNBC (Channel 4; LOS ANGELES, CA; Owner: NBC SUBSIDIARY (KNBC-TV), INC.)
- KHIZ (Channel 64; BARSTOW, CA; Owner: SUNBELT TELEVISION, INC.)
- KMEX-TV (Channel 34; LOS ANGELES, CA; Owner: KMEX LICENSE PARTNERSHIP, G.P.)
- KAZA-TV (Channel 54; AVALON, CA; Owner: PAPPAS SOUTHERN CALIFORNIA LICENSE LLC)
- KDOC-TV (Channel 56; ANAHEIM, CA; Owner: GOLDEN ORANGE BROADCASTING CO., INC.)
- KOCE-TV (Channel 50; HUNTINGTON BEACH, CA; Owner: BD. OF TRUSTEES, COAST COMMUNITY COLLEGE DIST.)
- KSCI (Channel 18; LONG BEACH, CA; Owner: KSLS, INC.)
- KXLA (Channel 44; RANCHO PALOS VERDES, CA; Owner: RANCHO PALOS VERDES BROADCASTERS, INC.)
- KCET (Channel 28; LOS ANGELES, CA; Owner: COMMUNITY TELEVISION OF SOUTHERN CALIFORNIA)
- KFTR (Channel 46; ONTARIO, CA; Owner: TELEFUTURA LOS ANGELES LLC)
- KWHY-TV (Channel 22; LOS ANGELES, CA; Owner: TELEMUNDO OF LOS ANGELES LICENSE CORPORATION)
- KVEA (Channel 52; CORONA, CA; Owner: ESTRELLA LICENSE CORPORATION)
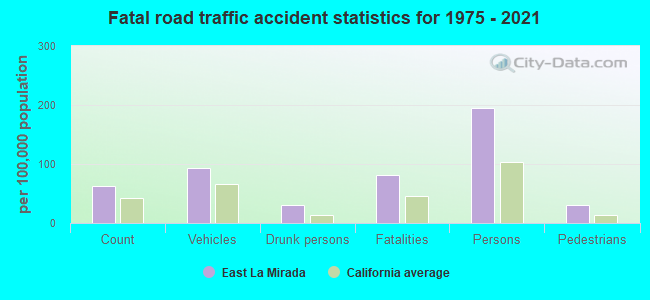
East La Mirada fatal accident list:
Nov 4, 2018 05:29 PM, Santa Gertrudes Ave, Lat: 33.927411, Lon: -117.994308, Vehicles: 1, Persons: 1, Pedestrians: 2, Fatalities: 1
Jan 1, 2015 01:30 AM, Cr-First Ave, Candlelight Drive, Lat: 33.920806, Lon: -117.985539, Vehicles: 2, Persons: 2, Fatalities: 2, Drunk persons involved: 2
Oct 29, 2011 03:50 AM, Lambert Rd, Lat: 33.925375, Lon: -117.980256, Vehicles: 1, Persons: 7, Fatalities: 2, Drunk persons involved: 1
Dec 9, 2009 04:05 PM, 1st Ave, Lambert Rd, Lat: 33.929589, Lon: -117.985453, Vehicles: 2, Persons: 3, Fatalities: 1
Feb 7, 2005 02:30 PM, Imperial Hwy, Lat: 33.917450, Lon: -117.976590, Vehicles: 2, Persons: 4, Fatalities: 1
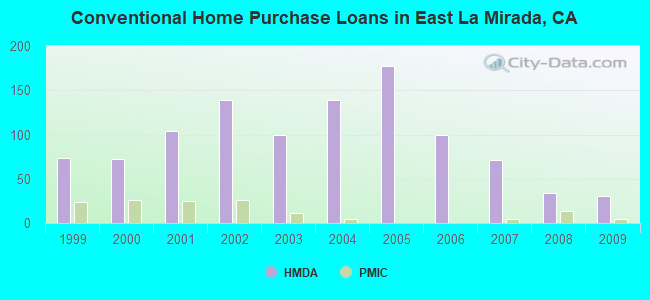
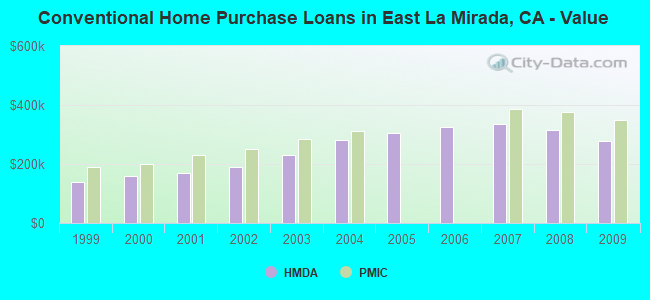
| Home Mortgage Disclosure Act Aggregated Statistics For Year 2009 (Based on 2 full tracts) | ||||||||||
| A) FHA, FSA/RHS & VA Home Purchase Loans | B) Conventional Home Purchase Loans | C) Refinancings | D) Home Improvement Loans | F) Non-occupant Loans on < 5 Family Dwellings (A B C & D) | ||||||
|---|---|---|---|---|---|---|---|---|---|---|
| Number | Average Value | Number | Average Value | Number | Average Value | Number | Average Value | Number | Average Value | |
| LOANS ORIGINATED | 33 | $365,306 | 30 | $278,005 | 175 | $273,245 | 9 | $196,803 | 3 | $248,210 |
| APPLICATIONS APPROVED, NOT ACCEPTED | 1 | $424,000 | 4 | $272,012 | 22 | $267,140 | 0 | $0 | 0 | $0 |
| APPLICATIONS DENIED | 2 | $365,275 | 8 | $287,522 | 43 | $293,012 | 3 | $201,497 | 2 | $238,225 |
| APPLICATIONS WITHDRAWN | 1 | $321,600 | 4 | $243,972 | 37 | $294,869 | 2 | $162,500 | 3 | $240,237 |
| FILES CLOSED FOR INCOMPLETENESS | 1 | $381,160 | 0 | $0 | 8 | $286,558 | 2 | $353,905 | 0 | $0 |
Detailed HMDA statistics for the following Tracts: 5037.01 , 5037.02
| Private Mortgage Insurance Companies Aggregated Statistics For Year 2009 (Based on 2 full tracts) | ||||
| A) Conventional Home Purchase Loans | B) Refinancings | |||
|---|---|---|---|---|
| Number | Average Value | Number | Average Value | |
| LOANS ORIGINATED | 4 | $348,652 | 1 | $386,120 |
| APPLICATIONS APPROVED, NOT ACCEPTED | 4 | $337,628 | 2 | $385,130 |
| APPLICATIONS DENIED | 0 | $0 | 0 | $0 |
| APPLICATIONS WITHDRAWN | 1 | $275,000 | 1 | $384,000 |
| FILES CLOSED FOR INCOMPLETENESS | 0 | $0 | 0 | $0 |
Detailed PMIC statistics for the following Tracts: 5037.01 , 5037.02
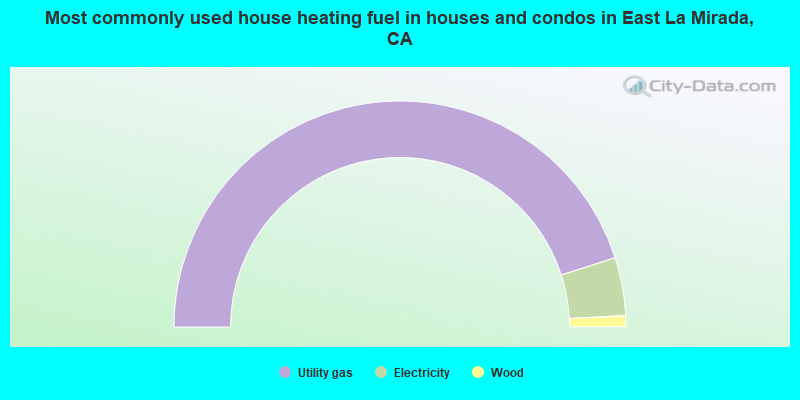
- 90.1%Utility gas
- 8.3%Electricity
- 1.6%Wood
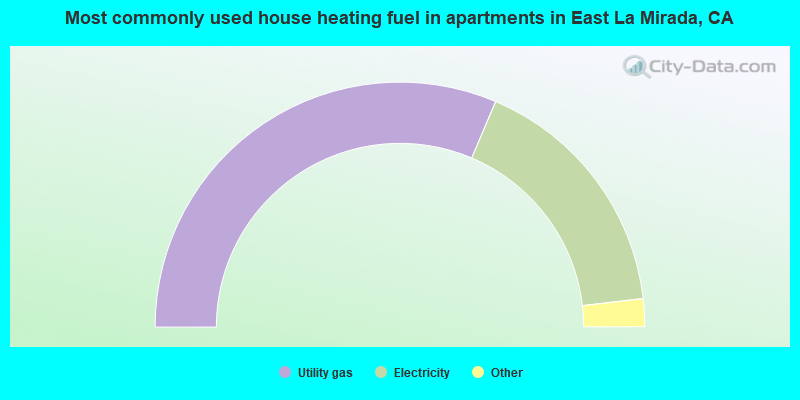
- 62.8%Utility gas
- 33.5%Electricity
- 2.0%Bottled, tank, or LP gas
- 1.6%No fuel used
East La Mirada compared to California state average:
- Unemployed percentage below state average.
- Black race population percentage significantly below state average.
- Median age above state average.
- Foreign-born population percentage below state average.
- Length of stay since moving in significantly above state average.
- Percentage of population with a bachelor's degree or higher below state average.
East La Mirada on our top lists:
- #14 on the list of "Top 101 cities with the largest percentage of people in institutions for the deaf (population 1,000+)"
- #28 on the list of "Top 101 cities with largest percentage of males in occupations: office and administrative support occupations (population 5,000+)"
- #29 on the list of "Top 101 cities with largest percentage of females in occupations: office and administrative support occupations (population 5,000+)"
- #31 on the list of "Top 101 cities with the smallest house values disparities (population 5,000+)"
- #1 on the list of "Top 101 counties with the most Evangelical Protestant congregations"
- #1 on the list of "Top 101 counties with the most Mainline Protestant congregations"
- #1 on the list of "Top 101 counties with the most Orthodox adherents"
- #1 on the list of "Top 101 counties with the highest ground withdrawal of fresh water for public supply (pop. 50,000+)"
- #1 on the list of "Top 101 counties with the most Catholic adherents (pop. 50,000+)"