La Habra, California Submit your own pictures of this city and show them to the world
OSM Map
General Map
Google Map
MSN Map
OSM Map
General Map
Google Map
MSN Map
OSM Map
General Map
Google Map
MSN Map
OSM Map
General Map
Google Map
MSN Map
Please wait while loading the map...
Population in 2022: 61,978 (100% urban, 0% rural). Population change since 2000: +5.1%Males: 31,187 Females: 30,791
March 2022 cost of living index in La Habra: 88.4 (less than average, U.S. average is 100) Percentage of residents living in poverty in 2022: 9.8%for White Non-Hispanic residents , 5.7% for Black residents , 11.7% for Hispanic or Latino residents , 37.7% for American Indian residents , 15.3% for other race residents , 5.4% for two or more races residents )
Profiles of local businesses
Business Search - 14 Million verified businesses
Data:
Median household income ($)
Median household income (% change since 2000)
Household income diversity
Ratio of average income to average house value (%)
Ratio of average income to average rent
Median household income ($) - White
Median household income ($) - Black or African American
Median household income ($) - Asian
Median household income ($) - Hispanic or Latino
Median household income ($) - American Indian and Alaska Native
Median household income ($) - Multirace
Median household income ($) - Other Race
Median household income for houses/condos with a mortgage ($)
Median household income for apartments without a mortgage ($)
Races - White alone (%)
Races - White alone (% change since 2000)
Races - Black alone (%)
Races - Black alone (% change since 2000)
Races - American Indian alone (%)
Races - American Indian alone (% change since 2000)
Races - Asian alone (%)
Races - Asian alone (% change since 2000)
Races - Hispanic (%)
Races - Hispanic (% change since 2000)
Races - Native Hawaiian and Other Pacific Islander alone (%)
Races - Native Hawaiian and Other Pacific Islander alone (% change since 2000)
Races - Two or more races (%)
Races - Two or more races (% change since 2000)
Races - Other race alone (%)
Races - Other race alone (% change since 2000)
Racial diversity
Unemployment (%)
Unemployment (% change since 2000)
Unemployment (%) - White
Unemployment (%) - Black or African American
Unemployment (%) - Asian
Unemployment (%) - Hispanic or Latino
Unemployment (%) - American Indian and Alaska Native
Unemployment (%) - Multirace
Unemployment (%) - Other Race
Population density (people per square mile)
Population - Males (%)
Population - Females (%)
Population - Males (%) - White
Population - Males (%) - Black or African American
Population - Males (%) - Asian
Population - Males (%) - Hispanic or Latino
Population - Males (%) - American Indian and Alaska Native
Population - Males (%) - Multirace
Population - Males (%) - Other Race
Population - Females (%) - White
Population - Females (%) - Black or African American
Population - Females (%) - Asian
Population - Females (%) - Hispanic or Latino
Population - Females (%) - American Indian and Alaska Native
Population - Females (%) - Multirace
Population - Females (%) - Other Race
Coronavirus confirmed cases (Apr 27, 2024)
Deaths caused by coronavirus (Apr 27, 2024)
Coronavirus confirmed cases (per 100k population) (Apr 27, 2024)
Deaths caused by coronavirus (per 100k population) (Apr 27, 2024)
Daily increase in number of cases (Apr 27, 2024)
Weekly increase in number of cases (Apr 27, 2024)
Cases doubled (in days) (Apr 27, 2024)
Hospitalized patients (Apr 18, 2022)
Negative test results (Apr 18, 2022)
Total test results (Apr 18, 2022)
COVID Vaccine doses distributed (per 100k population) (Sep 19, 2023)
COVID Vaccine doses administered (per 100k population) (Sep 19, 2023)
COVID Vaccine doses distributed (Sep 19, 2023)
COVID Vaccine doses administered (Sep 19, 2023)
Likely homosexual households (%)
Likely homosexual households (% change since 2000)
Likely homosexual households - Lesbian couples (%)
Likely homosexual households - Lesbian couples (% change since 2000)
Likely homosexual households - Gay men (%)
Likely homosexual households - Gay men (% change since 2000)
Cost of living index
Median gross rent ($)
Median contract rent ($)
Median monthly housing costs ($)
Median house or condo value ($)
Median house or condo value ($ change since 2000)
Mean house or condo value by units in structure - 1, detached ($)
Mean house or condo value by units in structure - 1, attached ($)
Mean house or condo value by units in structure - 2 ($)
Mean house or condo value by units in structure by units in structure - 3 or 4 ($)
Mean house or condo value by units in structure - 5 or more ($)
Mean house or condo value by units in structure - Boat, RV, van, etc. ($)
Mean house or condo value by units in structure - Mobile home ($)
Median house or condo value ($) - White
Median house or condo value ($) - Black or African American
Median house or condo value ($) - Asian
Median house or condo value ($) - Hispanic or Latino
Median house or condo value ($) - American Indian and Alaska Native
Median house or condo value ($) - Multirace
Median house or condo value ($) - Other Race
Median resident age
Resident age diversity
Median resident age - Males
Median resident age - Females
Median resident age - White
Median resident age - Black or African American
Median resident age - Asian
Median resident age - Hispanic or Latino
Median resident age - American Indian and Alaska Native
Median resident age - Multirace
Median resident age - Other Race
Median resident age - Males - White
Median resident age - Males - Black or African American
Median resident age - Males - Asian
Median resident age - Males - Hispanic or Latino
Median resident age - Males - American Indian and Alaska Native
Median resident age - Males - Multirace
Median resident age - Males - Other Race
Median resident age - Females - White
Median resident age - Females - Black or African American
Median resident age - Females - Asian
Median resident age - Females - Hispanic or Latino
Median resident age - Females - American Indian and Alaska Native
Median resident age - Females - Multirace
Median resident age - Females - Other Race
Commute - mean travel time to work (minutes)
Travel time to work - Less than 5 minutes (%)
Travel time to work - Less than 5 minutes (% change since 2000)
Travel time to work - 5 to 9 minutes (%)
Travel time to work - 5 to 9 minutes (% change since 2000)
Travel time to work - 10 to 19 minutes (%)
Travel time to work - 10 to 19 minutes (% change since 2000)
Travel time to work - 20 to 29 minutes (%)
Travel time to work - 20 to 29 minutes (% change since 2000)
Travel time to work - 30 to 39 minutes (%)
Travel time to work - 30 to 39 minutes (% change since 2000)
Travel time to work - 40 to 59 minutes (%)
Travel time to work - 40 to 59 minutes (% change since 2000)
Travel time to work - 60 to 89 minutes (%)
Travel time to work - 60 to 89 minutes (% change since 2000)
Travel time to work - 90 or more minutes (%)
Travel time to work - 90 or more minutes (% change since 2000)
Marital status - Never married (%)
Marital status - Now married (%)
Marital status - Separated (%)
Marital status - Widowed (%)
Marital status - Divorced (%)
Median family income ($)
Median family income (% change since 2000)
Median non-family income ($)
Median non-family income (% change since 2000)
Median per capita income ($)
Median per capita income (% change since 2000)
Median family income ($) - White
Median family income ($) - Black or African American
Median family income ($) - Asian
Median family income ($) - Hispanic or Latino
Median family income ($) - American Indian and Alaska Native
Median family income ($) - Multirace
Median family income ($) - Other Race
Median year house/condo built
Median year apartment built
Year house built - Built 2005 or later (%)
Year house built - Built 2000 to 2004 (%)
Year house built - Built 1990 to 1999 (%)
Year house built - Built 1980 to 1989 (%)
Year house built - Built 1970 to 1979 (%)
Year house built - Built 1960 to 1969 (%)
Year house built - Built 1950 to 1959 (%)
Year house built - Built 1940 to 1949 (%)
Year house built - Built 1939 or earlier (%)
Average household size
Household density (households per square mile)
Average household size - White
Average household size - Black or African American
Average household size - Asian
Average household size - Hispanic or Latino
Average household size - American Indian and Alaska Native
Average household size - Multirace
Average household size - Other Race
Occupied housing units (%)
Vacant housing units (%)
Owner occupied housing units (%)
Renter occupied housing units (%)
Vacancy status - For rent (%)
Vacancy status - For sale only (%)
Vacancy status - Rented or sold, not occupied (%)
Vacancy status - For seasonal, recreational, or occasional use (%)
Vacancy status - For migrant workers (%)
Vacancy status - Other vacant (%)
Residents with income below the poverty level (%)
Residents with income below 50% of the poverty level (%)
Children below poverty level (%)
Poor families by family type - Married-couple family (%)
Poor families by family type - Male, no wife present (%)
Poor families by family type - Female, no husband present (%)
Poverty status for native-born residents (%)
Poverty status for foreign-born residents (%)
Poverty among high school graduates not in families (%)
Poverty among people who did not graduate high school not in families (%)
Residents with income below the poverty level (%) - White
Residents with income below the poverty level (%) - Black or African American
Residents with income below the poverty level (%) - Asian
Residents with income below the poverty level (%) - Hispanic or Latino
Residents with income below the poverty level (%) - American Indian and Alaska Native
Residents with income below the poverty level (%) - Multirace
Residents with income below the poverty level (%) - Other Race
Air pollution - Air Quality Index (AQI)
Air pollution - CO
Air pollution - NO2
Air pollution - SO2
Air pollution - Ozone
Air pollution - PM10
Air pollution - PM25
Air pollution - Pb
Crime - Murders per 100,000 population
Crime - Rapes per 100,000 population
Crime - Robberies per 100,000 population
Crime - Assaults per 100,000 population
Crime - Burglaries per 100,000 population
Crime - Thefts per 100,000 population
Crime - Auto thefts per 100,000 population
Crime - Arson per 100,000 population
Crime - City-data.com crime index
Crime - Violent crime index
Crime - Property crime index
Crime - Murders per 100,000 population (5 year average)
Crime - Rapes per 100,000 population (5 year average)
Crime - Robberies per 100,000 population (5 year average)
Crime - Assaults per 100,000 population (5 year average)
Crime - Burglaries per 100,000 population (5 year average)
Crime - Thefts per 100,000 population (5 year average)
Crime - Auto thefts per 100,000 population (5 year average)
Crime - Arson per 100,000 population (5 year average)
Crime - City-data.com crime index (5 year average)
Crime - Violent crime index (5 year average)
Crime - Property crime index (5 year average)
1996 Presidential Elections Results (%) - Democratic Party (Clinton)
1996 Presidential Elections Results (%) - Republican Party (Dole)
1996 Presidential Elections Results (%) - Other
2000 Presidential Elections Results (%) - Democratic Party (Gore)
2000 Presidential Elections Results (%) - Republican Party (Bush)
2000 Presidential Elections Results (%) - Other
2004 Presidential Elections Results (%) - Democratic Party (Kerry)
2004 Presidential Elections Results (%) - Republican Party (Bush)
2004 Presidential Elections Results (%) - Other
2008 Presidential Elections Results (%) - Democratic Party (Obama)
2008 Presidential Elections Results (%) - Republican Party (McCain)
2008 Presidential Elections Results (%) - Other
2012 Presidential Elections Results (%) - Democratic Party (Obama)
2012 Presidential Elections Results (%) - Republican Party (Romney)
2012 Presidential Elections Results (%) - Other
2016 Presidential Elections Results (%) - Democratic Party (Clinton)
2016 Presidential Elections Results (%) - Republican Party (Trump)
2016 Presidential Elections Results (%) - Other
2020 Presidential Elections Results (%) - Democratic Party (Biden)
2020 Presidential Elections Results (%) - Republican Party (Trump)
2020 Presidential Elections Results (%) - Other
Ancestries Reported - Arab (%)
Ancestries Reported - Czech (%)
Ancestries Reported - Danish (%)
Ancestries Reported - Dutch (%)
Ancestries Reported - English (%)
Ancestries Reported - French (%)
Ancestries Reported - French Canadian (%)
Ancestries Reported - German (%)
Ancestries Reported - Greek (%)
Ancestries Reported - Hungarian (%)
Ancestries Reported - Irish (%)
Ancestries Reported - Italian (%)
Ancestries Reported - Lithuanian (%)
Ancestries Reported - Norwegian (%)
Ancestries Reported - Polish (%)
Ancestries Reported - Portuguese (%)
Ancestries Reported - Russian (%)
Ancestries Reported - Scotch-Irish (%)
Ancestries Reported - Scottish (%)
Ancestries Reported - Slovak (%)
Ancestries Reported - Subsaharan African (%)
Ancestries Reported - Swedish (%)
Ancestries Reported - Swiss (%)
Ancestries Reported - Ukrainian (%)
Ancestries Reported - United States (%)
Ancestries Reported - Welsh (%)
Ancestries Reported - West Indian (%)
Ancestries Reported - Other (%)
Educational Attainment - No schooling completed (%)
Educational Attainment - Less than high school (%)
Educational Attainment - High school or equivalent (%)
Educational Attainment - Less than 1 year of college (%)
Educational Attainment - 1 or more years of college (%)
Educational Attainment - Associate degree (%)
Educational Attainment - Bachelor's degree (%)
Educational Attainment - Master's degree (%)
Educational Attainment - Professional school degree (%)
Educational Attainment - Doctorate degree (%)
School Enrollment - Nursery, preschool (%)
School Enrollment - Kindergarten (%)
School Enrollment - Grade 1 to 4 (%)
School Enrollment - Grade 5 to 8 (%)
School Enrollment - Grade 9 to 12 (%)
School Enrollment - College undergrad (%)
School Enrollment - Graduate or professional (%)
School Enrollment - Not enrolled in school (%)
School enrollment - Public schools (%)
School enrollment - Private schools (%)
School enrollment - Not enrolled (%)
Median number of rooms in houses and condos
Median number of rooms in apartments
Housing units lacking complete plumbing facilities (%)
Housing units lacking complete kitchen facilities (%)
Density of houses
Urban houses (%)
Rural houses (%)
Households with people 60 years and over (%)
Households with people 65 years and over (%)
Households with people 75 years and over (%)
Households with one or more nonrelatives (%)
Households with no nonrelatives (%)
Population in households (%)
Family households (%)
Nonfamily households (%)
Population in families (%)
Family households with own children (%)
Median number of bedrooms in owner occupied houses
Mean number of bedrooms in owner occupied houses
Median number of bedrooms in renter occupied houses
Mean number of bedrooms in renter occupied houses
Median number of vehichles in owner occupied houses
Mean number of vehichles in owner occupied houses
Median number of vehichles in renter occupied houses
Mean number of vehichles in renter occupied houses
Mortgage status - with mortgage (%)
Mortgage status - with second mortgage (%)
Mortgage status - with home equity loan (%)
Mortgage status - with both second mortgage and home equity loan (%)
Mortgage status - without a mortgage (%)
Average family size
Average family size - White
Average family size - Black or African American
Average family size - Asian
Average family size - Hispanic or Latino
Average family size - American Indian and Alaska Native
Average family size - Multirace
Average family size - Other Race
Geographical mobility - Same house 1 year ago (%)
Geographical mobility - Moved within same county (%)
Geographical mobility - Moved from different county within same state (%)
Geographical mobility - Moved from different state (%)
Geographical mobility - Moved from abroad (%)
Place of birth - Born in state of residence (%)
Place of birth - Born in other state (%)
Place of birth - Native, outside of US (%)
Place of birth - Foreign born (%)
Housing units in structures - 1, detached (%)
Housing units in structures - 1, attached (%)
Housing units in structures - 2 (%)
Housing units in structures - 3 or 4 (%)
Housing units in structures - 5 to 9 (%)
Housing units in structures - 10 to 19 (%)
Housing units in structures - 20 to 49 (%)
Housing units in structures - 50 or more (%)
Housing units in structures - Mobile home (%)
Housing units in structures - Boat, RV, van, etc. (%)
House/condo owner moved in on average (years ago)
Renter moved in on average (years ago)
Year householder moved into unit - Moved in 1999 to March 2000 (%)
Year householder moved into unit - Moved in 1995 to 1998 (%)
Year householder moved into unit - Moved in 1990 to 1994 (%)
Year householder moved into unit - Moved in 1980 to 1989 (%)
Year householder moved into unit - Moved in 1970 to 1979 (%)
Year householder moved into unit - Moved in 1969 or earlier (%)
Means of transportation to work - Drove car alone (%)
Means of transportation to work - Carpooled (%)
Means of transportation to work - Public transportation (%)
Means of transportation to work - Bus or trolley bus (%)
Means of transportation to work - Streetcar or trolley car (%)
Means of transportation to work - Subway or elevated (%)
Means of transportation to work - Railroad (%)
Means of transportation to work - Ferryboat (%)
Means of transportation to work - Taxicab (%)
Means of transportation to work - Motorcycle (%)
Means of transportation to work - Bicycle (%)
Means of transportation to work - Walked (%)
Means of transportation to work - Other means (%)
Working at home (%)
Industry diversity
Most Common Industries - Agriculture, forestry, fishing and hunting, and mining (%)
Most Common Industries - Agriculture, forestry, fishing and hunting (%)
Most Common Industries - Mining, quarrying, and oil and gas extraction (%)
Most Common Industries - Construction (%)
Most Common Industries - Manufacturing (%)
Most Common Industries - Wholesale trade (%)
Most Common Industries - Retail trade (%)
Most Common Industries - Transportation and warehousing, and utilities (%)
Most Common Industries - Transportation and warehousing (%)
Most Common Industries - Utilities (%)
Most Common Industries - Information (%)
Most Common Industries - Finance and insurance, and real estate and rental and leasing (%)
Most Common Industries - Finance and insurance (%)
Most Common Industries - Real estate and rental and leasing (%)
Most Common Industries - Professional, scientific, and management, and administrative and waste management services (%)
Most Common Industries - Professional, scientific, and technical services (%)
Most Common Industries - Management of companies and enterprises (%)
Most Common Industries - Administrative and support and waste management services (%)
Most Common Industries - Educational services, and health care and social assistance (%)
Most Common Industries - Educational services (%)
Most Common Industries - Health care and social assistance (%)
Most Common Industries - Arts, entertainment, and recreation, and accommodation and food services (%)
Most Common Industries - Arts, entertainment, and recreation (%)
Most Common Industries - Accommodation and food services (%)
Most Common Industries - Other services, except public administration (%)
Most Common Industries - Public administration (%)
Occupation diversity
Most Common Occupations - Management, business, science, and arts occupations (%)
Most Common Occupations - Management, business, and financial occupations (%)
Most Common Occupations - Management occupations (%)
Most Common Occupations - Business and financial operations occupations (%)
Most Common Occupations - Computer, engineering, and science occupations (%)
Most Common Occupations - Computer and mathematical occupations (%)
Most Common Occupations - Architecture and engineering occupations (%)
Most Common Occupations - Life, physical, and social science occupations (%)
Most Common Occupations - Education, legal, community service, arts, and media occupations (%)
Most Common Occupations - Community and social service occupations (%)
Most Common Occupations - Legal occupations (%)
Most Common Occupations - Education, training, and library occupations (%)
Most Common Occupations - Arts, design, entertainment, sports, and media occupations (%)
Most Common Occupations - Healthcare practitioners and technical occupations (%)
Most Common Occupations - Health diagnosing and treating practitioners and other technical occupations (%)
Most Common Occupations - Health technologists and technicians (%)
Most Common Occupations - Service occupations (%)
Most Common Occupations - Healthcare support occupations (%)
Most Common Occupations - Protective service occupations (%)
Most Common Occupations - Fire fighting and prevention, and other protective service workers including supervisors (%)
Most Common Occupations - Law enforcement workers including supervisors (%)
Most Common Occupations - Food preparation and serving related occupations (%)
Most Common Occupations - Building and grounds cleaning and maintenance occupations (%)
Most Common Occupations - Personal care and service occupations (%)
Most Common Occupations - Sales and office occupations (%)
Most Common Occupations - Sales and related occupations (%)
Most Common Occupations - Office and administrative support occupations (%)
Most Common Occupations - Natural resources, construction, and maintenance occupations (%)
Most Common Occupations - Farming, fishing, and forestry occupations (%)
Most Common Occupations - Construction and extraction occupations (%)
Most Common Occupations - Installation, maintenance, and repair occupations (%)
Most Common Occupations - Production, transportation, and material moving occupations (%)
Most Common Occupations - Production occupations (%)
Most Common Occupations - Transportation occupations (%)
Most Common Occupations - Material moving occupations (%)
People in Group quarters - Institutionalized population (%)
People in Group quarters - Correctional institutions (%)
People in Group quarters - Federal prisons and detention centers (%)
People in Group quarters - Halfway houses (%)
People in Group quarters - Local jails and other confinement facilities (including police lockups) (%)
People in Group quarters - Military disciplinary barracks (%)
People in Group quarters - State prisons (%)
People in Group quarters - Other types of correctional institutions (%)
People in Group quarters - Nursing homes (%)
People in Group quarters - Hospitals/wards, hospices, and schools for the handicapped (%)
People in Group quarters - Hospitals/wards and hospices for chronically ill (%)
People in Group quarters - Hospices or homes for chronically ill (%)
People in Group quarters - Military hospitals or wards for chronically ill (%)
People in Group quarters - Other hospitals or wards for chronically ill (%)
People in Group quarters - Hospitals or wards for drug/alcohol abuse (%)
People in Group quarters - Mental (Psychiatric) hospitals or wards (%)
People in Group quarters - Schools, hospitals, or wards for the mentally retarded (%)
People in Group quarters - Schools, hospitals, or wards for the physically handicapped (%)
People in Group quarters - Institutions for the deaf (%)
People in Group quarters - Institutions for the blind (%)
People in Group quarters - Orthopedic wards and institutions for the physically handicapped (%)
People in Group quarters - Wards in general hospitals for patients who have no usual home elsewhere (%)
People in Group quarters - Wards in military hospitals for patients who have no usual home elsewhere (%)
People in Group quarters - Juvenile institutions (%)
People in Group quarters - Long-term care (%)
People in Group quarters - Homes for abused, dependent, and neglected children (%)
People in Group quarters - Residential treatment centers for emotionally disturbed children (%)
People in Group quarters - Training schools for juvenile delinquents (%)
People in Group quarters - Short-term care, detention or diagnostic centers for delinquent children (%)
People in Group quarters - Type of juvenile institution unknown (%)
People in Group quarters - Noninstitutionalized population (%)
People in Group quarters - College dormitories (includes college quarters off campus) (%)
People in Group quarters - Military quarters (%)
People in Group quarters - On base (%)
People in Group quarters - Barracks, unaccompanied personnel housing (UPH), (Enlisted/Officer), ;and similar group living quarters for military personnel (%)
People in Group quarters - Transient quarters for temporary residents (%)
People in Group quarters - Military ships (%)
People in Group quarters - Group homes (%)
People in Group quarters - Homes or halfway houses for drug/alcohol abuse (%)
People in Group quarters - Homes for the mentally ill (%)
People in Group quarters - Homes for the mentally retarded (%)
People in Group quarters - Homes for the physically handicapped (%)
People in Group quarters - Other group homes (%)
People in Group quarters - Religious group quarters (%)
People in Group quarters - Dormitories (%)
People in Group quarters - Agriculture workers' dormitories on farms (%)
People in Group quarters - Job Corps and vocational training facilities (%)
People in Group quarters - Other workers' dormitories (%)
People in Group quarters - Crews of maritime vessels (%)
People in Group quarters - Other nonhousehold living situations (%)
People in Group quarters - Other noninstitutional group quarters (%)
Residents speaking English at home (%)
Residents speaking English at home - Born in the United States (%)
Residents speaking English at home - Native, born elsewhere (%)
Residents speaking English at home - Foreign born (%)
Residents speaking Spanish at home (%)
Residents speaking Spanish at home - Born in the United States (%)
Residents speaking Spanish at home - Native, born elsewhere (%)
Residents speaking Spanish at home - Foreign born (%)
Residents speaking other language at home (%)
Residents speaking other language at home - Born in the United States (%)
Residents speaking other language at home - Native, born elsewhere (%)
Residents speaking other language at home - Foreign born (%)
Class of Workers - Employee of private company (%)
Class of Workers - Self-employed in own incorporated business (%)
Class of Workers - Private not-for-profit wage and salary workers (%)
Class of Workers - Local government workers (%)
Class of Workers - State government workers (%)
Class of Workers - Federal government workers (%)
Class of Workers - Self-employed workers in own not incorporated business and Unpaid family workers (%)
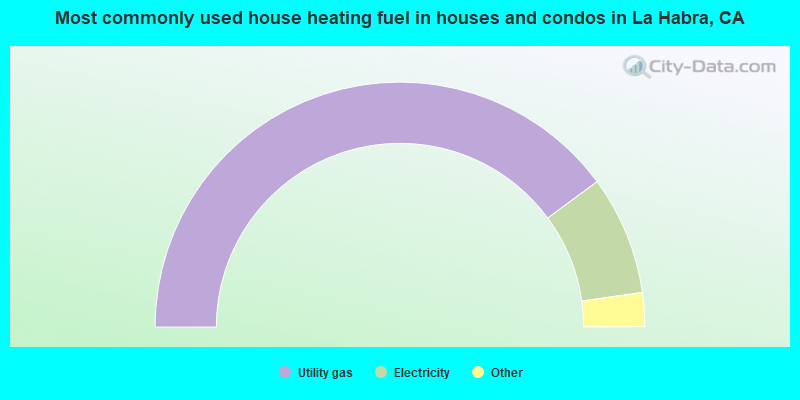
House heating fuel used in houses and condos - Utility gas (%)
House heating fuel used in houses and condos - Bottled, tank, or LP gas (%)
House heating fuel used in houses and condos - Electricity (%)
House heating fuel used in houses and condos - Fuel oil, kerosene, etc. (%)
House heating fuel used in houses and condos - Coal or coke (%)
House heating fuel used in houses and condos - Wood (%)
House heating fuel used in houses and condos - Solar energy (%)
House heating fuel used in houses and condos - Other fuel (%)
House heating fuel used in houses and condos - No fuel used (%)
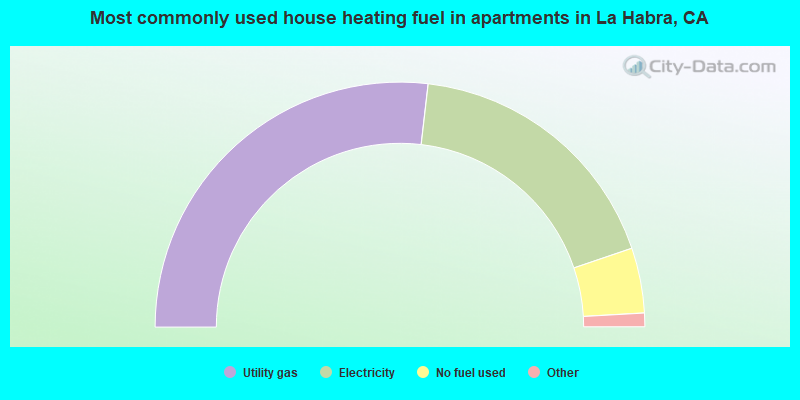
House heating fuel used in apartments - Utility gas (%)
House heating fuel used in apartments - Bottled, tank, or LP gas (%)
House heating fuel used in apartments - Electricity (%)
House heating fuel used in apartments - Fuel oil, kerosene, etc. (%)
House heating fuel used in apartments - Coal or coke (%)
House heating fuel used in apartments - Wood (%)
House heating fuel used in apartments - Solar energy (%)
House heating fuel used in apartments - Other fuel (%)
House heating fuel used in apartments - No fuel used (%)
Armed forces status - In Armed Forces (%)
Armed forces status - Civilian (%)
Armed forces status - Civilian - Veteran (%)
Armed forces status - Civilian - Nonveteran (%)
Fatal accidents locations in years 2005-2021
Fatal accidents locations in 2005
Fatal accidents locations in 2006
Fatal accidents locations in 2007
Fatal accidents locations in 2008
Fatal accidents locations in 2009
Fatal accidents locations in 2010
Fatal accidents locations in 2011
Fatal accidents locations in 2012
Fatal accidents locations in 2013
Fatal accidents locations in 2014
Fatal accidents locations in 2015
Fatal accidents locations in 2016
Fatal accidents locations in 2017
Fatal accidents locations in 2018
Fatal accidents locations in 2019
Fatal accidents locations in 2020
Fatal accidents locations in 2021
Alcohol use - People drinking some alcohol every month (%)
Alcohol use - People not drinking at all (%)
Alcohol use - Average days/month drinking alcohol
Alcohol use - Average drinks/week
Alcohol use - Average days/year people drink much
Audiometry - Average condition of hearing (%)
Audiometry - People that can hear a whisper from across a quiet room (%)
Audiometry - People that can hear normal voice from across a quiet room (%)
Audiometry - Ears ringing, roaring, buzzing (%)
Audiometry - Had a job exposure to loud noise (%)
Audiometry - Had off-work exposure to loud noise (%)
Blood Pressure & Cholesterol - Has high blood pressure (%)
Blood Pressure & Cholesterol - Checking blood pressure at home (%)
Blood Pressure & Cholesterol - Frequently checking blood cholesterol (%)
Blood Pressure & Cholesterol - Has high cholesterol level (%)
Consumer Behavior - Money monthly spent on food at supermarket/grocery store
Consumer Behavior - Money monthly spent on food at other stores
Consumer Behavior - Money monthly spent on eating out
Consumer Behavior - Money monthly spent on carryout/delivered foods
Consumer Behavior - Income spent on food at supermarket/grocery store (%)
Consumer Behavior - Income spent on food at other stores (%)
Consumer Behavior - Income spent on eating out (%)
Consumer Behavior - Income spent on carryout/delivered foods (%)
Current Health Status - General health condition (%)
Current Health Status - Blood donors (%)
Current Health Status - Has blood ever tested for HIV virus (%)
Current Health Status - Left-handed people (%)
Dermatology - People using sunscreen (%)
Diabetes - Diabetics (%)
Diabetes - Had a blood test for high blood sugar (%)
Diabetes - People taking insulin (%)
Diet Behavior & Nutrition - Diet health (%)
Diet Behavior & Nutrition - Milk product consumption (# of products/month)
Diet Behavior & Nutrition - Meals not home prepared (#/week)
Diet Behavior & Nutrition - Meals from fast food or pizza place (#/week)
Diet Behavior & Nutrition - Ready-to-eat foods (#/month)
Diet Behavior & Nutrition - Frozen meals/pizza (#/month)
Drug Use - People that ever used marijuana or hashish (%)
Drug Use - Ever used hard drugs (%)
Drug Use - Ever used any form of cocaine (%)
Drug Use - Ever used heroin (%)
Drug Use - Ever used methamphetamine (%)
Health Insurance - People covered by health insurance (%)
Kidney Conditions-Urology - Avg. # of times urinating at night
Medical Conditions - People with asthma (%)
Medical Conditions - People with anemia (%)
Medical Conditions - People with psoriasis (%)
Medical Conditions - People with overweight (%)
Medical Conditions - Elderly people having difficulties in thinking or remembering (%)
Medical Conditions - People who ever received blood transfusion (%)
Medical Conditions - People having trouble seeing even with glass/contacts (%)
Medical Conditions - People with arthritis (%)
Medical Conditions - People with gout (%)
Medical Conditions - People with congestive heart failure (%)
Medical Conditions - People with coronary heart disease (%)
Medical Conditions - People with angina pectoris (%)
Medical Conditions - People who ever had heart attack (%)
Medical Conditions - People who ever had stroke (%)
Medical Conditions - People with emphysema (%)
Medical Conditions - People with thyroid problem (%)
Medical Conditions - People with chronic bronchitis (%)
Medical Conditions - People with any liver condition (%)
Medical Conditions - People who ever had cancer or malignancy (%)
Mental Health - People who have little interest in doing things (%)
Mental Health - People feeling down, depressed, or hopeless (%)
Mental Health - People who have trouble sleeping or sleeping too much (%)
Mental Health - People feeling tired or having little energy (%)
Mental Health - People with poor appetite or overeating (%)
Mental Health - People feeling bad about themself (%)
Mental Health - People who have trouble concentrating on things (%)
Mental Health - People moving or speaking slowly or too fast (%)
Mental Health - People having thoughts they would be better off dead (%)
Oral Health - Average years since last visit a dentist
Oral Health - People embarrassed because of mouth (%)
Oral Health - People with gum disease (%)
Oral Health - General health of teeth and gums (%)
Oral Health - Average days a week using dental floss/device
Oral Health - Average days a week using mouthwash for dental problem
Oral Health - Average number of teeth
Pesticide Use - Households using pesticides to control insects (%)
Pesticide Use - Households using pesticides to kill weeds (%)
Physical Activity - People doing vigorous-intensity work activities (%)
Physical Activity - People doing moderate-intensity work activities (%)
Physical Activity - People walking or bicycling (%)
Physical Activity - People doing vigorous-intensity recreational activities (%)
Physical Activity - People doing moderate-intensity recreational activities (%)
Physical Activity - Average hours a day doing sedentary activities
Physical Activity - Average hours a day watching TV or videos
Physical Activity - Average hours a day using computer
Physical Functioning - People having limitations keeping them from working (%)
Physical Functioning - People limited in amount of work they can do (%)
Physical Functioning - People that need special equipment to walk (%)
Physical Functioning - People experiencing confusion/memory problems (%)
Physical Functioning - People requiring special healthcare equipment (%)
Prescription Medications - Average number of prescription medicines taking
Preventive Aspirin Use - Adults 40+ taking low-dose aspirin (%)
Reproductive Health - Vaginal deliveries (%)
Reproductive Health - Cesarean deliveries (%)
Reproductive Health - Deliveries resulted in a live birth (%)
Reproductive Health - Pregnancies resulted in a delivery (%)
Reproductive Health - Women breastfeeding newborns (%)
Reproductive Health - Women that had a hysterectomy (%)
Reproductive Health - Women that had both ovaries removed (%)
Reproductive Health - Women that have ever taken birth control pills (%)
Reproductive Health - Women taking birth control pills (%)
Reproductive Health - Women that have ever used Depo-Provera or injectables (%)
Reproductive Health - Women that have ever used female hormones (%)
Sexual Behavior - People 18+ that ever had sex (vaginal, anal, or oral) (%)
Sexual Behavior - Males 18+ that ever had vaginal sex with a woman (%)
Sexual Behavior - Males 18+ that ever performed oral sex on a woman (%)
Sexual Behavior - Males 18+ that ever had anal sex with a woman (%)
Sexual Behavior - Males 18+ that ever had any sex with a man (%)
Sexual Behavior - Females 18+ that ever had vaginal sex with a man (%)
Sexual Behavior - Females 18+ that ever performed oral sex on a man (%)
Sexual Behavior - Females 18+ that ever had anal sex with a man (%)
Sexual Behavior - Females 18+ that ever had any kind of sex with a woman (%)
Sexual Behavior - Average age people first had sex
Sexual Behavior - Average number of female sex partners in lifetime (males 18+)
Sexual Behavior - Average number of female vaginal sex partners in lifetime (males 18+)
Sexual Behavior - Average age people first performed oral sex on a woman (18+)
Sexual Behavior - Average number of woman performed oral sex on in lifetime (18+)
Sexual Behavior - Average number of male sex partners in lifetime (males 18+)
Sexual Behavior - Average number of male anal sex partners in lifetime (males 18+)
Sexual Behavior - Average age people first performed oral sex on a man (18+)
Sexual Behavior - Average number of male oral sex partners in lifetime (18+)
Sexual Behavior - People using protection when performing oral sex (%)
Sexual Behavior - Average number of times people have vaginal or anal sex a year
Sexual Behavior - People having sex without condom (%)
Sexual Behavior - Average number of male sex partners in lifetime (females 18+)
Sexual Behavior - Average number of male vaginal sex partners in lifetime (females 18+)
Sexual Behavior - Average number of female sex partners in lifetime (females 18+)
Sexual Behavior - Circumcised males 18+ (%)
Sleep Disorders - Average hours sleeping at night
Sleep Disorders - People that has trouble sleeping (%)
Smoking-Cigarette Use - People smoking cigarettes (%)
Taste & Smell - People 40+ having problems with smell (%)
Taste & Smell - People 40+ having problems with taste (%)
Taste & Smell - People 40+ that ever had wisdom teeth removed (%)
Taste & Smell - People 40+ that ever had tonsils teeth removed (%)
Taste & Smell - People 40+ that ever had a loss of consciousness because of a head injury (%)
Taste & Smell - People 40+ that ever had a broken nose or other serious injury to face or skull (%)
Taste & Smell - People 40+ that ever had two or more sinus infections (%)
Weight - Average height (inches)
Weight - Average weight (pounds)
Weight - Average BMI
Weight - People that are obese (%)
Weight - People that ever were obese (%)
Weight - People trying to lose weight (%)
37,401 59.9% Hispanic 14,891 23.9% White alone 7,565 12.1% Asian alone 1,282 2.1% Two or more races 1,022 1.6% Black alone 131 0.2% Other race alone 33 0.05% American Indian alone 31 0.05% Native Hawaiian and Other
According to our research of California and other state lists, there were 43 registered sex offenders living in La Habra, California as of April 27, 2024 . The ratio of all residents to sex offenders in La Habra is 1,452 to 1.The ratio of registered sex offenders to all residents in this city is lower than the state average.
The City-Data.com crime index weighs serious crimes and violent crimes more heavily. Higher means more crime, U.S. average is 246.1. It adjusts for the number of visitors and daily workers commuting into cities.
- means the value is smaller than the state average.
- means the value is about the same as the state average.
- means the value is bigger than the state average.
Crime rate in La Habra detailed stats: murders, rapes, robberies, assaults, burglaries, thefts, arson Officers per 1,000 residents here:
1.01California average:
2.30
Latest news from La Habra, CA collected exclusively by city-data.com from local newspapers, TV, and radio stations
Ancestries: American (4.1%), English (2.3%), German (2.2%), Italian (1.6%), Irish (1.5%), European (1.4%).
Current Local Time:
Land area: 7.33 square miles.
Population density: 8,456 people per square mile (high).
15,764 residents are foreign born (15.7% Latin America , 7.9% Asia ).
This city:
25.3%California:
26.5%
Median real estate property taxes paid for housing units with mortgages in 2022: $4,842 (0.6%)Median real estate property taxes paid for housing units with no mortgage in 2022: $2,722 (0.4%)
Nearest city with pop. 200,000+: Anaheim, CA
Nearest city with pop. 1,000,000+: Los Angeles, CA
Nearest cities:
Latitude: 33.93 N, Longitude: 117.95 W
Daytime population change due to commuting: -13,024 (-20.9%)Workers who live and work in this city: 7,966 (25.2%)
La Habra tourist attractions:
Single-family new house construction building permits:
2022: 12 buildings , average cost: $835,4002021: 63 buildings , average cost: $179,3002020: 12 buildings , average cost: $301,2002019: 29 buildings , average cost: $199,8002018: 31 buildings , average cost: $188,7002017: 111 buildings , average cost: $210,1002016: 12 buildings , average cost: $322,8002015: 20 buildings , average cost: $300,8002014: 19 buildings , average cost: $180,8002013: 96 buildings , average cost: $224,9002012: 12 buildings , average cost: $204,8002011: 8 buildings , average cost: $310,7002010: 24 buildings , average cost: $319,5002009: 16 buildings , average cost: $269,1002008: 24 buildings , average cost: $240,3002007: 23 buildings , average cost: $208,0002006: 47 buildings , average cost: $256,3002005: 28 buildings , average cost: $160,3002004: 8 buildings , average cost: $133,6002003: 26 buildings , average cost: $204,5002002: 3 buildings , average cost: $235,5002001: 27 buildings , average cost: $284,2002000: 100 buildings , average cost: $290,2001999: 269 buildings , average cost: $285,7001998: 40 buildings , average cost: $252,2001997: 4 buildings , average cost: $118,900Unemployment in December 2023:
Population change in the 1990s: +7,483 (+14.5%).
Most common occupations in La Habra, CA (%)
Both Males Females
Building and grounds cleaning and maintenance occupations (4.8%)
Other office and administrative support workers, including supervisors (4.3%)
Other production occupations, including supervisors (4.2%)
Other sales and related occupations, including supervisors (3.9%)
Other management occupations, except farmers and farm managers (3.6%)
Material recording, scheduling, dispatching, and distributing workers (3.2%)
Sales representatives, services, wholesale and manufacturing (3.1%)
Building and grounds cleaning and maintenance occupations (6.3%)
Other production occupations, including supervisors (5.3%)
Driver/sales workers and truck drivers (4.4%)
Material recording, scheduling, dispatching, and distributing workers (4.2%)
Metal workers and plastic workers (4.0%)
Other sales and related occupations, including supervisors (3.9%)
Sales representatives, services, wholesale and manufacturing (3.8%)
Other office and administrative support workers, including supervisors (7.4%)
Information and record clerks, except customer service representatives (5.2%)
Secretaries and administrative assistants (4.9%)
Preschool, kindergarten, elementary, and middle school teachers (4.5%)
Other sales and related occupations, including supervisors (4.0%)
Other management occupations, except farmers and farm managers (3.5%)
Cashiers (3.4%)
Earthquake activity:
La Habra-area historical earthquake activity is significantly above California state average. It is 7015% greater than the overall U.S. average. On 7/21/1952 at 11:52:14, a magnitude 7.7 (7.7 UK, Class: Major, Intensity: VIII - XII) earthquake occurred 95.2 miles away from La Habra center, causing $50,000,000 total damage On 6/28/1992 at 11:57:34, a magnitude 7.6 (6.2 MB, 7.6 MS, 7.3 MW, Depth: 0.7 mi) earthquake occurred 83.2 miles away from La Habra center, causing 3 deaths ( 1 shaking deaths, 2 other deaths) and 400 injuries, causing $100,000,000 total damage and $40,000,000 insured lossesOn 10/16/1999 at 09:46:44, a magnitude 7.4 (6.3 MB, 7.4 MS, 7.2 MW, 7.3 ML) earthquake occurred 95.7 miles away from La Habra center On 11/4/1927 at 13:51:53, a magnitude 7.5 (7.5 UK) earthquake occurred 188.4 miles away from La Habra center On 4/21/1918 at 22:32:30, a magnitude 6.8 (6.8 UK, Class: Strong, Intensity: VII - IX) earthquake occurred 30.5 miles away from La Habra center On 1/17/1994 at 12:30:55, a magnitude 6.8 (6.4 MB, 6.8 MS, 6.7 MW, Depth: 11.4 mi) earthquake occurred 39.0 miles away from the city center, causing 60 deaths ( 60 shaking deaths) and 7000 injuriesMagnitude types: body-wave magnitude (MB), local magnitude (ML), surface-wave magnitude (MS), moment magnitude (MW) Natural disasters: The number of natural disasters in Orange County (32) is a lot greater than the US average (15).Major Disasters (Presidential) Declared: 22Emergencies Declared: 2Floods: 15, Fires: 13, Storms: 9, Landslides: 6, Winter Storms: 6, Mudslides: 5, Earthquakes: 2, Heavy Rain: 1, Hurricane: 1, Snow: 1, Tornado: 1, Wind: 1, Other: 1 (Note: some incidents may be assigned to more than one category). Hospitals and medical centers in La Habra: LA HABRA CONV. HOSP. (1233 WEST LA HABRA BOULEVARD)
PARK REGENCY CARE CENTER (1770 W. LA HABRA BLVD.)
QUOTIDIAN DIALYSIS (1055 E. LA HABRA BLVD., SUITE 6)
ATRIUM HOME HEALTH, INC (1901 EAST LAMBERT RD, SUITE 207)
JM HOMECARE SOLUTIONS, INC (625 SOUTH PALM STREET SUITE E)
SUNSHINE EXTENDED SERVICES INC (2501 LA HABRA BLVD, SUITE 4)
Amtrak stations near La Habra: 5 miles: FULLERTON (120 E. SANTA FE AVE.) Services: ticket office, fully wheelchair accessible, enclosed waiting area, public restrooms, public payphones, full-service food facilities, free short-term parking, paid long-term parking, taxi stand, public transit connection.
10 miles: ANAHEIM (2150 KATELLA AVE.) Services: ticket office, fully wheelchair accessible, enclosed waiting area, public restrooms, public payphones, vending machines, free short-term parking, free long-term parking, call for car rental service, call for taxi service.
14 miles: SANTA ANA (1000 E. SANTA ANA BLVD.) Services: ticket office, fully wheelchair accessible, enclosed waiting area, public restrooms, public payphones, snack bar, free short-term parking, free long-term parking, call for car rental service, taxi stand, intercity bus service, public transit connection.
Colleges/universities with over 2000 students nearest to La Habra:
Biola University (about 5 miles; La Mirada, CA ; Full-time enrollment: 5,325)
Fullerton College (about 5 miles; Fullerton, CA ; FT enrollment: 11,124)
California State University-Fullerton (about 5 miles; Fullerton, CA ; FT enrollment: 28,947)
Hacienda La Puente Adult Education (about 6 miles; La Puente, CA ; FT enrollment: 2,750)
Rio Hondo College (about 8 miles; Whittier, CA ; FT enrollment: 9,610)
Cypress College (about 9 miles; Cypress, CA ; FT enrollment: 8,732)
West Coast University-Orange County (about 9 miles; Anaheim, CA ; FT enrollment: 2,464)
Public high schools in La Habra: LA HABRA HIGH Students: 1,606, Location: 801 W. HIGHLANDER AVE., Grades: 9-12)SONORA HIGH Students: 1,515, Location: 401 S. PALM ST., Grades: 9-12)Private high school in La Habra: WHITTIER CHRISTIAN HIGH SCHOOL Students: 658, Location: 501 N BEACH BLVD, Grades: 9-12)
Biggest public elementary/middle schools in La Habra: IMPERIAL MIDDLE Students: 898, Location: 1450 S. SCHWOOD DR., Grades: 6-8)WASHINGTON MIDDLE Students: 893, Location: 716 E. LA HABRA BLVD., Grades: 6-8)SIERRA VISTA ELEMENTARY Students: 672, Location: 1800 E. WHITTIER BLVD., Grades: 3-5)LAS POSITAS ELEMENTARY Students: 565, Location: 1400 S. SCHWOOD DR., Grades: 3-5)MACY ELEMENTARY Students: 337, Location: 2301 W. RUSSELL ST., Grades: KG-6)OLITA ELEMENTARY Students: 321, Location: 950 S. BRIERCLIFF DR., Grades: KG-6)EL PORTAL ELEMENTARY Students: 303, Location: 200 N. NADA ST., Grades: KG-6)LADERA PALMA ELEMENTARY Students: 151, Location: 2151 E. BROOKDALE AVE., Grades: KG-2)LAS LOMAS ELEMENTARY Students: 147, Location: 301 LAS LOMAS DR., Grades: KG-2)EL CERRITO ELEMENTARY Students: 131, Location: 1051 N. HILLSIDE, Grades: KG-2)Private elementary/middle school in La Habra: OUR LADY OF GUADALUPE SCHOOL Students: 203, Location: 920 W LA HABRA BLVD, Grades: KG-8)
See full list of schools located in La Habra User-submitted facts and corrections:
Emanuel Lutheran Preschool Students: 60 Grades : 2yrs-PK Locted 150 N Palm st
Notable locations in La Habra: (A) , La Habra City Hall (B) , Los Angeles County Fire Department Station 193 (C) , Los Angeles County Fire Department Station 194 (D) , Los Angeles County Fire Department Station 192 (E) , Los Angeles County Fire Department Station 191 (F) , Children's Museum at La Habra (G) . Display/hide their locations on the map
Shopping Centers: (1) , North Hills Plaza Shopping Center (2) , Gateway Plaza Shopping Center (3) , Central Plaza Shopping Center (4) , La Habra Market Place Shopping Center (5) . Display/hide their locations on the map
Churches in La Habra include: (A) , Community Bible Church (B) , Crossroads Community Church (C) , Emanuel Lutheran Church (D) , Family Bible Church (E) , First Fundamental Bible Church (F) , First Missionary Baptist Church (G) , Heights Evangelical Free Church (H) , Iglesia Biblica Fundamental (I) . Display/hide their locations on the map
Parks in La Habra include: (1) , Vista Grande Park (2) , Corona Park (3) , Descanso Park (4) , El Centro Park (5) , Estell Park (6) , Guadalupe Park (7) , Las Lomas Park (8) , Loma Norte Park (9) . Display/hide their locations on the map
Birthplace of: Ryan Winterswyk - Football tight end, Rusty Anderson - Rock guitarist, Ann Stanford - Poet, Stesha Carle - Rower.
Orange County has a predicted average indoor radon screening level less than 2 pCi/L (pico curies per liter) - Low Potential Average household size: This city:
3.2 peopleCalifornia:
2.9 people
Percentage of family households: This city:
75.4%Whole state:
68.7%
Percentage of households with unmarried partners: This city:
6.7%Whole state:
7.2%
Likely homosexual households (counted as self-reported same-sex unmarried-partner households)
Lesbian couples: 0.3% of all households Gay men: 0.3% of all households
People in group quarters in La Habra in 2010:
167 people in nursing facilities/skilled-nursing facilities
142 people in group homes intended for adults
21 people in workers' group living quarters and job corps centers
6 people in other noninstitutional facilities
4 people in in-patient hospice facilities
People in group quarters in La Habra in 2000:
326 people in other noninstitutional group quarters
252 people in nursing homes
7 people in religious group quarters
5 people in homes for the mentally retarded
5 people in homes for the physically handicapped
Banks with branches in La Habra (2011 data):
Wells Fargo Bank, National Association: La Habra Branch at 1190 S Beach Blvd, branch established on 1955/09/01; La Habra Heights Branch at 441 West Whittier Boulevard, branch established on 1979/01/22. Info updated 2011/04/05: Bank assets: $1,161,490.0 mil, Deposits: $905,653.0 mil, headquarters in Sioux Falls, SD, positive income , 6395 total offices , Holding Company: Wells Fargo & Company
U.S. Bank National Association: West Imperial Highway Vons Branch at 2101 West Imperial Highway, branch established on 2004/04/05; La Habra Albertsons Branch at 1800 W. Whittier Boulevard, branch established on 2008/11/21. Info updated 2012/01/30: Bank assets: $330,470.8 mil, Deposits: $236,091.5 mil, headquarters in Cincinnati, OH, positive income , 3121 total offices , Holding Company: U.S. Bancorp
Pacific Mercantile Bank: La Habra Branch at 1530 West Whittier Blvd.Ste B, branch established on 2003/09/08; La Habra Branch at 721 W. Whittier Blvd, Ste. G, branch established on 2002/06/03. Info updated 2006/11/03: Bank assets: $1,017.8 mil, Deposits: $863.5 mil, headquarters in Costa Mesa, CA, positive income , Commercial Lending Specialization, 10 total offices , Holding Company: Pacific Mercantile Bancorp
Banco Popular North America: La Habra Branch at 401 E Whittier Blvd, branch established on 1920/01/01; Fashion Square Branch at 1921 West Imperial Boulevard, Suite A, branch established on 1994/12/13. Info updated 2012/01/27: Bank assets: $8,605.3 mil, Deposits: $6,167.7 mil, headquarters in New York, NY, positive income , Commercial Lending Specialization, 97 total offices , Holding Company: Popular, Inc.
Union Bank, National Association: La Habra Branch at 1970 West Whittier Boulevard, branch established on 1969/08/29. Info updated 2011/09/01: Bank assets: $88,967.5 mil, Deposits: $65,286.4 mil, headquarters in San Francisco, CA, positive income , Commercial Lending Specialization, 403 total offices , Holding Company: Mitsubishi Ufj Financial Group, Inc.
Bank of America, National Association: La Habra Main Branch at 200 East La Habra Boulevard, branch established on 1934/12/24. Info updated 2009/11/18: Bank assets: $1,451,969.3 mil, Deposits: $1,077,176.8 mil, headquarters in Charlotte, NC, positive income , 5782 total offices , Holding Company: Bank Of America Corporation
JPMorgan Chase Bank, National Association: La Habra Branch at 1300 Imperial Way, branch established on 1889/01/01. Info updated 2011/11/10: Bank assets: $1,811,678.0 mil, Deposits: $1,190,738.0 mil, headquarters in Columbus, OH, positive income , International Specialization, 5577 total offices , Holding Company: Jpmorgan Chase & Co.
Bank of the West: La Habra Branch at 1330 S. Beach Boulevard, Suite A, branch established on 1969/08/08. Info updated 2009/11/16: Bank assets: $62,408.3 mil, Deposits: $43,995.2 mil, headquarters in San Francisco, CA, positive income , 647 total offices , Holding Company: Bnp Paribas
For population 15 years and over in La Habra:
Never married: 35.2%Now married: 47.9%Separated: 1.7%Widowed: 5.2%Divorced: 10.0% For population 25 years and over in La Habra:
High school or higher: 85.5%Bachelor's degree or higher: 28.7%Graduate or professional degree: 9.8%Unemployed: 6.5%Mean travel time to work (commute): 24.9 minutes
Education Gini index (Inequality in education) Here:
14.8California average:
15.5
Religion statistics for La Habra, CA (based on Orange County data)
Religion Adherents Congregations Catholic 797,473 67 Evangelical Protestant 345,893 894 Other 141,815 329 Mainline Protestant 76,574 202 Orthodox 13,406 19 Black Protestant 2,424 8 None 1,632,647 -
Source: Clifford Grammich, Kirk Hadaway, Richard Houseal, Dale E.Jones, Alexei Krindatch, Richie Stanley and Richard H.Taylor. 2012. 2010 U.S.Religion Census: Religious Congregations & Membership Study. Association of Statisticians of American Religious Bodies. Jones, Dale E., et al. 2002. Congregations and Membership in the United States 2000. Nashville, TN: Glenmary Research Center. Graphs represent county-level data
Food Environment Statistics: Number of grocery stores : 530This county :
1.78 / 10,000 pop.California :
2.14 / 10,000 pop.
Number of supercenters and club stores : 18This county :
0.06 / 10,000 pop.California :
0.04 / 10,000 pop.
Number of convenience stores (no gas) : 147Here :
0.49 / 10,000 pop.California :
0.62 / 10,000 pop.
Number of convenience stores (with gas) : 434Orange County :
1.46 / 10,000 pop.California :
1.49 / 10,000 pop.
Number of full-service restaurants : 2,438This county :
8.19 / 10,000 pop.California :
7.42 / 10,000 pop.
Adult diabetes rate : Orange County :
6.3%State :
7.3%
Adult obesity rate : Orange County :
18.5%State :
21.3%
Low-income preschool obesity rate : This county :
16.4%California :
17.9%
Health and Nutrition: Healthy diet rate : This city:
48.6%California:
49.4%
Average overall health of teeth and gums : La Habra:
48.3%California:
48.0%
Average BMI : La Habra:
28.1California:
28.1
People feeling badly about themselves : La Habra:
20.9%California:
20.2%
People not drinking alcohol at all : La Habra:
10.4%State:
11.2%
Average hours sleeping at night : Overweight people : This city:
31.7%California:
31.5%
General health condition : La Habra:
56.5%California:
56.4%
Average condition of hearing : La Habra:
81.1%California:
80.9%
More about Health and Nutrition of La Habra, CA Residents
Local government employment and payroll (March 2022)
Function
Full-time employees
Monthly full-time payroll
Average yearly full-time wage
Part-time employees
Monthly part-time payroll
Other and Unallocable
111 $675,404 $73,017 88 $147,934 Police Protection - Officers
70 $798,080 $136,814 0 $0 Police - Other
31 $222,088 $85,970 28 $33,602 Financial Administration
22 $177,794 $96,979 4 $6,333 Other Government Administration
5 $57,775 $138,660 11 $12,400
Totals for Government
239 $1,931,141 $96,961 131 $200,269
La Habra government finances - Expenditure in 2021 (per resident):
Construction - Regular Highways: $5,176,000 ($83.51)
Parks and Recreation: $673,000 ($10.86)Housing and Community Development: $179,000 ($2.89)Health - Other: $90,000 ($1.45)Current Operations - Water Utilities: $27,834,000 ($449.09)
Police Protection: $20,130,000 ($324.79)Local Fire Protection: $11,272,000 ($181.87)Parks and Recreation: $9,348,000 ($150.83)Regular Highways: $5,589,000 ($90.18)Sewerage: $4,504,000 ($72.67)Solid Waste Management: $4,379,000 ($70.65)General - Other: $4,207,000 ($67.88)Central Staff Services: $3,678,000 ($59.34)Health - Other: $3,540,000 ($57.12)Housing and Community Development: $2,540,000 ($40.98)Protective Inspection and Regulation - Other: $2,015,000 ($32.51)General - Interest on Debt: $927,000 ($14.96)
Water Utilities - Interest on Debt: $3,379,000 ($54.52)
La Habra government finances - Revenue in 2021 (per resident):
Charges - Other: $8,527,000 ($137.58)
Sewerage: $5,456,000 ($88.03)Solid Waste Management: $4,330,000 ($69.86)Housing and Community Development: $1,300,000 ($20.98)Parks and Recreation: $124,000 ($2.00)Federal Intergovernmental - Other: $1,562,000 ($25.20)
Housing and Community Development: $563,000 ($9.08)Local Intergovernmental - Other: $1,172,000 ($18.91)
Housing and Community Development: $628,000 ($10.13)Water Utilities: $135,000 ($2.18)Miscellaneous - Fines and Forfeits: $758,000 ($12.23)
Special Assessments: $594,000 ($9.58)Interest Earnings: $370,000 ($5.97)Rents: $232,000 ($3.74)Donations From Private Sources: $129,000 ($2.08)Sale of Property: $62,000 ($1.00)General Revenue - Other: $31,000 ($0.50)Revenue - Water Utilities: $36,467,000 ($588.39)
State Intergovernmental - Other: $20,065,000 ($323.74)
Highways: $2,566,000 ($41.40)Public Welfare: $1,370,000 ($22.10)General Local Government Support: $54,000 ($0.87)Tax - General Sales and Gross Receipts: $19,598,000 ($316.21)
Property: $19,555,000 ($315.52)Public Utilities Sales: $4,170,000 ($67.28)Other License: $1,710,000 ($27.59)Occupation and Business License - Other: $365,000 ($5.89)Documentary and Stock Transfer: $286,000 ($4.61)
La Habra government finances - Debt in 2021 (per resident):
Long Term Debt - Beginning Outstanding - Unspecified Public Purpose: $92,479,000 ($1492.13)
Outstanding Unspecified Public Purpose: $87,741,000 ($1415.68)Retired Unspecified Public Purpose: $16,573,000 ($267.40)Issue, Unspecified Public Purpose: $11,835,000 ($190.95)
La Habra government finances - Cash and Securities in 2021 (per resident):
Bond Funds - Cash and Securities: $3,785,000 ($61.07)
Other Funds - Cash and Securities: $69,873,000 ($1127.38)
Sinking Funds - Cash and Securities: $2,504,000 ($40.40)
4.86% of this county's 2021 resident taxpayers lived in other counties in 2020 ($95,983 average adjusted gross income )
Here:
4.86%California average:
5.19%
0.01% of residents moved from foreign countries ($132 average AGI )Orange County:
0.01%California average:
0.03%
Top counties from which taxpayers relocated into this county between 2020 and 2021:
5.71% of this county's 2020 resident taxpayers moved to other counties in 2021 ($106,828 average adjusted gross income )
Here:
5.71%California average:
6.14%
0.01% of residents moved to foreign countries ($180 average AGI )Orange County:
0.01%California average:
0.02%
Top counties to which taxpayers relocated from this county between 2020 and 2021:
Businesses in La Habra, CA
Name Count Name Count
7-Eleven 4 Kohl's 1 AT&T 1 LA Fitness 1 Ace Hardware 1 Lane Furniture 2 Albertsons 1 Little Caesars Pizza 1 Applebee's 1 Lowe's 1 AutoZone 1 MasterBrand Cabinets 5 Baja Fresh Mexican Grill 1 McDonald's 2 Baskin-Robbins 1 New Balance 1 Blockbuster 1 Nike 5 Burger King 2 OfficeMax 1 CVS 1 Panda Express 1 Carl\s Jr. 1 Payless 1 Chick-Fil-A 1 Penske 1 Chipotle 1 Pizza Hut 1 Cold Stone Creamery 1 Quiznos 1 Costco 1 RadioShack 1 DHL 2 Red Robin 1 Decora Cabinetry 1 Rite Aid 2 Dennys 1 SAS Shoes 1 Domino's Pizza 1 Safeway 1 DressBarn 1 Sam's Club 1 Dressbarn 1 Sprint Nextel 1 El Pollo Loco 1 Starbucks 5 FedEx 7 Subway 4 Firestone Complete Auto Care 1 T.J.Maxx 1 GNC 2 Taco Bell 3 GameStop 1 Target 1 Goodwill 1 True Value 1 H&R Block 3 U-Haul 3 Home Depot 1 UPS 6 HomeTown Buffet 1 Verizon Wireless 2 IHOP 1 Vons 1 Jamba Juice 1 Walgreens 2 Justice 1 Walmart 1 KFC 2 Wendy's 1
Strongest AM radio stations in La Habra:
KFI (640 AM; 50 kW; LOS ANGELES, CA; Owner: CAPSTAR TX LIMITED PARTNERSHIP)
KTNQ (1020 AM; 50 kW; LOS ANGELES, CA; Owner: KTNQ-AM LICENSE CORP.)
KXTA (1150 AM; 50 kW; LOS ANGELES, CA; Owner: CITICASTERS LICENSES, L.P.)
KLAC (570 AM; 50 kW; LOS ANGELES, CA; Owner: AMFM RADIO LICENSES, L.L.C.)
KDIS (1110 AM; 50 kW; PASADENA, CA; Owner: ABC,INC.)
KFWB (980 AM; 50 kW; LOS ANGELES, CA; Owner: INFINITY BROADCASTING OPERATIONS, INC.)
KPLS (830 AM; 50 kW; ORANGE, CA; Owner: CRN LICENSES, LLC)
KALI (900 AM; 6 kW; WEST COVINA, CA; Owner: MULTICULTURAL RADIO BROADCASTING, INC.)
KMPC (1540 AM; 50 kW; LOS ANGELES, CA; Owner: ROSE CITY RADIO CORPORATION)
KNX (1070 AM; 50 kW; LOS ANGELES, CA; Owner: INFINITY BROADCASTING OPERATIONS, INC.)
KBLA (1580 AM; 50 kW; SANTA MONICA, CA)
KSPN (710 AM; 50 kW; LOS ANGELES, CA; Owner: KABC-AM RADIO, INC.)
KXMX (1190 AM; 25 kW; ANAHEIM, CA; Owner: NEW INSPIRATION BROADCASTING COMPANY)
Strongest FM radio stations in La Habra:
KCBS-FM (93.1 FM; LOS ANGELES, CA; Owner: INFINITY BROADCASTING OPERATIONS, INC.)
KZLA-FM (93.9 FM; LOS ANGELES, CA; Owner: EMMIS RADIO LICENSE CORPORATION)
KSCA (101.9 FM; GLENDALE, CA; Owner: HBC LICENSE CORPORATION)
KLOS (95.5 FM; LOS ANGELES, CA; Owner: KLOS-FM RADIO, INC.)
KOST (103.5 FM; LOS ANGELES, CA; Owner: CAPSTAR TX LIMITED PARTNERSHIP)
K212FA (90.3 FM; TEMPLE CITY, CA; Owner: EDUCATIONAL MEDIA FOUNDATION)
KPWR (105.9 FM; LOS ANGELES, CA; Owner: EMMIS RADIO LICENSE CORPORATION)
KLSX (97.1 FM; LOS ANGELES, CA; Owner: INFINITY BROADCASTING OPERATIONS, INC.)
KIIS-FM (102.7 FM; LOS ANGELES, CA; Owner: CITICASTERS LICENSES, L.P.)
KLVE (107.5 FM; LOS ANGELES, CA; Owner: KLVE-FM LICENSE CORP.)
KUSC (91.5 FM; LOS ANGELES, CA; Owner: UNIVERSITY OF SOUTHERN CALIFORNIA)
KPCC (89.3 FM; PASADENA, CA; Owner: PASADENA AREA COMMUNITY COLLEGE DISTRICT)
KHHT (92.3 FM; LOS ANGELES, CA; Owner: AMFM RADIO LICENSES, L.L.C.)
KKLA-FM (99.5 FM; LOS ANGELES, CA; Owner: NEW INSPIRATION BROADCASTING CO., INC.)
KBIG-FM (104.3 FM; LOS ANGELES, CA; Owner: AMFM RADIO LICENSES, L.L.C.)
KTWV (94.7 FM; LOS ANGELES, CA; Owner: INFINITY BROADCASTING OPERATIONS, INC.)
KMZT-FM (105.1 FM; LOS ANGELES, CA; Owner: MOUNT WILSON FM BROADCASTERS, INC.)
KPFK (90.7 FM; LOS ANGELES, CA; Owner: PACIFICA FOUNDATION, INC)
K216EM (91.1 FM; ARCADIA, CA; Owner: LIFE ON THE WAY COMMUNICATIONS, INC.)
KRTH-FM (101.1 FM; LOS ANGELES, CA; Owner: INFINITY BROADCASTING OPERATIONS, INC.)
TV broadcast stations around La Habra:
KCBS-TV (Channel 2; LOS ANGELES, CA; Owner: CBS BROADCASTING INC.)
KTRO-LP (Channel 50; LANCASTER, CA; Owner: ROBERT D. ADELMAN)
KTLA-TV (Channel 5; LOS ANGELES, CA; Owner: KTLA INC.)
KABC-TV (Channel 7; LOS ANGELES, CA; Owner: ABC HOLDING COMPANY, INC.)
KHIZ (Channel 64; BARSTOW, CA; Owner: SUNBELT TELEVISION, INC.)
KCAL-TV (Channel 9; LOS ANGELES, CA; Owner: VIACOM TELEVISION STATIONS GROUP OF LOS ANGELES LLC)
KNBC (Channel 4; LOS ANGELES, CA; Owner: NBC SUBSIDIARY (KNBC-TV), INC.)
KMEX-TV (Channel 34; LOS ANGELES, CA; Owner: KMEX LICENSE PARTNERSHIP, G.P.)
KAZA-TV (Channel 54; AVALON, CA; Owner: PAPPAS SOUTHERN CALIFORNIA LICENSE LLC)
KDOC-TV (Channel 56; ANAHEIM, CA; Owner: GOLDEN ORANGE BROADCASTING CO., INC.)
KOCE-TV (Channel 50; HUNTINGTON BEACH, CA; Owner: BD. OF TRUSTEES, COAST COMMUNITY COLLEGE DIST.)
KSCI (Channel 18; LONG BEACH, CA; Owner: KSLS, INC.)
KXLA (Channel 44; RANCHO PALOS VERDES, CA; Owner: RANCHO PALOS VERDES BROADCASTERS, INC.)
KCET (Channel 28; LOS ANGELES, CA; Owner: COMMUNITY TELEVISION OF SOUTHERN CALIFORNIA)
KFTR (Channel 46; ONTARIO, CA; Owner: TELEFUTURA LOS ANGELES LLC)
KWHY-TV (Channel 22; LOS ANGELES, CA; Owner: TELEMUNDO OF LOS ANGELES LICENSE CORPORATION)
KVEA (Channel 52; CORONA, CA; Owner: ESTRELLA LICENSE CORPORATION)
National Bridge Inventory (NBI) Statistics 12 Number of bridges56ft / 16.5m Total length194,600 Total average daily traffic2,801 Total average daily truck traffic334,047 Total future (year 2037) average daily traffic
New bridges - historical statistics
1 1930-1939 1 1950-1959 8 1960-1969 2 1970-1979
See full National Bridge Inventory statistics for La Habra, CA
Home Mortgage Disclosure Act Aggregated Statistics For Year 2009(Based on 8 full and 7 partial tracts) A) FHA, FSA/RHS & VA B) Conventional C) Refinancings D) Home Improvement Loans E) Loans on Dwellings For 5+ Families F) Non-occupant Loans on G) Loans On Manufactured Number Average Value Number Average Value Number Average Value Number Average Value Number Average Value Number Average Value Number Average Value
LOANS ORIGINATED 212 $289,698 218 $271,017 753 $278,295 46 $193,780 5 $2,073,606 52 $217,064 4 $26,500 APPLICATIONS APPROVED, NOT ACCEPTED 21 $302,128 30 $270,507 96 $304,364 8 $118,808 0 $0 11 $202,375 3 $65,410 APPLICATIONS DENIED 40 $273,540 59 $250,520 282 $308,206 20 $133,618 0 $0 30 $208,008 7 $40,960 APPLICATIONS WITHDRAWN 25 $305,870 46 $283,835 177 $306,261 10 $114,558 0 $0 15 $222,684 0 $0 FILES CLOSED FOR INCOMPLETENESS 9 $231,562 10 $232,468 65 $305,253 4 $198,125 0 $0 3 $172,903 2 $92,500
Aggregated Statistics For Year 2008(Based on 8 full and 7 partial tracts) A) FHA, FSA/RHS & VA B) Conventional C) Refinancings D) Home Improvement Loans E) Loans on Dwellings For 5+ Families F) Non-occupant Loans on G) Loans On Manufactured Number Average Value Number Average Value Number Average Value Number Average Value Number Average Value Number Average Value Number Average Value
LOANS ORIGINATED 107 $315,986 303 $283,185 467 $285,044 70 $133,017 3 $3,456,290 51 $243,253 10 $62,759 APPLICATIONS APPROVED, NOT ACCEPTED 7 $252,511 79 $268,891 142 $287,365 18 $96,331 0 $0 10 $208,445 16 $77,977 APPLICATIONS DENIED 17 $329,064 90 $315,793 396 $327,721 54 $166,744 1 $8,350,200 40 $264,839 11 $51,361 APPLICATIONS WITHDRAWN 15 $301,818 58 $322,203 136 $301,335 17 $132,565 0 $0 22 $282,107 1 $24,000 FILES CLOSED FOR INCOMPLETENESS 0 $0 18 $341,661 34 $354,284 5 $173,976 0 $0 8 $279,788 0 $0
Aggregated Statistics For Year 2007(Based on 8 full and 7 partial tracts) A) FHA, FSA/RHS & VA B) Conventional C) Refinancings D) Home Improvement Loans E) Loans on Dwellings For 5+ Families F) Non-occupant Loans on G) Loans On Manufactured Number Average Value Number Average Value Number Average Value Number Average Value Number Average Value Number Average Value Number Average Value
LOANS ORIGINATED 2 $328,000 464 $318,092 1,072 $315,405 175 $206,412 12 $1,995,999 111 $314,487 18 $69,484 APPLICATIONS APPROVED, NOT ACCEPTED 0 $0 138 $284,458 321 $349,521 32 $372,712 0 $0 22 $340,010 15 $78,889 APPLICATIONS DENIED 1 $340,000 193 $332,244 721 $352,144 99 $213,721 0 $0 64 $319,402 22 $76,444 APPLICATIONS WITHDRAWN 1 $238,000 100 $353,725 264 $355,114 41 $262,776 1 $1,700,410 20 $377,272 0 $0 FILES CLOSED FOR INCOMPLETENESS 0 $0 38 $317,474 114 $371,703 10 $235,868 0 $0 6 $339,472 0 $0
Aggregated Statistics For Year 2006(Based on 8 full and 7 partial tracts) A) FHA, FSA/RHS & VA B) Conventional C) Refinancings D) Home Improvement Loans E) Loans on Dwellings For 5+ Families F) Non-occupant Loans on G) Loans On Manufactured Number Average Value Number Average Value Number Average Value Number Average Value Number Average Value Number Average Value Number Average Value
LOANS ORIGINATED 3 $214,860 1,063 $265,713 1,578 $319,868 267 $179,701 21 $1,108,320 197 $309,891 9 $60,410 APPLICATIONS APPROVED, NOT ACCEPTED 0 $0 290 $271,708 374 $323,465 47 $198,514 0 $0 54 $298,563 11 $65,375 APPLICATIONS DENIED 1 $344,000 511 $269,230 760 $357,526 203 $197,907 4 $486,102 67 $326,441 12 $81,365 APPLICATIONS WITHDRAWN 2 $236,500 230 $290,330 515 $347,156 63 $219,890 2 $1,021,625 46 $264,090 2 $156,180 FILES CLOSED FOR INCOMPLETENESS 0 $0 61 $278,655 128 $352,772 8 $178,945 0 $0 12 $319,367 0 $0
Aggregated Statistics For Year 2005(Based on 8 full and 7 partial tracts) A) FHA, FSA/RHS & VA B) Conventional C) Refinancings D) Home Improvement Loans E) Loans on Dwellings For 5+ Families F) Non-occupant Loans on G) Loans On Manufactured Number Average Value Number Average Value Number Average Value Number Average Value Number Average Value Number Average Value Number Average Value
LOANS ORIGINATED 1 $204,000 1,103 $283,082 1,767 $298,803 272 $194,102 17 $2,337,779 165 $272,983 10 $84,508 APPLICATIONS APPROVED, NOT ACCEPTED 0 $0 185 $259,576 324 $278,879 31 $178,917 1 $140,000 36 $238,642 24 $69,800 APPLICATIONS DENIED 1 $276,000 340 $263,071 739 $306,229 146 $188,059 1 $500,000 56 $295,000 30 $85,425 APPLICATIONS WITHDRAWN 0 $0 238 $268,788 694 $298,371 86 $186,223 1 $497,000 39 $205,120 4 $69,250 FILES CLOSED FOR INCOMPLETENESS 0 $0 55 $274,833 154 $321,217 20 $152,817 0 $0 9 $334,421 0 $0
Aggregated Statistics For Year 2004(Based on 8 full and 7 partial tracts) A) FHA, FSA/RHS & VA B) Conventional C) Refinancings D) Home Improvement Loans E) Loans on Dwellings For 5+ Families F) Non-occupant Loans on G) Loans On Manufactured Number Average Value Number Average Value Number Average Value Number Average Value Number Average Value Number Average Value Number Average Value
LOANS ORIGINATED 19 $202,700 1,185 $234,831 2,226 $253,099 284 $144,817 20 $1,530,334 213 $241,740 154 $76,361 APPLICATIONS APPROVED, NOT ACCEPTED 0 $0 449 $151,729 368 $219,432 47 $108,091 1 $842,000 36 $228,399 305 $78,161 APPLICATIONS DENIED 4 $177,750 466 $174,232 747 $230,186 143 $120,307 2 $780,000 60 $228,503 304 $76,581 APPLICATIONS WITHDRAWN 5 $187,000 169 $240,748 708 $245,665 76 $118,371 1 $333,000 27 $225,065 2 $59,000 FILES CLOSED FOR INCOMPLETENESS 1 $294,000 22 $241,031 138 $265,559 11 $98,274 0 $0 5 $255,220 0 $0
Aggregated Statistics For Year 2003(Based on 8 full and 7 partial tracts) A) FHA, FSA/RHS & VA B) Conventional C) Refinancings D) Home Improvement Loans E) Loans on Dwellings For 5+ Families F) Non-occupant Loans on Number Average Value Number Average Value Number Average Value Number Average Value Number Average Value Number Average Value
LOANS ORIGINATED 64 $202,342 925 $221,490 3,959 $204,712 106 $69,889 20 $1,280,594 248 $187,073 APPLICATIONS APPROVED, NOT ACCEPTED 1 $247,670 147 $222,560 530 $207,843 29 $63,541 1 $254,000 54 $189,919 APPLICATIONS DENIED 7 $254,576 206 $199,121 910 $201,157 83 $36,130 3 $461,210 59 $202,237 APPLICATIONS WITHDRAWN 8 $229,211 127 $222,647 864 $216,870 39 $53,383 0 $0 36 $214,417 FILES CLOSED FOR INCOMPLETENESS 1 $370,210 25 $230,973 200 $222,440 9 $59,187 1 $3,500,000 14 $231,756
Aggregated Statistics For Year 2002(Based on 6 full and 5 partial tracts) A) FHA, FSA/RHS & VA B) Conventional C) Refinancings D) Home Improvement Loans E) Loans on Dwellings For 5+ Families F) Non-occupant Loans on Number Average Value Number Average Value Number Average Value Number Average Value Number Average Value Number Average Value
LOANS ORIGINATED 107 $197,483 648 $176,403 1,956 $182,707 70 $47,782 25 $1,669,068 115 $158,342 APPLICATIONS APPROVED, NOT ACCEPTED 7 $191,770 71 $193,597 254 $181,409 25 $41,860 1 $384,210 17 $150,132 APPLICATIONS DENIED 12 $211,534 107 $154,927 433 $184,580 52 $25,800 4 $585,945 22 $162,998 APPLICATIONS WITHDRAWN 6 $215,207 62 $160,287 439 $182,903 28 $41,471 1 $279,270 17 $167,261 FILES CLOSED FOR INCOMPLETENESS 9 $201,333 25 $153,439 144 $180,009 1 $25,000 0 $0 1 $139,810
Aggregated Statistics For Year 2001(Based on 6 full and 5 partial tracts) A) FHA, FSA/RHS & VA B) Conventional C) Refinancings D) Home Improvement Loans E) Loans on Dwellings For 5+ Families F) Non-occupant Loans on Number Average Value Number Average Value Number Average Value Number Average Value Number Average Value Number Average Value
LOANS ORIGINATED 173 $163,046 509 $149,653 1,447 $164,034 59 $37,332 14 $743,549 109 $145,885 APPLICATIONS APPROVED, NOT ACCEPTED 5 $187,274 53 $202,189 208 $162,003 18 $44,637 1 $962,030 17 $143,074 APPLICATIONS DENIED 17 $164,954 105 $152,709 382 $147,847 62 $29,536 1 $770,000 21 $157,802 APPLICATIONS WITHDRAWN 15 $169,680 75 $181,135 383 $170,296 29 $49,993 1 $367,000 23 $153,332 FILES CLOSED FOR INCOMPLETENESS 2 $201,000 11 $190,178 101 $170,073 1 $25,040 3 $2,086,593 8 $91,492
Aggregated Statistics For Year 2000(Based on 6 full and 5 partial tracts) A) FHA, FSA/RHS & VA B) Conventional C) Refinancings D) Home Improvement Loans E) Loans on Dwellings For 5+ Families F) Non-occupant Loans on Number Average Value Number Average Value Number Average Value Number Average Value Number Average Value Number Average Value
LOANS ORIGINATED 200 $152,437 507 $160,409 369 $131,343 59 $36,921 10 $2,151,841 50 $127,673 APPLICATIONS APPROVED, NOT ACCEPTED 11 $165,236 99 $112,755 85 $131,817 33 $27,281 1 $1,561,320 8 $200,978 APPLICATIONS DENIED 22 $167,323 205 $120,787 212 $124,608 54 $29,618 1 $386,000 14 $128,427 APPLICATIONS WITHDRAWN 19 $136,203 102 $169,516 121 $122,357 5 $30,894 1 $398,000 7 $106,790 FILES CLOSED FOR INCOMPLETENESS 6 $152,573 23 $200,882 67 $138,048 1 $20,000 3 $2,345,973 5 $140,088
Aggregated Statistics For Year 1999(Based on 9 full and 4 partial tracts) A) FHA, FSA/RHS & VA B) Conventional C) Refinancings D) Home Improvement Loans E) Loans on Dwellings For 5+ Families F) Non-occupant Loans on Number Average Value Number Average Value Number Average Value Number Average Value Number Average Value Number Average Value
LOANS ORIGINATED 228 $143,375 606 $158,266 942 $136,626 107 $23,281 24 $721,217 78 $108,301 APPLICATIONS APPROVED, NOT ACCEPTED 15 $153,848 115 $127,547 151 $135,583 40 $23,358 0 $0 18 $102,314 APPLICATIONS DENIED 35 $154,465 360 $102,586 423 $136,845 61 $27,401 4 $357,250 23 $105,514 APPLICATIONS WITHDRAWN 29 $136,227 199 $194,743 366 $144,299 10 $49,558 0 $0 20 $100,290 FILES CLOSED FOR INCOMPLETENESS 7 $136,747 19 $161,018 84 $142,775 3 $29,847 3 $3,569,733 5 $120,470
Detailed mortgage data for all 15 tracts in La Habra, CA
Private Mortgage Insurance Companies Aggregated Statistics For Year 2009(Based on 8 full and 7 partial tracts) A) Conventional B) Refinancings Number Average Value Number Average Value
LOANS ORIGINATED 26 $283,113 2 $413,545 APPLICATIONS APPROVED, NOT ACCEPTED 18 $334,913 3 $372,487 APPLICATIONS DENIED 5 $261,522 4 $301,235 APPLICATIONS WITHDRAWN 2 $247,500 1 $328,130 FILES CLOSED FOR INCOMPLETENESS 2 $341,750 0 $0
Aggregated Statistics For Year 2008(Based on 8 full and 7 partial tracts) A) Conventional B) Refinancings C) Non-occupant Loans on Number Average Value Number Average Value Number Average Value
LOANS ORIGINATED 71 $324,136 16 $376,908 0 $0 APPLICATIONS APPROVED, NOT ACCEPTED 42 $357,783 25 $371,392 3 $257,333 APPLICATIONS DENIED 21 $347,781 3 $480,603 2 $430,295 APPLICATIONS WITHDRAWN 6 $322,070 3 $397,947 0 $0 FILES CLOSED FOR INCOMPLETENESS 1 $459,510 0 $0 0 $0
Aggregated Statistics For Year 2007(Based on 8 full and 7 partial tracts) A) Conventional B) Refinancings C) Non-occupant Loans on Number Average Value Number Average Value Number Average Value
LOANS ORIGINATED 33 $380,051 24 $426,851 5 $303,030 APPLICATIONS APPROVED, NOT ACCEPTED 5 $441,200 11 $435,662 0 $0 APPLICATIONS DENIED 3 $397,000 4 $445,052 1 $349,000 APPLICATIONS WITHDRAWN 3 $525,650 3 $534,140 0 $0 FILES CLOSED FOR INCOMPLETENESS 0 $0 0 $0 0 $0
Aggregated Statistics For Year 2006(Based on 8 full and 6 partial tracts) A) Conventional B) Refinancings C) Non-occupant Loans on Number Average Value Number Average Value Number Average Value
LOANS ORIGINATED 13 $385,468 13 $413,964 3 $332,667 APPLICATIONS APPROVED, NOT ACCEPTED 7 $302,210 6 $385,128 0 $0 APPLICATIONS DENIED 2 $450,500 1 $573,000 0 $0 APPLICATIONS WITHDRAWN 1 $256,000 2 $471,000 0 $0 FILES CLOSED FOR INCOMPLETENESS 0 $0 0 $0 0 $0
Aggregated Statistics For Year 2005(Based on 8 full and 6 partial tracts) A) Conventional B) Refinancings C) Non-occupant Loans on Number Average Value Number Average Value Number Average Value
LOANS ORIGINATED 14 $381,073 16 $341,062 4 $312,768 APPLICATIONS APPROVED, NOT ACCEPTED 3 $377,933 2 $451,370 0 $0 APPLICATIONS DENIED 1 $522,000 2 $573,000 0 $0 APPLICATIONS WITHDRAWN 0 $0 2 $275,500 1 $276,000 FILES CLOSED FOR INCOMPLETENESS 0 $0 0 $0 0 $0
Aggregated Statistics For Year 2004(Based on 8 full and 7 partial tracts) A) Conventional B) Refinancings C) Non-occupant Loans on Number Average Value Number Average Value Number Average Value
LOANS ORIGINATED 42 $288,647 18 $319,261 7 $288,984 APPLICATIONS APPROVED, NOT ACCEPTED 18 $300,834 15 $279,630 1 $433,890 APPLICATIONS DENIED 2 $195,905 0 $0 0 $0 APPLICATIONS WITHDRAWN 3 $319,573 2 $185,415 0 $0 FILES CLOSED FOR INCOMPLETENESS 1 $227,680 0 $0 0 $0
Aggregated Statistics For Year 2003(Based on 8 full and 7 partial tracts) A) Conventional B) Refinancings C) Non-occupant Loans on Number Average Value Number Average Value Number Average Value
LOANS ORIGINATED 91 $251,902 70 $233,660 3 $264,973 APPLICATIONS APPROVED, NOT ACCEPTED 20 $262,472 37 $231,655 2 $190,500 APPLICATIONS DENIED 3 $287,333 3 $222,983 1 $225,000 APPLICATIONS WITHDRAWN 5 $157,176 4 $314,722 1 $65,460 FILES CLOSED FOR INCOMPLETENESS 0 $0 1 $567,370 0 $0
Aggregated Statistics For Year 2002(Based on 6 full and 5 partial tracts) A) Conventional B) Refinancings C) Non-occupant Loans on Number Average Value Number Average Value Number Average Value
LOANS ORIGINATED 116 $214,871 69 $223,554 4 $181,665 APPLICATIONS APPROVED, NOT ACCEPTED 22 $185,405 22 $185,505 2 $188,455 APPLICATIONS DENIED 3 $171,977 2 $346,630 0 $0 APPLICATIONS WITHDRAWN 7 $273,771 5 $225,830 0 $0 FILES CLOSED FOR INCOMPLETENESS 1 $104,490 0 $0 0 $0
Aggregated Statistics For Year 2001(Based on 6 full and 5 partial tracts) A) Conventional B) Refinancings C) Non-occupant Loans on Number Average Value Number Average Value Number Average Value
LOANS ORIGINATED 91 $195,257 78 $203,211 5 $124,078 APPLICATIONS APPROVED, NOT ACCEPTED 18 $174,876 20 $202,758 0 $0 APPLICATIONS DENIED 2 $295,350 13 $207,937 0 $0 APPLICATIONS WITHDRAWN 2 $123,455 2 $253,560 0 $0 FILES CLOSED FOR INCOMPLETENESS 0 $0 1 $204,120 0 $0
Aggregated Statistics For Year 2000(Based on 6 full and 5 partial tracts) A) Conventional B) Refinancings C) Non-occupant Loans on Number Average Value Number Average Value Number Average Value
LOANS ORIGINATED 94 $178,448 24 $184,211 6 $143,172 APPLICATIONS APPROVED, NOT ACCEPTED 9 $151,901 14 $179,756 1 $52,000 APPLICATIONS DENIED 8 $174,082 5 $206,636 0 $0 APPLICATIONS WITHDRAWN 0 $0 3 $188,937 0 $0 FILES CLOSED FOR INCOMPLETENESS 0 $0 1 $150,000 0 $0
Aggregated Statistics For Year 1999(Based on 9 full and 4 partial tracts) A) Conventional B) Refinancings C) Non-occupant Loans on Number Average Value Number Average Value Number Average Value
LOANS ORIGINATED 151 $179,397 114 $168,331 6 $108,667 APPLICATIONS APPROVED, NOT ACCEPTED 15 $190,299 34 $157,578 1 $152,000 APPLICATIONS DENIED 12 $197,523 11 $154,627 0 $0 APPLICATIONS WITHDRAWN 5 $164,656 7 $182,707 0 $0 FILES CLOSED FOR INCOMPLETENESS 1 $207,660 2 $141,000 0 $0
Most common first names in La Habra, CA among deceased individuals Name Count Lived (average)
John 306 73.4 years Mary 271 80.0 years William 237 74.8 years Robert 214 73.4 years James 191 71.9 years Helen 154 81.1 years Margaret 141 79.5 years George 137 75.5 years Charles 132 75.6 years Richard 111 69.6 years
Most common last names in La Habra, CA among deceased individuals Last name Count Lived (average)
Smith 96 77.5 years Johnson 96 77.0 years Brown 61 77.7 years Miller 60 75.3 years Anderson 43 78.8 years Williams 41 77.9 years Martin 35 76.5 years Jones 34 76.2 years Clark 33 74.0 years Wilson 33 77.0 years
La Habra compared to California state average:
Unemployed percentage below state average. Black race population percentage significantly below state average. Length of stay since moving in significantly above state average.
#12 on the list of "Top 101 cities with largest percentage of females in occupations: office and administrative support occupations (population 50,000+)"
#22 on the list of "Top 101 cities with largest percentage of males in occupations: building and grounds cleaning and maintenance occupations (population 50,000+)"
#28 on the list of "Top 101 cities with largest percentage of males in industries: administrative and support and waste management services (population 50,000+)"
#52 on the list of "Top 101 cities with largest percentage of males in industries: wholesale trade (population 50,000+)"
#61 on the list of "Top 101 cities with the largest city-data.com crime index decrease from 2011 to 2012 (population 50,000+)"
#76 on the list of "Top 101 cities with the least people having Doctorate degrees (population 50,000+)"
#82 on the list of "Top 100 safest cities (lowest city-data.com crime index) (pop. 50,000+)"
#87 on the list of "Top 100 low-educated but high-earning cities (pop. 50,000+)"
#89 on the list of "Top 101 larger cities with the highest increase in house/condo value from 2000 (population 50,000+)"
#95 on the list of "Top 101 cities with the lowest number of thefts per 100,000 residents (population 50,000+)"
#95 on the list of "Top 101 cities with largest percentage of females in industries: utilities (population 50,000+)"
#100 on the list of "Top 101 cities with the lowest number of police officers per 1000 residents (population 50,000+)"
#4 on the list of "Top 101 counties with the highest total withdrawal of fresh water for public supply"
#5 on the list of "Top 101 counties with the most Catholic adherents"
#6 on the list of "Top 101 counties with the highest ground withdrawal of fresh water for public supply"
#7 on the list of "Top 101 counties with the most Evangelical Protestant adherents"
#8 on the list of "Top 101 counties with the highest Particulate Matter (PM2.5 ) Annual air pollution readings in 2012 (µg/m3 )"
Top Patent Applicants
James Cheng Lee (8)
David H. Jerome (8)
Bill H. Hilf (7)
Myoung Jun Lee (4)
Hasim Mulazimoglu (4)
Carl D. Cook (3)
Hoon Kim (3)
Sang Joon Kwak (3)
Randy Cruz (3)
Kris Kimura (3)
Total of 161 patent applications in 2008-2024.
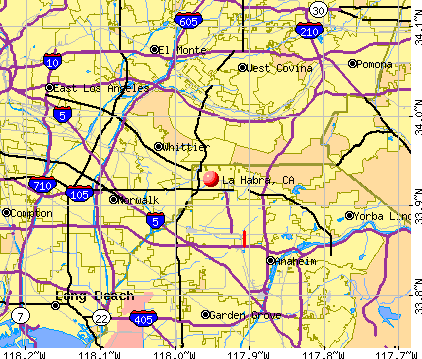


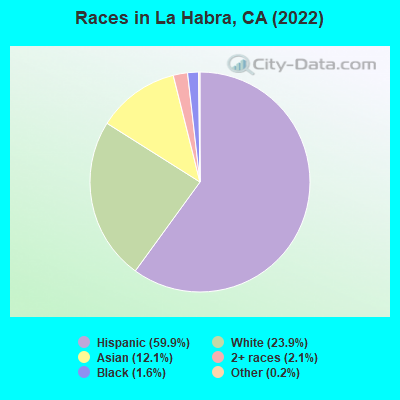
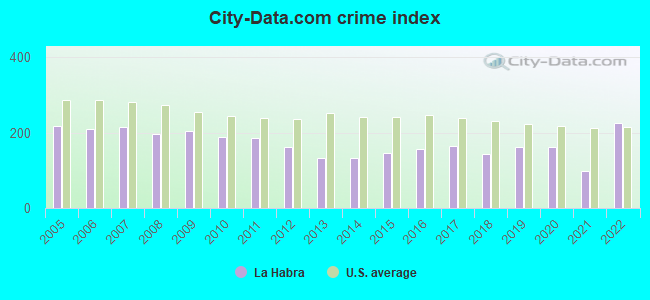
 Recent articles from our blog. Our writers, many of them Ph.D. graduates or candidates, create easy-to-read articles on a wide variety of topics.

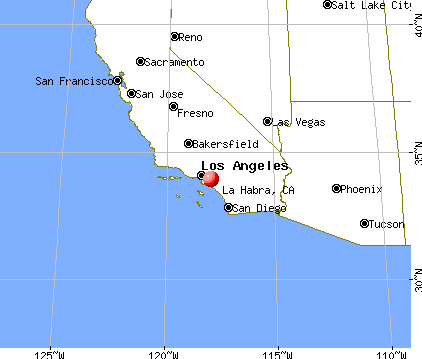
 (7.4 miles
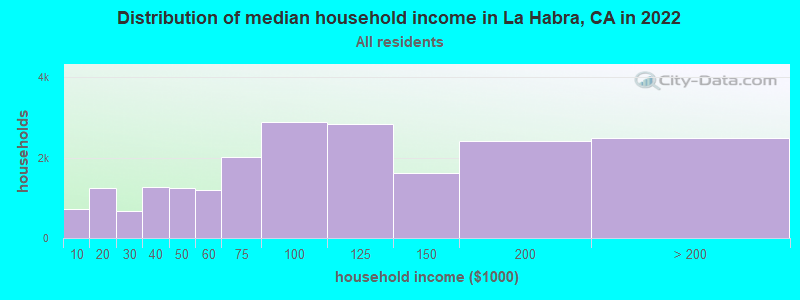
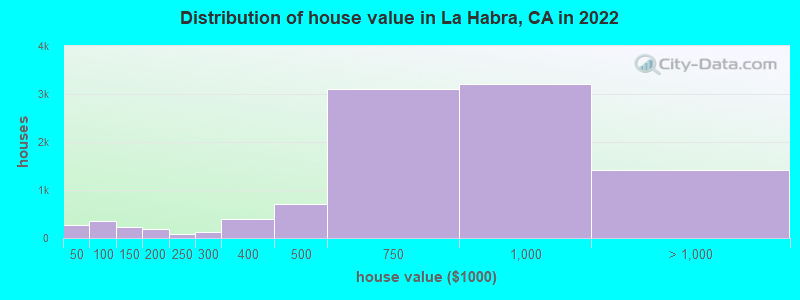
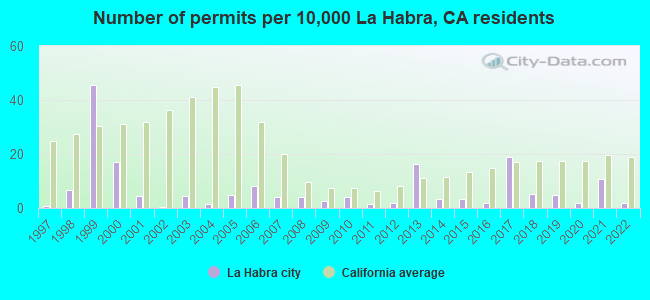
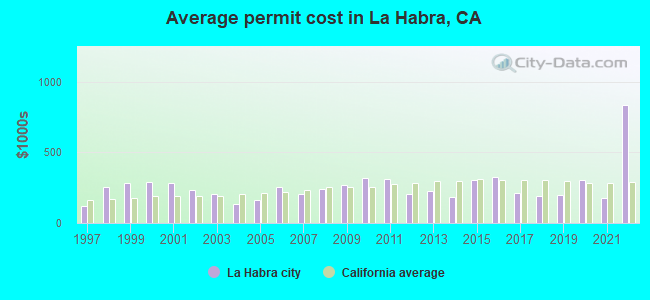
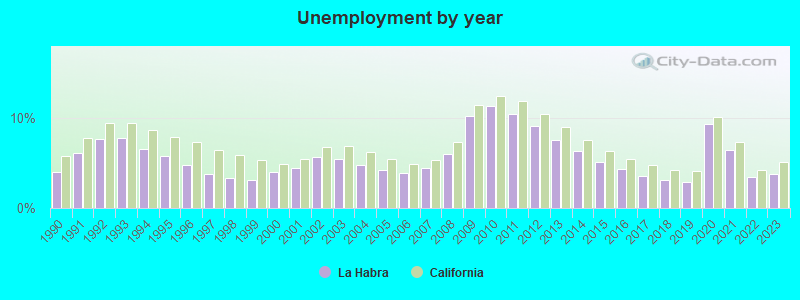
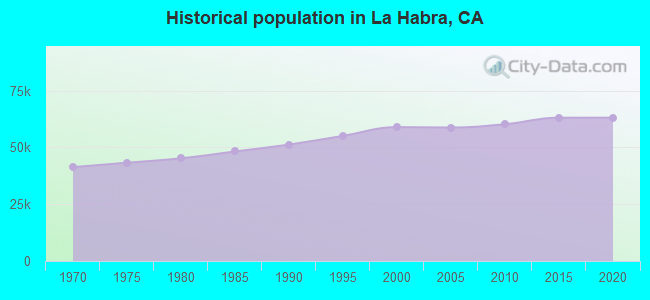
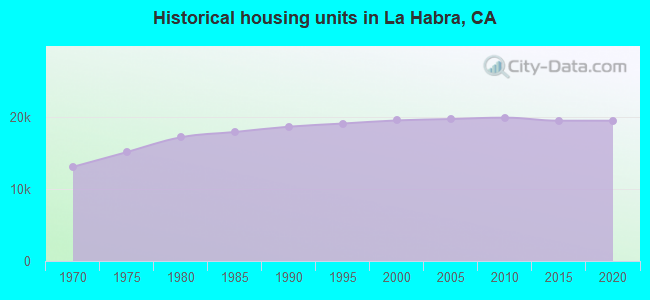
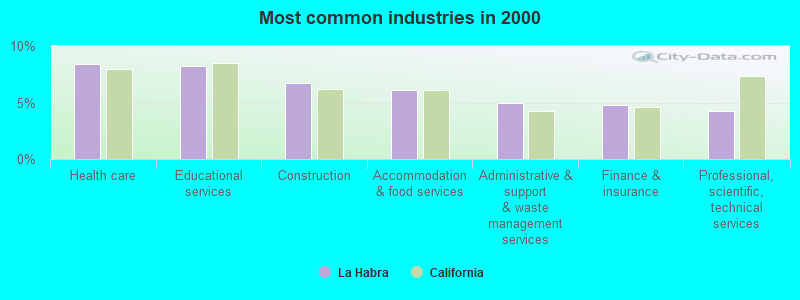
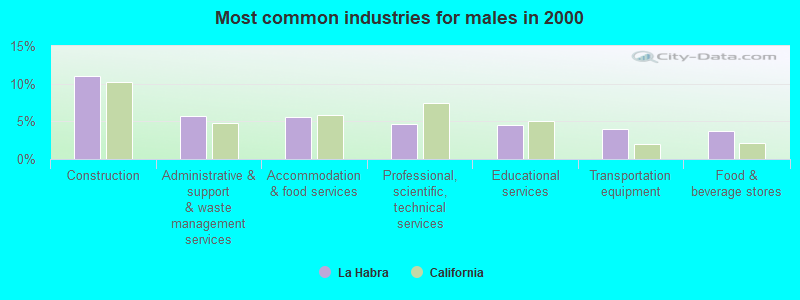
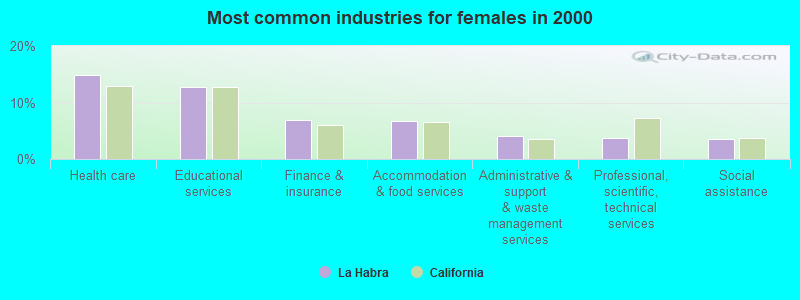
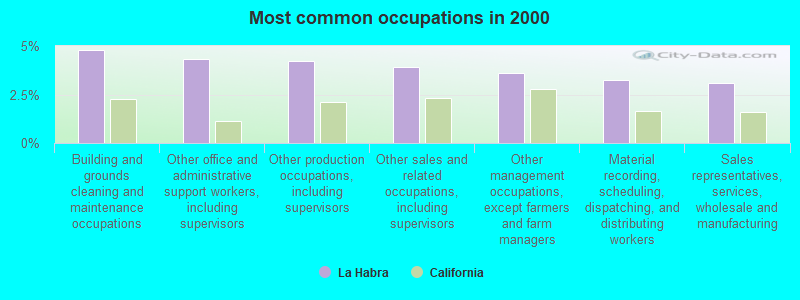
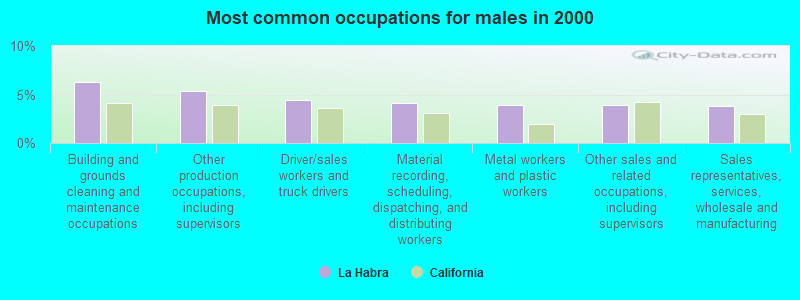
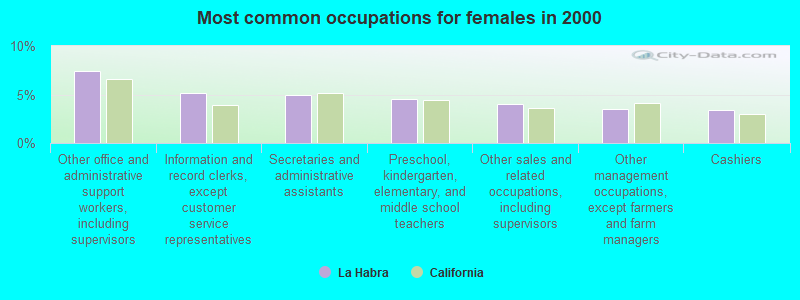
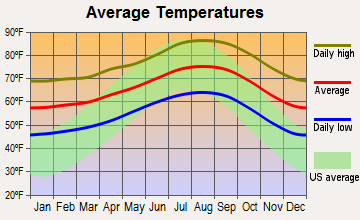
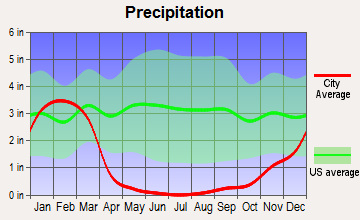
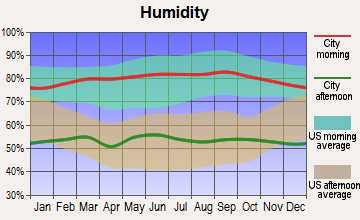
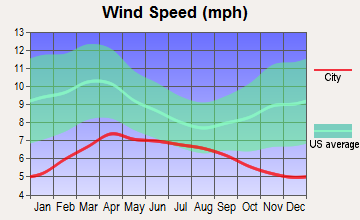
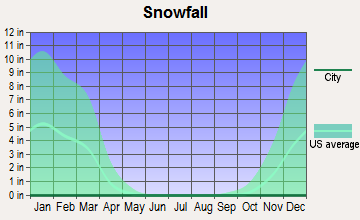
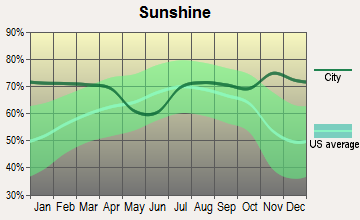
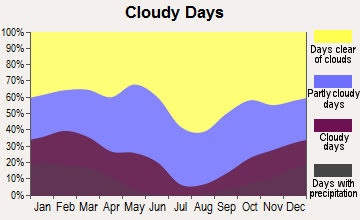

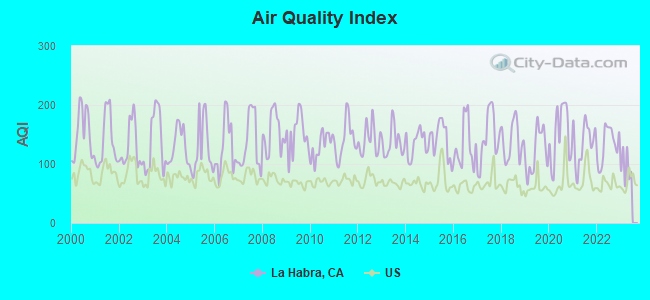
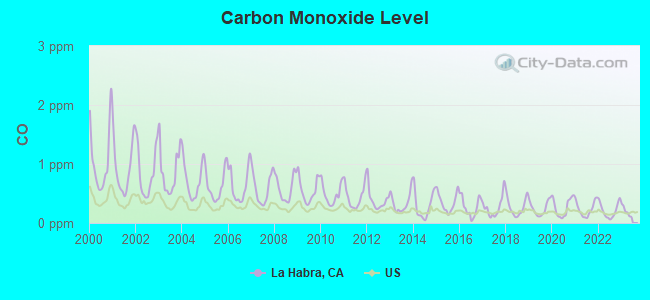
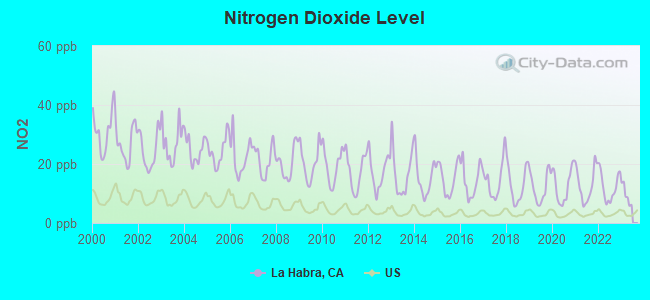
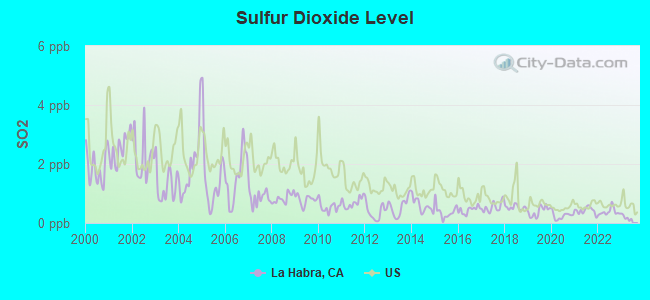
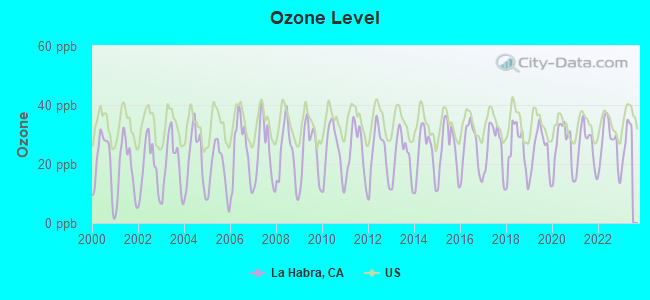
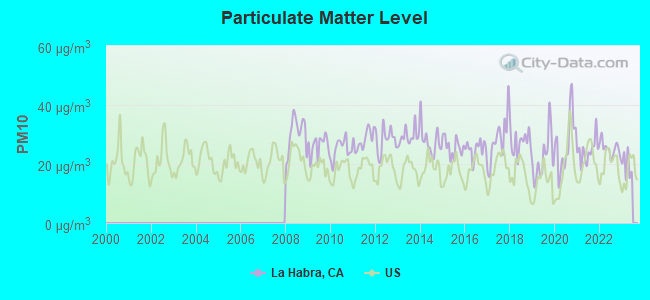

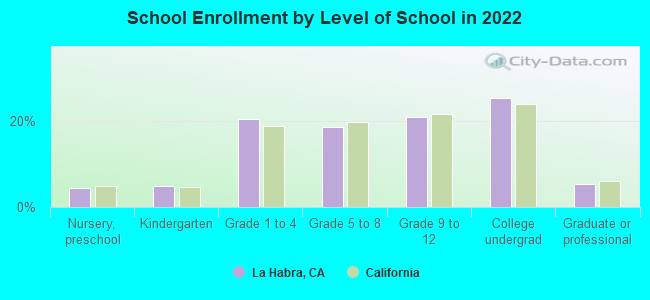
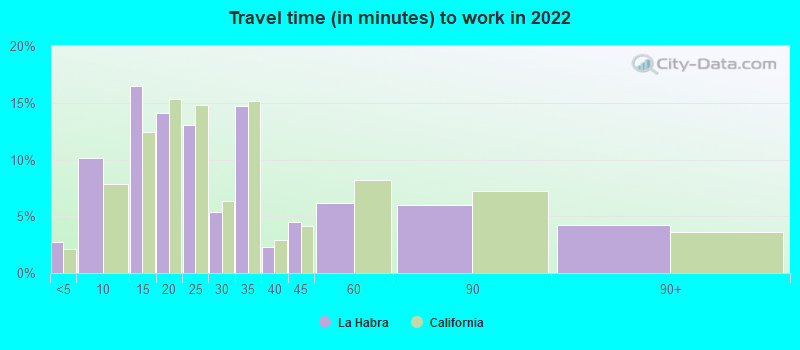
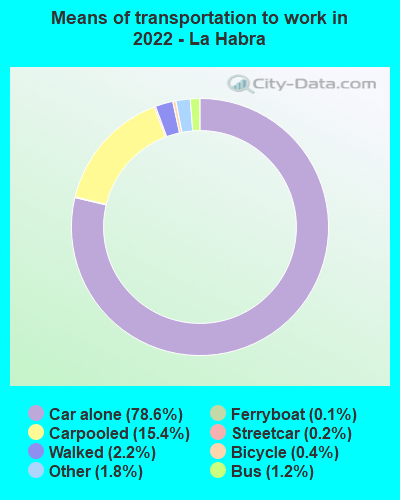


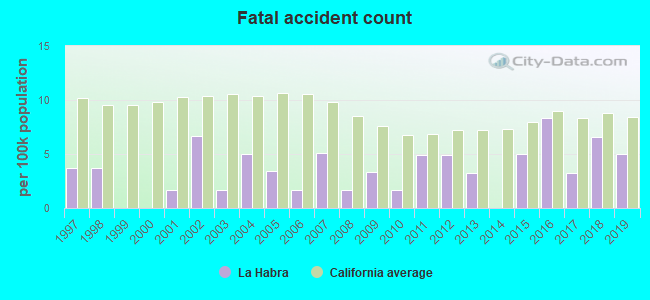
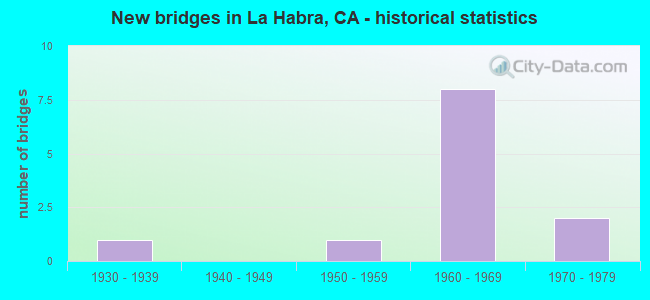
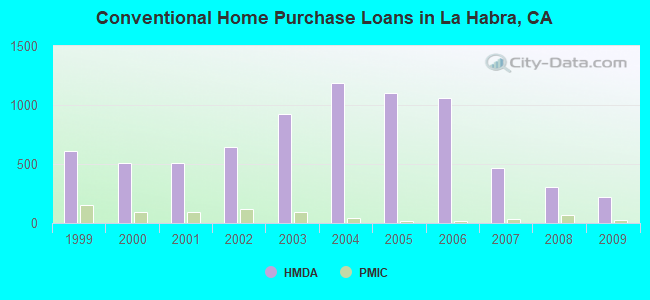
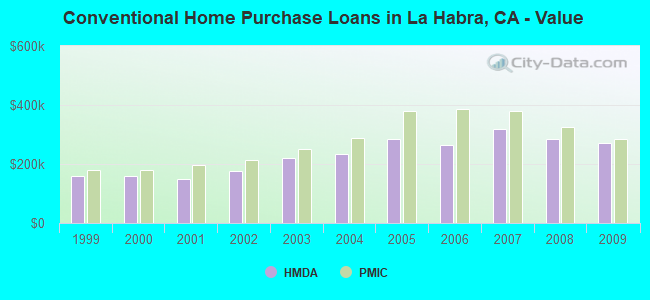
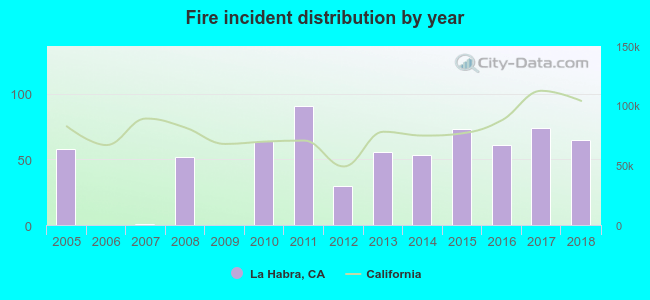 Based on the data from the years 2005 - 2018 the average number of fires per year is 48. The highest number of fires - 91 took place in 2011, and the least - 0 in 2006. The data has an increasing trend.
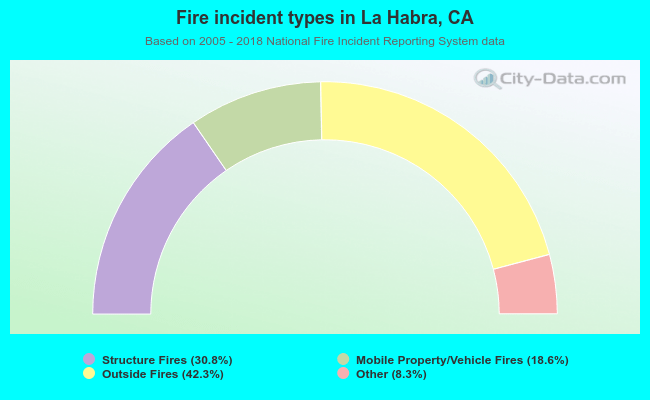 When looking into fire subcategories, the most reports belonged to: Outside Fires (42.3%), and Structure Fires (30.8%).