Long Beach and Fullerton are two unique cities in California with diverse offerings. Long Beach is a coastal city known for its beautiful waterfront attractions, while Fullerton, though inland, boasts a rich history and a thriving arts scene. The cities have different crime rates, living costs, and atmospheres that may appeal differently to those looking to relocate or visit. While both cities have strong economies with various industries and employers, they each offer different opportunities and challenges in terms of real estate, tax burdens, culture, sports, geography, and healthcare services.
Distance between
Long Beach, CA and
Fullerton, CA : 14.2 miles
Long Beach's population is larger by 222%. Its population has decreased by 5,460 people (1.2%) since 2000. The population of Fullerton has grown by 15,871 people (12.6%) during that time.
When it comes to crime rates, Long Beach has a higher rate than Fullerton. According to data from the FBI, Long Beach has both a higher property crime rate and violent crime rate in comparison to Fullerton. However, it is worth mentioning that like all cities, crime is not evenly distributed and safe neighborhoods can be found in both cities. The overall safety of Long Beach is generally improving year by year, however it is still advised to stay vigilant and aware. Fullerton, being a smaller city, tends to have a more close-knit community, which can contribute to its lower crime rates and sense of safety.
City-data.com crime index counts serious crimes and violent crime more heavily. It adjusts for the number of visitors and daily workers commuting into cities. (higher means more crime, U.S. average = 301.1)
City-data.com crime index counts serious crimes and violent crime more heavily. It adjusts for the number of visitors and daily workers commuting into cities. (higher means more crime, U.S. average = 301.1)
Sex Offenders
According to our data, there are 807 registered sex offenders living in Long Beach and 106 registered sex offenders living in . The ratio of residents to sex offenders in Long Beach is 583 to 1; the ratio in Fullerton is 1,328 to 1. The number of registered sex offenders compared to the number of residents is larger in Long Beach than in Fullerton.
Cost of Living
Generally, the cost of living in Long Beach is higher than in Fullerton, especially with regards to housing. However, other factors like healthcare, groceries, and transportation are comparable between the two cities. In addition, Long Beach's average income tends to be higher, which can help offset the higher cost of living. As per Payscale, Long Beach's cost of living is 45% higher than the national average, compared to Fullerton, which is 41% higher than the national average.
Income Tax
California has a progressive state income tax that applies to both Long Beach and Fullerton residents. The rate spans from 1% on the lowest incomes to 13.3% on incomes over $1 million. However, neither Long Beach nor Fullerton imposes a separate city-level income tax.
Property Tax
The average property tax rate for homeowners in Long Beach is approximately 0.793%, while in Fullerton it is slightly lower at 0.737%. However, due to the generally higher property values in Long Beach, residents here could end up paying more in absolute dollar amounts.
Sales Tax
The sales tax rate for Long Beach is 10.25%, which consists of a 6% California state sales tax, a 0.25% Los Angeles County sales tax, and a 3.6875% special tax. Fullerton, in contrast, has a total sales tax rate of 7.75%, comprised of the 6% California state sales tax, and a 1.75% Orange County sales tax.
Income
Type
Long Beach
Fullerton
Estimated median household income
$73,905
$95,431
Estimated per capita income
$37,217
$46,429
Cost of living index (U.S. average is 100)
142
88.6
If you make $50,000 in Fullerton, you will have to make $80,135 in Long Beach to maintain the same standard of living.
Geographical Conditions
Long Beach boasts a prime coastal location with miles of beaches and waterfront vistas, making it a haven for water sports and outdoor activities. Fullerton is a picturesque and vibrant city, it's an inland city located slightly northeast of Long Beach and is known for its hilly terrain and numerous parks.
Both cities are served by respected school districts and boast numerous higher education institutions. Long Beach is known for Long Beach Unified School District and the highly regarded California State University, Long Beach. Fullerton also offers good public schools and is home to California State University, Fullerton and Fullerton College. Fullerton's education sector emphasizes on the arts, with programs like the Fullerton School District’s All the Arts for All the Kids program notable in the state.
Long Beach has a mixed economy with key sectors including healthcare, education, technology, and the port-related industry. Fullerton, meanwhile, has a diverse economy with education, healthcare, and manufacturing among its top industries. Unemployment rates in both cities are generally close to the national average, but job growth tends to be a bit faster in Long Beach due to its larger size and variety of industries.
Biggest Employers
Long Beach's major employers include the Long Beach Unified School District, the City of Long Beach, and the Long Beach Memorial Medical Center. In Fullerton, the largest employers are California State University, Fullerton, Fullerton School District, and St. Jude Medical Center.
There were 304 building permits issued in Long Beach in 2012 (238 more than in 2011) compared to 7 building permits issued in Fullerton in 2012.
In Long Beach (Los Angeles County), 69.7% voted for Democrats and 27.8% for Republicans in 2012 Presidential Election. In Fullerton (Orange County), 45.8% voted for Democrats and 52.0% for Republicans.
Elections
Type
Democrats
Republicans
Other
Year
Long Beach
Fullerton
Long Beach
Fullerton
Long Beach
Fullerton
2020
71.0%
53.6%
26.9%
44.6%
2.1%
1.8%
2016
72.0%
50.9%
22.5%
42.4%
5.5%
6.7%
2012
69.7%
45.8%
27.8%
52.0%
2.4%
2.3%
2008
69.2%
47.8%
28.8%
50.3%
1.9%
1.9%
2004
63.3%
39.3%
35.7%
60.2%
1.0%
0.5%
2000
63.6%
40.4%
32.4%
55.9%
4.0%
3.7%
1996
59.3%
37.9%
31.0%
51.7%
9.7%
10.5%
Breakdown of population affiliated with a religious congregation
Type
Adherents
Congregations
Religion
Long Beach
Fullerton
Long Beach
Fullerton
CATHOLIC CHURCH
36.1%
26.5%
4.7%
4.4%
SOUTHERN BAPTIST CONVENTION
1.0%
2.3%
9.0%
8.8%
MUSLIM ESTIMATE
0.7%
0.8%
1.0%
1.3%
AMERICAN BAPTIST CHURCHES IN THE USA
0.5%
0.2%
3.1%
1.7%
SEVENTH DAY ADVENTIST CHURCH
0.5%
0.4%
2.4%
1.3%
EPISCOPAL CHURCH
0.4%
0.4%
1.4%
1.4%
EVANGELICAL LUTHERAN CHURCH IN AMERICA
0.2%
0.4%
1.9%
2.3%
LUTHERAN CHURCH
0.2%
0.6%
1.6%
2.0%
REFORMED CHURCH IN AMERICA
0.1%
0.3%
0.2%
0.2%
Weather
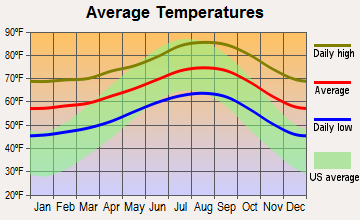
Both Long Beach and Fullerton enjoy typical Southern California weather characterized by warm summers and mild winters. Long Beach, being a coastal city, often enjoys a cooling sea breeze and an even milder climate than Fullerton. Furthermore, Long Beach is less likely to experience the heat waves that can affect inland cities like Fullerton in the summer. Regardless, both cities possess favorable weather for those who enjoy time outdoors.
Weather and climate
Type
Long Beach
Fullerton
Temperature - Average
65.3°F
65.4°F
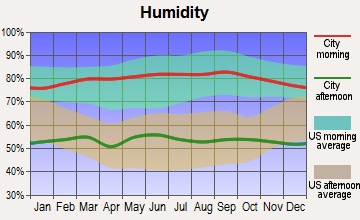
Humidity - Average morning or afternoon humidity
70.4%
69.4%
Humidity - Differences between morning and afternoon humidity
27%
25.5%
Humidity - Maximum monthly morning or afternoon humidity
79%
77.5%
Humidity - Minimum monthly morning or afternoon humidity
52%
52%
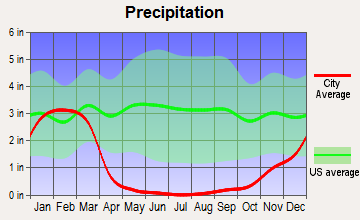
Precipitation - Yearly average
13.1 in
12.8 in
Snowfall - Yearly average
0 in
0 in
Clouds - Number of days clear of clouds
26.4%
26.7%
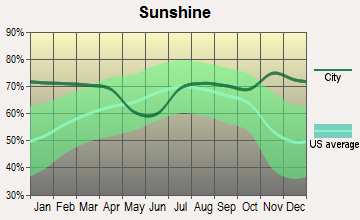
Sunshine amount - Average
78.4%
78.4%
Sunshine amount - Differences during a year
22%
22%
Sunshine amount - Maximum monthly
85%
85%
Sunshine amount - Minimum monthly
63%
63%
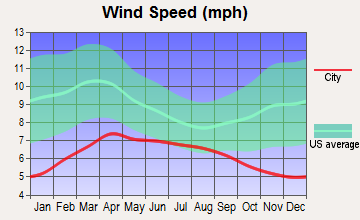
Wind speed - Average
6.1 mph
5.6 mph
Average climate in Long Beach, California
Average climate in Fullerton, California
Air pollution
Type
AQI
CO
NO2
OZONE
PB
PM10
PM25
SO2
Year
Long Beach
Fullerton
Long Beach
Fullerton
Long Beach
Fullerton
Long Beach
Fullerton
Long Beach
Fullerton
Long Beach
Fullerton
Long Beach
Fullerton
Long Beach
Fullerton
2018
124
142
0.37
0.33
17.2
13.6
22.1
26.1
0.008
0.007
27.5
27.4
13.5
12.3
0.7
0.6
2017
122
146
0.36
0.38
18.1
14.7
23.2
26.5
0.007
0.007
26.7
27.1
14.5
13.6
0.8
0.5
2016
115
136
0.36
0.41
18.5
14.7
21.9
26.2
0.007
0.007
24.1
24.4
11.6
12.9
0.9
0.4
2015
111
143
0.38
0.39
19.9
15.1
22.5
26.2
0.005
0.006
25.0
25.2
13.9
14.8
0.9
0.4
2014
127
141
0.50
0.35
20.3
15.4
22.0
25.5
0.007
0.007
26.7
27.0
14.3
16.1
1.3
0.6
2013
126
144
0.48
0.40
20.0
16.1
24.7
24.4
0.005
0.006
32.3
28.6
14.6
14.0
1.0
0.5
2012
132
148
0.48
0.43
19.3
16.0
24.4
24.5
0.004
0.005
30.8
27.4
14.1
14.8
0.6
0.3
2011
119
146
0.43
0.43
20.2
17.1
23.4
25.4
0.006
0.007
28.4
27.6
15.6
16.1
1.2
0.7
2010
115
133
0.38
0.46
20.8
17.7
22.7
24.8
0.011
0.012
24.1
24.2
11.9
14.9
0.7
0.6
2009
132
156
0.50
0.47
21.0
19.4
22.0
25.3
0.008
0.010
27.7
25.1
13.1
15.5
1.1
0.9
2008
124
157
0.53
0.48
20.8
20.7
23.2
25.1
0.008
0.012
27.2
30.5
21.6
18.7
1.0
1.0
2007
109
135
0.60
0.49
20.3
20.9
21.1
24.7
0.010
0.014
N/A
N/A
N/A
N/A
1.4
0.9
2006
119
128
0.76
0.54
21.4
21.4
19.9
25.2
0.005
0.008
N/A
N/A
N/A
N/A
1.7
1.5
2005
108
128
0.74
0.54
24.3
22.9
20.5
24.3
0.011
0.014
N/A
N/A
N/A
N/A
2.7
1.4
2004
125
134
0.56
0.63
28.0
23.0
22.9
28.5
0.012
0.016
N/A
N/A
N/A
N/A
2.0
1.8
2003
130
143
0.83
0.78
28.1
26.2
22.4
22.3
0.032
0.026
N/A
N/A
N/A
N/A
1.1
1.3
2002
120
134
0.90
0.81
29.6
25.6
22.2
20.7
0.011
0.021
N/A
N/A
N/A
N/A
2.8
2.3
2001
124
143
0.81
0.93
30.3
27.9
21.5
20.5
0.011
0.037
N/A
N/A
N/A
N/A
3.3
2.1
2000
142
152
0.71
0.96
31.5
30.9
19.6
21.1
0.018
0.031
N/A
N/A
N/A
N/A
2.0
1.8
Natural disasters
Type
Long Beach
Fullerton
Tornado activity compared to U.S. average
18.3%
19.3%
Earthquake activity compared to U.S. average
6,875.1%
7,071.6%
Natural disasters compared to U.S. average
57%
32%
Transportation
Both cities have developed public transportation systems. Long Beach has the Long Beach Transit which serves the city and surrounding communities, while Fullerton is served by the OCTA (Orange County Transportation Authority). Both cities also have train service - Long Beach has the Metro Blue Line, and Fullerton is a stop on Amtrak's Pacific Surfliner route. Despite this, both cities are typical in Southern California in that many residents still prefer to use private cars for their daily commutes.
Transport
Type
Long Beach
Fullerton
Amtrak stations
1
1
Amtrak stations nearby
3
3
FAA registered aircraft
312
99
FAA registered aircraft manufacturers and dealers
29
6
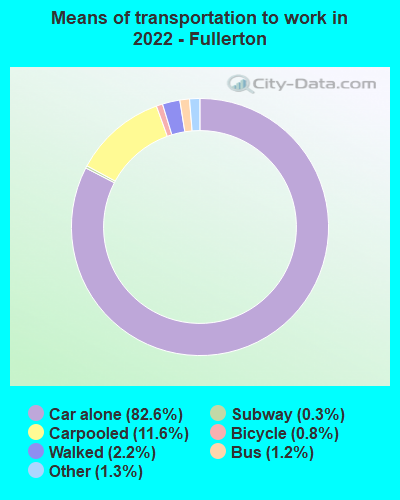
Means of transportation to work
Type
Long Beach
Fullerton
Bicycle
0.5%
0.3%
Bus
3.3%
0.8%
Carpooled
9.8%
12.7%
Car alone
81.8%
82.9%
Motorcycle
0.2%
0.3%
Railroad
0%
0.6%
Subway
0.5%
0.1%
Walked
2.8%
1.5%
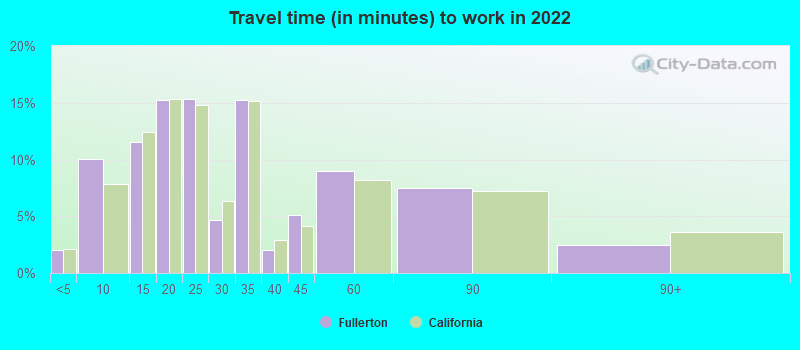
Average travel time to work
Type
Long Beach
Fullerton
Average
30.7 min
29.7 min
Other means
28.5 min
28.6 min
Public transportation
46.4 min
48.4 min
Private vehicle occupancy
Type
Long Beach
Fullerton
Average
1.1
1.2
Drove alone
89.7%
88.6%
In 2 person carpool
8.5%
7.6%
In 3 person carpool
1.4%
1.6%
In 4 person carpool
0.3%
1.5%
In 5-6 person carpool
0%
0.7%
How many people usually rode to work in the car, truck or van.
Real Estate
Real estate in Long Beach is generally more expensive than in Fullerton. The median home cost in Long Beach is well above the national average, whilst for Fullerton, it's slightly lower. However, both cities offer a range of housing options, from apartments to single-family homes, with varying levels of affordability.
Neighborhoods
Long Beach is known for its diverse neighborhoods, such as the lively Downtown area, the affluent Naples, and the historic California Heights. Alternatively, Fullerton has residential neighborhoods known for their tree-lined streets, historic homes, and good connectivity, like Sunny Hills, Downtown Fullerton, and Placentia Lakes.
Houses and residents
Type
Long Beach
Fullerton
Houses
179,856
49,834
Average household size (people)
2.8
2.9
Median year apartment built
1964
1974
Median year house/condo built
1954
1967
Length of stay in the house since moving in
15.7 years
16 years
Houses occupied
172,599 (96%)
48,423 (97.2%)
Houses occupied by owners
69,470 (40.2%)
23,525 (48.6%)
Houses occupied by renters
103,129 (59.8%)
24,898 (51.4%)
Median rent asked for vacant for-rent units
$1,057
$875.95
Median monthly housing costs
$1,692
$1,968
Median price asked for vacant for-sale houses and condos
$520,992
$972,430
Estimated median house or condo value
$693,600
$790,900
Median numbers of rooms
4.2
5
Median number of rooms in apartments
3.6
3.6
Median number of rooms in houses and condos
5.5
6.3
Median house price - detached houses
$900,658
$893,376
Median house price - in 3-to-4-unit structures
$495,928
$508,041
Median house price - in 5 or more unit structures
$488,399
Over $1,000,000
Median house price - mobile homes
$333,777
$227,264
Median house price - Townhouses or other attached units
$634,684
$582,584
Median house price - All housing units
$805,766
$850,564
Median house age
62
50
Renting percentage
58.4%
45.8%
Housing density (houses/condos per square mile)
3,565.7
2,244.8
House value disparities
21.3%
21.1%
Household income disparities
44.7%
42.3%
Median household income for houses/condes with a mortgage
$116,421
$168,503
Median household income for apartments without a mortgage
$79,392
$95,750
Housing units without a mortgage
394 (0.8%)
371 (2.4%)
Housing units with both a second mortgage and home equity loan
3,069 (6.2%)
1,362 (8.8%)
Housing units with a mortgage
49,321 (99.2%)
15,028 (97.6%)
Housing units with a home equity loan
48 (0.1%)
0 (0%)
Housing units with a second mortgage
3,709 (7.5%)
1,474 (9.6%)
House/condo owner moved in on average (years ago)
15
16
House/condo renter moved in on average (years ago)
3
2
Housing units lacking complete kitchen facilities
2.6%
4%
Housing units lacking complete plumbing facilities
0.4%
0.9%
Housing units in structures
Housing units in structures
Long Beach
Fullerton
One, detached
40.2%
49.7%
One, attached
4.9%
8.3%
Two
5.3%
2.3%
3 or 4
8.8%
6.6%
5 to 9
10.4%
5.7%
10 to 19
10.8%
6.4%
20 to 49
8.0%
5.7%
50 or more
10.6%
13.4%
Mobile homes
0.8%
1.5%
Boats, RVs, vans, etc.
0.2%
0.2%
Median real estate property taxes paid for housing units
Self-employed workers in own not incorporated business
18,532
4,512
State government workers
6,550
2,615
Unpaid family workers
178
22
Industries and Occupations
The largest industries in Long Beach are healthcare and social assistance, education, and retail trade, whereas the most common occupations are in management, business science, and arts. Fullerton, on the other hand, sees a significant number of its residents working in industries including education, healthcare, social assistance, and manufacturing with occupations concentrating around education, management, and sales.
Long Beach has well-established healthcare facilities. Notable among them is the Long Beach Memorial Medical Center, one of the largest hospitals in the region. On the other hand, Fullerton is also well-equipped in terms of healthcare, with St. Jude Medical Center being one of the best regional hospitals.
Health (county statistics)
Type
Long Beach
Fullerton
General health status score of residents in this county from 1 (poor) to 5 (excellent)
The infrastructure in Long Beach is generally more developed than in Fullerton. Long Beach has a sizable downtown district with high-rise buildings and a well-developed waterfront area, while Fullerton is more suburban in nature with fewer large-scale developments. Both cities have adequate facilities for water, power, and other utilities, but Long Beach benefits from additional infrastructure related to its status as a major port.
HMDA - Conventional home purchase loans - Applications denied
Year
Long Beach
Fullerton
1999
1,159
255
2000
710
237
2001
677
216
2002
708
306
2003
1,861
546
2004
2,162
534
2005
3,065
634
2006
3,591
689
2007
2,287
400
2008
887
194
2009
475
146
Culture and Food
Long Beach has a vibrant multicultural scene. The annual Long Beach LGBTQ+ Pride Festival showcases the city's inclusivity. As for food, the city offers diverse fare from seafood to Mexican food, and the food truck trend is quite popular here. Fullerton, meanwhile, is particularly recognized for its lively arts scene, strong college community, and historic downtown area. The food scene is laid back and cozy, with a range of comfort food restaurants and indie coffee shops.
Sports Teams
Long Beach does not host any major league professional sports teams but it's within close proximity to Los Angeles, home to NBA's Lakers and Clippers, MLB's Dodgers and Angels, and NHL's Kings. Fullerton, likewise, does not host any major league teams, but residents can enjoy sports through local college teams, particularly at California State University, Fullerton.


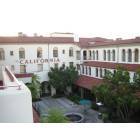

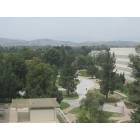
 Long Beach, CA
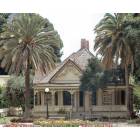
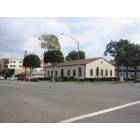
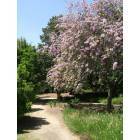
 Fullerton, CA