Placentia, California Submit your own pictures of this city and show them to the world
OSM Map
General Map
Google Map
MSN Map
OSM Map
General Map
Google Map
MSN Map
OSM Map
General Map
Google Map
MSN Map
OSM Map
General Map
Google Map
MSN Map
Please wait while loading the map...
Population in 2022: 51,951 (100% urban, 0% rural). Population change since 2000: +11.8%Males: 25,534 Females: 26,417
March 2022 cost of living index in Placentia: 88.5 (less than average, U.S. average is 100) Percentage of residents living in poverty in 2022: 8.2%for White Non-Hispanic residents , 5.8% for Black residents , 12.7% for Hispanic or Latino residents , 3.2% for American Indian residents , 44.0% for Native Hawaiian and other Pacific Islander residents , 5.4% for other race residents , 13.7% for two or more races residents )
Profiles of local businesses
Business Search - 14 Million verified businesses
Data:
Median household income ($)
Median household income (% change since 2000)
Household income diversity
Ratio of average income to average house value (%)
Ratio of average income to average rent
Median household income ($) - White
Median household income ($) - Black or African American
Median household income ($) - Asian
Median household income ($) - Hispanic or Latino
Median household income ($) - American Indian and Alaska Native
Median household income ($) - Multirace
Median household income ($) - Other Race
Median household income for houses/condos with a mortgage ($)
Median household income for apartments without a mortgage ($)
Races - White alone (%)
Races - White alone (% change since 2000)
Races - Black alone (%)
Races - Black alone (% change since 2000)
Races - American Indian alone (%)
Races - American Indian alone (% change since 2000)
Races - Asian alone (%)
Races - Asian alone (% change since 2000)
Races - Hispanic (%)
Races - Hispanic (% change since 2000)
Races - Native Hawaiian and Other Pacific Islander alone (%)
Races - Native Hawaiian and Other Pacific Islander alone (% change since 2000)
Races - Two or more races (%)
Races - Two or more races (% change since 2000)
Races - Other race alone (%)
Races - Other race alone (% change since 2000)
Racial diversity
Unemployment (%)
Unemployment (% change since 2000)
Unemployment (%) - White
Unemployment (%) - Black or African American
Unemployment (%) - Asian
Unemployment (%) - Hispanic or Latino
Unemployment (%) - American Indian and Alaska Native
Unemployment (%) - Multirace
Unemployment (%) - Other Race
Population density (people per square mile)
Population - Males (%)
Population - Females (%)
Population - Males (%) - White
Population - Males (%) - Black or African American
Population - Males (%) - Asian
Population - Males (%) - Hispanic or Latino
Population - Males (%) - American Indian and Alaska Native
Population - Males (%) - Multirace
Population - Males (%) - Other Race
Population - Females (%) - White
Population - Females (%) - Black or African American
Population - Females (%) - Asian
Population - Females (%) - Hispanic or Latino
Population - Females (%) - American Indian and Alaska Native
Population - Females (%) - Multirace
Population - Females (%) - Other Race
Coronavirus confirmed cases (Apr 27, 2024)
Deaths caused by coronavirus (Apr 27, 2024)
Coronavirus confirmed cases (per 100k population) (Apr 27, 2024)
Deaths caused by coronavirus (per 100k population) (Apr 27, 2024)
Daily increase in number of cases (Apr 27, 2024)
Weekly increase in number of cases (Apr 27, 2024)
Cases doubled (in days) (Apr 27, 2024)
Hospitalized patients (Apr 18, 2022)
Negative test results (Apr 18, 2022)
Total test results (Apr 18, 2022)
COVID Vaccine doses distributed (per 100k population) (Sep 19, 2023)
COVID Vaccine doses administered (per 100k population) (Sep 19, 2023)
COVID Vaccine doses distributed (Sep 19, 2023)
COVID Vaccine doses administered (Sep 19, 2023)
Likely homosexual households (%)
Likely homosexual households (% change since 2000)
Likely homosexual households - Lesbian couples (%)
Likely homosexual households - Lesbian couples (% change since 2000)
Likely homosexual households - Gay men (%)
Likely homosexual households - Gay men (% change since 2000)
Cost of living index
Median gross rent ($)
Median contract rent ($)
Median monthly housing costs ($)
Median house or condo value ($)
Median house or condo value ($ change since 2000)
Mean house or condo value by units in structure - 1, detached ($)
Mean house or condo value by units in structure - 1, attached ($)
Mean house or condo value by units in structure - 2 ($)
Mean house or condo value by units in structure by units in structure - 3 or 4 ($)
Mean house or condo value by units in structure - 5 or more ($)
Mean house or condo value by units in structure - Boat, RV, van, etc. ($)
Mean house or condo value by units in structure - Mobile home ($)
Median house or condo value ($) - White
Median house or condo value ($) - Black or African American
Median house or condo value ($) - Asian
Median house or condo value ($) - Hispanic or Latino
Median house or condo value ($) - American Indian and Alaska Native
Median house or condo value ($) - Multirace
Median house or condo value ($) - Other Race
Median resident age
Resident age diversity
Median resident age - Males
Median resident age - Females
Median resident age - White
Median resident age - Black or African American
Median resident age - Asian
Median resident age - Hispanic or Latino
Median resident age - American Indian and Alaska Native
Median resident age - Multirace
Median resident age - Other Race
Median resident age - Males - White
Median resident age - Males - Black or African American
Median resident age - Males - Asian
Median resident age - Males - Hispanic or Latino
Median resident age - Males - American Indian and Alaska Native
Median resident age - Males - Multirace
Median resident age - Males - Other Race
Median resident age - Females - White
Median resident age - Females - Black or African American
Median resident age - Females - Asian
Median resident age - Females - Hispanic or Latino
Median resident age - Females - American Indian and Alaska Native
Median resident age - Females - Multirace
Median resident age - Females - Other Race
Commute - mean travel time to work (minutes)
Travel time to work - Less than 5 minutes (%)
Travel time to work - Less than 5 minutes (% change since 2000)
Travel time to work - 5 to 9 minutes (%)
Travel time to work - 5 to 9 minutes (% change since 2000)
Travel time to work - 10 to 19 minutes (%)
Travel time to work - 10 to 19 minutes (% change since 2000)
Travel time to work - 20 to 29 minutes (%)
Travel time to work - 20 to 29 minutes (% change since 2000)
Travel time to work - 30 to 39 minutes (%)
Travel time to work - 30 to 39 minutes (% change since 2000)
Travel time to work - 40 to 59 minutes (%)
Travel time to work - 40 to 59 minutes (% change since 2000)
Travel time to work - 60 to 89 minutes (%)
Travel time to work - 60 to 89 minutes (% change since 2000)
Travel time to work - 90 or more minutes (%)
Travel time to work - 90 or more minutes (% change since 2000)
Marital status - Never married (%)
Marital status - Now married (%)
Marital status - Separated (%)
Marital status - Widowed (%)
Marital status - Divorced (%)
Median family income ($)
Median family income (% change since 2000)
Median non-family income ($)
Median non-family income (% change since 2000)
Median per capita income ($)
Median per capita income (% change since 2000)
Median family income ($) - White
Median family income ($) - Black or African American
Median family income ($) - Asian
Median family income ($) - Hispanic or Latino
Median family income ($) - American Indian and Alaska Native
Median family income ($) - Multirace
Median family income ($) - Other Race
Median year house/condo built
Median year apartment built
Year house built - Built 2005 or later (%)
Year house built - Built 2000 to 2004 (%)
Year house built - Built 1990 to 1999 (%)
Year house built - Built 1980 to 1989 (%)
Year house built - Built 1970 to 1979 (%)
Year house built - Built 1960 to 1969 (%)
Year house built - Built 1950 to 1959 (%)
Year house built - Built 1940 to 1949 (%)
Year house built - Built 1939 or earlier (%)
Average household size
Household density (households per square mile)
Average household size - White
Average household size - Black or African American
Average household size - Asian
Average household size - Hispanic or Latino
Average household size - American Indian and Alaska Native
Average household size - Multirace
Average household size - Other Race
Occupied housing units (%)
Vacant housing units (%)
Owner occupied housing units (%)
Renter occupied housing units (%)
Vacancy status - For rent (%)
Vacancy status - For sale only (%)
Vacancy status - Rented or sold, not occupied (%)
Vacancy status - For seasonal, recreational, or occasional use (%)
Vacancy status - For migrant workers (%)
Vacancy status - Other vacant (%)
Residents with income below the poverty level (%)
Residents with income below 50% of the poverty level (%)
Children below poverty level (%)
Poor families by family type - Married-couple family (%)
Poor families by family type - Male, no wife present (%)
Poor families by family type - Female, no husband present (%)
Poverty status for native-born residents (%)
Poverty status for foreign-born residents (%)
Poverty among high school graduates not in families (%)
Poverty among people who did not graduate high school not in families (%)
Residents with income below the poverty level (%) - White
Residents with income below the poverty level (%) - Black or African American
Residents with income below the poverty level (%) - Asian
Residents with income below the poverty level (%) - Hispanic or Latino
Residents with income below the poverty level (%) - American Indian and Alaska Native
Residents with income below the poverty level (%) - Multirace
Residents with income below the poverty level (%) - Other Race
Air pollution - Air Quality Index (AQI)
Air pollution - CO
Air pollution - NO2
Air pollution - SO2
Air pollution - Ozone
Air pollution - PM10
Air pollution - PM25
Air pollution - Pb
Crime - Murders per 100,000 population
Crime - Rapes per 100,000 population
Crime - Robberies per 100,000 population
Crime - Assaults per 100,000 population
Crime - Burglaries per 100,000 population
Crime - Thefts per 100,000 population
Crime - Auto thefts per 100,000 population
Crime - Arson per 100,000 population
Crime - City-data.com crime index
Crime - Violent crime index
Crime - Property crime index
Crime - Murders per 100,000 population (5 year average)
Crime - Rapes per 100,000 population (5 year average)
Crime - Robberies per 100,000 population (5 year average)
Crime - Assaults per 100,000 population (5 year average)
Crime - Burglaries per 100,000 population (5 year average)
Crime - Thefts per 100,000 population (5 year average)
Crime - Auto thefts per 100,000 population (5 year average)
Crime - Arson per 100,000 population (5 year average)
Crime - City-data.com crime index (5 year average)
Crime - Violent crime index (5 year average)
Crime - Property crime index (5 year average)
1996 Presidential Elections Results (%) - Democratic Party (Clinton)
1996 Presidential Elections Results (%) - Republican Party (Dole)
1996 Presidential Elections Results (%) - Other
2000 Presidential Elections Results (%) - Democratic Party (Gore)
2000 Presidential Elections Results (%) - Republican Party (Bush)
2000 Presidential Elections Results (%) - Other
2004 Presidential Elections Results (%) - Democratic Party (Kerry)
2004 Presidential Elections Results (%) - Republican Party (Bush)
2004 Presidential Elections Results (%) - Other
2008 Presidential Elections Results (%) - Democratic Party (Obama)
2008 Presidential Elections Results (%) - Republican Party (McCain)
2008 Presidential Elections Results (%) - Other
2012 Presidential Elections Results (%) - Democratic Party (Obama)
2012 Presidential Elections Results (%) - Republican Party (Romney)
2012 Presidential Elections Results (%) - Other
2016 Presidential Elections Results (%) - Democratic Party (Clinton)
2016 Presidential Elections Results (%) - Republican Party (Trump)
2016 Presidential Elections Results (%) - Other
2020 Presidential Elections Results (%) - Democratic Party (Biden)
2020 Presidential Elections Results (%) - Republican Party (Trump)
2020 Presidential Elections Results (%) - Other
Ancestries Reported - Arab (%)
Ancestries Reported - Czech (%)
Ancestries Reported - Danish (%)
Ancestries Reported - Dutch (%)
Ancestries Reported - English (%)
Ancestries Reported - French (%)
Ancestries Reported - French Canadian (%)
Ancestries Reported - German (%)
Ancestries Reported - Greek (%)
Ancestries Reported - Hungarian (%)
Ancestries Reported - Irish (%)
Ancestries Reported - Italian (%)
Ancestries Reported - Lithuanian (%)
Ancestries Reported - Norwegian (%)
Ancestries Reported - Polish (%)
Ancestries Reported - Portuguese (%)
Ancestries Reported - Russian (%)
Ancestries Reported - Scotch-Irish (%)
Ancestries Reported - Scottish (%)
Ancestries Reported - Slovak (%)
Ancestries Reported - Subsaharan African (%)
Ancestries Reported - Swedish (%)
Ancestries Reported - Swiss (%)
Ancestries Reported - Ukrainian (%)
Ancestries Reported - United States (%)
Ancestries Reported - Welsh (%)
Ancestries Reported - West Indian (%)
Ancestries Reported - Other (%)
Educational Attainment - No schooling completed (%)
Educational Attainment - Less than high school (%)
Educational Attainment - High school or equivalent (%)
Educational Attainment - Less than 1 year of college (%)
Educational Attainment - 1 or more years of college (%)
Educational Attainment - Associate degree (%)
Educational Attainment - Bachelor's degree (%)
Educational Attainment - Master's degree (%)
Educational Attainment - Professional school degree (%)
Educational Attainment - Doctorate degree (%)
School Enrollment - Nursery, preschool (%)
School Enrollment - Kindergarten (%)
School Enrollment - Grade 1 to 4 (%)
School Enrollment - Grade 5 to 8 (%)
School Enrollment - Grade 9 to 12 (%)
School Enrollment - College undergrad (%)
School Enrollment - Graduate or professional (%)
School Enrollment - Not enrolled in school (%)
School enrollment - Public schools (%)
School enrollment - Private schools (%)
School enrollment - Not enrolled (%)
Median number of rooms in houses and condos
Median number of rooms in apartments
Housing units lacking complete plumbing facilities (%)
Housing units lacking complete kitchen facilities (%)
Density of houses
Urban houses (%)
Rural houses (%)
Households with people 60 years and over (%)
Households with people 65 years and over (%)
Households with people 75 years and over (%)
Households with one or more nonrelatives (%)
Households with no nonrelatives (%)
Population in households (%)
Family households (%)
Nonfamily households (%)
Population in families (%)
Family households with own children (%)
Median number of bedrooms in owner occupied houses
Mean number of bedrooms in owner occupied houses
Median number of bedrooms in renter occupied houses
Mean number of bedrooms in renter occupied houses
Median number of vehichles in owner occupied houses
Mean number of vehichles in owner occupied houses
Median number of vehichles in renter occupied houses
Mean number of vehichles in renter occupied houses
Mortgage status - with mortgage (%)
Mortgage status - with second mortgage (%)
Mortgage status - with home equity loan (%)
Mortgage status - with both second mortgage and home equity loan (%)
Mortgage status - without a mortgage (%)
Average family size
Average family size - White
Average family size - Black or African American
Average family size - Asian
Average family size - Hispanic or Latino
Average family size - American Indian and Alaska Native
Average family size - Multirace
Average family size - Other Race
Geographical mobility - Same house 1 year ago (%)
Geographical mobility - Moved within same county (%)
Geographical mobility - Moved from different county within same state (%)
Geographical mobility - Moved from different state (%)
Geographical mobility - Moved from abroad (%)
Place of birth - Born in state of residence (%)
Place of birth - Born in other state (%)
Place of birth - Native, outside of US (%)
Place of birth - Foreign born (%)
Housing units in structures - 1, detached (%)
Housing units in structures - 1, attached (%)
Housing units in structures - 2 (%)
Housing units in structures - 3 or 4 (%)
Housing units in structures - 5 to 9 (%)
Housing units in structures - 10 to 19 (%)
Housing units in structures - 20 to 49 (%)
Housing units in structures - 50 or more (%)
Housing units in structures - Mobile home (%)
Housing units in structures - Boat, RV, van, etc. (%)
House/condo owner moved in on average (years ago)
Renter moved in on average (years ago)
Year householder moved into unit - Moved in 1999 to March 2000 (%)
Year householder moved into unit - Moved in 1995 to 1998 (%)
Year householder moved into unit - Moved in 1990 to 1994 (%)
Year householder moved into unit - Moved in 1980 to 1989 (%)
Year householder moved into unit - Moved in 1970 to 1979 (%)
Year householder moved into unit - Moved in 1969 or earlier (%)
Means of transportation to work - Drove car alone (%)
Means of transportation to work - Carpooled (%)
Means of transportation to work - Public transportation (%)
Means of transportation to work - Bus or trolley bus (%)
Means of transportation to work - Streetcar or trolley car (%)
Means of transportation to work - Subway or elevated (%)
Means of transportation to work - Railroad (%)
Means of transportation to work - Ferryboat (%)
Means of transportation to work - Taxicab (%)
Means of transportation to work - Motorcycle (%)
Means of transportation to work - Bicycle (%)
Means of transportation to work - Walked (%)
Means of transportation to work - Other means (%)
Working at home (%)
Industry diversity
Most Common Industries - Agriculture, forestry, fishing and hunting, and mining (%)
Most Common Industries - Agriculture, forestry, fishing and hunting (%)
Most Common Industries - Mining, quarrying, and oil and gas extraction (%)
Most Common Industries - Construction (%)
Most Common Industries - Manufacturing (%)
Most Common Industries - Wholesale trade (%)
Most Common Industries - Retail trade (%)
Most Common Industries - Transportation and warehousing, and utilities (%)
Most Common Industries - Transportation and warehousing (%)
Most Common Industries - Utilities (%)
Most Common Industries - Information (%)
Most Common Industries - Finance and insurance, and real estate and rental and leasing (%)
Most Common Industries - Finance and insurance (%)
Most Common Industries - Real estate and rental and leasing (%)
Most Common Industries - Professional, scientific, and management, and administrative and waste management services (%)
Most Common Industries - Professional, scientific, and technical services (%)
Most Common Industries - Management of companies and enterprises (%)
Most Common Industries - Administrative and support and waste management services (%)
Most Common Industries - Educational services, and health care and social assistance (%)
Most Common Industries - Educational services (%)
Most Common Industries - Health care and social assistance (%)
Most Common Industries - Arts, entertainment, and recreation, and accommodation and food services (%)
Most Common Industries - Arts, entertainment, and recreation (%)
Most Common Industries - Accommodation and food services (%)
Most Common Industries - Other services, except public administration (%)
Most Common Industries - Public administration (%)
Occupation diversity
Most Common Occupations - Management, business, science, and arts occupations (%)
Most Common Occupations - Management, business, and financial occupations (%)
Most Common Occupations - Management occupations (%)
Most Common Occupations - Business and financial operations occupations (%)
Most Common Occupations - Computer, engineering, and science occupations (%)
Most Common Occupations - Computer and mathematical occupations (%)
Most Common Occupations - Architecture and engineering occupations (%)
Most Common Occupations - Life, physical, and social science occupations (%)
Most Common Occupations - Education, legal, community service, arts, and media occupations (%)
Most Common Occupations - Community and social service occupations (%)
Most Common Occupations - Legal occupations (%)
Most Common Occupations - Education, training, and library occupations (%)
Most Common Occupations - Arts, design, entertainment, sports, and media occupations (%)
Most Common Occupations - Healthcare practitioners and technical occupations (%)
Most Common Occupations - Health diagnosing and treating practitioners and other technical occupations (%)
Most Common Occupations - Health technologists and technicians (%)
Most Common Occupations - Service occupations (%)
Most Common Occupations - Healthcare support occupations (%)
Most Common Occupations - Protective service occupations (%)
Most Common Occupations - Fire fighting and prevention, and other protective service workers including supervisors (%)
Most Common Occupations - Law enforcement workers including supervisors (%)
Most Common Occupations - Food preparation and serving related occupations (%)
Most Common Occupations - Building and grounds cleaning and maintenance occupations (%)
Most Common Occupations - Personal care and service occupations (%)
Most Common Occupations - Sales and office occupations (%)
Most Common Occupations - Sales and related occupations (%)
Most Common Occupations - Office and administrative support occupations (%)
Most Common Occupations - Natural resources, construction, and maintenance occupations (%)
Most Common Occupations - Farming, fishing, and forestry occupations (%)
Most Common Occupations - Construction and extraction occupations (%)
Most Common Occupations - Installation, maintenance, and repair occupations (%)
Most Common Occupations - Production, transportation, and material moving occupations (%)
Most Common Occupations - Production occupations (%)
Most Common Occupations - Transportation occupations (%)
Most Common Occupations - Material moving occupations (%)
People in Group quarters - Institutionalized population (%)
People in Group quarters - Correctional institutions (%)
People in Group quarters - Federal prisons and detention centers (%)
People in Group quarters - Halfway houses (%)
People in Group quarters - Local jails and other confinement facilities (including police lockups) (%)
People in Group quarters - Military disciplinary barracks (%)
People in Group quarters - State prisons (%)
People in Group quarters - Other types of correctional institutions (%)
People in Group quarters - Nursing homes (%)
People in Group quarters - Hospitals/wards, hospices, and schools for the handicapped (%)
People in Group quarters - Hospitals/wards and hospices for chronically ill (%)
People in Group quarters - Hospices or homes for chronically ill (%)
People in Group quarters - Military hospitals or wards for chronically ill (%)
People in Group quarters - Other hospitals or wards for chronically ill (%)
People in Group quarters - Hospitals or wards for drug/alcohol abuse (%)
People in Group quarters - Mental (Psychiatric) hospitals or wards (%)
People in Group quarters - Schools, hospitals, or wards for the mentally retarded (%)
People in Group quarters - Schools, hospitals, or wards for the physically handicapped (%)
People in Group quarters - Institutions for the deaf (%)
People in Group quarters - Institutions for the blind (%)
People in Group quarters - Orthopedic wards and institutions for the physically handicapped (%)
People in Group quarters - Wards in general hospitals for patients who have no usual home elsewhere (%)
People in Group quarters - Wards in military hospitals for patients who have no usual home elsewhere (%)
People in Group quarters - Juvenile institutions (%)
People in Group quarters - Long-term care (%)
People in Group quarters - Homes for abused, dependent, and neglected children (%)
People in Group quarters - Residential treatment centers for emotionally disturbed children (%)
People in Group quarters - Training schools for juvenile delinquents (%)
People in Group quarters - Short-term care, detention or diagnostic centers for delinquent children (%)
People in Group quarters - Type of juvenile institution unknown (%)
People in Group quarters - Noninstitutionalized population (%)
People in Group quarters - College dormitories (includes college quarters off campus) (%)
People in Group quarters - Military quarters (%)
People in Group quarters - On base (%)
People in Group quarters - Barracks, unaccompanied personnel housing (UPH), (Enlisted/Officer), ;and similar group living quarters for military personnel (%)
People in Group quarters - Transient quarters for temporary residents (%)
People in Group quarters - Military ships (%)
People in Group quarters - Group homes (%)
People in Group quarters - Homes or halfway houses for drug/alcohol abuse (%)
People in Group quarters - Homes for the mentally ill (%)
People in Group quarters - Homes for the mentally retarded (%)
People in Group quarters - Homes for the physically handicapped (%)
People in Group quarters - Other group homes (%)
People in Group quarters - Religious group quarters (%)
People in Group quarters - Dormitories (%)
People in Group quarters - Agriculture workers' dormitories on farms (%)
People in Group quarters - Job Corps and vocational training facilities (%)
People in Group quarters - Other workers' dormitories (%)
People in Group quarters - Crews of maritime vessels (%)
People in Group quarters - Other nonhousehold living situations (%)
People in Group quarters - Other noninstitutional group quarters (%)
Residents speaking English at home (%)
Residents speaking English at home - Born in the United States (%)
Residents speaking English at home - Native, born elsewhere (%)
Residents speaking English at home - Foreign born (%)
Residents speaking Spanish at home (%)
Residents speaking Spanish at home - Born in the United States (%)
Residents speaking Spanish at home - Native, born elsewhere (%)
Residents speaking Spanish at home - Foreign born (%)
Residents speaking other language at home (%)
Residents speaking other language at home - Born in the United States (%)
Residents speaking other language at home - Native, born elsewhere (%)
Residents speaking other language at home - Foreign born (%)
Class of Workers - Employee of private company (%)
Class of Workers - Self-employed in own incorporated business (%)
Class of Workers - Private not-for-profit wage and salary workers (%)
Class of Workers - Local government workers (%)
Class of Workers - State government workers (%)
Class of Workers - Federal government workers (%)
Class of Workers - Self-employed workers in own not incorporated business and Unpaid family workers (%)
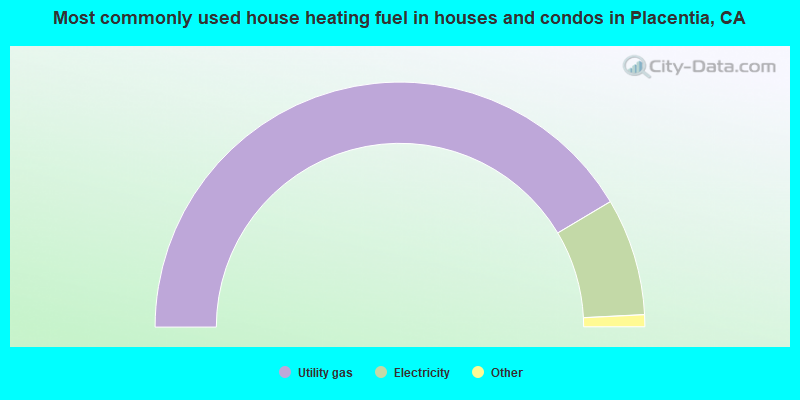
House heating fuel used in houses and condos - Utility gas (%)
House heating fuel used in houses and condos - Bottled, tank, or LP gas (%)
House heating fuel used in houses and condos - Electricity (%)
House heating fuel used in houses and condos - Fuel oil, kerosene, etc. (%)
House heating fuel used in houses and condos - Coal or coke (%)
House heating fuel used in houses and condos - Wood (%)
House heating fuel used in houses and condos - Solar energy (%)
House heating fuel used in houses and condos - Other fuel (%)
House heating fuel used in houses and condos - No fuel used (%)
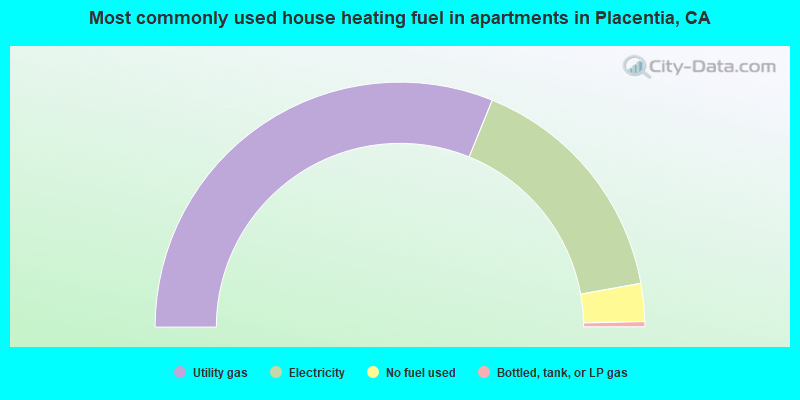
House heating fuel used in apartments - Utility gas (%)
House heating fuel used in apartments - Bottled, tank, or LP gas (%)
House heating fuel used in apartments - Electricity (%)
House heating fuel used in apartments - Fuel oil, kerosene, etc. (%)
House heating fuel used in apartments - Coal or coke (%)
House heating fuel used in apartments - Wood (%)
House heating fuel used in apartments - Solar energy (%)
House heating fuel used in apartments - Other fuel (%)
House heating fuel used in apartments - No fuel used (%)
Armed forces status - In Armed Forces (%)
Armed forces status - Civilian (%)
Armed forces status - Civilian - Veteran (%)
Armed forces status - Civilian - Nonveteran (%)
Fatal accidents locations in years 2005-2021
Fatal accidents locations in 2005
Fatal accidents locations in 2006
Fatal accidents locations in 2007
Fatal accidents locations in 2008
Fatal accidents locations in 2009
Fatal accidents locations in 2010
Fatal accidents locations in 2011
Fatal accidents locations in 2012
Fatal accidents locations in 2013
Fatal accidents locations in 2014
Fatal accidents locations in 2015
Fatal accidents locations in 2016
Fatal accidents locations in 2017
Fatal accidents locations in 2018
Fatal accidents locations in 2019
Fatal accidents locations in 2020
Fatal accidents locations in 2021
Alcohol use - People drinking some alcohol every month (%)
Alcohol use - People not drinking at all (%)
Alcohol use - Average days/month drinking alcohol
Alcohol use - Average drinks/week
Alcohol use - Average days/year people drink much
Audiometry - Average condition of hearing (%)
Audiometry - People that can hear a whisper from across a quiet room (%)
Audiometry - People that can hear normal voice from across a quiet room (%)
Audiometry - Ears ringing, roaring, buzzing (%)
Audiometry - Had a job exposure to loud noise (%)
Audiometry - Had off-work exposure to loud noise (%)
Blood Pressure & Cholesterol - Has high blood pressure (%)
Blood Pressure & Cholesterol - Checking blood pressure at home (%)
Blood Pressure & Cholesterol - Frequently checking blood cholesterol (%)
Blood Pressure & Cholesterol - Has high cholesterol level (%)
Consumer Behavior - Money monthly spent on food at supermarket/grocery store
Consumer Behavior - Money monthly spent on food at other stores
Consumer Behavior - Money monthly spent on eating out
Consumer Behavior - Money monthly spent on carryout/delivered foods
Consumer Behavior - Income spent on food at supermarket/grocery store (%)
Consumer Behavior - Income spent on food at other stores (%)
Consumer Behavior - Income spent on eating out (%)
Consumer Behavior - Income spent on carryout/delivered foods (%)
Current Health Status - General health condition (%)
Current Health Status - Blood donors (%)
Current Health Status - Has blood ever tested for HIV virus (%)
Current Health Status - Left-handed people (%)
Dermatology - People using sunscreen (%)
Diabetes - Diabetics (%)
Diabetes - Had a blood test for high blood sugar (%)
Diabetes - People taking insulin (%)
Diet Behavior & Nutrition - Diet health (%)
Diet Behavior & Nutrition - Milk product consumption (# of products/month)
Diet Behavior & Nutrition - Meals not home prepared (#/week)
Diet Behavior & Nutrition - Meals from fast food or pizza place (#/week)
Diet Behavior & Nutrition - Ready-to-eat foods (#/month)
Diet Behavior & Nutrition - Frozen meals/pizza (#/month)
Drug Use - People that ever used marijuana or hashish (%)
Drug Use - Ever used hard drugs (%)
Drug Use - Ever used any form of cocaine (%)
Drug Use - Ever used heroin (%)
Drug Use - Ever used methamphetamine (%)
Health Insurance - People covered by health insurance (%)
Kidney Conditions-Urology - Avg. # of times urinating at night
Medical Conditions - People with asthma (%)
Medical Conditions - People with anemia (%)
Medical Conditions - People with psoriasis (%)
Medical Conditions - People with overweight (%)
Medical Conditions - Elderly people having difficulties in thinking or remembering (%)
Medical Conditions - People who ever received blood transfusion (%)
Medical Conditions - People having trouble seeing even with glass/contacts (%)
Medical Conditions - People with arthritis (%)
Medical Conditions - People with gout (%)
Medical Conditions - People with congestive heart failure (%)
Medical Conditions - People with coronary heart disease (%)
Medical Conditions - People with angina pectoris (%)
Medical Conditions - People who ever had heart attack (%)
Medical Conditions - People who ever had stroke (%)
Medical Conditions - People with emphysema (%)
Medical Conditions - People with thyroid problem (%)
Medical Conditions - People with chronic bronchitis (%)
Medical Conditions - People with any liver condition (%)
Medical Conditions - People who ever had cancer or malignancy (%)
Mental Health - People who have little interest in doing things (%)
Mental Health - People feeling down, depressed, or hopeless (%)
Mental Health - People who have trouble sleeping or sleeping too much (%)
Mental Health - People feeling tired or having little energy (%)
Mental Health - People with poor appetite or overeating (%)
Mental Health - People feeling bad about themself (%)
Mental Health - People who have trouble concentrating on things (%)
Mental Health - People moving or speaking slowly or too fast (%)
Mental Health - People having thoughts they would be better off dead (%)
Oral Health - Average years since last visit a dentist
Oral Health - People embarrassed because of mouth (%)
Oral Health - People with gum disease (%)
Oral Health - General health of teeth and gums (%)
Oral Health - Average days a week using dental floss/device
Oral Health - Average days a week using mouthwash for dental problem
Oral Health - Average number of teeth
Pesticide Use - Households using pesticides to control insects (%)
Pesticide Use - Households using pesticides to kill weeds (%)
Physical Activity - People doing vigorous-intensity work activities (%)
Physical Activity - People doing moderate-intensity work activities (%)
Physical Activity - People walking or bicycling (%)
Physical Activity - People doing vigorous-intensity recreational activities (%)
Physical Activity - People doing moderate-intensity recreational activities (%)
Physical Activity - Average hours a day doing sedentary activities
Physical Activity - Average hours a day watching TV or videos
Physical Activity - Average hours a day using computer
Physical Functioning - People having limitations keeping them from working (%)
Physical Functioning - People limited in amount of work they can do (%)
Physical Functioning - People that need special equipment to walk (%)
Physical Functioning - People experiencing confusion/memory problems (%)
Physical Functioning - People requiring special healthcare equipment (%)
Prescription Medications - Average number of prescription medicines taking
Preventive Aspirin Use - Adults 40+ taking low-dose aspirin (%)
Reproductive Health - Vaginal deliveries (%)
Reproductive Health - Cesarean deliveries (%)
Reproductive Health - Deliveries resulted in a live birth (%)
Reproductive Health - Pregnancies resulted in a delivery (%)
Reproductive Health - Women breastfeeding newborns (%)
Reproductive Health - Women that had a hysterectomy (%)
Reproductive Health - Women that had both ovaries removed (%)
Reproductive Health - Women that have ever taken birth control pills (%)
Reproductive Health - Women taking birth control pills (%)
Reproductive Health - Women that have ever used Depo-Provera or injectables (%)
Reproductive Health - Women that have ever used female hormones (%)
Sexual Behavior - People 18+ that ever had sex (vaginal, anal, or oral) (%)
Sexual Behavior - Males 18+ that ever had vaginal sex with a woman (%)
Sexual Behavior - Males 18+ that ever performed oral sex on a woman (%)
Sexual Behavior - Males 18+ that ever had anal sex with a woman (%)
Sexual Behavior - Males 18+ that ever had any sex with a man (%)
Sexual Behavior - Females 18+ that ever had vaginal sex with a man (%)
Sexual Behavior - Females 18+ that ever performed oral sex on a man (%)
Sexual Behavior - Females 18+ that ever had anal sex with a man (%)
Sexual Behavior - Females 18+ that ever had any kind of sex with a woman (%)
Sexual Behavior - Average age people first had sex
Sexual Behavior - Average number of female sex partners in lifetime (males 18+)
Sexual Behavior - Average number of female vaginal sex partners in lifetime (males 18+)
Sexual Behavior - Average age people first performed oral sex on a woman (18+)
Sexual Behavior - Average number of woman performed oral sex on in lifetime (18+)
Sexual Behavior - Average number of male sex partners in lifetime (males 18+)
Sexual Behavior - Average number of male anal sex partners in lifetime (males 18+)
Sexual Behavior - Average age people first performed oral sex on a man (18+)
Sexual Behavior - Average number of male oral sex partners in lifetime (18+)
Sexual Behavior - People using protection when performing oral sex (%)
Sexual Behavior - Average number of times people have vaginal or anal sex a year
Sexual Behavior - People having sex without condom (%)
Sexual Behavior - Average number of male sex partners in lifetime (females 18+)
Sexual Behavior - Average number of male vaginal sex partners in lifetime (females 18+)
Sexual Behavior - Average number of female sex partners in lifetime (females 18+)
Sexual Behavior - Circumcised males 18+ (%)
Sleep Disorders - Average hours sleeping at night
Sleep Disorders - People that has trouble sleeping (%)
Smoking-Cigarette Use - People smoking cigarettes (%)
Taste & Smell - People 40+ having problems with smell (%)
Taste & Smell - People 40+ having problems with taste (%)
Taste & Smell - People 40+ that ever had wisdom teeth removed (%)
Taste & Smell - People 40+ that ever had tonsils teeth removed (%)
Taste & Smell - People 40+ that ever had a loss of consciousness because of a head injury (%)
Taste & Smell - People 40+ that ever had a broken nose or other serious injury to face or skull (%)
Taste & Smell - People 40+ that ever had two or more sinus infections (%)
Weight - Average height (inches)
Weight - Average weight (pounds)
Weight - Average BMI
Weight - People that are obese (%)
Weight - People that ever were obese (%)
Weight - People trying to lose weight (%)
19,834 38.6% White alone 18,362 35.7% Hispanic 9,013 17.5% Asian alone 2,428 4.7% Two or more races 1,276 2.5% Black alone 322 0.6% Other race alone 54 0.1% Native Hawaiian and Other 7 0.01% American Indian alone
According to our research of California and other state lists, there were 30 registered sex offenders living in Placentia, California as of April 26, 2024 . The ratio of all residents to sex offenders in Placentia is 1,761 to 1.The ratio of registered sex offenders to all residents in this city is lower than the state average.
The City-Data.com crime index weighs serious crimes and violent crimes more heavily. Higher means more crime, U.S. average is 246.1. It adjusts for the number of visitors and daily workers commuting into cities.
- means the value is smaller than the state average.
- means the value is about the same as the state average.
- means the value is bigger than the state average.
- means the value is much bigger than the state average.
Crime rate in Placentia detailed stats: murders, rapes, robberies, assaults, burglaries, thefts, arson Officers per 1,000 residents here:
0.87California average:
2.30
Latest news from Placentia, CA collected exclusively by city-data.com from local newspapers, TV, and radio stations
Placentia, CA City Guides: Ancestries: American (5.5%), German (4.0%), Irish (3.0%), Italian (2.4%), European (2.1%), English (2.0%).
Current Local Time:
Land area: 6.59 square miles.
Population density: 7,880 people per square mile (high).
13,028 residents are foreign born (11.1% Latin America , 10.9% Asia ).
This city:
25.3%California:
26.5%
Median real estate property taxes paid for housing units with mortgages in 2022: $6,469 (0.7%)Median real estate property taxes paid for housing units with no mortgage in 2022: $4,591 (0.5%)
Nearest city with pop. 50,000+: Anaheim, CA
Nearest city with pop. 1,000,000+: Los Angeles, CA
Nearest cities:
Latitude: 33.88 N, Longitude: 117.86 W
Daytime population change due to commuting: -9,361 (-18.2%)Workers who live and work in this city: 6,017 (23.6%)
Single-family new house construction building permits:
2022: 49 buildings , average cost: $271,2002021: 62 buildings , average cost: $170,5002020: 11 buildings , average cost: $190,2002019: 5 buildings , average cost: $109,0002016: 42 buildings , average cost: $259,7002015: 43 buildings , average cost: $272,9002014: 37 buildings , average cost: $225,2002013: 18 buildings , average cost: $249,1002012: 15 buildings , average cost: $249,1002011: 11 buildings , average cost: $249,1002010: 14 buildings , average cost: $249,1002009: 12 buildings , average cost: $249,1002008: 14 buildings , average cost: $249,0002007: 25 buildings , average cost: $249,2002006: 39 buildings , average cost: $248,3002005: 56 buildings , average cost: $251,3002004: 50 buildings , average cost: $239,6002003: 75 buildings , average cost: $229,4002002: 191 buildings , average cost: $251,5002001: 124 buildings , average cost: $240,0002000: 92 buildings , average cost: $214,2001999: 156 buildings , average cost: $174,3001998: 264 buildings , average cost: $141,5001997: 270 buildings , average cost: $141,900Unemployment in December 2023:
Population change in the 1990s: +5,304 (+12.9%).
Most common occupations in Placentia, CA (%)
Both Males Females
Other sales and related occupations, including supervisors (5.0%)
Other office and administrative support workers, including supervisors (4.6%)
Other management occupations, except farmers and farm managers (4.6%)
Other production occupations, including supervisors (4.2%)
Preschool, kindergarten, elementary, and middle school teachers (3.9%)
Computer specialists (3.4%)
Retail sales workers, except cashiers (2.9%)
Other sales and related occupations, including supervisors (5.6%)
Other management occupations, except farmers and farm managers (5.3%)
Other production occupations, including supervisors (5.2%)
Computer specialists (4.4%)
Engineers (4.3%)
Driver/sales workers and truck drivers (3.5%)
Material recording, scheduling, dispatching, and distributing workers (3.4%)
Other office and administrative support workers, including supervisors (7.3%)
Preschool, kindergarten, elementary, and middle school teachers (7.1%)
Secretaries and administrative assistants (5.2%)
Other sales and related occupations, including supervisors (4.3%)
Other management occupations, except farmers and farm managers (3.8%)
Bookkeeping, accounting, and auditing clerks (3.3%)
Retail sales workers, except cashiers (3.2%)
Earthquake activity:
Placentia-area historical earthquake activity is significantly above California state average. It is 7006% greater than the overall U.S. average. On 7/21/1952 at 11:52:14, a magnitude 7.7 (7.7 UK, Class: Major, Intensity: VIII - XII) earthquake occurred 101.2 miles away from the city center, causing $50,000,000 total damage On 6/28/1992 at 11:57:34, a magnitude 7.6 (6.2 MB, 7.6 MS, 7.3 MW, Depth: 0.7 mi) earthquake occurred 78.7 miles away from Placentia center, causing 3 deaths ( 1 shaking deaths, 2 other deaths) and 400 injuries, causing $100,000,000 total damage and $40,000,000 insured lossesOn 10/16/1999 at 09:46:44, a magnitude 7.4 (6.3 MB, 7.4 MS, 7.2 MW, 7.3 ML) earthquake occurred 92.3 miles away from the city center On 11/4/1927 at 13:51:53, a magnitude 7.5 (7.5 UK) earthquake occurred 194.8 miles away from the city center On 4/21/1918 at 22:32:30, a magnitude 6.8 (6.8 UK, Class: Strong, Intensity: VII - IX) earthquake occurred 24.3 miles away from the city center On 5/19/1940 at 04:36:40, a magnitude 7.2 (7.2 UK) earthquake occurred 132.5 miles away from Placentia center, causing $33,000,000 total damage Magnitude types: body-wave magnitude (MB), local magnitude (ML), surface-wave magnitude (MS), moment magnitude (MW) Natural disasters: The number of natural disasters in Orange County (32) is a lot greater than the US average (15).Major Disasters (Presidential) Declared: 22Emergencies Declared: 2Floods: 15, Fires: 13, Storms: 9, Landslides: 6, Winter Storms: 6, Mudslides: 5, Earthquakes: 2, Heavy Rain: 1, Hurricane: 1, Snow: 1, Tornado: 1, Wind: 1, Other: 1 (Note: some incidents may be assigned to more than one category). Hospitals and medical centers in Placentia: HOSPICE CARE OF CALIFORNIA (377 E CHAPMAN AVENUE, SUTIE 280) IRENE WAY HOME (651 IRENE WAY) PLACENTIA LINDA HOSPITAL (Proprietary, 1301 N ROSE DRIVE) Amtrak stations near Placentia: 4 miles: FULLERTON (120 E. SANTA FE AVE.) Services: ticket office, fully wheelchair accessible, enclosed waiting area, public restrooms, public payphones, full-service food facilities, free short-term parking, paid long-term parking, taxi stand, public transit connection.
6 miles: ANAHEIM (2150 KATELLA AVE.) Services: ticket office, fully wheelchair accessible, enclosed waiting area, public restrooms, public payphones, vending machines, free short-term parking, free long-term parking, call for car rental service, call for taxi service.
9 miles: SANTA ANA (1000 E. SANTA ANA BLVD.) Services: ticket office, fully wheelchair accessible, enclosed waiting area, public restrooms, public payphones, snack bar, free short-term parking, free long-term parking, call for car rental service, taxi stand, intercity bus service, public transit connection.
Colleges/universities with over 2000 students nearest to Placentia:
California State University-Fullerton (about 2 miles; Fullerton, CA ; Full-time enrollment: 28,947)
Fullerton College (about 4 miles; Fullerton, CA ; FT enrollment: 11,124)
West Coast University-Orange County (about 6 miles; Anaheim, CA ; FT enrollment: 2,464)
Chapman University (about 7 miles; Orange, CA ; FT enrollment: 7,089)
Santiago Canyon College (about 8 miles; Orange, CA ; FT enrollment: 6,050)
Santa Ana College (about 9 miles; Santa Ana, CA ; FT enrollment: 11,756)
Biola University (about 10 miles; La Mirada, CA ; FT enrollment: 5,325)
Public high schools in Placentia: PARKVIEW Students: 152, Location: 2189 N. KRAEMER BLVD., Grades: KG-12)EL CAMINO REAL CONTINUATION HIGH Students: 74, Location: 1351 E. ORANGETHORPE AVE., Grades: 9-12)EL DORADO HIGH Location: 1651 N. VALENCIA AVE., Grades: 9-12)
VALENCIA HIGH Location: 500 N. BRADFORD AVE., Grades: 9-12)
Biggest public elementary/middle schools in Placentia: KRAEMER MIDDLE Students: 1,000, Location: 645 N. ANGELINA DR., Grades: 7-8)COL. J. K. TUFFREE MIDDLE Students: 709, Location: 2151 N. KRAEMER BLVD., Grades: 7-8)JOHN O. TYNES ELEMENTARY Students: 562, Location: 735 STANFORD, Grades: KG-6)GOLDEN ELEMENTARY Students: 532, Location: 740 E. GOLDEN AVE., Grades: KG-6)VAN BUREN ELEMENTARY Students: 506, Location: 1245 N. VAN BUREN ST., Grades: KG-6)VALADEZ MIDDLE SCHOOL ACADEMY Students: 416, Location: 161 E. LA JOLLA ST., Grades: 6-8)MORSE AVENUE ELEMENTARY Students: 386, Location: 431 E. MORSE AVE., Grades: KG-6)BROOKHAVEN ELEMENTARY Students: 366, Location: 1851 N. BROOKHAVEN AVE., Grades: KG-6)MELROSE ELEMENTARY Students: 355, Location: 974 S. MELROSE ST., Grades: KG-5)SIERRA VISTA ELEMENTARY Students: 349, Location: 1811 N. PLACENTIA AVE., Grades: KG-6)Private elementary/middle schools in Placentia: ST JOSEPH ELEMENTARY SCHOOL Students: 289, Location: 801 N BRADFORD AVE, Grades: PK-8)
PLACENTIA TOWNE & COUNTRY EARLY EDUCATION CENTER Students: 32, Location: 201 E MADISON AVE, Grades: PK-1)
See full list of schools located in Placentia Library in Placentia: PLACENTIA LIBRARY DISTRICT Operating income: $2,382,784; Location: 411 E. CHAPMAN AVE.; 88,010 books ; 3,740 audio materials ; 5,248 video materials ; 18 local licensed databases ; 152 print serial subscriptions )
Notable locations in Placentia: (A) , Placentia Library (B) , Placentia City Hall (C) , Orange County Fire Authority Station 34 (D) , Orange County Fire Authority Station 35 (E) . Display/hide their locations on the map
Shopping Centers: (1) , Sierra Vista Plaza Shopping Center (2) , Placentia Town Center Shopping Center (3) . Display/hide their locations on the map
Churches in Placentia include: (A) , Holy Cross Melkite Greek Church (B) , Placentia Presbyterian Church (C) , Radha Raman Vedic Temple (D) , Saint Joseph Catholic Church (E) . Display/hide their locations on the map
Reservoir: (A) . Display/hide its location on the map
Parks in Placentia include: (1) , George J Koch Park (2) , Goldenrod Park (3) , Parque De Los Vaqueros (4) , Parque Del Arroyo Verde (5) , Tri City Park (6) , Tuffree Hill Park (7) , Wagner Park (8) , Santa Fe Park (9) . Display/hide their locations on the map
Tourist attraction:
Court:
Birthplace of: Daryl F. Mallett - Literary critic, Audrina Patridge - Reality television star, Courtney Hicks - Figure skater, Thomas L. McFadden - Football player and coach, Chris Dressel - Football player, David Patten - College basketball player (Weber State Wildcats), Dustin Price - College basketball player (UC Irvine Anteaters).
Orange County has a predicted average indoor radon screening level less than 2 pCi/L (pico curies per liter) - Low Potential Average household size: This city:
3.1 peopleCalifornia:
2.9 people
Percentage of family households: This city:
75.6%Whole state:
68.7%
Percentage of households with unmarried partners: This city:
5.1%Whole state:
7.2%
Likely homosexual households (counted as self-reported same-sex unmarried-partner households)
Lesbian couples: 0.4% of all households Gay men: 0.2% of all households
People in group quarters in Placentia in 2010:
161 people in group homes intended for adults
73 people in nursing facilities/skilled-nursing facilities
67 people in emergency and transitional shelters (with sleeping facilities) for people experiencing homelessness
15 people in workers' group living quarters and job corps centers
11 people in residential treatment centers for juveniles (non-correctional)
6 people in residential treatment centers for adults
4 people in other noninstitutional facilities
People in group quarters in Placentia in 2000:
90 people in other group homes
89 people in nursing homes
69 people in homes for the mentally retarded
51 people in other noninstitutional group quarters
4 people in religious group quarters
Banks with branches in Placentia (2011 data):
Wells Fargo Bank, National Association: Placentia Stater Brothers Branch, Yorba Linda And Rose Branch, Placentia Branch. Info updated 2011/04/05: Bank assets: $1,161,490.0 mil, Deposits: $905,653.0 mil, headquarters in Sioux Falls, SD, positive income , 6395 total offices , Holding Company: Wells Fargo & Company
U.S. Bank National Association: Placentia Ralphs Branch at 710 North Rose Drive, branch established on 1996/07/31; Placentia Branch at 201 E.Yorba Linda Blvd, branch established on 1954/05/07. Info updated 2012/01/30: Bank assets: $330,470.8 mil, Deposits: $236,091.5 mil, headquarters in Cincinnati, OH, positive income , 3121 total offices , Holding Company: U.S. Bancorp
Union Bank, National Association: Plancentia Branch at 850 N Rose Drive, Suite E, branch established on 2007/11/26. Info updated 2011/09/01: Bank assets: $88,967.5 mil, Deposits: $65,286.4 mil, headquarters in San Francisco, CA, positive income , Commercial Lending Specialization, 403 total offices , Holding Company: Mitsubishi Ufj Financial Group, Inc.
Opus Bank: 1204 Yorba Linda Blvd Branch at 1204 E Yorba Linda Blvd, branch established on 1927/01/01. Info updated 2011/11/08: Bank assets: $2,404.2 mil, Deposits: $1,831.2 mil, headquarters in Irvine, CA, negative income in the last year , Commercial Lending Specialization, 38 total offices
Bank of America, National Association: Placentia Branch at 160 East Yorba Linda Boulevard, branch established on 1965/07/09. Info updated 2009/11/18: Bank assets: $1,451,969.3 mil, Deposits: $1,077,176.8 mil, headquarters in Charlotte, NC, positive income , 5782 total offices , Holding Company: Bank Of America Corporation
JPMorgan Chase Bank, National Association: Alta Vista & Rose Banking Center Bra at 670 North Rose Drive, branch established on 2010/11/18. Info updated 2011/11/10: Bank assets: $1,811,678.0 mil, Deposits: $1,190,738.0 mil, headquarters in Columbus, OH, positive income , International Specialization, 5577 total offices , Holding Company: Jpmorgan Chase & Co.
Citibank, National Association: N. Kraemer Blvd. Branch at 1300 North Kraemer Boulevard, branch established on 1927/01/01. Info updated 2012/01/10: Bank assets: $1,288,658.0 mil, Deposits: $882,541.0 mil, headquarters in Sioux Falls, SD, positive income , International Specialization, 1048 total offices , Holding Company: Citigroup Inc.
Banco Popular North America: Alta Vista Branch at 870 North Rose Drive, branch established on 1998/02/16. Info updated 2012/01/27: Bank assets: $8,605.3 mil, Deposits: $6,167.7 mil, headquarters in New York, NY, positive income , Commercial Lending Specialization, 97 total offices , Holding Company: Popular, Inc.
For population 15 years and over in Placentia:
Never married: 33.2%Now married: 51.0%Separated: 1.9%Widowed: 4.9%Divorced: 9.0% For population 25 years and over in Placentia:
High school or higher: 89.6%Bachelor's degree or higher: 41.8%Graduate or professional degree: 15.7%Unemployed: 4.3%Mean travel time to work (commute): 24.8 minutes
Education Gini index (Inequality in education) Here:
13.4California average:
15.5
Religion statistics for Placentia, CA (based on Orange County data)
Religion Adherents Congregations Catholic 797,473 67 Evangelical Protestant 345,893 894 Other 141,815 329 Mainline Protestant 76,574 202 Orthodox 13,406 19 Black Protestant 2,424 8 None 1,632,647 -
Source: Clifford Grammich, Kirk Hadaway, Richard Houseal, Dale E.Jones, Alexei Krindatch, Richie Stanley and Richard H.Taylor. 2012. 2010 U.S.Religion Census: Religious Congregations & Membership Study. Association of Statisticians of American Religious Bodies. Jones, Dale E., et al. 2002. Congregations and Membership in the United States 2000. Nashville, TN: Glenmary Research Center. Graphs represent county-level data
Food Environment Statistics: Number of grocery stores : 530Orange County :
1.78 / 10,000 pop.California :
2.14 / 10,000 pop.
Number of supercenters and club stores : 18Orange County :
0.06 / 10,000 pop.California :
0.04 / 10,000 pop.
Number of convenience stores (no gas) : 147Orange County :
0.49 / 10,000 pop.California :
0.62 / 10,000 pop.
Number of convenience stores (with gas) : 434This county :
1.46 / 10,000 pop.California :
1.49 / 10,000 pop.
Number of full-service restaurants : 2,438This county :
8.19 / 10,000 pop.California :
7.42 / 10,000 pop.
Adult diabetes rate : This county :
6.3%California :
7.3%
Adult obesity rate : Orange County :
18.5%State :
21.3%
Low-income preschool obesity rate : This county :
16.4%State :
17.9%
Health and Nutrition: Healthy diet rate : This city:
49.8%California:
49.4%
Average overall health of teeth and gums : Placentia:
48.4%California:
48.0%
Average BMI : This city:
28.0California:
28.1
People feeling badly about themselves : People not drinking alcohol at all : This city:
10.6%California:
11.2%
Average hours sleeping at night : Overweight people : This city:
31.5%California:
31.5%
General health condition : This city:
57.1%California:
56.4%
Average condition of hearing : Placentia:
80.9%State:
80.9%
More about Health and Nutrition of Placentia, CA Residents
Local government employment and payroll (March 2022)
Function
Full-time employees
Monthly full-time payroll
Average yearly full-time wage
Part-time employees
Monthly part-time payroll
Police Protection - Officers
48 $538,171 $134,543 1 $1,822 Streets and Highways
23 $137,627 $71,805 8 $18,423 Police - Other
22 $134,699 $73,472 14 $26,656 Other Government Administration
13 $126,615 $116,875 4 $881 Financial Administration
5 $34,853 $83,647 1 $2,861 Parks and Recreation
5 $43,325 $103,980 29 $38,201 Housing and Community Development (Local)
0 $0 1 $3,330
Totals for Government
116 $1,015,290 $105,030 58 $92,174
Placentia government finances - Expenditure in 2017 (per resident):
Construction - Regular Highways: $2,737,000 ($52.68)
Housing and Community Development: $1,250,000 ($24.06)Parks and Recreation: $650,000 ($12.51)Central Staff Services: $242,000 ($4.66)Current Operations - Police Protection: $12,393,000 ($238.55)
Central Staff Services: $11,082,000 ($213.32)Local Fire Protection: $5,704,000 ($109.80)Regular Highways: $4,525,000 ($87.10)Solid Waste Management: $2,571,000 ($49.49)Parks and Recreation: $1,558,000 ($29.99)Financial Administration: $1,110,000 ($21.37)Protective Inspection and Regulation - Other: $966,000 ($18.59)Housing and Community Development: $525,000 ($10.11)Sewerage: $434,000 ($8.35)Health - Other: $332,000 ($6.39)General - Interest on Debt: $716,000 ($13.78)
Intergovernmental to Local - Other - Local Fire Protection: $5,854,000 ($112.68)
Other - Parking Facilities: $401,000 ($7.72)Other - General - Other: $379,000 ($7.30)Other - Health - Other: $236,000 ($4.54)Other - Sewerage: $110,000 ($2.12)Intergovernmental to State - Water Utilities: $510,000 ($9.82)
Other Capital Outlay - General - Other: $1,181,000 ($22.73)
Regular Highways: $613,000 ($11.80)Police Protection: $19,000 ($0.37)
Placentia government finances - Revenue in 2017 (per resident):
Charges - Solid Waste Management: $2,958,000 ($56.94)
Other: $2,184,000 ($42.04)Sewerage: $722,000 ($13.90)Parks and Recreation: $307,000 ($5.91)Regular Highways: $155,000 ($2.98)Federal Intergovernmental - Housing and Community Development: $658,000 ($12.67)
Other: $75,000 ($1.44)Local Intergovernmental - Other: $798,000 ($15.36)
Miscellaneous - Fines and Forfeits: $1,297,000 ($24.97)
Rents: $1,218,000 ($23.45)General Revenue - Other: $625,000 ($12.03)Interest Earnings: $39,000 ($0.75)Donations From Private Sources: $31,000 ($0.60)State Intergovernmental - Highways: $1,030,000 ($19.83)
Other: $527,000 ($10.14)General Local Government Support: $24,000 ($0.46)Tax - Property: $13,702,000 ($263.75)
General Sales and Gross Receipts: $6,682,000 ($128.62)Public Utilities Sales: $4,881,000 ($93.95)Occupation and Business License - Other: $1,008,000 ($19.40)Other Selective Sales: $965,000 ($18.58)Other License: $793,000 ($15.26)Documentary and Stock Transfer: $324,000 ($6.24)Other: $7,000 ($0.13)
Placentia government finances - Debt in 2017 (per resident):
Long Term Debt - Beginning Outstanding - Unspecified Public Purpose: $15,918,000 ($306.40)
Outstanding Unspecified Public Purpose: $14,263,000 ($274.55)Retired Unspecified Public Purpose: $1,654,000 ($31.84)
Placentia government finances - Cash and Securities in 2017 (per resident):
Bond Funds - Cash and Securities: $470,000 ($9.05)
Other Funds - Cash and Securities: $12,721,000 ($244.87)
Sinking Funds - Cash and Securities: $484,000 ($9.32)
4.86% of this county's 2021 resident taxpayers lived in other counties in 2020 ($95,983 average adjusted gross income )
Here:
4.86%California average:
5.19%
0.01% of residents moved from foreign countries ($132 average AGI )Orange County:
0.01%California average:
0.03%
Top counties from which taxpayers relocated into this county between 2020 and 2021:
5.71% of this county's 2020 resident taxpayers moved to other counties in 2021 ($106,828 average adjusted gross income )
Here:
5.71%California average:
6.14%
0.01% of residents moved to foreign countries ($180 average AGI )Orange County:
0.01%California average:
0.02%
Top counties to which taxpayers relocated from this county between 2020 and 2021:
Businesses in Placentia, CA
Name Count Name Count
7-Eleven 1 Jones New York 1 99 Cents Only Stores 1 KFC 1 Baskin-Robbins 1 Kroger 1 Best Western 1 Little Caesars Pizza 1 Blockbuster 1 Marriott 2 CVS 1 McDonald's 2 Carl\s Jr. 2 Nike 1 Chuck E. Cheese's 1 OfficeMax 1 Circle K 2 Penske 2 Dennys 1 Pizza Hut 1 Domino's Pizza 1 RadioShack 1 FedEx 4 Subway 5 GNC 1 Taco Bell 1 H&R Block 2 The Room Place 1 Holiday Inn 1 U-Haul 1 HomeTown Buffet 1 UPS 2 IHOP 1 Walgreens 2 Jack In The Box 3
Strongest AM radio stations in Placentia:
KFI (640 AM; 50 kW; LOS ANGELES, CA; Owner: CAPSTAR TX LIMITED PARTNERSHIP)
KTNQ (1020 AM; 50 kW; LOS ANGELES, CA; Owner: KTNQ-AM LICENSE CORP.)
KPLS (830 AM; 50 kW; ORANGE, CA; Owner: CRN LICENSES, LLC)
KXTA (1150 AM; 50 kW; LOS ANGELES, CA; Owner: CITICASTERS LICENSES, L.P.)
KLAC (570 AM; 50 kW; LOS ANGELES, CA; Owner: AMFM RADIO LICENSES, L.L.C.)
KDIS (1110 AM; 50 kW; PASADENA, CA; Owner: ABC,INC.)
KFWB (980 AM; 50 kW; LOS ANGELES, CA; Owner: INFINITY BROADCASTING OPERATIONS, INC.)
KMPC (1540 AM; 50 kW; LOS ANGELES, CA; Owner: ROSE CITY RADIO CORPORATION)
KNX (1070 AM; 50 kW; LOS ANGELES, CA; Owner: INFINITY BROADCASTING OPERATIONS, INC.)
KALI (900 AM; 6 kW; WEST COVINA, CA; Owner: MULTICULTURAL RADIO BROADCASTING, INC.)
KSPN (710 AM; 50 kW; LOS ANGELES, CA; Owner: KABC-AM RADIO, INC.)
KBLA (1580 AM; 50 kW; SANTA MONICA, CA)
KVNR (1480 AM; 5 kW; SANTA ANA, CA; Owner: LBI RADIO LICENSE CORP.)
Strongest FM radio stations in Placentia:
KFSH-FM (95.9 FM; ANAHEIM, CA; Owner: NEW INSPIRATION BROADCASTING COMPANY)
KCBS-FM (93.1 FM; LOS ANGELES, CA; Owner: INFINITY BROADCASTING OPERATIONS, INC.)
KSCA (101.9 FM; GLENDALE, CA; Owner: HBC LICENSE CORPORATION)
KLOS (95.5 FM; LOS ANGELES, CA; Owner: KLOS-FM RADIO, INC.)
K212FA (90.3 FM; TEMPLE CITY, CA; Owner: EDUCATIONAL MEDIA FOUNDATION)
KOST (103.5 FM; LOS ANGELES, CA; Owner: CAPSTAR TX LIMITED PARTNERSHIP)
KZLA-FM (93.9 FM; LOS ANGELES, CA; Owner: EMMIS RADIO LICENSE CORPORATION)
KIIS-FM (102.7 FM; LOS ANGELES, CA; Owner: CITICASTERS LICENSES, L.P.)
KLVE (107.5 FM; LOS ANGELES, CA; Owner: KLVE-FM LICENSE CORP.)
KPCC (89.3 FM; PASADENA, CA; Owner: PASADENA AREA COMMUNITY COLLEGE DISTRICT)
KHHT (92.3 FM; LOS ANGELES, CA; Owner: AMFM RADIO LICENSES, L.L.C.)
KPWR (105.9 FM; LOS ANGELES, CA; Owner: EMMIS RADIO LICENSE CORPORATION)
KBIG-FM (104.3 FM; LOS ANGELES, CA; Owner: AMFM RADIO LICENSES, L.L.C.)
KLSX (97.1 FM; LOS ANGELES, CA; Owner: INFINITY BROADCASTING OPERATIONS, INC.)
KTWV (94.7 FM; LOS ANGELES, CA; Owner: INFINITY BROADCASTING OPERATIONS, INC.)
KMZT-FM (105.1 FM; LOS ANGELES, CA; Owner: MOUNT WILSON FM BROADCASTERS, INC.)
KPFK (90.7 FM; LOS ANGELES, CA; Owner: PACIFICA FOUNDATION, INC)
K216EM (91.1 FM; ARCADIA, CA; Owner: LIFE ON THE WAY COMMUNICATIONS, INC.)
KUSC (91.5 FM; LOS ANGELES, CA; Owner: UNIVERSITY OF SOUTHERN CALIFORNIA)
KKLA-FM (99.5 FM; LOS ANGELES, CA; Owner: NEW INSPIRATION BROADCASTING CO., INC.)
TV broadcast stations around Placentia:
KTRO-LP (Channel 50; LANCASTER, CA; Owner: ROBERT D. ADELMAN)
KCBS-TV (Channel 2; LOS ANGELES, CA; Owner: CBS BROADCASTING INC.)
KHIZ (Channel 64; BARSTOW, CA; Owner: SUNBELT TELEVISION, INC.)
KTLA-TV (Channel 5; LOS ANGELES, CA; Owner: KTLA INC.)
KABC-TV (Channel 7; LOS ANGELES, CA; Owner: ABC HOLDING COMPANY, INC.)
KCAL-TV (Channel 9; LOS ANGELES, CA; Owner: VIACOM TELEVISION STATIONS GROUP OF LOS ANGELES LLC)
KNBC (Channel 4; LOS ANGELES, CA; Owner: NBC SUBSIDIARY (KNBC-TV), INC.)
KMEX-TV (Channel 34; LOS ANGELES, CA; Owner: KMEX LICENSE PARTNERSHIP, G.P.)
KAZA-TV (Channel 54; AVALON, CA; Owner: PAPPAS SOUTHERN CALIFORNIA LICENSE LLC)
KDOC-TV (Channel 56; ANAHEIM, CA; Owner: GOLDEN ORANGE BROADCASTING CO., INC.)
KOCE-TV (Channel 50; HUNTINGTON BEACH, CA; Owner: BD. OF TRUSTEES, COAST COMMUNITY COLLEGE DIST.)
KSCI (Channel 18; LONG BEACH, CA; Owner: KSLS, INC.)
National Bridge Inventory (NBI) Statistics 27 Number of bridges164ft / 50.1m Total length1,303,781 Total average daily traffic25,891 Total average daily truck traffic
New bridges - historical statistics
1 1910-1919 2 1930-1939 18 1960-1969 1 1970-1979 2 1990-1999 1 2000-2009 2 2010-2019
See full National Bridge Inventory statistics for Placentia, CA
Home Mortgage Disclosure Act Aggregated Statistics For Year 2009(Based on 6 full and 8 partial tracts) A) FHA, FSA/RHS & VA B) Conventional C) Refinancings D) Home Improvement Loans E) Loans on Dwellings For 5+ Families F) Non-occupant Loans on G) Loans On Manufactured Number Average Value Number Average Value Number Average Value Number Average Value Number Average Value Number Average Value Number Average Value
LOANS ORIGINATED 127 $361,663 252 $325,569 1,189 $309,605 54 $242,501 5 $5,299,720 69 $268,776 4 $93,468 APPLICATIONS APPROVED, NOT ACCEPTED 10 $413,271 35 $300,345 112 $339,525 8 $165,176 0 $0 12 $243,894 3 $101,607 APPLICATIONS DENIED 20 $413,314 51 $307,088 320 $354,776 15 $124,043 0 $0 27 $257,747 6 $81,697 APPLICATIONS WITHDRAWN 21 $351,196 59 $340,733 200 $346,360 9 $295,129 0 $0 20 $265,844 2 $85,010 FILES CLOSED FOR INCOMPLETENESS 8 $289,302 14 $316,018 83 $336,201 2 $223,500 0 $0 3 $276,570 1 $80,670
Aggregated Statistics For Year 2008(Based on 6 full and 8 partial tracts) A) FHA, FSA/RHS & VA B) Conventional C) Refinancings D) Home Improvement Loans E) Loans on Dwellings For 5+ Families F) Non-occupant Loans on G) Loans On Manufactured Number Average Value Number Average Value Number Average Value Number Average Value Number Average Value Number Average Value Number Average Value
LOANS ORIGINATED 56 $383,511 285 $325,535 501 $309,807 79 $179,159 6 $3,881,045 66 $302,030 15 $87,893 APPLICATIONS APPROVED, NOT ACCEPTED 6 $450,435 47 $261,106 118 $329,029 14 $78,329 0 $0 12 $241,597 18 $82,033 APPLICATIONS DENIED 20 $360,196 94 $280,481 272 $353,209 55 $186,723 0 $0 38 $298,934 10 $90,565 APPLICATIONS WITHDRAWN 15 $353,705 68 $282,736 103 $377,327 19 $200,316 1 $425,000 10 $280,203 1 $44,160 FILES CLOSED FOR INCOMPLETENESS 3 $393,370 9 $358,198 35 $420,405 5 $148,654 0 $0 2 $377,000 0 $0
Aggregated Statistics For Year 2007(Based on 6 full and 8 partial tracts) A) FHA, FSA/RHS & VA B) Conventional C) Refinancings D) Home Improvement Loans E) Loans on Dwellings For 5+ Families F) Non-occupant Loans on G) Loans On Manufactured Number Average Value Number Average Value Number Average Value Number Average Value Number Average Value Number Average Value Number Average Value
LOANS ORIGINATED 1 $417,000 403 $367,617 928 $331,134 156 $216,107 7 $2,110,834 89 $357,478 20 $106,725 APPLICATIONS APPROVED, NOT ACCEPTED 1 $127,000 99 $350,890 199 $362,504 26 $236,553 0 $0 24 $427,638 14 $92,753 APPLICATIONS DENIED 0 $0 121 $358,714 510 $394,563 92 $220,438 1 $500,000 57 $386,127 21 $118,897 APPLICATIONS WITHDRAWN 0 $0 73 $387,009 253 $368,238 20 $272,336 1 $500,000 23 $403,454 2 $118,190 FILES CLOSED FOR INCOMPLETENESS 0 $0 19 $457,466 107 $388,559 4 $330,272 0 $0 6 $381,302 0 $0
Aggregated Statistics For Year 2006(Based on 6 full and 8 partial tracts) B) Conventional C) Refinancings D) Home Improvement Loans E) Loans on Dwellings For 5+ Families F) Non-occupant Loans on G) Loans On Manufactured Number Average Value Number Average Value Number Average Value Number Average Value Number Average Value Number Average Value
LOANS ORIGINATED 781 $356,029 1,325 $341,327 219 $219,744 8 $1,033,356 132 $337,495 20 $72,096 APPLICATIONS APPROVED, NOT ACCEPTED 148 $316,130 251 $362,657 35 $188,193 0 $0 34 $314,528 18 $76,058 APPLICATIONS DENIED 249 $368,917 486 $388,574 96 $222,158 0 $0 56 $439,515 7 $73,666 APPLICATIONS WITHDRAWN 129 $331,926 345 $380,033 48 $226,716 1 $600,000 36 $432,502 4 $71,168 FILES CLOSED FOR INCOMPLETENESS 29 $357,246 104 $346,265 10 $333,627 0 $0 8 $432,146 1 $78,790
Aggregated Statistics For Year 2005(Based on 6 full and 8 partial tracts) A) FHA, FSA/RHS & VA B) Conventional C) Refinancings D) Home Improvement Loans E) Loans on Dwellings For 5+ Families F) Non-occupant Loans on G) Loans On Manufactured Number Average Value Number Average Value Number Average Value Number Average Value Number Average Value Number Average Value Number Average Value
LOANS ORIGINATED 0 $0 952 $349,847 1,565 $329,175 234 $185,500 10 $8,687,395 152 $310,848 11 $75,808 APPLICATIONS APPROVED, NOT ACCEPTED 0 $0 155 $314,098 239 $336,119 33 $175,137 0 $0 32 $323,729 19 $85,976 APPLICATIONS DENIED 1 $287,030 252 $308,117 502 $340,546 84 $171,496 1 $2,700,000 34 $362,684 36 $100,559 APPLICATIONS WITHDRAWN 0 $0 187 $357,982 536 $342,093 61 $256,736 1 $656,600 34 $324,494 6 $169,392 FILES CLOSED FOR INCOMPLETENESS 0 $0 48 $321,872 112 $358,238 11 $133,431 0 $0 9 $327,526 1 $308,000
Aggregated Statistics For Year 2004(Based on 6 full and 8 partial tracts) A) FHA, FSA/RHS & VA B) Conventional C) Refinancings D) Home Improvement Loans E) Loans on Dwellings For 5+ Families F) Non-occupant Loans on G) Loans On Manufactured Number Average Value Number Average Value Number Average Value Number Average Value Number Average Value Number Average Value Number Average Value
LOANS ORIGINATED 2 $243,500 895 $318,987 2,100 $280,664 248 $166,360 11 $1,668,094 169 $300,574 12 $77,660 APPLICATIONS APPROVED, NOT ACCEPTED 0 $0 167 $305,892 318 $280,091 30 $189,560 0 $0 35 $307,190 8 $71,218 APPLICATIONS DENIED 0 $0 168 $323,207 510 $293,478 100 $126,757 1 $335,170 44 $289,705 8 $89,779 APPLICATIONS WITHDRAWN 1 $355,210 123 $303,390 554 $290,284 64 $150,408 0 $0 26 $245,629 2 $90,515 FILES CLOSED FOR INCOMPLETENESS 0 $0 30 $351,238 117 $309,491 15 $102,572 0 $0 10 $314,259 0 $0
Aggregated Statistics For Year 2003(Based on 6 full and 8 partial tracts) A) FHA, FSA/RHS & VA B) Conventional C) Refinancings D) Home Improvement Loans E) Loans on Dwellings For 5+ Families F) Non-occupant Loans on Number Average Value Number Average Value Number Average Value Number Average Value Number Average Value Number Average Value
LOANS ORIGINATED 30 $226,091 1,126 $259,183 4,517 $226,457 100 $68,612 9 $3,052,213 284 $231,453 APPLICATIONS APPROVED, NOT ACCEPTED 4 $287,400 172 $245,165 567 $221,348 16 $90,746 0 $0 42 $251,693 APPLICATIONS DENIED 7 $136,399 148 $242,332 670 $234,899 49 $55,430 0 $0 59 $195,079 APPLICATIONS WITHDRAWN 1 $147,950 151 $301,423 758 $239,548 28 $81,951 0 $0 40 $232,142 FILES CLOSED FOR INCOMPLETENESS 0 $0 62 $283,357 132 $234,172 7 $150,786 0 $0 10 $153,070
Aggregated Statistics For Year 2002(Based on 5 full and 5 partial tracts) A) FHA, FSA/RHS & VA B) Conventional C) Refinancings D) Home Improvement Loans E) Loans on Dwellings For 5+ Families F) Non-occupant Loans on Number Average Value Number Average Value Number Average Value Number Average Value Number Average Value Number Average Value
LOANS ORIGINATED 27 $199,277 783 $232,709 2,457 $214,019 44 $61,830 7 $2,404,097 156 $200,297 APPLICATIONS APPROVED, NOT ACCEPTED 2 $287,870 90 $254,858 306 $215,324 15 $44,362 0 $0 23 $206,001 APPLICATIONS DENIED 4 $169,695 95 $244,195 360 $201,027 22 $21,995 2 $476,285 30 $215,666 APPLICATIONS WITHDRAWN 4 $195,165 113 $230,866 374 $237,916 19 $35,717 0 $0 13 $212,324 FILES CLOSED FOR INCOMPLETENESS 1 $144,200 40 $286,797 133 $232,048 0 $0 0 $0 4 $212,500
Aggregated Statistics For Year 2001(Based on 5 full and 5 partial tracts) A) FHA, FSA/RHS & VA B) Conventional C) Refinancings D) Home Improvement Loans E) Loans on Dwellings For 5+ Families F) Non-occupant Loans on Number Average Value Number Average Value Number Average Value Number Average Value Number Average Value Number Average Value
LOANS ORIGINATED 69 $190,989 820 $202,727 1,831 $193,594 96 $42,943 1 $1,020,070 106 $178,297 APPLICATIONS APPROVED, NOT ACCEPTED 3 $195,757 70 $202,845 246 $179,570 23 $40,853 0 $0 17 $143,544 APPLICATIONS DENIED 8 $140,138 141 $189,580 400 $187,777 59 $34,850 0 $0 20 $191,112 APPLICATIONS WITHDRAWN 13 $201,499 91 $189,078 372 $175,705 43 $51,387 0 $0 20 $148,772 FILES CLOSED FOR INCOMPLETENESS 2 $133,535 37 $228,771 94 $192,465 8 $22,644 0 $0 5 $228,584
Aggregated Statistics For Year 2000(Based on 5 full and 5 partial tracts) A) FHA, FSA/RHS & VA B) Conventional C) Refinancings D) Home Improvement Loans E) Loans on Dwellings For 5+ Families F) Non-occupant Loans on Number Average Value Number Average Value Number Average Value Number Average Value Number Average Value Number Average Value
LOANS ORIGINATED 54 $168,131 659 $177,998 402 $147,086 86 $36,031 4 $1,225,152 51 $122,560 APPLICATIONS APPROVED, NOT ACCEPTED 3 $160,180 94 $189,353 85 $135,045 35 $42,912 0 $0 17 $90,336 APPLICATIONS DENIED 8 $201,310 143 $161,763 221 $141,413 36 $32,804 3 $240,187 20 $101,063 APPLICATIONS WITHDRAWN 5 $158,936 79 $155,655 123 $136,479 13 $41,954 1 $600,000 8 $137,560 FILES CLOSED FOR INCOMPLETENESS 3 $115,420 29 $167,179 54 $166,416 2 $70,555 0 $0 4 $83,605
Aggregated Statistics For Year 1999(Based on 5 full and 8 partial tracts) A) FHA, FSA/RHS & VA B) Conventional C) Refinancings D) Home Improvement Loans E) Loans on Dwellings For 5+ Families F) Non-occupant Loans on Number Average Value Number Average Value Number Average Value Number Average Value Number Average Value Number Average Value
LOANS ORIGINATED 121 $159,377 791 $176,059 959 $154,764 88 $31,854 12 $443,605 111 $140,484 APPLICATIONS APPROVED, NOT ACCEPTED 5 $126,926 114 $187,923 177 $150,431 31 $30,184 0 $0 11 $127,235 APPLICATIONS DENIED 15 $143,275 201 $177,837 333 $141,956 52 $31,752 0 $0 25 $112,843 APPLICATIONS WITHDRAWN 12 $170,891 116 $172,813 241 $145,616 6 $27,027 3 $18,134,743 13 $130,194 FILES CLOSED FOR INCOMPLETENESS 2 $139,595 36 $166,861 79 $159,798 4 $27,415 0 $0 6 $160,327
Detailed mortgage data for all 14 tracts in Placentia, CA
Private Mortgage Insurance Companies Aggregated Statistics For Year 2009(Based on 6 full and 8 partial tracts) A) Conventional B) Refinancings Number Average Value Number Average Value
LOANS ORIGINATED 20 $329,436 13 $385,308 APPLICATIONS APPROVED, NOT ACCEPTED 11 $290,392 5 $466,252 APPLICATIONS DENIED 7 $313,634 1 $417,000 APPLICATIONS WITHDRAWN 3 $334,340 2 $332,075 FILES CLOSED FOR INCOMPLETENESS 3 $333,273 0 $0
Aggregated Statistics For Year 2008(Based on 6 full and 8 partial tracts) A) Conventional B) Refinancings C) Non-occupant Loans on Number Average Value Number Average Value Number Average Value
LOANS ORIGINATED 57 $382,722 11 $359,360 3 $275,753 APPLICATIONS APPROVED, NOT ACCEPTED 12 $404,621 10 $376,610 0 $0 APPLICATIONS DENIED 12 $301,903 4 $426,098 6 $269,360 APPLICATIONS WITHDRAWN 7 $297,766 3 $382,530 1 $247,000 FILES CLOSED FOR INCOMPLETENESS 2 $268,400 0 $0 0 $0
Aggregated Statistics For Year 2007(Based on 6 full and 8 partial tracts) A) Conventional B) Refinancings C) Non-occupant Loans on Number Average Value Number Average Value Number Average Value
LOANS ORIGINATED 19 $426,610 13 $472,989 2 $208,680 APPLICATIONS APPROVED, NOT ACCEPTED 1 $454,000 9 $489,421 0 $0 APPLICATIONS DENIED 3 $271,667 5 $521,172 3 $416,833 APPLICATIONS WITHDRAWN 3 $449,650 2 $539,320 1 $531,000 FILES CLOSED FOR INCOMPLETENESS 0 $0 0 $0 0 $0
Aggregated Statistics For Year 2006(Based on 6 full and 5 partial tracts) A) Conventional B) Refinancings C) Non-occupant Loans on D) Loans On Manufactured Number Average Value Number Average Value Number Average Value Number Average Value
LOANS ORIGINATED 5 $402,024 14 $424,463 1 $374,000 1 $510,000 APPLICATIONS APPROVED, NOT ACCEPTED 1 $416,470 7 $411,897 0 $0 0 $0 APPLICATIONS DENIED 0 $0 8 $499,526 2 $504,685 0 $0 APPLICATIONS WITHDRAWN 0 $0 4 $432,532 1 $346,130 0 $0 FILES CLOSED FOR INCOMPLETENESS 0 $0 0 $0 0 $0 0 $0
Aggregated Statistics For Year 2005(Based on 6 full and 7 partial tracts) A) Conventional B) Refinancings C) Non-occupant Loans on Number Average Value Number Average Value Number Average Value
LOANS ORIGINATED 9 $418,782 9 $371,842 1 $119,600 APPLICATIONS APPROVED, NOT ACCEPTED 4 $272,920 1 $438,860 0 $0 APPLICATIONS DENIED 0 $0 2 $460,000 0 $0 APPLICATIONS WITHDRAWN 1 $264,510 0 $0 1 $264,510 FILES CLOSED FOR INCOMPLETENESS 0 $0 0 $0 0 $0
Aggregated Statistics For Year 2004(Based on 6 full and 7 partial tracts) A) Conventional B) Refinancings C) Non-occupant Loans on Number Average Value Number Average Value Number Average Value
LOANS ORIGINATED 23 $315,938 9 $263,561 3 $219,233 APPLICATIONS APPROVED, NOT ACCEPTED 15 $291,479 6 $312,643 2 $250,460 APPLICATIONS DENIED 0 $0 1 $330,580 0 $0 APPLICATIONS WITHDRAWN 1 $200,680 1 $293,590 0 $0 FILES CLOSED FOR INCOMPLETENESS 0 $0 0 $0 0 $0
Aggregated Statistics For Year 2003(Based on 6 full and 8 partial tracts) A) Conventional B) Refinancings C) Non-occupant Loans on Number Average Value Number Average Value Number Average Value
LOANS ORIGINATED 60 $259,060 63 $254,615 1 $259,780 APPLICATIONS APPROVED, NOT ACCEPTED 16 $294,622 40 $243,001 3 $197,820 APPLICATIONS DENIED 1 $336,740 0 $0 0 $0 APPLICATIONS WITHDRAWN 1 $187,050 6 $279,377 1 $199,000 FILES CLOSED FOR INCOMPLETENESS 0 $0 0 $0 0 $0
Aggregated Statistics For Year 2002(Based on 5 full and 5 partial tracts) A) Conventional B) Refinancings C) Non-occupant Loans on Number Average Value Number Average Value Number Average Value
LOANS ORIGINATED 64 $246,130 42 $257,296 2 $168,685 APPLICATIONS APPROVED, NOT ACCEPTED 24 $217,569 26 $272,572 2 $106,665 APPLICATIONS DENIED 1 $632,000 2 $220,750 0 $0 APPLICATIONS WITHDRAWN 6 $254,603 5 $280,536 1 $260,000 FILES CLOSED FOR INCOMPLETENESS 1 $116,000 2 $217,250 0 $0
Aggregated Statistics For Year 2001(Based on 5 full and 5 partial tracts) A) Conventional B) Refinancings C) Non-occupant Loans on Number Average Value Number Average Value Number Average Value
LOANS ORIGINATED 106 $216,391 59 $244,052 4 $136,835 APPLICATIONS APPROVED, NOT ACCEPTED 20 $219,828 15 $249,818 1 $84,000 APPLICATIONS DENIED 6 $243,828 5 $323,474 1 $216,000 APPLICATIONS WITHDRAWN 3 $298,553 2 $189,750 0 $0 FILES CLOSED FOR INCOMPLETENESS 1 $164,000 0 $0 0 $0
Aggregated Statistics For Year 2000(Based on 5 full and 5 partial tracts) A) Conventional B) Refinancings C) Non-occupant Loans on Number Average Value Number Average Value Number Average Value
LOANS ORIGINATED 95 $219,514 29 $242,267 5 $155,520 APPLICATIONS APPROVED, NOT ACCEPTED 23 $215,360 4 $219,938 1 $114,290 APPLICATIONS DENIED 10 $191,708 2 $243,415 0 $0 APPLICATIONS WITHDRAWN 2 $70,000 3 $241,943 0 $0 FILES CLOSED FOR INCOMPLETENESS 3 $136,333 1 $187,000 0 $0
Aggregated Statistics For Year 1999(Based on 5 full and 8 partial tracts) A) Conventional B) Refinancings C) Non-occupant Loans on Number Average Value Number Average Value Number Average Value
LOANS ORIGINATED 168 $208,332 82 $186,633 3 $114,580 APPLICATIONS APPROVED, NOT ACCEPTED 21 $200,365 38 $194,651 2 $169,490 APPLICATIONS DENIED 16 $194,156 5 $264,224 1 $206,000 APPLICATIONS WITHDRAWN 9 $178,974 3 $189,920 0 $0 FILES CLOSED FOR INCOMPLETENESS 6 $167,443 2 $170,705 0 $0
Fire-safe hotels and motels in Placentia, California:
Holiday Inn, 118 E Orangethorpe Ave, Placentia, California 92670 Phone: (714) 528-7778
Quality Inn Placentia, 710 W Kimberly Ave, Placentia, California 92870 Phone: (714) 996-4410, Fax: (714) 996-0586
Residence Inn Anaheim/Placentia/Fullerton, 700 W Kimberly Ave, Placentia, California 92670 Phone: (714) 996-0555
All 3 fire-safe hotels and motels in Placentia, California
Most common first names in Placentia, CA among deceased individuals Name Count Lived (average)
Mary 68 85.2 years Robert 60 74.3 years John 52 78.5 years James 48 77.2 years William 46 77.2 years Helen 39 82.9 years Joseph 39 83.1 years Margaret 38 83.6 years Richard 38 72.6 years Dorothy 34 84.2 years
Most common last names in Placentia, CA among deceased individuals Last name Count Lived (average)
Smith 32 78.2 years Jones 18 76.3 years Johnson 15 84.5 years Williams 14 75.4 years Martinez 14 82.7 years Brown 14 82.1 years Rodriguez 14 78.3 years Miller 11 78.1 years Garcia 10 78.1 years Nguyen 10 72.4 years
Placentia compared to California state average:
Unemployed percentage significantly below state average. Black race population percentage below state average. Length of stay since moving in significantly above state average. Percentage of population with a bachelor's degree or higher above state average.
#4 on the list of "Top 101 cities with the lowest average snowfall in a year (population 50,000+)"
#11 on the list of "Top 101 cities with largest percentage of males in industries: broadcasting, internet publishing, and telecommunications services (population 50,000+)"
#11 on the list of "Top 101 cities with largest percentage of females in industries: broadcasting, internet publishing, and telecommunications services (population 50,000+)"
#11 on the list of "Top 101 cities with largest percentage of males in industries: wholesale electronic markets and agents and brokers (population 50,000+)"
#11 on the list of "Top 101 cities with largest percentage of females in industries: wholesale electronic markets and agents and brokers (population 50,000+)"
#29 on the list of "Top 101 cities with the lowest number of police officers per 1000 residents (population 50,000+)"
#31 on the list of "Top 101 cities with largest percentage of males in occupations: architecture and engineering occupations (population 50,000+)"
#47 on the list of "Top 101 cities with largest percentage of females in occupations: material moving occupations (population 50,000+)"
#55 on the list of "Top 100 safest cities (lowest city-data.com crime index) (pop. 50,000+)"
#65 on the list of "Top 101 cities with the lowest number of rapes per 100,000 residents (population 50,000+)"
#65 on the list of "Top 101 cities with the lowest average yearly precipitation (population 50,000+)"
#69 on the list of "Top 101 cities with largest percentage of females in industries: manufacturing (population 50,000+)"
#72 on the list of "Top 101 cities with the lowest number of thefts per 100,000 residents (population 50,000+)"
#77 on the list of "Top 101 cities with largest percentage of females in industries: management of companies and enterprises (population 50,000+)"
#78 on the list of "Top 100 cities with highest median house value (pop. 50,000+)"
#81 on the list of "Top 101 cities with the lowest number of arson incidents per 100,000 residents (population 50,000+)"
#91 on the list of "Top 101 cities with the largest city-data.com crime index increase from 2011 to 2012 (population 50,000+)"
#4 on the list of "Top 101 counties with the highest total withdrawal of fresh water for public supply"
#5 on the list of "Top 101 counties with the most Catholic adherents"
#6 on the list of "Top 101 counties with the highest ground withdrawal of fresh water for public supply"
#7 on the list of "Top 101 counties with the most Evangelical Protestant adherents"
#8 on the list of "Top 101 counties with the highest Particulate Matter (PM2.5 ) Annual air pollution readings in 2012 (µg/m3 )"
Top Patent Applicants
Phong X. Nguyen (42)
Stephen E. Hannah (30)
Mayssa Attar (25)
Qiao Lu (16)
Peter Bolin (14)
Peter Regla (10)
Steve Lanping Huang (9)
Murrad Kazalbash (7)
Nidish Ramachandra Kamath (7)
John C. Mckay (7)
Total of 468 patent applications in 2008-2024.

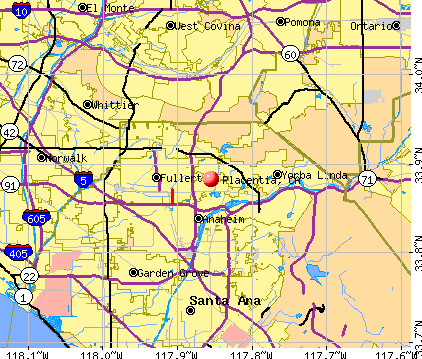


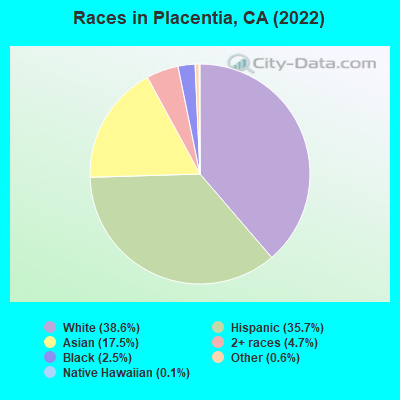
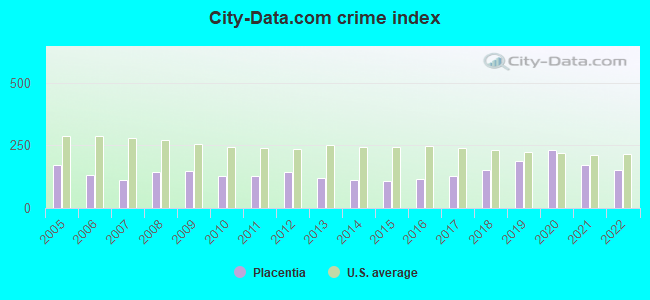
 Recent articles from our blog. Our writers, many of them Ph.D. graduates or candidates, create easy-to-read articles on a wide variety of topics.

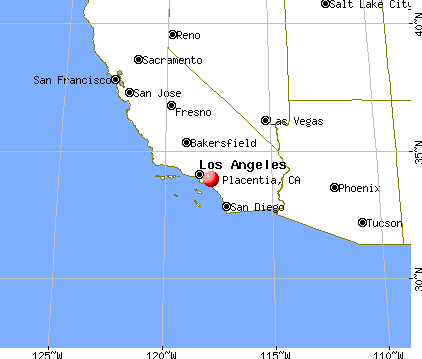
 (3.8 miles
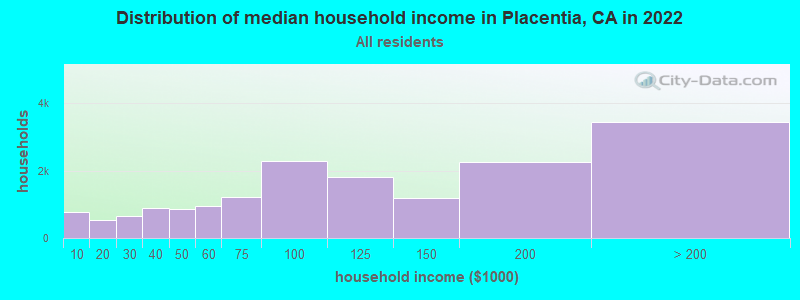
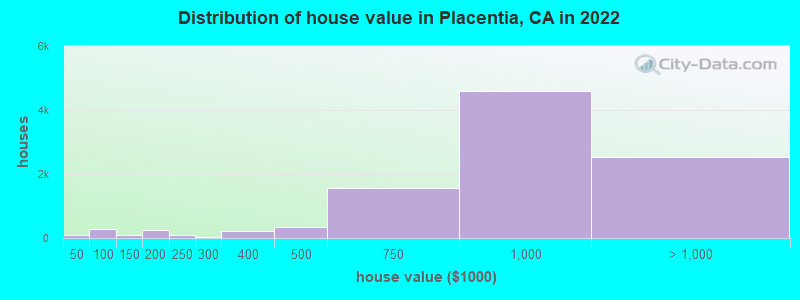
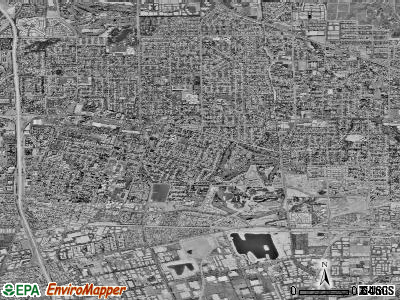
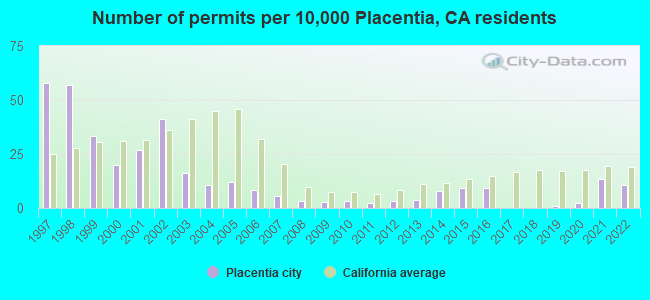
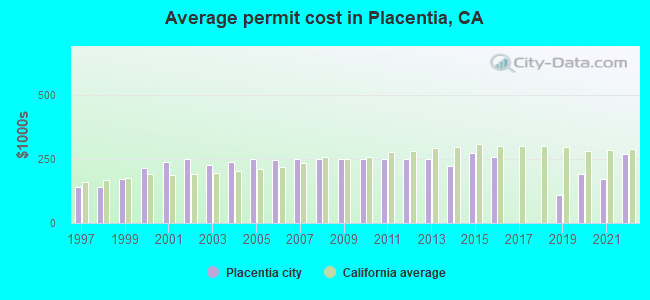
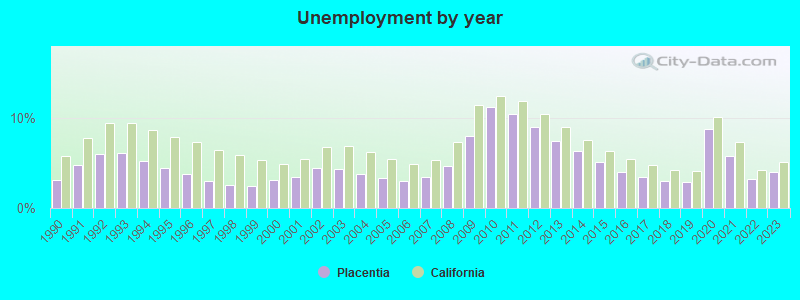
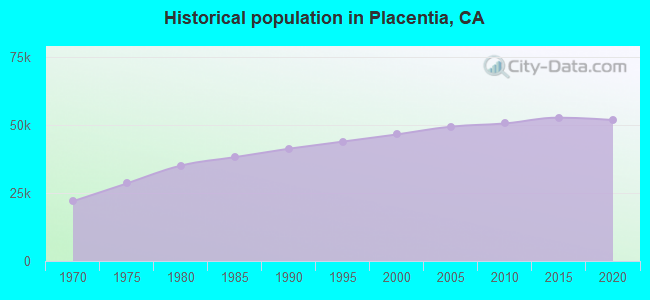
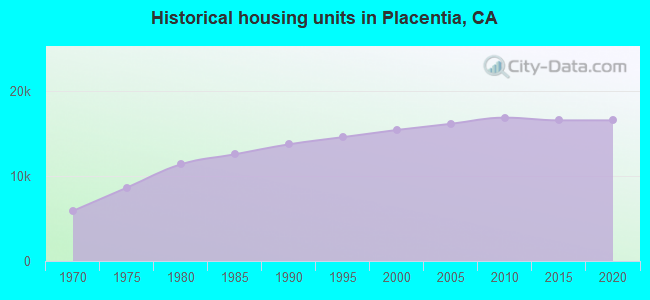
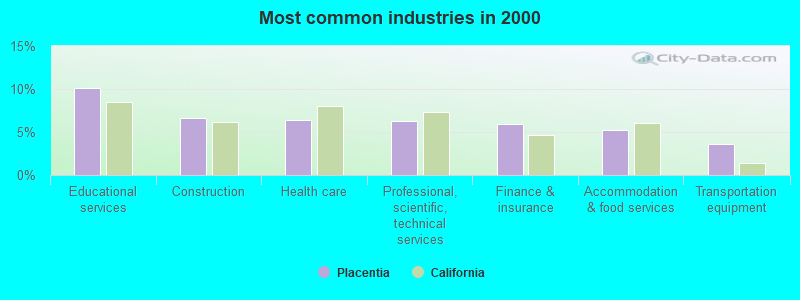
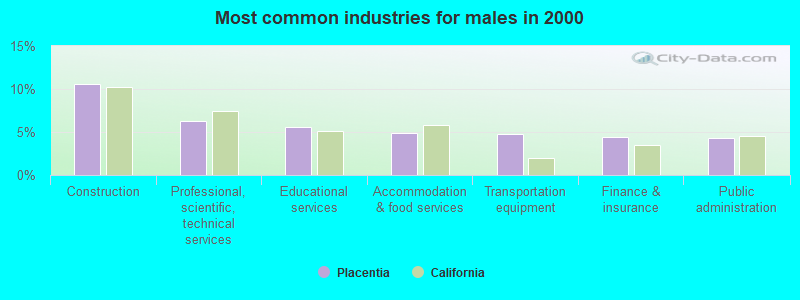
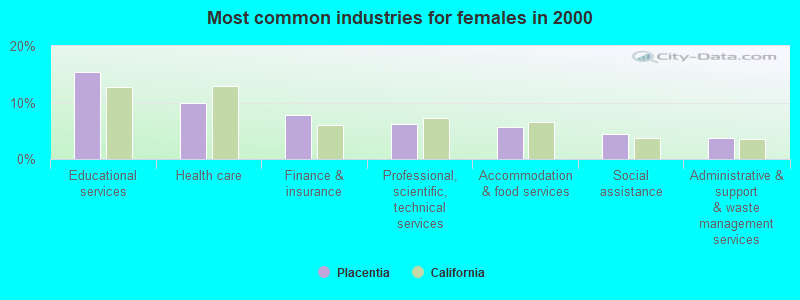
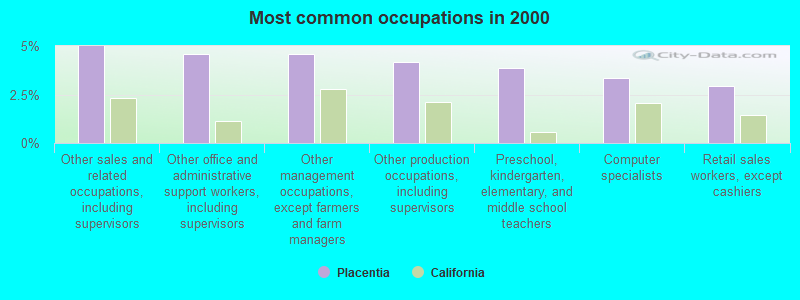
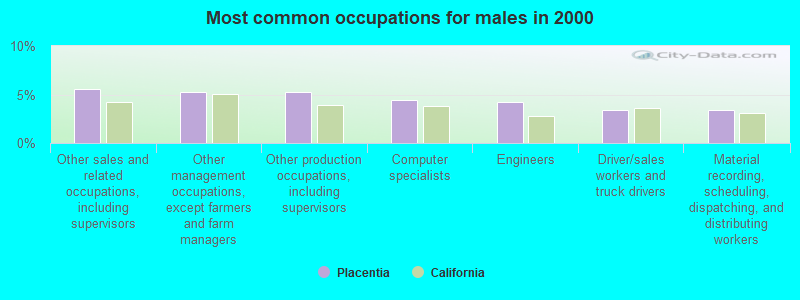
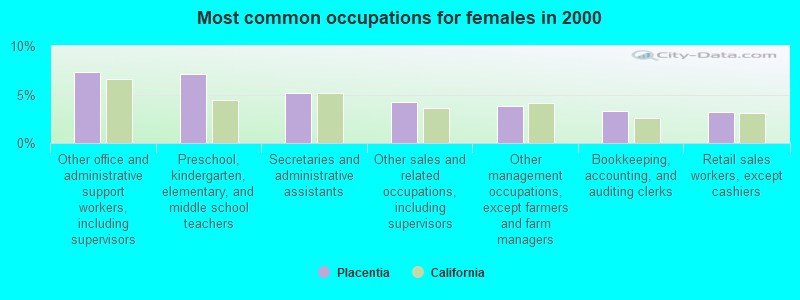
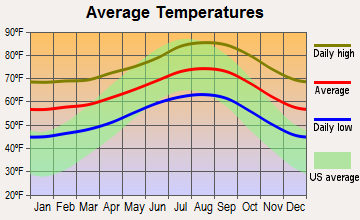
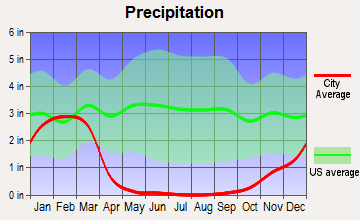
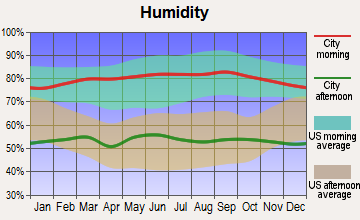
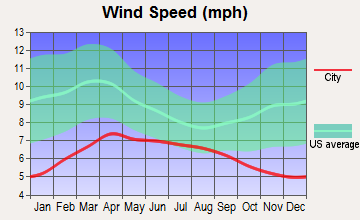
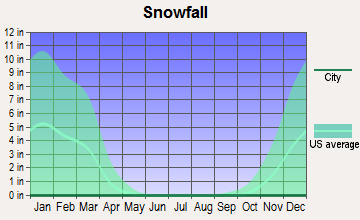
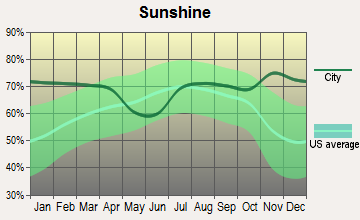
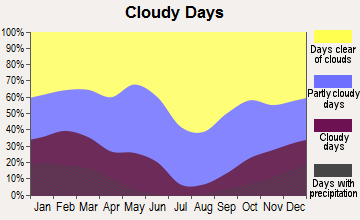
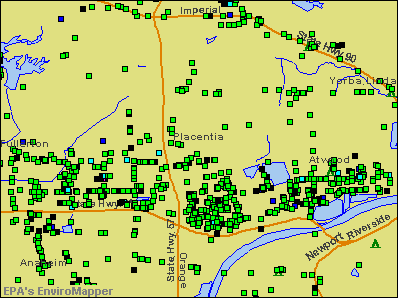

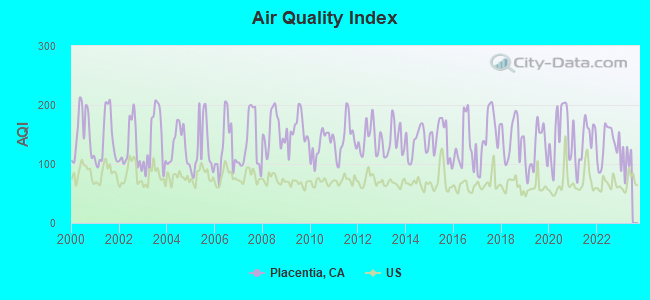
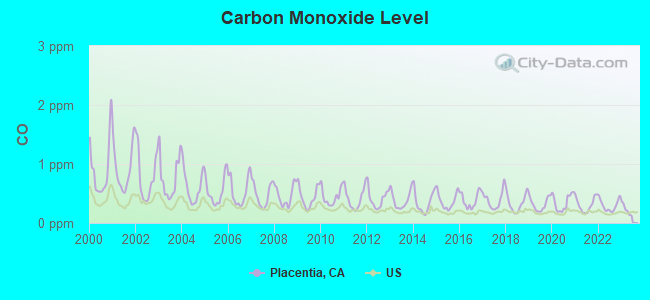

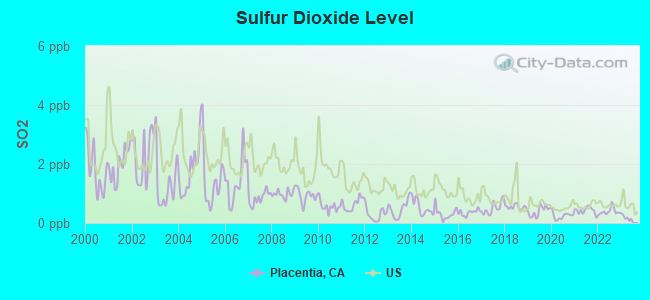
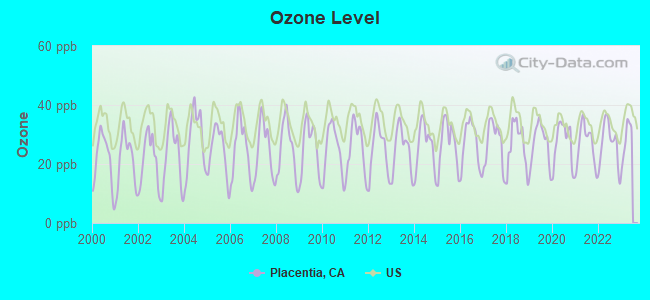
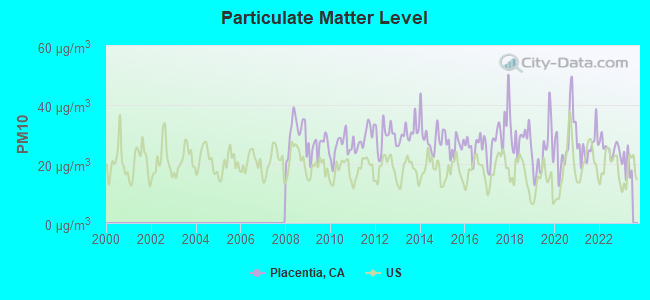
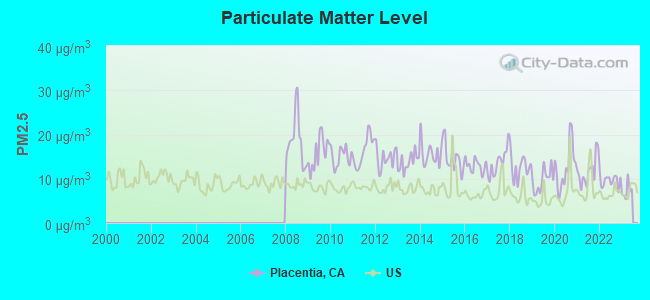
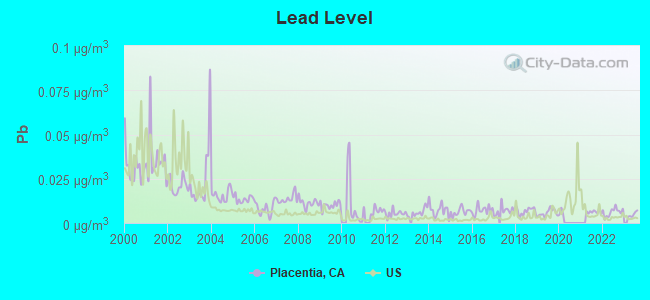
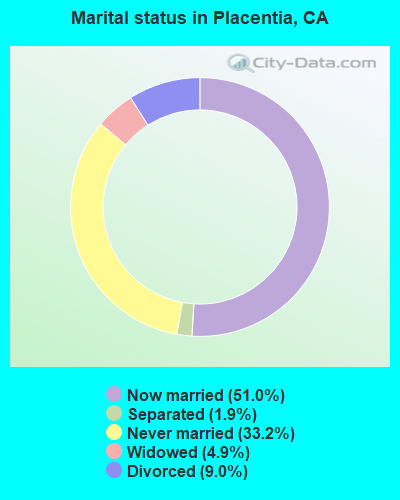
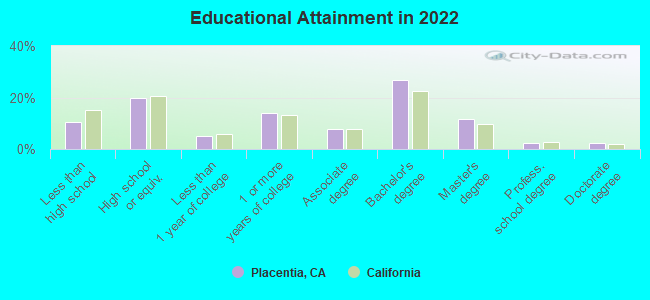
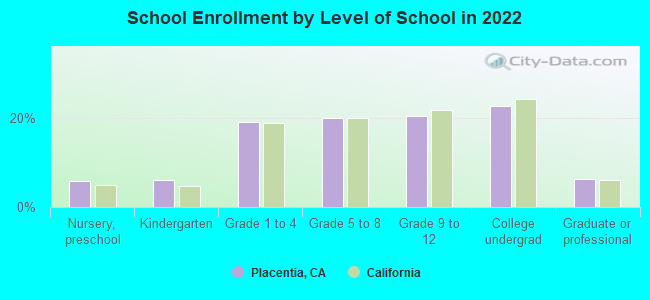
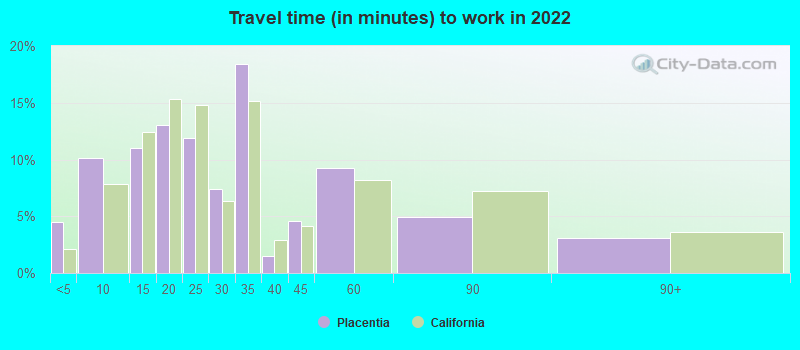
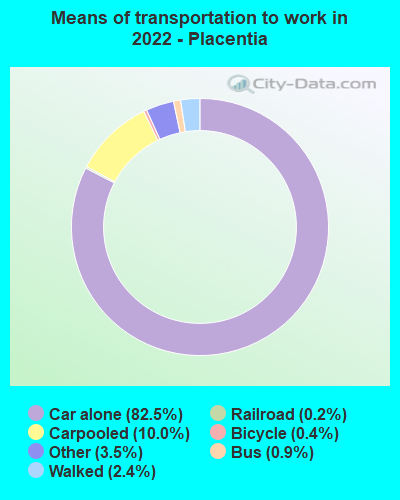


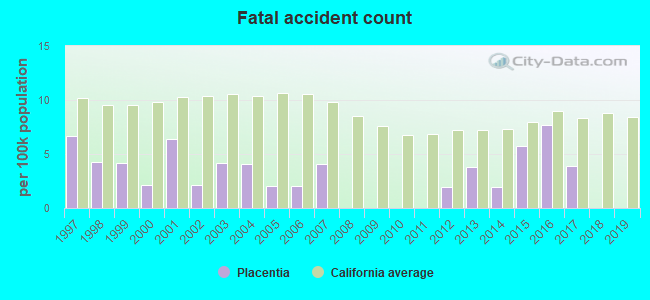
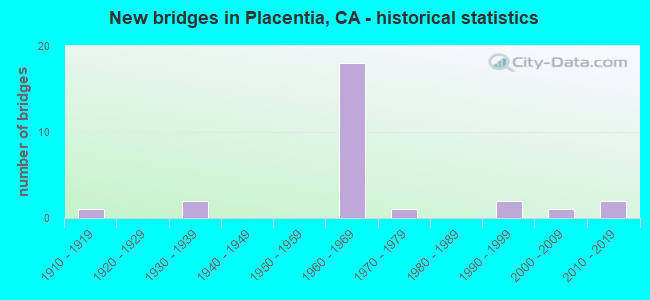
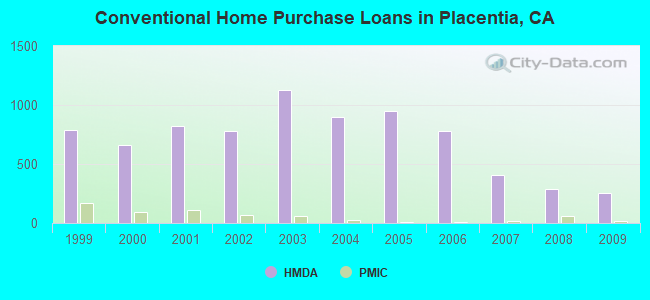
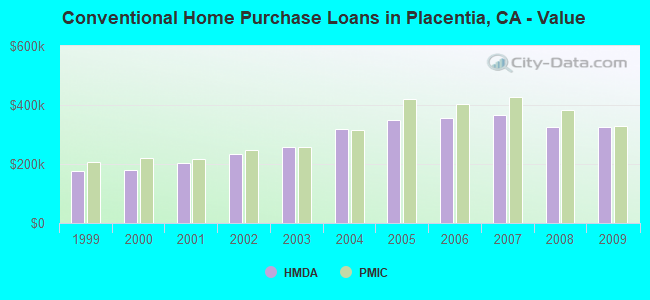
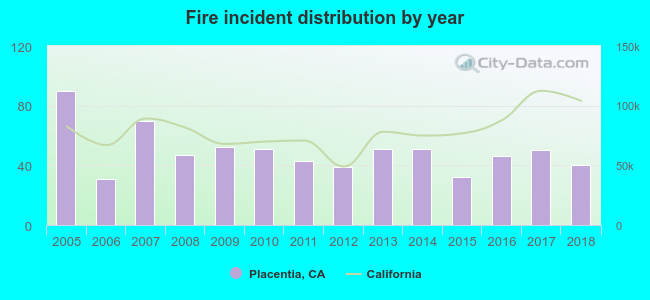 According to the data from the years 2005 - 2018 the average number of fire incidents per year is 50. The highest number of fires - 90 took place in 2005, and the least - 31 in 2006. The data has a dropping trend.
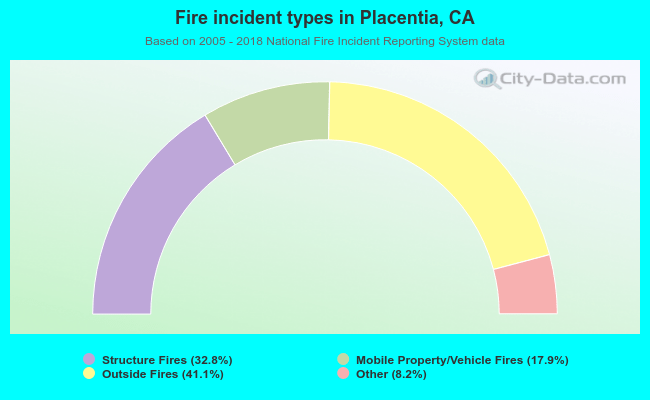 When looking into fire subcategories, the most reports belonged to: Outside Fires (41.1%), and Structure Fires (32.8%).