Orange, California Submit your own pictures of this city and show them to the world
OSM Map
General Map
Google Map
MSN Map
OSM Map
General Map
Google Map
MSN Map
OSM Map
General Map
Google Map
MSN Map
OSM Map
General Map
Google Map
MSN Map
Please wait while loading the map...
Population in 2022: 136,178 (100% urban, 0% rural). Population change since 2000: +5.7%Males: 72,147 Females: 64,031
March 2022 cost of living index in Orange: 88.3 (less than average, U.S. average is 100) Percentage of residents living in poverty in 2022: 7.8%for White Non-Hispanic residents , 7.1% for Black residents , 8.6% for Hispanic or Latino residents , 14.7% for American Indian residents , 3.2% for Native Hawaiian and other Pacific Islander residents , 12.8% for other race residents , 7.2% for two or more races residents )
Profiles of local businesses
Business Search - 14 Million verified businesses
Data:
Median household income ($)
Median household income (% change since 2000)
Household income diversity
Ratio of average income to average house value (%)
Ratio of average income to average rent
Median household income ($) - White
Median household income ($) - Black or African American
Median household income ($) - Asian
Median household income ($) - Hispanic or Latino
Median household income ($) - American Indian and Alaska Native
Median household income ($) - Multirace
Median household income ($) - Other Race
Median household income for houses/condos with a mortgage ($)
Median household income for apartments without a mortgage ($)
Races - White alone (%)
Races - White alone (% change since 2000)
Races - Black alone (%)
Races - Black alone (% change since 2000)
Races - American Indian alone (%)
Races - American Indian alone (% change since 2000)
Races - Asian alone (%)
Races - Asian alone (% change since 2000)
Races - Hispanic (%)
Races - Hispanic (% change since 2000)
Races - Native Hawaiian and Other Pacific Islander alone (%)
Races - Native Hawaiian and Other Pacific Islander alone (% change since 2000)
Races - Two or more races (%)
Races - Two or more races (% change since 2000)
Races - Other race alone (%)
Races - Other race alone (% change since 2000)
Racial diversity
Unemployment (%)
Unemployment (% change since 2000)
Unemployment (%) - White
Unemployment (%) - Black or African American
Unemployment (%) - Asian
Unemployment (%) - Hispanic or Latino
Unemployment (%) - American Indian and Alaska Native
Unemployment (%) - Multirace
Unemployment (%) - Other Race
Population density (people per square mile)
Population - Males (%)
Population - Females (%)
Population - Males (%) - White
Population - Males (%) - Black or African American
Population - Males (%) - Asian
Population - Males (%) - Hispanic or Latino
Population - Males (%) - American Indian and Alaska Native
Population - Males (%) - Multirace
Population - Males (%) - Other Race
Population - Females (%) - White
Population - Females (%) - Black or African American
Population - Females (%) - Asian
Population - Females (%) - Hispanic or Latino
Population - Females (%) - American Indian and Alaska Native
Population - Females (%) - Multirace
Population - Females (%) - Other Race
Coronavirus confirmed cases (Apr 27, 2024)
Deaths caused by coronavirus (Apr 27, 2024)
Coronavirus confirmed cases (per 100k population) (Apr 27, 2024)
Deaths caused by coronavirus (per 100k population) (Apr 27, 2024)
Daily increase in number of cases (Apr 27, 2024)
Weekly increase in number of cases (Apr 27, 2024)
Cases doubled (in days) (Apr 27, 2024)
Hospitalized patients (Apr 18, 2022)
Negative test results (Apr 18, 2022)
Total test results (Apr 18, 2022)
COVID Vaccine doses distributed (per 100k population) (Sep 19, 2023)
COVID Vaccine doses administered (per 100k population) (Sep 19, 2023)
COVID Vaccine doses distributed (Sep 19, 2023)
COVID Vaccine doses administered (Sep 19, 2023)
Likely homosexual households (%)
Likely homosexual households (% change since 2000)
Likely homosexual households - Lesbian couples (%)
Likely homosexual households - Lesbian couples (% change since 2000)
Likely homosexual households - Gay men (%)
Likely homosexual households - Gay men (% change since 2000)
Cost of living index
Median gross rent ($)
Median contract rent ($)
Median monthly housing costs ($)
Median house or condo value ($)
Median house or condo value ($ change since 2000)
Mean house or condo value by units in structure - 1, detached ($)
Mean house or condo value by units in structure - 1, attached ($)
Mean house or condo value by units in structure - 2 ($)
Mean house or condo value by units in structure by units in structure - 3 or 4 ($)
Mean house or condo value by units in structure - 5 or more ($)
Mean house or condo value by units in structure - Boat, RV, van, etc. ($)
Mean house or condo value by units in structure - Mobile home ($)
Median house or condo value ($) - White
Median house or condo value ($) - Black or African American
Median house or condo value ($) - Asian
Median house or condo value ($) - Hispanic or Latino
Median house or condo value ($) - American Indian and Alaska Native
Median house or condo value ($) - Multirace
Median house or condo value ($) - Other Race
Median resident age
Resident age diversity
Median resident age - Males
Median resident age - Females
Median resident age - White
Median resident age - Black or African American
Median resident age - Asian
Median resident age - Hispanic or Latino
Median resident age - American Indian and Alaska Native
Median resident age - Multirace
Median resident age - Other Race
Median resident age - Males - White
Median resident age - Males - Black or African American
Median resident age - Males - Asian
Median resident age - Males - Hispanic or Latino
Median resident age - Males - American Indian and Alaska Native
Median resident age - Males - Multirace
Median resident age - Males - Other Race
Median resident age - Females - White
Median resident age - Females - Black or African American
Median resident age - Females - Asian
Median resident age - Females - Hispanic or Latino
Median resident age - Females - American Indian and Alaska Native
Median resident age - Females - Multirace
Median resident age - Females - Other Race
Commute - mean travel time to work (minutes)
Travel time to work - Less than 5 minutes (%)
Travel time to work - Less than 5 minutes (% change since 2000)
Travel time to work - 5 to 9 minutes (%)
Travel time to work - 5 to 9 minutes (% change since 2000)
Travel time to work - 10 to 19 minutes (%)
Travel time to work - 10 to 19 minutes (% change since 2000)
Travel time to work - 20 to 29 minutes (%)
Travel time to work - 20 to 29 minutes (% change since 2000)
Travel time to work - 30 to 39 minutes (%)
Travel time to work - 30 to 39 minutes (% change since 2000)
Travel time to work - 40 to 59 minutes (%)
Travel time to work - 40 to 59 minutes (% change since 2000)
Travel time to work - 60 to 89 minutes (%)
Travel time to work - 60 to 89 minutes (% change since 2000)
Travel time to work - 90 or more minutes (%)
Travel time to work - 90 or more minutes (% change since 2000)
Marital status - Never married (%)
Marital status - Now married (%)
Marital status - Separated (%)
Marital status - Widowed (%)
Marital status - Divorced (%)
Median family income ($)
Median family income (% change since 2000)
Median non-family income ($)
Median non-family income (% change since 2000)
Median per capita income ($)
Median per capita income (% change since 2000)
Median family income ($) - White
Median family income ($) - Black or African American
Median family income ($) - Asian
Median family income ($) - Hispanic or Latino
Median family income ($) - American Indian and Alaska Native
Median family income ($) - Multirace
Median family income ($) - Other Race
Median year house/condo built
Median year apartment built
Year house built - Built 2005 or later (%)
Year house built - Built 2000 to 2004 (%)
Year house built - Built 1990 to 1999 (%)
Year house built - Built 1980 to 1989 (%)
Year house built - Built 1970 to 1979 (%)
Year house built - Built 1960 to 1969 (%)
Year house built - Built 1950 to 1959 (%)
Year house built - Built 1940 to 1949 (%)
Year house built - Built 1939 or earlier (%)
Average household size
Household density (households per square mile)
Average household size - White
Average household size - Black or African American
Average household size - Asian
Average household size - Hispanic or Latino
Average household size - American Indian and Alaska Native
Average household size - Multirace
Average household size - Other Race
Occupied housing units (%)
Vacant housing units (%)
Owner occupied housing units (%)
Renter occupied housing units (%)
Vacancy status - For rent (%)
Vacancy status - For sale only (%)
Vacancy status - Rented or sold, not occupied (%)
Vacancy status - For seasonal, recreational, or occasional use (%)
Vacancy status - For migrant workers (%)
Vacancy status - Other vacant (%)
Residents with income below the poverty level (%)
Residents with income below 50% of the poverty level (%)
Children below poverty level (%)
Poor families by family type - Married-couple family (%)
Poor families by family type - Male, no wife present (%)
Poor families by family type - Female, no husband present (%)
Poverty status for native-born residents (%)
Poverty status for foreign-born residents (%)
Poverty among high school graduates not in families (%)
Poverty among people who did not graduate high school not in families (%)
Residents with income below the poverty level (%) - White
Residents with income below the poverty level (%) - Black or African American
Residents with income below the poverty level (%) - Asian
Residents with income below the poverty level (%) - Hispanic or Latino
Residents with income below the poverty level (%) - American Indian and Alaska Native
Residents with income below the poverty level (%) - Multirace
Residents with income below the poverty level (%) - Other Race
Air pollution - Air Quality Index (AQI)
Air pollution - CO
Air pollution - NO2
Air pollution - SO2
Air pollution - Ozone
Air pollution - PM10
Air pollution - PM25
Air pollution - Pb
Crime - Murders per 100,000 population
Crime - Rapes per 100,000 population
Crime - Robberies per 100,000 population
Crime - Assaults per 100,000 population
Crime - Burglaries per 100,000 population
Crime - Thefts per 100,000 population
Crime - Auto thefts per 100,000 population
Crime - Arson per 100,000 population
Crime - City-data.com crime index
Crime - Violent crime index
Crime - Property crime index
Crime - Murders per 100,000 population (5 year average)
Crime - Rapes per 100,000 population (5 year average)
Crime - Robberies per 100,000 population (5 year average)
Crime - Assaults per 100,000 population (5 year average)
Crime - Burglaries per 100,000 population (5 year average)
Crime - Thefts per 100,000 population (5 year average)
Crime - Auto thefts per 100,000 population (5 year average)
Crime - Arson per 100,000 population (5 year average)
Crime - City-data.com crime index (5 year average)
Crime - Violent crime index (5 year average)
Crime - Property crime index (5 year average)
1996 Presidential Elections Results (%) - Democratic Party (Clinton)
1996 Presidential Elections Results (%) - Republican Party (Dole)
1996 Presidential Elections Results (%) - Other
2000 Presidential Elections Results (%) - Democratic Party (Gore)
2000 Presidential Elections Results (%) - Republican Party (Bush)
2000 Presidential Elections Results (%) - Other
2004 Presidential Elections Results (%) - Democratic Party (Kerry)
2004 Presidential Elections Results (%) - Republican Party (Bush)
2004 Presidential Elections Results (%) - Other
2008 Presidential Elections Results (%) - Democratic Party (Obama)
2008 Presidential Elections Results (%) - Republican Party (McCain)
2008 Presidential Elections Results (%) - Other
2012 Presidential Elections Results (%) - Democratic Party (Obama)
2012 Presidential Elections Results (%) - Republican Party (Romney)
2012 Presidential Elections Results (%) - Other
2016 Presidential Elections Results (%) - Democratic Party (Clinton)
2016 Presidential Elections Results (%) - Republican Party (Trump)
2016 Presidential Elections Results (%) - Other
2020 Presidential Elections Results (%) - Democratic Party (Biden)
2020 Presidential Elections Results (%) - Republican Party (Trump)
2020 Presidential Elections Results (%) - Other
Ancestries Reported - Arab (%)
Ancestries Reported - Czech (%)
Ancestries Reported - Danish (%)
Ancestries Reported - Dutch (%)
Ancestries Reported - English (%)
Ancestries Reported - French (%)
Ancestries Reported - French Canadian (%)
Ancestries Reported - German (%)
Ancestries Reported - Greek (%)
Ancestries Reported - Hungarian (%)
Ancestries Reported - Irish (%)
Ancestries Reported - Italian (%)
Ancestries Reported - Lithuanian (%)
Ancestries Reported - Norwegian (%)
Ancestries Reported - Polish (%)
Ancestries Reported - Portuguese (%)
Ancestries Reported - Russian (%)
Ancestries Reported - Scotch-Irish (%)
Ancestries Reported - Scottish (%)
Ancestries Reported - Slovak (%)
Ancestries Reported - Subsaharan African (%)
Ancestries Reported - Swedish (%)
Ancestries Reported - Swiss (%)
Ancestries Reported - Ukrainian (%)
Ancestries Reported - United States (%)
Ancestries Reported - Welsh (%)
Ancestries Reported - West Indian (%)
Ancestries Reported - Other (%)
Educational Attainment - No schooling completed (%)
Educational Attainment - Less than high school (%)
Educational Attainment - High school or equivalent (%)
Educational Attainment - Less than 1 year of college (%)
Educational Attainment - 1 or more years of college (%)
Educational Attainment - Associate degree (%)
Educational Attainment - Bachelor's degree (%)
Educational Attainment - Master's degree (%)
Educational Attainment - Professional school degree (%)
Educational Attainment - Doctorate degree (%)
School Enrollment - Nursery, preschool (%)
School Enrollment - Kindergarten (%)
School Enrollment - Grade 1 to 4 (%)
School Enrollment - Grade 5 to 8 (%)
School Enrollment - Grade 9 to 12 (%)
School Enrollment - College undergrad (%)
School Enrollment - Graduate or professional (%)
School Enrollment - Not enrolled in school (%)
School enrollment - Public schools (%)
School enrollment - Private schools (%)
School enrollment - Not enrolled (%)
Median number of rooms in houses and condos
Median number of rooms in apartments
Housing units lacking complete plumbing facilities (%)
Housing units lacking complete kitchen facilities (%)
Density of houses
Urban houses (%)
Rural houses (%)
Households with people 60 years and over (%)
Households with people 65 years and over (%)
Households with people 75 years and over (%)
Households with one or more nonrelatives (%)
Households with no nonrelatives (%)
Population in households (%)
Family households (%)
Nonfamily households (%)
Population in families (%)
Family households with own children (%)
Median number of bedrooms in owner occupied houses
Mean number of bedrooms in owner occupied houses
Median number of bedrooms in renter occupied houses
Mean number of bedrooms in renter occupied houses
Median number of vehichles in owner occupied houses
Mean number of vehichles in owner occupied houses
Median number of vehichles in renter occupied houses
Mean number of vehichles in renter occupied houses
Mortgage status - with mortgage (%)
Mortgage status - with second mortgage (%)
Mortgage status - with home equity loan (%)
Mortgage status - with both second mortgage and home equity loan (%)
Mortgage status - without a mortgage (%)
Average family size
Average family size - White
Average family size - Black or African American
Average family size - Asian
Average family size - Hispanic or Latino
Average family size - American Indian and Alaska Native
Average family size - Multirace
Average family size - Other Race
Geographical mobility - Same house 1 year ago (%)
Geographical mobility - Moved within same county (%)
Geographical mobility - Moved from different county within same state (%)
Geographical mobility - Moved from different state (%)
Geographical mobility - Moved from abroad (%)
Place of birth - Born in state of residence (%)
Place of birth - Born in other state (%)
Place of birth - Native, outside of US (%)
Place of birth - Foreign born (%)
Housing units in structures - 1, detached (%)
Housing units in structures - 1, attached (%)
Housing units in structures - 2 (%)
Housing units in structures - 3 or 4 (%)
Housing units in structures - 5 to 9 (%)
Housing units in structures - 10 to 19 (%)
Housing units in structures - 20 to 49 (%)
Housing units in structures - 50 or more (%)
Housing units in structures - Mobile home (%)
Housing units in structures - Boat, RV, van, etc. (%)
House/condo owner moved in on average (years ago)
Renter moved in on average (years ago)
Year householder moved into unit - Moved in 1999 to March 2000 (%)
Year householder moved into unit - Moved in 1995 to 1998 (%)
Year householder moved into unit - Moved in 1990 to 1994 (%)
Year householder moved into unit - Moved in 1980 to 1989 (%)
Year householder moved into unit - Moved in 1970 to 1979 (%)
Year householder moved into unit - Moved in 1969 or earlier (%)
Means of transportation to work - Drove car alone (%)
Means of transportation to work - Carpooled (%)
Means of transportation to work - Public transportation (%)
Means of transportation to work - Bus or trolley bus (%)
Means of transportation to work - Streetcar or trolley car (%)
Means of transportation to work - Subway or elevated (%)
Means of transportation to work - Railroad (%)
Means of transportation to work - Ferryboat (%)
Means of transportation to work - Taxicab (%)
Means of transportation to work - Motorcycle (%)
Means of transportation to work - Bicycle (%)
Means of transportation to work - Walked (%)
Means of transportation to work - Other means (%)
Working at home (%)
Industry diversity
Most Common Industries - Agriculture, forestry, fishing and hunting, and mining (%)
Most Common Industries - Agriculture, forestry, fishing and hunting (%)
Most Common Industries - Mining, quarrying, and oil and gas extraction (%)
Most Common Industries - Construction (%)
Most Common Industries - Manufacturing (%)
Most Common Industries - Wholesale trade (%)
Most Common Industries - Retail trade (%)
Most Common Industries - Transportation and warehousing, and utilities (%)
Most Common Industries - Transportation and warehousing (%)
Most Common Industries - Utilities (%)
Most Common Industries - Information (%)
Most Common Industries - Finance and insurance, and real estate and rental and leasing (%)
Most Common Industries - Finance and insurance (%)
Most Common Industries - Real estate and rental and leasing (%)
Most Common Industries - Professional, scientific, and management, and administrative and waste management services (%)
Most Common Industries - Professional, scientific, and technical services (%)
Most Common Industries - Management of companies and enterprises (%)
Most Common Industries - Administrative and support and waste management services (%)
Most Common Industries - Educational services, and health care and social assistance (%)
Most Common Industries - Educational services (%)
Most Common Industries - Health care and social assistance (%)
Most Common Industries - Arts, entertainment, and recreation, and accommodation and food services (%)
Most Common Industries - Arts, entertainment, and recreation (%)
Most Common Industries - Accommodation and food services (%)
Most Common Industries - Other services, except public administration (%)
Most Common Industries - Public administration (%)
Occupation diversity
Most Common Occupations - Management, business, science, and arts occupations (%)
Most Common Occupations - Management, business, and financial occupations (%)
Most Common Occupations - Management occupations (%)
Most Common Occupations - Business and financial operations occupations (%)
Most Common Occupations - Computer, engineering, and science occupations (%)
Most Common Occupations - Computer and mathematical occupations (%)
Most Common Occupations - Architecture and engineering occupations (%)
Most Common Occupations - Life, physical, and social science occupations (%)
Most Common Occupations - Education, legal, community service, arts, and media occupations (%)
Most Common Occupations - Community and social service occupations (%)
Most Common Occupations - Legal occupations (%)
Most Common Occupations - Education, training, and library occupations (%)
Most Common Occupations - Arts, design, entertainment, sports, and media occupations (%)
Most Common Occupations - Healthcare practitioners and technical occupations (%)
Most Common Occupations - Health diagnosing and treating practitioners and other technical occupations (%)
Most Common Occupations - Health technologists and technicians (%)
Most Common Occupations - Service occupations (%)
Most Common Occupations - Healthcare support occupations (%)
Most Common Occupations - Protective service occupations (%)
Most Common Occupations - Fire fighting and prevention, and other protective service workers including supervisors (%)
Most Common Occupations - Law enforcement workers including supervisors (%)
Most Common Occupations - Food preparation and serving related occupations (%)
Most Common Occupations - Building and grounds cleaning and maintenance occupations (%)
Most Common Occupations - Personal care and service occupations (%)
Most Common Occupations - Sales and office occupations (%)
Most Common Occupations - Sales and related occupations (%)
Most Common Occupations - Office and administrative support occupations (%)
Most Common Occupations - Natural resources, construction, and maintenance occupations (%)
Most Common Occupations - Farming, fishing, and forestry occupations (%)
Most Common Occupations - Construction and extraction occupations (%)
Most Common Occupations - Installation, maintenance, and repair occupations (%)
Most Common Occupations - Production, transportation, and material moving occupations (%)
Most Common Occupations - Production occupations (%)
Most Common Occupations - Transportation occupations (%)
Most Common Occupations - Material moving occupations (%)
People in Group quarters - Institutionalized population (%)
People in Group quarters - Correctional institutions (%)
People in Group quarters - Federal prisons and detention centers (%)
People in Group quarters - Halfway houses (%)
People in Group quarters - Local jails and other confinement facilities (including police lockups) (%)
People in Group quarters - Military disciplinary barracks (%)
People in Group quarters - State prisons (%)
People in Group quarters - Other types of correctional institutions (%)
People in Group quarters - Nursing homes (%)
People in Group quarters - Hospitals/wards, hospices, and schools for the handicapped (%)
People in Group quarters - Hospitals/wards and hospices for chronically ill (%)
People in Group quarters - Hospices or homes for chronically ill (%)
People in Group quarters - Military hospitals or wards for chronically ill (%)
People in Group quarters - Other hospitals or wards for chronically ill (%)
People in Group quarters - Hospitals or wards for drug/alcohol abuse (%)
People in Group quarters - Mental (Psychiatric) hospitals or wards (%)
People in Group quarters - Schools, hospitals, or wards for the mentally retarded (%)
People in Group quarters - Schools, hospitals, or wards for the physically handicapped (%)
People in Group quarters - Institutions for the deaf (%)
People in Group quarters - Institutions for the blind (%)
People in Group quarters - Orthopedic wards and institutions for the physically handicapped (%)
People in Group quarters - Wards in general hospitals for patients who have no usual home elsewhere (%)
People in Group quarters - Wards in military hospitals for patients who have no usual home elsewhere (%)
People in Group quarters - Juvenile institutions (%)
People in Group quarters - Long-term care (%)
People in Group quarters - Homes for abused, dependent, and neglected children (%)
People in Group quarters - Residential treatment centers for emotionally disturbed children (%)
People in Group quarters - Training schools for juvenile delinquents (%)
People in Group quarters - Short-term care, detention or diagnostic centers for delinquent children (%)
People in Group quarters - Type of juvenile institution unknown (%)
People in Group quarters - Noninstitutionalized population (%)
People in Group quarters - College dormitories (includes college quarters off campus) (%)
People in Group quarters - Military quarters (%)
People in Group quarters - On base (%)
People in Group quarters - Barracks, unaccompanied personnel housing (UPH), (Enlisted/Officer), ;and similar group living quarters for military personnel (%)
People in Group quarters - Transient quarters for temporary residents (%)
People in Group quarters - Military ships (%)
People in Group quarters - Group homes (%)
People in Group quarters - Homes or halfway houses for drug/alcohol abuse (%)
People in Group quarters - Homes for the mentally ill (%)
People in Group quarters - Homes for the mentally retarded (%)
People in Group quarters - Homes for the physically handicapped (%)
People in Group quarters - Other group homes (%)
People in Group quarters - Religious group quarters (%)
People in Group quarters - Dormitories (%)
People in Group quarters - Agriculture workers' dormitories on farms (%)
People in Group quarters - Job Corps and vocational training facilities (%)
People in Group quarters - Other workers' dormitories (%)
People in Group quarters - Crews of maritime vessels (%)
People in Group quarters - Other nonhousehold living situations (%)
People in Group quarters - Other noninstitutional group quarters (%)
Residents speaking English at home (%)
Residents speaking English at home - Born in the United States (%)
Residents speaking English at home - Native, born elsewhere (%)
Residents speaking English at home - Foreign born (%)
Residents speaking Spanish at home (%)
Residents speaking Spanish at home - Born in the United States (%)
Residents speaking Spanish at home - Native, born elsewhere (%)
Residents speaking Spanish at home - Foreign born (%)
Residents speaking other language at home (%)
Residents speaking other language at home - Born in the United States (%)
Residents speaking other language at home - Native, born elsewhere (%)
Residents speaking other language at home - Foreign born (%)
Class of Workers - Employee of private company (%)
Class of Workers - Self-employed in own incorporated business (%)
Class of Workers - Private not-for-profit wage and salary workers (%)
Class of Workers - Local government workers (%)
Class of Workers - State government workers (%)
Class of Workers - Federal government workers (%)
Class of Workers - Self-employed workers in own not incorporated business and Unpaid family workers (%)
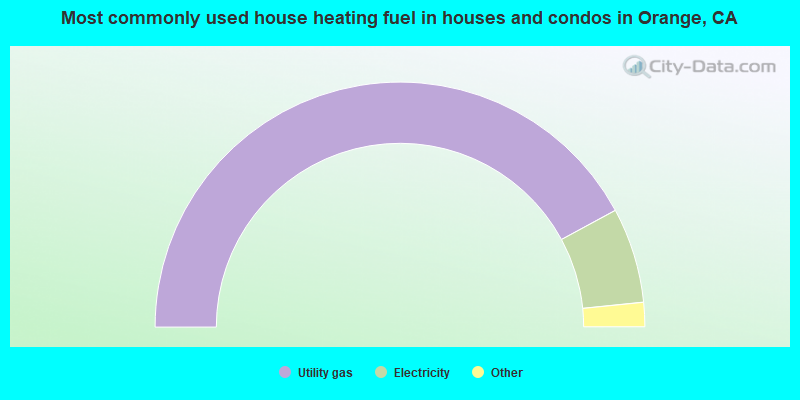
House heating fuel used in houses and condos - Utility gas (%)
House heating fuel used in houses and condos - Bottled, tank, or LP gas (%)
House heating fuel used in houses and condos - Electricity (%)
House heating fuel used in houses and condos - Fuel oil, kerosene, etc. (%)
House heating fuel used in houses and condos - Coal or coke (%)
House heating fuel used in houses and condos - Wood (%)
House heating fuel used in houses and condos - Solar energy (%)
House heating fuel used in houses and condos - Other fuel (%)
House heating fuel used in houses and condos - No fuel used (%)
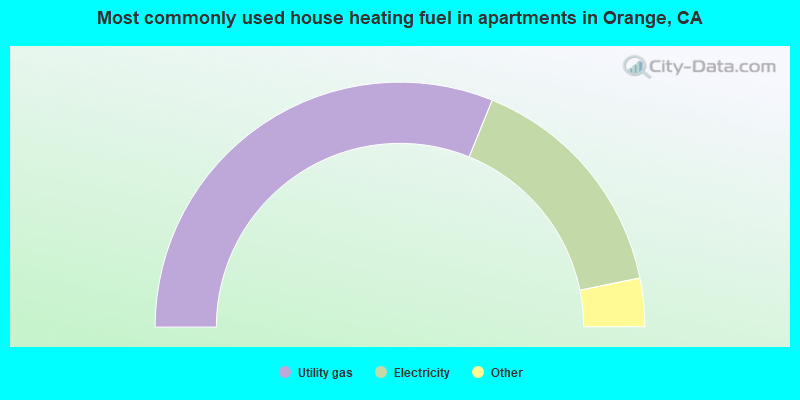
House heating fuel used in apartments - Utility gas (%)
House heating fuel used in apartments - Bottled, tank, or LP gas (%)
House heating fuel used in apartments - Electricity (%)
House heating fuel used in apartments - Fuel oil, kerosene, etc. (%)
House heating fuel used in apartments - Coal or coke (%)
House heating fuel used in apartments - Wood (%)
House heating fuel used in apartments - Solar energy (%)
House heating fuel used in apartments - Other fuel (%)
House heating fuel used in apartments - No fuel used (%)
Armed forces status - In Armed Forces (%)
Armed forces status - Civilian (%)
Armed forces status - Civilian - Veteran (%)
Armed forces status - Civilian - Nonveteran (%)
Fatal accidents locations in years 2005-2021
Fatal accidents locations in 2005
Fatal accidents locations in 2006
Fatal accidents locations in 2007
Fatal accidents locations in 2008
Fatal accidents locations in 2009
Fatal accidents locations in 2010
Fatal accidents locations in 2011
Fatal accidents locations in 2012
Fatal accidents locations in 2013
Fatal accidents locations in 2014
Fatal accidents locations in 2015
Fatal accidents locations in 2016
Fatal accidents locations in 2017
Fatal accidents locations in 2018
Fatal accidents locations in 2019
Fatal accidents locations in 2020
Fatal accidents locations in 2021
Alcohol use - People drinking some alcohol every month (%)
Alcohol use - People not drinking at all (%)
Alcohol use - Average days/month drinking alcohol
Alcohol use - Average drinks/week
Alcohol use - Average days/year people drink much
Audiometry - Average condition of hearing (%)
Audiometry - People that can hear a whisper from across a quiet room (%)
Audiometry - People that can hear normal voice from across a quiet room (%)
Audiometry - Ears ringing, roaring, buzzing (%)
Audiometry - Had a job exposure to loud noise (%)
Audiometry - Had off-work exposure to loud noise (%)
Blood Pressure & Cholesterol - Has high blood pressure (%)
Blood Pressure & Cholesterol - Checking blood pressure at home (%)
Blood Pressure & Cholesterol - Frequently checking blood cholesterol (%)
Blood Pressure & Cholesterol - Has high cholesterol level (%)
Consumer Behavior - Money monthly spent on food at supermarket/grocery store
Consumer Behavior - Money monthly spent on food at other stores
Consumer Behavior - Money monthly spent on eating out
Consumer Behavior - Money monthly spent on carryout/delivered foods
Consumer Behavior - Income spent on food at supermarket/grocery store (%)
Consumer Behavior - Income spent on food at other stores (%)
Consumer Behavior - Income spent on eating out (%)
Consumer Behavior - Income spent on carryout/delivered foods (%)
Current Health Status - General health condition (%)
Current Health Status - Blood donors (%)
Current Health Status - Has blood ever tested for HIV virus (%)
Current Health Status - Left-handed people (%)
Dermatology - People using sunscreen (%)
Diabetes - Diabetics (%)
Diabetes - Had a blood test for high blood sugar (%)
Diabetes - People taking insulin (%)
Diet Behavior & Nutrition - Diet health (%)
Diet Behavior & Nutrition - Milk product consumption (# of products/month)
Diet Behavior & Nutrition - Meals not home prepared (#/week)
Diet Behavior & Nutrition - Meals from fast food or pizza place (#/week)
Diet Behavior & Nutrition - Ready-to-eat foods (#/month)
Diet Behavior & Nutrition - Frozen meals/pizza (#/month)
Drug Use - People that ever used marijuana or hashish (%)
Drug Use - Ever used hard drugs (%)
Drug Use - Ever used any form of cocaine (%)
Drug Use - Ever used heroin (%)
Drug Use - Ever used methamphetamine (%)
Health Insurance - People covered by health insurance (%)
Kidney Conditions-Urology - Avg. # of times urinating at night
Medical Conditions - People with asthma (%)
Medical Conditions - People with anemia (%)
Medical Conditions - People with psoriasis (%)
Medical Conditions - People with overweight (%)
Medical Conditions - Elderly people having difficulties in thinking or remembering (%)
Medical Conditions - People who ever received blood transfusion (%)
Medical Conditions - People having trouble seeing even with glass/contacts (%)
Medical Conditions - People with arthritis (%)
Medical Conditions - People with gout (%)
Medical Conditions - People with congestive heart failure (%)
Medical Conditions - People with coronary heart disease (%)
Medical Conditions - People with angina pectoris (%)
Medical Conditions - People who ever had heart attack (%)
Medical Conditions - People who ever had stroke (%)
Medical Conditions - People with emphysema (%)
Medical Conditions - People with thyroid problem (%)
Medical Conditions - People with chronic bronchitis (%)
Medical Conditions - People with any liver condition (%)
Medical Conditions - People who ever had cancer or malignancy (%)
Mental Health - People who have little interest in doing things (%)
Mental Health - People feeling down, depressed, or hopeless (%)
Mental Health - People who have trouble sleeping or sleeping too much (%)
Mental Health - People feeling tired or having little energy (%)
Mental Health - People with poor appetite or overeating (%)
Mental Health - People feeling bad about themself (%)
Mental Health - People who have trouble concentrating on things (%)
Mental Health - People moving or speaking slowly or too fast (%)
Mental Health - People having thoughts they would be better off dead (%)
Oral Health - Average years since last visit a dentist
Oral Health - People embarrassed because of mouth (%)
Oral Health - People with gum disease (%)
Oral Health - General health of teeth and gums (%)
Oral Health - Average days a week using dental floss/device
Oral Health - Average days a week using mouthwash for dental problem
Oral Health - Average number of teeth
Pesticide Use - Households using pesticides to control insects (%)
Pesticide Use - Households using pesticides to kill weeds (%)
Physical Activity - People doing vigorous-intensity work activities (%)
Physical Activity - People doing moderate-intensity work activities (%)
Physical Activity - People walking or bicycling (%)
Physical Activity - People doing vigorous-intensity recreational activities (%)
Physical Activity - People doing moderate-intensity recreational activities (%)
Physical Activity - Average hours a day doing sedentary activities
Physical Activity - Average hours a day watching TV or videos
Physical Activity - Average hours a day using computer
Physical Functioning - People having limitations keeping them from working (%)
Physical Functioning - People limited in amount of work they can do (%)
Physical Functioning - People that need special equipment to walk (%)
Physical Functioning - People experiencing confusion/memory problems (%)
Physical Functioning - People requiring special healthcare equipment (%)
Prescription Medications - Average number of prescription medicines taking
Preventive Aspirin Use - Adults 40+ taking low-dose aspirin (%)
Reproductive Health - Vaginal deliveries (%)
Reproductive Health - Cesarean deliveries (%)
Reproductive Health - Deliveries resulted in a live birth (%)
Reproductive Health - Pregnancies resulted in a delivery (%)
Reproductive Health - Women breastfeeding newborns (%)
Reproductive Health - Women that had a hysterectomy (%)
Reproductive Health - Women that had both ovaries removed (%)
Reproductive Health - Women that have ever taken birth control pills (%)
Reproductive Health - Women taking birth control pills (%)
Reproductive Health - Women that have ever used Depo-Provera or injectables (%)
Reproductive Health - Women that have ever used female hormones (%)
Sexual Behavior - People 18+ that ever had sex (vaginal, anal, or oral) (%)
Sexual Behavior - Males 18+ that ever had vaginal sex with a woman (%)
Sexual Behavior - Males 18+ that ever performed oral sex on a woman (%)
Sexual Behavior - Males 18+ that ever had anal sex with a woman (%)
Sexual Behavior - Males 18+ that ever had any sex with a man (%)
Sexual Behavior - Females 18+ that ever had vaginal sex with a man (%)
Sexual Behavior - Females 18+ that ever performed oral sex on a man (%)
Sexual Behavior - Females 18+ that ever had anal sex with a man (%)
Sexual Behavior - Females 18+ that ever had any kind of sex with a woman (%)
Sexual Behavior - Average age people first had sex
Sexual Behavior - Average number of female sex partners in lifetime (males 18+)
Sexual Behavior - Average number of female vaginal sex partners in lifetime (males 18+)
Sexual Behavior - Average age people first performed oral sex on a woman (18+)
Sexual Behavior - Average number of woman performed oral sex on in lifetime (18+)
Sexual Behavior - Average number of male sex partners in lifetime (males 18+)
Sexual Behavior - Average number of male anal sex partners in lifetime (males 18+)
Sexual Behavior - Average age people first performed oral sex on a man (18+)
Sexual Behavior - Average number of male oral sex partners in lifetime (18+)
Sexual Behavior - People using protection when performing oral sex (%)
Sexual Behavior - Average number of times people have vaginal or anal sex a year
Sexual Behavior - People having sex without condom (%)
Sexual Behavior - Average number of male sex partners in lifetime (females 18+)
Sexual Behavior - Average number of male vaginal sex partners in lifetime (females 18+)
Sexual Behavior - Average number of female sex partners in lifetime (females 18+)
Sexual Behavior - Circumcised males 18+ (%)
Sleep Disorders - Average hours sleeping at night
Sleep Disorders - People that has trouble sleeping (%)
Smoking-Cigarette Use - People smoking cigarettes (%)
Taste & Smell - People 40+ having problems with smell (%)
Taste & Smell - People 40+ having problems with taste (%)
Taste & Smell - People 40+ that ever had wisdom teeth removed (%)
Taste & Smell - People 40+ that ever had tonsils teeth removed (%)
Taste & Smell - People 40+ that ever had a loss of consciousness because of a head injury (%)
Taste & Smell - People 40+ that ever had a broken nose or other serious injury to face or skull (%)
Taste & Smell - People 40+ that ever had two or more sinus infections (%)
Weight - Average height (inches)
Weight - Average weight (pounds)
Weight - Average BMI
Weight - People that are obese (%)
Weight - People that ever were obese (%)
Weight - People trying to lose weight (%)
55,303 40.6% White alone 51,263 37.6% Hispanic 19,939 14.6% Asian alone 6,770 5.0% Two or more races 1,994 1.5% Black alone 744 0.5% Other race alone 82 0.06% American Indian alone 80 0.06% Native Hawaiian and Other
According to our research of California and other state lists, there were 127 registered sex offenders living in Orange, California as of April 27, 2024 . The ratio of all residents to sex offenders in Orange is 1,106 to 1.The ratio of registered sex offenders to all residents in this city is lower than the state average.
The City-Data.com crime index weighs serious crimes and violent crimes more heavily. Higher means more crime, U.S. average is 246.1. It adjusts for the number of visitors and daily workers commuting into cities.
- means the value is smaller than the state average.
- means the value is about the same as the state average.
- means the value is bigger than the state average.
- means the value is much bigger than the state average.
Crime rate in Orange detailed stats: murders, rapes, robberies, assaults, burglaries, thefts, arson Officers per 1,000 residents here:
1.08California average:
2.30
Latest news from Orange, CA collected exclusively by city-data.com from local newspapers, TV, and radio stations
Ancestries: American (19.0%), European (3.6%), English (3.1%), German (3.0%), Irish (2.7%), Italian (1.9%).
Current Local Time:
Land area: 23.4 square miles.
Population density: 5,821 people per square mile (average).
30,441 residents are foreign born (10.9% Latin America , 8.7% Asia ).
This city:
22.1%California:
26.5%
Median real estate property taxes paid for housing units with mortgages in 2022: $6,785 (0.7%)Median real estate property taxes paid for housing units with no mortgage in 2022: $4,556 (0.5%)
Nearest city with pop. 200,000+: Anaheim, CA
Nearest city with pop. 1,000,000+: Los Angeles, CA
Nearest cities:
Latitude: 33.80 N, Longitude: 117.83 W
Daytime population change due to commuting: +27,282 (+20.0%)Workers who live and work in this city: 23,736 (32.1%)
Orange tourist attractions:
Single-family new house construction building permits:
2022: 76 buildings , average cost: $127,2002021: 79 buildings , average cost: $116,8002020: 40 buildings , average cost: $142,2002019: 75 buildings , average cost: $299,8002018: 24 buildings , average cost: $288,1002017: 40 buildings , average cost: $210,7002016: 10 buildings , average cost: $168,2002015: 7 buildings , average cost: $144,3002014: 7 buildings , average cost: $149,1002013: 1 building , cost: $68,0002012: 2 buildings , average cost: $820,0002011: 5 buildings , average cost: $83,5002010: 35 buildings , average cost: $245,0002009: 129 buildings , average cost: $189,0002008: 99 buildings , average cost: $136,3002007: 262 buildings , average cost: $129,3002006: 92 buildings , average cost: $140,8002005: 20 buildings , average cost: $109,3002004: 101 buildings , average cost: $165,8002003: 145 buildings , average cost: $202,0002002: 379 buildings , average cost: $219,9002001: 104 buildings , average cost: $219,9002000: 306 buildings , average cost: $207,0001999: 142 buildings , average cost: $226,9001998: 108 buildings , average cost: $234,9001997: 282 buildings , average cost: $218,300Unemployment in December 2023:
Population change in the 1990s: +17,870 (+16.1%).
Most common occupations in Orange, CA (%)
Both Males Females
Other management occupations, except farmers and farm managers (6.8%)
Cooks and food preparation workers (5.2%)
Building and grounds cleaning and maintenance occupations (4.8%)
Computer specialists (3.3%)
Retail sales workers, except cashiers (2.8%)
Other office and administrative support workers, including supervisors (2.7%)
Cashiers (2.5%)
Other management occupations, except farmers and farm managers (8.1%)
Building and grounds cleaning and maintenance occupations (5.7%)
Cooks and food preparation workers (5.7%)
Computer specialists (4.5%)
Electrical equipment mechanics and other installation, maintenance, and repair workers, including supervisors (3.3%)
Retail sales workers, except cashiers (2.9%)
Material recording, scheduling, dispatching, and distributing workers (2.6%)
Other management occupations, except farmers and farm managers (5.3%)
Secretaries and administrative assistants (4.8%)
Cooks and food preparation workers (4.6%)
Cashiers (4.5%)
Other office and administrative support workers, including supervisors (4.3%)
Building and grounds cleaning and maintenance occupations (3.6%)
Information and record clerks, except customer service representatives (3.1%)
Earthquake activity:
Orange-area historical earthquake activity is significantly above California state average. It is 6926% greater than the overall U.S. average. On 6/28/1992 at 11:57:34, a magnitude 7.6 (6.2 MB, 7.6 MS, 7.3 MW, Depth: 0.7 mi, Class: Major, Intensity: VIII - XII) earthquake occurred 79.1 miles away from the city center, causing 3 deaths ( 1 shaking deaths, 2 other deaths) and 400 injuries, causing $100,000,000 total damage and $40,000,000 insured lossesOn 7/21/1952 at 11:52:14, a magnitude 7.7 (7.7 UK) earthquake occurred 106.3 miles away from Orange center, causing $50,000,000 total damage On 10/16/1999 at 09:46:44, a magnitude 7.4 (6.3 MB, 7.4 MS, 7.2 MW, 7.3 ML) earthquake occurred 93.9 miles away from the city center On 4/21/1918 at 22:32:30, a magnitude 6.8 (6.8 UK, Class: Strong, Intensity: VII - IX) earthquake occurred 22.6 miles away from the city center On 11/4/1927 at 13:51:53, a magnitude 7.5 (7.5 UK) earthquake occurred 198.2 miles away from Orange center On 5/19/1940 at 04:36:40, a magnitude 7.2 (7.2 UK) earthquake occurred 129.5 miles away from Orange center, causing $33,000,000 total damage Magnitude types: body-wave magnitude (MB), local magnitude (ML), surface-wave magnitude (MS), moment magnitude (MW) Natural disasters: The number of natural disasters in Orange County (32) is a lot greater than the US average (15).Major Disasters (Presidential) Declared: 22Emergencies Declared: 2Floods: 15, Fires: 13, Storms: 9, Landslides: 6, Winter Storms: 6, Mudslides: 5, Earthquakes: 2, Heavy Rain: 1, Hurricane: 1, Snow: 1, Tornado: 1, Wind: 1, Other: 1 (Note: some incidents may be assigned to more than one category). Main business address for: SYBRON DENTAL SPECIALTIES INC DENTAL EQUIPMENT & SUPPLIES ).
Hospitals in Orange: ASERACARE HOSPICE (750 THE CITY DRIVE, SUITE 120) CACHUELA ICF/DD-N HOME (1721 N GREENGROVE) CARE UNIT HOSP OF ORANGE (401 SOUTH TUSTIN AVENUE) CHAPMAN MEDICAL CENTER (Proprietary, provides emergency services, 2601 E CHAPMAN AVE) CHILDREN'S HOSPITAL OF ORANGE COUNTY (provides emergency services, 455 SOUTH MAIN STREET) HEARTLAND HOME HEALTH CARE AND HOSPICE (725 W TOWN & COUNTRY ROAD, SUITE 130) ST JOSEPH HOSPITAL (Voluntary non-profit - Church, 1100 WEST STEWART DR) UNIVERSITY OF CALIFORNIA IRVINE MED CENTER (Government - Local, 101 CITY DRIVE SOUTH) VITAS HEALTHCARE CORPORATION OF CALIFORNIA (333 SOUTH ANITA DR, #950) Nursing Homes in Orange: FOUNTAIN CARE CENTER (1835 WEST LA VETA AVENUE) HEALTHBRIDGE CHILDREN'S HOSPITAL - ORANGE D/P SNF (393 S TUSTIN ST) NEW ORANGE HILLS (5017 E. CHAPMAN AVENUE) ORANGE HEALTHCARE AND WELLNESS CENTRE, LLC (920 WEST LA VETA STREET) ROYAL GROVE CONV HOSP (238 D FLOWER ST) Dialysis Facilities in Orange: DAVITA-MAIN PLACE DIALYSIS CENTER (972 TOWN & COUNTRY ROAD) SATELLITE DIALYSIS OF ORANGE (1518 W. LA VETA AVENUE) ST. JOSEPH HOSPITAL RENAL CENTER (SR. ELIZABETH BLDG.) UCI RENAL DIALYSIS CENTER (101 CITY DRIVE, BUILDING 51) Home Health Centers in Orange: COMPANION HOME HEALTH AGENCY (2200 W ORANGEWOOD AVE, SUITE 250) NURSEFINDERS OF ORANGE COUNTY (2140 WEST CHAPMAN AVENUE, SUITE 110) ST JOSEPH HEALTH SYSTEM HOME HEALTH AGENCY (1845 WEST ORANGEWOOD AVENUE SUITE 200) VNA MANAGED CARE (1337 BRADEN COURT) Amtrak stations near Orange: 4 miles: ANAHEIM (2150 KATELLA AVE.) Services: ticket office, fully wheelchair accessible, enclosed waiting area, public restrooms, public payphones, vending machines, free short-term parking, free long-term parking, call for car rental service, call for taxi service.
4 miles: SANTA ANA (1000 E. SANTA ANA BLVD.) Services: ticket office, fully wheelchair accessible, enclosed waiting area, public restrooms, public payphones, snack bar, free short-term parking, free long-term parking, call for car rental service, taxi stand, intercity bus service, public transit connection.
7 miles: FULLERTON (120 E. SANTA FE AVE.) Services: ticket office, fully wheelchair accessible, enclosed waiting area, public restrooms, public payphones, full-service food facilities, free short-term parking, paid long-term parking, taxi stand, public transit connection.
Colleges/Universities in Orange: Chapman University Full-time enrollment: 7,089; Location: One University Dr.; Private, not-for-profit; Website: www.chapman.edu; Offers Doctor's degree )
Santiago Canyon College Full-time enrollment: 6,050; Location: 8045 E Chapman; Public; Website: www.sccollege.edu/Pages/default.aspx)
ITT Technical Institute-Orange Full-time enrollment: 971; Location: 4000 W. Metropolitian Dr., Suite 100; Private, for-profit; Website: www.itt-tech.edu)
Career Networks Institute Full-time enrollment: 655; Location: 702 W Town and Country Rd; Private, for-profit; Website: www.cnicollege.edu)
Argosy University-Orange County Full-time enrollment: 489; Location: 601 South Lewis Street; Private, for-profit; Website: www.argosy.edu/orangecounty; Offers Doctor's degree )
South Coast College Full-time enrollment: 333; Location: 2011 W. Chapman Avenue; Private, for-profit; Website: SOUTHCOASTCOLLEGE.COM)
InterCoast Colleges-Orange Full-time enrollment: 203; Location: 3745 W. Chapman Avenue #100; Private, for-profit; Website: www.intercoast.edu)
Hair California Beauty Academy Full-time enrollment: 91; Location: 1110 N Tustin St; Private, for-profit; Website: www.hairca.com)
COBA Academy Full-time enrollment: 56; Location: 102 N Glassell St; Private, for-profit; Website: www.coba.edu)
Other colleges/universities with over 2000 students near Orange:
Santa Ana College (about 5 miles; Santa Ana, CA ; Full-time enrollment: 11,756)
West Coast University-Orange County (about 5 miles; Anaheim, CA ; FT enrollment: 2,464)
California State University-Fullerton (about 7 miles; Fullerton, CA ; FT enrollment: 28,947)
Fullerton College (about 8 miles; Fullerton, CA ; FT enrollment: 11,124)
University of Phoenix-Southern California Campus (about 9 miles; Costa Mesa, CA ; FT enrollment: 8,110)
Irvine Valley College (about 10 miles; Irvine, CA ; FT enrollment: 8,005)
Orange Coast College (about 11 miles; Costa Mesa, CA ; FT enrollment: 12,918)
Public high school in Orange: DON PEDRO HIGH Students: 42, Location: 3090 MERCED FALLS RD., Grades: 9-12)Public elementary/middle school in Orange: LAKE DON PEDRO ELEMENTARY Location: 2411 HILDAGO, Grades: KG-8)
See full list of schools located in Orange Library in Orange: ORANGE PUBLIC LIBRARY Operating income: $5,022,925; Location: 407 E CHAPMAN AVE; 231,101 books ; 12,386 audio materials ; 8,658 video materials ; 12 local licensed databases ; 282 print serial subscriptions )
User-submitted facts and corrections:
Zip codes for Orange also include 92866 and 92867. 92867 is also a zip code for Villa Park, CA.
Notable locations in Orange: (A) , Lacy Security Facility (B) , Orange Public Library (C) , El Modena Branch Orange Public Library (D) , Charles P Taft Branch Orange Public Library (E) , Villa Park City Hall (F) , Villa Park Branch Orange County Public Library (G) , Orange City Hall (H) , Care Ambulance Service (I) , City of Orange Fire Department Station 7 (J) , City of Orange Fire Department Station 8 (K) , Wilkinson Hall (L) , Smith Hall (M) , Schmid Gate (N) , Roosevelt Hall (O) , Reeves Hall (P) , Oliphant Hall (Q) , Moulton Center (R) , Memorial Hall (S) , Leatherby Library (T) . Display/hide their locations on the map
Shopping Centers: (1) , Villa Park Town Center Shopping Center (2) , Tuskatella Shopping Center (3) , The City Shopping Center (4) , The Brickyard Shopping Center (5) , Orange Town and Country North Shopping Center (6) , Mall of Orange Shopping Center (7) . Display/hide their locations on the map
Main business address in Orange: (A) . Display/hide its location on the map
Churches in Orange include: (A) , Calvary Temple (B) , Christ Lutheran Church of Orange (C) , Covenant Family Fellowship Church (D) , Covenant Presbyterian Church (E) , Evangelical Free Church (F) , First Christian Church of Orange (G) , First Presbyterian Church (H) , First United Methodist Church (I) . Display/hide their locations on the map
Cemetery: (1) . Display/hide its location on the map
Reservoirs: (A) , Olive Hills Reservoir (B) , Peters Canyon Reservoir (C) . Display/hide their locations on the map
Creek: (A) . Display/hide its location on the map
Parks in Orange include: (1) , Chapman Plaza (2) , Chapman Stadium (3) , Liberty Plaza (4) , Williams Mall (5) , Camino Real Park (6) , Eisenhower Park (7) , Handy Park (8) , Hart Park (9) . Display/hide their locations on the map
Tourist attractions: (1) , Amusement Electronics Taylor Engineering (Amusement & Theme Parks; 815 North Main Street) (2) , #1 A A A Classique Limousines (Tours & Charters; 1227 W Trenton Ave) (3) . Display/hide their approximate locations on the map
Hotels: (1) , 7 Crowns Motel (528 East Lincoln Avenue) (2) , American Inn & Suites (3191 North Tustin Street) (3) , Best Value Inn & Suites (3101 West Chapman Avenue) (4) , Anaheim-Orange Hilton Suites (400 North State College Boulevard) (5) , Best Western Orange Plaza (1302 West Chapman) (6) , Ayres Inn Orange (3737 West Chapman Avenue) (7) , Angel Motel (2330 West Chapman Avenue) (8) , Big A Motel (1250 North Glassell Street) (9) . Display/hide their approximate locations on the map
Court: (1) . Display/hide its approximate location on the map
Birthplace of: Erica Blasberg - Professional golfer, Gregg Groothuis - Professional wrestler, Bryan O'Connor - (born 1946), astronaut, Jason Lee (actor) - Film actor, Toni Childs - Singer-songwriter, Linda Sánchez - Female lawyer, Abe Walsh - Writer, Garrett Atkins - 2005 Major League Baseball player (Colorado Rockies, born : Dec 12, 1979), Jamie Martin - 2005 NFL player (St. Louis Rams, born : Feb 8, 1970), Robin Lee Graham - Sailor.
Orange County has a predicted average indoor radon screening level less than 2 pCi/L (pico curies per liter) - Low Potential Drinking water stations with addresses in Orange that have no violations reported:
MANITOU VILLAGE (Serves ND, Population served: 76, Primary Water Source Type: Groundwater)
Average household size: This city:
3.0 peopleCalifornia:
2.9 people
Percentage of family households: This city:
72.1%Whole state:
68.7%
Percentage of households with unmarried partners: This city:
6.5%Whole state:
7.2%
Likely homosexual households (counted as self-reported same-sex unmarried-partner households)
Lesbian couples: 0.5% of all households Gay men: 0.4% of all households
People in group quarters in Orange in 2010:
2,628 people in local jails and other municipal confinement facilities
1,719 people in college/university student housing
431 people in correctional facilities intended for juveniles
366 people in other noninstitutional facilities
359 people in group homes intended for adults
299 people in nursing facilities/skilled-nursing facilities
170 people in group homes for juveniles (non-correctional)
70 people in workers' group living quarters and job corps centers
52 people in residential treatment centers for juveniles (non-correctional)
40 people in residential treatment centers for adults
39 people in mental (psychiatric) hospitals and psychiatric units in other hospitals
34 people in in-patient hospice facilities
33 people in emergency and transitional shelters (with sleeping facilities) for people experiencing homelessness
13 people in correctional residential facilities
People in group quarters in Orange in 2000:
2,396 people in local jails and other confinement facilities (including police lockups)
896 people in college dormitories (includes college quarters off campus)
548 people in other noninstitutional group quarters
506 people in wards in general hospitals for patients who have no usual home elsewhere
268 people in nursing homes
206 people in other group homes
134 people in homes for the mentally retarded
129 people in religious group quarters
95 people in hospitals/wards and hospices for chronically ill
95 people in other hospitals or wards for chronically ill
69 people in homes or halfway houses for drug/alcohol abuse
51 people in homes for the mentally ill
16 people in orthopedic wards and institutions for the physically handicapped
16 people in unknown juvenile institutions
2 people in other nonhousehold living situations
Banks with most branches in Orange (2011 data):
Wells Fargo Bank, National Association: 7 branches. Info updated 2011/04/05: Bank assets: $1,161,490.0 mil, Deposits: $905,653.0 mil, headquarters in Sioux Falls, SD, positive income , 6395 total offices , Holding Company: Wells Fargo & Company
U.S. Bank National Association: Orange-Old Towne-Branch, Orange Branch, Chapman Avenue Albertsons, Orange - Main Street Branch, Nohl Ranch Vons Branch. Info updated 2012/01/30: Bank assets: $330,470.8 mil, Deposits: $236,091.5 mil, headquarters in Cincinnati, OH, positive income , 3121 total offices , Holding Company: U.S. Bancorp
JPMorgan Chase Bank, National Association: 2000 N Tustin St Branch, North Tustin Street Branch, East Chapman Branch. Info updated 2011/11/10: Bank assets: $1,811,678.0 mil, Deposits: $1,190,738.0 mil, headquarters in Columbus, OH, positive income , International Specialization, 5577 total offices , Holding Company: Jpmorgan Chase & Co.
Bank of America, National Association: Lincoln-Tustin Branch, Orange Hills Branch, Tustin And Collins Branch. Info updated 2009/11/18: Bank assets: $1,451,969.3 mil, Deposits: $1,077,176.8 mil, headquarters in Charlotte, NC, positive income , 5782 total offices , Holding Company: Bank Of America Corporation
Citizens Business Bank: Plaza Branch, Katella Branch, Stadium Branch. Info updated 2011/03/30: Bank assets: $6,475.4 mil, Deposits: $4,625.6 mil, headquarters in Ontario, CA, positive income , Commercial Lending Specialization, 46 total offices , Holding Company: Cvb Financial Corp.
Citibank, National Association: West Metropolitan Drive Branch at 4050 West Metropolitan Drive, branch established on 1945/01/01; 2090 N. Tustin Street Branch at 2090 North Tustin Street, branch established on 2002/11/13. Info updated 2012/01/10: Bank assets: $1,288,658.0 mil, Deposits: $882,541.0 mil, headquarters in Sioux Falls, SD, positive income , International Specialization, 1048 total offices , Holding Company: Citigroup Inc.
Farmers and Merchants Bank of Long Beach: Orange Branch at 1220 East Katella Avenue, branch established on 1981/05/30. Info updated 2006/11/03: Bank assets: $4,659.3 mil, Deposits: $3,393.5 mil, headquarters in Long Beach, CA, positive income , Commercial Lending Specialization, 22 total offices , Holding Company: Palomar Enterprises, Llc
California Bank & Trust: Orange Branch at 500 North State College Blvd., branch established on 2010/09/13. Info updated 2009/07/20: Bank assets: $10,894.1 mil, Deposits: $9,193.9 mil, headquarters in San Diego, CA, positive income , Commercial Lending Specialization, 109 total offices , Holding Company: Zions Bancorporation
Grandpoint Bank: Orange Branch at 1045 West Katella Avenue, branch established on 2000/11/20. Info updated 2012/02/01: Bank assets: $854.9 mil, Deposits: $726.6 mil, headquarters in Los Angeles, CA, negative income in the last year , Commercial Lending Specialization, 8 total offices , Holding Company: Grandpoint Capital, Inc.
4 other banks with 4 local branches
For population 15 years and over in Orange:
Never married: 37.6%Now married: 47.4%Separated: 1.8%Widowed: 3.9%Divorced: 9.2% For population 25 years and over in Orange:
High school or higher: 88.2%Bachelor's degree or higher: 40.3%Graduate or professional degree: 13.5%Unemployed: 4.9%Mean travel time to work (commute): 23.6 minutes
Education Gini index (Inequality in education) Here:
14.4California average:
15.5
Religion statistics for Orange, CA (based on Orange County data)
Religion Adherents Congregations Catholic 797,473 67 Evangelical Protestant 345,893 894 Other 141,815 329 Mainline Protestant 76,574 202 Orthodox 13,406 19 Black Protestant 2,424 8 None 1,632,647 -
Source: Clifford Grammich, Kirk Hadaway, Richard Houseal, Dale E.Jones, Alexei Krindatch, Richie Stanley and Richard H.Taylor. 2012. 2010 U.S.Religion Census: Religious Congregations & Membership Study. Association of Statisticians of American Religious Bodies. Jones, Dale E., et al. 2002. Congregations and Membership in the United States 2000. Nashville, TN: Glenmary Research Center. Graphs represent county-level data
Food Environment Statistics: Number of grocery stores : 530Orange County :
1.78 / 10,000 pop.California :
2.14 / 10,000 pop.
Number of supercenters and club stores : 18Here :
0.06 / 10,000 pop.California :
0.04 / 10,000 pop.
Number of convenience stores (no gas) : 147Here :
0.49 / 10,000 pop.State :
0.62 / 10,000 pop.
Number of convenience stores (with gas) : 434Here :
1.46 / 10,000 pop.California :
1.49 / 10,000 pop.
Number of full-service restaurants : 2,438Orange County :
8.19 / 10,000 pop.California :
7.42 / 10,000 pop.
Adult diabetes rate : Orange County :
6.3%State :
7.3%
Low-income preschool obesity rate : Health and Nutrition:
Average overall health of teeth and gums : Average BMI : Orange:
28.0California:
28.1
People feeling badly about themselves : Here:
19.6%California:
20.2%
People not drinking alcohol at all : Here:
10.3%California:
11.2%
Average hours sleeping at night : This city:
6.8California:
6.8
General health condition : Orange:
57.7%California:
56.4%
Average condition of hearing : This city:
81.0%State:
80.9%
More about Health and Nutrition of Orange, CA Residents
Local government employment and payroll (March 2022)
Function
Full-time employees
Monthly full-time payroll
Average yearly full-time wage
Part-time employees
Monthly part-time payroll
Police Protection - Officers
148 $1,828,484 $148,255 0 $0 Firefighters
113 $1,680,973 $178,510 0 $0 Police - Other
73 $555,584 $91,329 30 $53,615 Streets and Highways
53 $461,875 $104,575 2 $7,166 Water Supply
36 $301,088 $100,363 0 $0 Financial Administration
34 $283,173 $99,943 3 $12,937 Parks and Recreation
28 $224,187 $96,080 23 $49,597 Local Libraries
26 $192,222 $88,718 37 $62,496 Other and Unallocable
22 $158,264 $86,326 2 $3,971 Housing and Community Development (Local)
19 $171,826 $108,522 0 $0 Other Government Administration
18 $183,233 $122,155 1 $2,103 Fire - Other
12 $102,785 $102,785 1 $4,199 Sewerage
10 $77,171 $92,605 0 $0 Judicial and Legal
7 $98,653 $169,119 0 $0 Natural Resources
2 $15,352 $92,112 0 $0
Totals for Government
601 $6,334,868 $126,487 99 $196,085
Orange government finances - Expenditure in 2021 (per resident):
Construction - Regular Highways: $20,215,000 ($148.45)
General - Other: $8,024,000 ($58.92)Police Protection: $6,861,000 ($50.38)Parks and Recreation: $5,167,000 ($37.94)Housing and Community Development: $3,021,000 ($22.18)Local Fire Protection: $1,102,000 ($8.09)Central Staff Services: $493,000 ($3.62)General Public Buildings: $296,000 ($2.17)Libraries: $32,000 ($0.23)Financial Administration: $1,000 ($0.01)Current Operations - Police Protection: $51,594,000 ($378.87)
Water Utilities: $32,747,000 ($240.47)Local Fire Protection: $25,226,000 ($185.24)Central Staff Services: $17,783,000 ($130.59)Health - Other: $13,069,000 ($95.97)Regular Highways: $10,120,000 ($74.31)Parks and Recreation: $8,340,000 ($61.24)Sewerage: $5,378,000 ($39.49)Libraries: $4,984,000 ($36.60)Financial Administration: $3,376,000 ($24.79)Protective Inspection and Regulation - Other: $2,785,000 ($20.45)Judicial and Legal Services: $924,000 ($6.79)Housing and Community Development: $641,000 ($4.71)General - Other: $293,000 ($2.15)General - Interest on Debt: $1,896,000 ($13.92)
Other Capital Outlay - Central Staff Services: $2,822,000 ($20.72)
General - Other: $599,000 ($4.40)Police Protection: $442,000 ($3.25)Local Fire Protection: $138,000 ($1.01)Health - Other: $48,000 ($0.35)Libraries: $21,000 ($0.15)Regular Highways: $8,000 ($0.06)Financial Administration: $5,000 ($0.04)Parks and Recreation: $4,000 ($0.03)
Orange government finances - Revenue in 2021 (per resident):
Charges - Other: $11,611,000 ($85.26)
Sewerage: $8,013,000 ($58.84)Parks and Recreation: $305,000 ($2.24)Federal Intergovernmental - Other: $21,267,000 ($156.17)
Housing and Community Development: $2,095,000 ($15.38)Local Intergovernmental - Other: $752,000 ($5.52)
Miscellaneous - General Revenue - Other: $9,994,000 ($73.39)
Rents: $1,607,000 ($11.80)Interest Earnings: $1,503,000 ($11.04)Fines and Forfeits: $1,482,000 ($10.88)Donations From Private Sources: $94,000 ($0.69)Revenue - Water Utilities: $38,900,000 ($285.66)
State Intergovernmental - Other: $5,714,000 ($41.96)
Highways: $4,732,000 ($34.75)General Local Government Support: $119,000 ($0.87)Tax - General Sales and Gross Receipts: $55,521,000 ($407.71)
Property: $46,032,000 ($338.03)Other License: $3,435,000 ($25.22)Occupation and Business License - Other: $3,098,000 ($22.75)Public Utilities Sales: $2,791,000 ($20.50)Other Selective Sales: $1,834,000 ($13.47)Documentary and Stock Transfer: $1,036,000 ($7.61)
Orange government finances - Debt in 2021 (per resident):
Long Term Debt - Outstanding Unspecified Public Purpose: $363,876,000 ($2672.06)
Issue, Unspecified Public Purpose: $316,415,000 ($2323.54)Beginning Outstanding - Unspecified Public Purpose: $50,009,000 ($367.23)Retired Unspecified Public Purpose: $2,548,000 ($18.71)
Orange government finances - Cash and Securities in 2021 (per resident):
Bond Funds - Cash and Securities: $264,567,000 ($1942.80)
Other Funds - Cash and Securities: $89,152,000 ($654.67)
Sinking Funds - Cash and Securities: $5,856,000 ($43.00)
4.86% of this county's 2021 resident taxpayers lived in other counties in 2020 ($95,983 average adjusted gross income )
Here:
4.86%California average:
5.19%
0.01% of residents moved from foreign countries ($132 average AGI )Orange County:
0.01%California average:
0.03%
Top counties from which taxpayers relocated into this county between 2020 and 2021:
5.71% of this county's 2020 resident taxpayers moved to other counties in 2021 ($106,828 average adjusted gross income )
Here:
5.71%California average:
6.14%
0.01% of residents moved to foreign countries ($180 average AGI )Orange County:
0.01%California average:
0.02%
Top counties to which taxpayers relocated from this county between 2020 and 2021:
Businesses in Orange, CA
Name Count Name Count
24 Hour Fitness 2 Kroger 2 7-Eleven 7 LA Fitness 1 99 Cents Only Stores 1 Lane Furniture 2 AT&T 2 Levi Strauss & Co. 1 Ace Hardware 2 Little Caesars Pizza 2 Aeropostale 1 MasterBrand Cabinets 9 Albertsons 3 Mazda 1 American Eagle Outfitters 1 McDonald's 6 Ann Taylor 1 Men's Wearhouse 1 Arby's 1 Motel 6 1 AutoZone 3 New Balance 2 Avenue 1 Nike 22 Bakers 1 Nissan 1 Barnes & Noble 1 Office Depot 1 Baskin-Robbins 4 Old Navy 2 Bath & Body Works 2 Olive Garden 1 Best Western 2 Pac Sun 2 Big O Tires 1 Panera Bread 1 Blockbuster 2 Papa John's Pizza 2 Burger King 2 Payless 2 CVS 3 Penske 1 Carl\s Jr. 5 Pier 1 Imports 1 Casual Male XL 1 Pizza Hut 3 Chevrolet 1 Quiznos 3 Chick-Fil-A 1 RadioShack 3 Chipotle 1 Red Robin 1 Chuck E. Cheese's 1 Rite Aid 1 Circle K 1 Ryder Rental & Truck Leasing 1 Cold Stone Creamery 1 SAS Shoes 1 Curves 2 Safeway 1 DHL 2 Sears 2 Dairy Queen 1 Skechers USA 1 Decora Cabinetry 4 Spencer Gifts 1 Dennys 3 Sprint Nextel 3 Domino's Pizza 3 Staples 2 El Pollo Loco 3 Starbucks 5 Extended Stay America 1 Subway 3 Famous Footwear 1 T-Mobile 4 FedEx 24 T.G.I. Driday's 1 Firestone Complete Auto Care 1 T.J.Maxx 1 Forever 21 1 Taco Bell 2 Fredericks Of Hollywood 1 Target 1 GNC 3 Torrid 1 GameStop 3 Toyota 1 Gymboree 1 Trader Joe's 1 H&M 1 True Value 1 H&R Block 6 U-Haul 6 Haagen-Dazs 1 UPS 25 Hilton 3 Vans 6 Home Depot 2 Verizon Wireless 4 Hot Topic 1 Victoria's Secret 1 IHOP 1 Volkswagen 1 JCPenney 1 Vons 1 Jack In The Box 3 Walgreens 3 Jamba Juice 3 Walmart 1 Johnny Rockets 1 Wendy's 2 Jones New York 3 Wet Seal 2 Just Tires 1 YMCA 1 KFC 2
Strongest AM radio stations in Orange:
KFI (640 AM; 50 kW; LOS ANGELES, CA; Owner: CAPSTAR TX LIMITED PARTNERSHIP)
KPLS (830 AM; 50 kW; ORANGE, CA; Owner: CRN LICENSES, LLC)
KTNQ (1020 AM; 50 kW; LOS ANGELES, CA; Owner: KTNQ-AM LICENSE CORP.)
KLAC (570 AM; 50 kW; LOS ANGELES, CA; Owner: AMFM RADIO LICENSES, L.L.C.)
KXTA (1150 AM; 50 kW; LOS ANGELES, CA; Owner: CITICASTERS LICENSES, L.P.)
KVNR (1480 AM; 5 kW; SANTA ANA, CA; Owner: LBI RADIO LICENSE CORP.)
KDIS (1110 AM; 50 kW; PASADENA, CA; Owner: ABC,INC.)
KFWB (980 AM; 50 kW; LOS ANGELES, CA; Owner: INFINITY BROADCASTING OPERATIONS, INC.)
KNX (1070 AM; 50 kW; LOS ANGELES, CA; Owner: INFINITY BROADCASTING OPERATIONS, INC.)
KMPC (1540 AM; 50 kW; LOS ANGELES, CA; Owner: ROSE CITY RADIO CORPORATION)
KSPN (710 AM; 50 kW; LOS ANGELES, CA; Owner: KABC-AM RADIO, INC.)
KBLA (1580 AM; 50 kW; SANTA MONICA, CA)
KXMX (1190 AM; 25 kW; ANAHEIM, CA; Owner: NEW INSPIRATION BROADCASTING COMPANY)
Strongest FM radio stations in Orange:
KFSH-FM (95.9 FM; ANAHEIM, CA; Owner: NEW INSPIRATION BROADCASTING COMPANY)
KWIZ (96.7 FM; SANTA ANA, CA; Owner: LBI RADIO LICENSE CORP.)
KALI-FM (106.3 FM; SANTA ANA, CA; Owner: KALI-FM, INC.)
KWVE (107.9 FM; SAN CLEMENTE, CA; Owner: CALVARY CHAPEL OF COSTA MESA)
KEBN (94.3 FM; GARDEN GROVE, CA; Owner: LBI RADIO LICENSE CORP.)
KCBS-FM (93.1 FM; LOS ANGELES, CA; Owner: INFINITY BROADCASTING OPERATIONS, INC.)
KSCA (101.9 FM; GLENDALE, CA; Owner: HBC LICENSE CORPORATION)
KDLE (103.1 FM; NEWPORT BEACH, CA; Owner: ENTRAVISION HOLDINGS, LLC.)
KLOS (95.5 FM; LOS ANGELES, CA; Owner: KLOS-FM RADIO, INC.)
K212FA (90.3 FM; TEMPLE CITY, CA; Owner: EDUCATIONAL MEDIA FOUNDATION)
KOST (103.5 FM; LOS ANGELES, CA; Owner: CAPSTAR TX LIMITED PARTNERSHIP)
KZLA-FM (93.9 FM; LOS ANGELES, CA; Owner: EMMIS RADIO LICENSE CORPORATION)
KPWR (105.9 FM; LOS ANGELES, CA; Owner: EMMIS RADIO LICENSE CORPORATION)
KIIS-FM (102.7 FM; LOS ANGELES, CA; Owner: CITICASTERS LICENSES, L.P.)
KLVE (107.5 FM; LOS ANGELES, CA; Owner: KLVE-FM LICENSE CORP.)
KLSX (97.1 FM; LOS ANGELES, CA; Owner: INFINITY BROADCASTING OPERATIONS, INC.)
KPCC (89.3 FM; PASADENA, CA; Owner: PASADENA AREA COMMUNITY COLLEGE DISTRICT)
KHHT (92.3 FM; LOS ANGELES, CA; Owner: AMFM RADIO LICENSES, L.L.C.)
KBIG-FM (104.3 FM; LOS ANGELES, CA; Owner: AMFM RADIO LICENSES, L.L.C.)
KUSC (91.5 FM; LOS ANGELES, CA; Owner: UNIVERSITY OF SOUTHERN CALIFORNIA)
TV broadcast stations around Orange:
KTRO-LP (Channel 50; LANCASTER, CA; Owner: ROBERT D. ADELMAN)
KCBS-TV (Channel 2; LOS ANGELES, CA; Owner: CBS BROADCASTING INC.)
KHIZ (Channel 64; BARSTOW, CA; Owner: SUNBELT TELEVISION, INC.)
KNBC (Channel 4; LOS ANGELES, CA; Owner: NBC SUBSIDIARY (KNBC-TV), INC.)
National Bridge Inventory (NBI) Statistics 68 Number of bridges1,132ft / 345m Total length $16,226,000 Total costs4,982,021 Total average daily traffic259,342 Total average daily truck traffic
New bridges - historical statistics
4 1930-1939 1 1940-1949 3 1950-1959 28 1960-1969 11 1970-1979 4 1980-1989 5 1990-1999 12 2000-2009
See full National Bridge Inventory statistics for Orange, CA
Home Mortgage Disclosure Act Aggregated Statistics For Year 2009(Based on 17 full and 15 partial tracts) A) FHA, FSA/RHS & VA B) Conventional C) Refinancings D) Home Improvement Loans E) Loans on Dwellings For 5+ Families F) Non-occupant Loans on G) Loans On Manufactured Number Average Value Number Average Value Number Average Value Number Average Value Number Average Value Number Average Value Number Average Value
LOANS ORIGINATED 366 $387,778 658 $360,777 2,681 $335,833 119 $275,369 3 $721,783 219 $298,588 10 $79,731 APPLICATIONS APPROVED, NOT ACCEPTED 28 $339,444 90 $398,827 292 $363,132 16 $99,183 0 $0 34 $274,212 8 $81,538 APPLICATIONS DENIED 78 $386,315 133 $397,601 753 $388,730 53 $145,473 1 $500,000 81 $282,488 12 $84,499 APPLICATIONS WITHDRAWN 58 $373,309 117 $397,665 500 $356,424 21 $175,370 0 $0 49 $309,702 3 $91,623 FILES CLOSED FOR INCOMPLETENESS 12 $363,553 26 $335,387 156 $374,476 5 $141,470 0 $0 14 $369,311 1 $92,760
Aggregated Statistics For Year 2008(Based on 17 full and 15 partial tracts) A) FHA, FSA/RHS & VA B) Conventional C) Refinancings D) Home Improvement Loans E) Loans on Dwellings For 5+ Families F) Non-occupant Loans on G) Loans On Manufactured Number Average Value Number Average Value Number Average Value Number Average Value Number Average Value Number Average Value Number Average Value
LOANS ORIGINATED 177 $383,722 854 $376,481 1,209 $361,173 141 $180,039 10 $3,329,071 207 $319,239 19 $75,509 APPLICATIONS APPROVED, NOT ACCEPTED 20 $365,036 179 $370,499 257 $360,844 40 $210,010 0 $0 42 $334,175 25 $78,334 APPLICATIONS DENIED 49 $437,586 287 $386,297 745 $420,437 150 $171,981 1 $593,390 84 $334,923 30 $75,342 APPLICATIONS WITHDRAWN 38 $378,977 192 $344,944 283 $384,847 30 $209,261 3 $889,903 43 $361,303 1 $140,970 FILES CLOSED FOR INCOMPLETENESS 7 $403,770 60 $400,826 114 $401,190 13 $129,825 0 $0 20 $463,481 0 $0
Aggregated Statistics For Year 2007(Based on 17 full and 15 partial tracts) A) FHA, FSA/RHS & VA B) Conventional C) Refinancings D) Home Improvement Loans E) Loans on Dwellings For 5+ Families F) Non-occupant Loans on G) Loans On Manufactured Number Average Value Number Average Value Number Average Value Number Average Value Number Average Value Number Average Value Number Average Value
LOANS ORIGINATED 0 $0 1,210 $418,750 2,362 $412,313 399 $248,519 13 $2,528,797 332 $396,299 39 $67,153 APPLICATIONS APPROVED, NOT ACCEPTED 0 $0 346 $362,710 569 $408,060 62 $258,072 1 $2,107,610 78 $386,545 45 $87,451 APPLICATIONS DENIED 0 $0 561 $418,827 1,303 $452,007 201 $289,198 2 $456,265 139 $443,204 42 $68,381 APPLICATIONS WITHDRAWN 1 $125,850 206 $414,633 542 $431,661 79 $266,225 1 $1,240,000 55 $428,034 1 $110,150 FILES CLOSED FOR INCOMPLETENESS 0 $0 87 $417,768 213 $444,516 17 $298,598 0 $0 23 $407,146 0 $0
Aggregated Statistics For Year 2006(Based on 17 full and 15 partial tracts) B) Conventional C) Refinancings D) Home Improvement Loans E) Loans on Dwellings For 5+ Families F) Non-occupant Loans on G) Loans On Manufactured Number Average Value Number Average Value Number Average Value Number Average Value Number Average Value Number Average Value
LOANS ORIGINATED 1,854 $403,358 3,368 $395,483 574 $259,836 19 $1,545,586 450 $394,594 25 $65,333 APPLICATIONS APPROVED, NOT ACCEPTED 394 $371,690 631 $422,620 83 $234,323 0 $0 78 $405,836 37 $66,344 APPLICATIONS DENIED 769 $396,000 1,325 $438,412 249 $272,114 0 $0 142 $404,213 35 $98,351 APPLICATIONS WITHDRAWN 401 $395,652 962 $411,974 114 $280,661 1 $600,000 100 $384,912 1 $176,720 FILES CLOSED FOR INCOMPLETENESS 102 $381,039 280 $396,484 25 $263,489 0 $0 20 $364,418 0 $0
Aggregated Statistics For Year 2005(Based on 17 full and 15 partial tracts) A) FHA, FSA/RHS & VA B) Conventional C) Refinancings D) Home Improvement Loans E) Loans on Dwellings For 5+ Families F) Non-occupant Loans on G) Loans On Manufactured Number Average Value Number Average Value Number Average Value Number Average Value Number Average Value Number Average Value Number Average Value
LOANS ORIGINATED 3 $248,687 2,270 $390,562 4,158 $379,780 621 $238,800 26 $1,740,254 488 $373,179 29 $93,716 APPLICATIONS APPROVED, NOT ACCEPTED 0 $0 359 $373,816 604 $373,446 63 $221,268 0 $0 81 $379,056 38 $79,076 APPLICATIONS DENIED 0 $0 645 $383,616 1,365 $420,440 237 $223,583 2 $434,445 145 $412,221 63 $96,728 APPLICATIONS WITHDRAWN 0 $0 428 $376,291 1,209 $374,313 120 $232,064 1 $675,000 93 $378,625 17 $84,141 FILES CLOSED FOR INCOMPLETENESS 0 $0 113 $413,810 302 $507,102 31 $237,075 0 $0 21 $432,462 1 $293,400
Aggregated Statistics For Year 2004(Based on 17 full and 15 partial tracts) A) FHA, FSA/RHS & VA B) Conventional C) Refinancings D) Home Improvement Loans E) Loans on Dwellings For 5+ Families F) Non-occupant Loans on G) Loans On Manufactured Number Average Value Number Average Value Number Average Value Number Average Value Number Average Value Number Average Value Number Average Value
LOANS ORIGINATED 6 $243,073 2,252 $358,498 5,385 $325,674 543 $216,872 16 $2,506,506 511 $316,016 34 $73,665 APPLICATIONS APPROVED, NOT ACCEPTED 3 $203,833 413 $358,595 892 $323,538 74 $186,339 1 $1,489,740 102 $303,509 21 $90,226 APPLICATIONS DENIED 2 $116,255 589 $347,740 1,332 $341,565 221 $219,017 0 $0 132 $323,656 30 $83,552 APPLICATIONS WITHDRAWN 2 $131,650 368 $365,265 1,300 $322,624 123 $181,276 2 $590,755 84 $306,600 2 $115,300 FILES CLOSED FOR INCOMPLETENESS 0 $0 93 $335,253 367 $342,664 41 $126,785 0 $0 29 $277,661 2 $39,655
Aggregated Statistics For Year 2003(Based on 17 full and 15 partial tracts) A) FHA, FSA/RHS & VA B) Conventional C) Refinancings D) Home Improvement Loans E) Loans on Dwellings For 5+ Families F) Non-occupant Loans on Number Average Value Number Average Value Number Average Value Number Average Value Number Average Value Number Average Value
LOANS ORIGINATED 70 $228,831 2,555 $299,890 11,078 $263,588 229 $103,748 26 $1,449,230 769 $241,399 APPLICATIONS APPROVED, NOT ACCEPTED 3 $180,980 345 $303,040 1,381 $263,623 44 $80,763 0 $0 118 $261,542 APPLICATIONS DENIED 7 $239,151 478 $283,875 1,776 $268,844 140 $73,732 5 $457,484 138 $254,306 APPLICATIONS WITHDRAWN 6 $303,890 290 $308,757 1,768 $258,437 55 $94,648 0 $0 93 $237,090 FILES CLOSED FOR INCOMPLETENESS 4 $199,268 106 $310,571 370 $270,309 13 $136,480 0 $0 26 $233,971
Aggregated Statistics For Year 2002(Based on 11 full and 13 partial tracts) A) FHA, FSA/RHS & VA B) Conventional C) Refinancings D) Home Improvement Loans E) Loans on Dwellings For 5+ Families F) Non-occupant Loans on Number Average Value Number Average Value Number Average Value Number Average Value Number Average Value Number Average Value
LOANS ORIGINATED 85 $191,234 1,544 $268,957 5,081 $251,793 108 $75,506 25 $940,887 359 $220,800 APPLICATIONS APPROVED, NOT ACCEPTED 12 $215,775 213 $312,619 738 $249,783 32 $40,037 0 $0 52 $213,948 APPLICATIONS DENIED 7 $170,537 300 $234,031 815 $247,468 99 $62,838 1 $962,730 53 $236,450 APPLICATIONS WITHDRAWN 10 $156,485 210 $290,804 839 $245,981 46 $39,863 3 $1,531,750 32 $249,639 FILES CLOSED FOR INCOMPLETENESS 5 $203,776 65 $309,749 308 $262,762 0 $0 1 $952,800 12 $246,036
Aggregated Statistics For Year 2001(Based on 11 full and 13 partial tracts) A) FHA, FSA/RHS & VA B) Conventional C) Refinancings D) Home Improvement Loans E) Loans on Dwellings For 5+ Families F) Non-occupant Loans on Number Average Value Number Average Value Number Average Value Number Average Value Number Average Value Number Average Value
LOANS ORIGINATED 168 $188,033 1,373 $223,845 3,624 $220,434 152 $49,795 17 $1,398,546 317 $194,390 APPLICATIONS APPROVED, NOT ACCEPTED 16 $196,623 188 $216,006 543 $218,426 45 $51,881 1 $664,000 38 $234,446 APPLICATIONS DENIED 12 $225,115 299 $187,955 841 $216,209 91 $52,298 1 $1,000,000 55 $175,970 APPLICATIONS WITHDRAWN 17 $187,564 198 $219,471 695 $208,005 44 $53,076 0 $0 34 $183,626 FILES CLOSED FOR INCOMPLETENESS 3 $211,013 47 $270,623 195 $228,240 12 $63,034 1 $1,351,170 11 $170,781
Aggregated Statistics For Year 2000(Based on 11 full and 13 partial tracts) A) FHA, FSA/RHS & VA B) Conventional C) Refinancings D) Home Improvement Loans E) Loans on Dwellings For 5+ Families F) Non-occupant Loans on Number Average Value Number Average Value Number Average Value Number Average Value Number Average Value Number Average Value
LOANS ORIGINATED 199 $168,872 1,318 $217,891 864 $174,124 170 $45,304 13 $1,982,208 121 $177,331 APPLICATIONS APPROVED, NOT ACCEPTED 14 $194,749 191 $218,830 192 $177,824 60 $37,712 0 $0 21 $192,181 APPLICATIONS DENIED 32 $179,042 380 $182,641 469 $175,036 95 $30,419 1 $88,320 42 $173,835 APPLICATIONS WITHDRAWN 24 $169,360 200 $224,859 241 $134,384 23 $64,546 4 $1,179,150 12 $219,738 FILES CLOSED FOR INCOMPLETENESS 8 $165,202 56 $204,354 117 $205,926 5 $58,394 3 $1,939,850 5 $186,192
Aggregated Statistics For Year 1999(Based on 14 full and 16 partial tracts) A) FHA, FSA/RHS & VA B) Conventional C) Refinancings D) Home Improvement Loans E) Loans on Dwellings For 5+ Families F) Non-occupant Loans on Number Average Value Number Average Value Number Average Value Number Average Value Number Average Value Number Average Value
LOANS ORIGINATED 324 $159,508 1,700 $212,424 2,598 $199,011 262 $37,419 19 $1,367,033 274 $160,528 APPLICATIONS APPROVED, NOT ACCEPTED 12 $154,201 207 $209,699 529 $196,147 73 $35,287 3 $609,833 39 $146,107 APPLICATIONS DENIED 37 $161,623 451 $181,434 901 $179,771 155 $34,636 4 $160,365 69 $147,483 APPLICATIONS WITHDRAWN 42 $139,225 300 $194,934 601 $168,893 38 $46,660 2 $8,723,915 37 $137,407 FILES CLOSED FOR INCOMPLETENESS 9 $180,096 80 $241,624 236 $206,529 4 $21,175 5 $1,201,994 17 $163,008
Detailed mortgage data for all 32 tracts in Orange, CA
Private Mortgage Insurance Companies Aggregated Statistics For Year 2009(Based on 16 full and 15 partial tracts) A) Conventional B) Refinancings C) Non-occupant Loans on Number Average Value Number Average Value Number Average Value
LOANS ORIGINATED 61 $365,522 15 $380,931 1 $270,000 APPLICATIONS APPROVED, NOT ACCEPTED 37 $380,997 8 $449,000 0 $0 APPLICATIONS DENIED 19 $387,302 10 $434,717 1 $250,000 APPLICATIONS WITHDRAWN 6 $415,748 1 $258,890 1 $258,890 FILES CLOSED FOR INCOMPLETENESS 7 $379,414 1 $444,000 2 $459,430
Aggregated Statistics For Year 2008(Based on 15 full and 14 partial tracts) A) Conventional B) Refinancings C) Non-occupant Loans on Number Average Value Number Average Value Number Average Value
LOANS ORIGINATED 140 $383,751 28 $426,072 9 $375,328 APPLICATIONS APPROVED, NOT ACCEPTED 43 $397,130 33 $422,318 7 $354,949 APPLICATIONS DENIED 18 $420,379 7 $375,289 4 $361,392 APPLICATIONS WITHDRAWN 3 $280,777 5 $381,218 1 $444,000 FILES CLOSED FOR INCOMPLETENESS 3 $598,197 2 $553,815 4 $470,680
Aggregated Statistics For Year 2007(Based on 15 full and 13 partial tracts) A) Conventional B) Refinancings C) Non-occupant Loans on Number Average Value Number Average Value Number Average Value
LOANS ORIGINATED 39 $455,284 42 $472,787 2 $392,830 APPLICATIONS APPROVED, NOT ACCEPTED 8 $445,496 14 $479,920 1 $488,160 APPLICATIONS DENIED 4 $638,115 8 $618,481 0 $0 APPLICATIONS WITHDRAWN 4 $466,555 5 $380,944 0 $0 FILES CLOSED FOR INCOMPLETENESS 0 $0 0 $0 0 $0
Aggregated Statistics For Year 2006(Based on 12 full and 9 partial tracts) A) Conventional B) Refinancings C) Non-occupant Loans on Number Average Value Number Average Value Number Average Value
LOANS ORIGINATED 11 $459,635 19 $430,236 2 $438,365 APPLICATIONS APPROVED, NOT ACCEPTED 4 $494,638 5 $500,538 0 $0 APPLICATIONS DENIED 0 $0 3 $525,940 0 $0 APPLICATIONS WITHDRAWN 0 $0 5 $548,916 1 $376,490 FILES CLOSED FOR INCOMPLETENESS 0 $0 1 $294,300 0 $0
Aggregated Statistics For Year 2005(Based on 11 full and 13 partial tracts) A) Conventional B) Refinancings C) Non-occupant Loans on Number Average Value Number Average Value Number Average Value
LOANS ORIGINATED 16 $423,329 27 $428,376 1 $418,330 APPLICATIONS APPROVED, NOT ACCEPTED 3 $403,240 8 $502,204 1 $595,530 APPLICATIONS DENIED 2 $416,825 0 $0 0 $0 APPLICATIONS WITHDRAWN 2 $302,250 1 $600,000 1 $396,550 FILES CLOSED FOR INCOMPLETENESS 0 $0 0 $0 0 $0
Aggregated Statistics For Year 2004(Based on 15 full and 14 partial tracts) A) Conventional B) Refinancings C) Non-occupant Loans on Number Average Value Number Average Value Number Average Value
LOANS ORIGINATED 46 $354,549 25 $360,071 3 $339,333 APPLICATIONS APPROVED, NOT ACCEPTED 16 $354,889 27 $307,779 1 $378,000 APPLICATIONS DENIED 4 $490,395 0 $0 0 $0 APPLICATIONS WITHDRAWN 10 $469,404 4 $308,210 1 $437,000 FILES CLOSED FOR INCOMPLETENESS 3 $238,843 7 $208,926 0 $0
Aggregated Statistics For Year 2003(Based on 16 full and 15 partial tracts) A) Conventional B) Refinancings C) Non-occupant Loans on Number Average Value Number Average Value Number Average Value
LOANS ORIGINATED 146 $298,269 91 $256,272 13 $284,707 APPLICATIONS APPROVED, NOT ACCEPTED 37 $300,954 39 $253,941 2 $198,525 APPLICATIONS DENIED 3 $290,713 3 $254,053 1 $124,330 APPLICATIONS WITHDRAWN 13 $291,602 8 $261,285 4 $303,650 FILES CLOSED FOR INCOMPLETENESS 0 $0 1 $487,140 0 $0
Aggregated Statistics For Year 2002(Based on 10 full and 13 partial tracts) A) Conventional B) Refinancings C) Non-occupant Loans on Number Average Value Number Average Value Number Average Value
LOANS ORIGINATED 161 $269,416 85 $247,272 9 $197,156 APPLICATIONS APPROVED, NOT ACCEPTED 48 $220,342 52 $249,380 4 $194,600 APPLICATIONS DENIED 4 $347,042 4 $224,518 1 $266,000 APPLICATIONS WITHDRAWN 14 $217,215 13 $254,610 0 $0 FILES CLOSED FOR INCOMPLETENESS 1 $196,950 1 $246,520 0 $0
Aggregated Statistics For Year 2001(Based on 10 full and 13 partial tracts) A) Conventional B) Refinancings C) Non-occupant Loans on Number Average Value Number Average Value Number Average Value
LOANS ORIGINATED 187 $232,029 138 $233,069 11 $183,235 APPLICATIONS APPROVED, NOT ACCEPTED 52 $223,942 46 $226,052 6 $161,562 APPLICATIONS DENIED 7 $218,203 10 $238,794 0 $0 APPLICATIONS WITHDRAWN 14 $199,534 7 $208,347 2 $237,200 FILES CLOSED FOR INCOMPLETENESS 1 $217,590 3 $216,100 0 $0
Aggregated Statistics For Year 2000(Based on 11 full and 13 partial tracts) A) Conventional B) Refinancings C) Non-occupant Loans on Number Average Value Number Average Value Number Average Value
LOANS ORIGINATED 225 $211,616 60 $216,903 15 $177,241 APPLICATIONS APPROVED, NOT ACCEPTED 55 $211,933 30 $215,727 1 $114,810 APPLICATIONS DENIED 17 $203,047 5 $229,896 1 $137,670 APPLICATIONS WITHDRAWN 11 $235,569 1 $247,210 2 $202,000 FILES CLOSED FOR INCOMPLETENESS 1 $346,130 0 $0 0 $0
Aggregated Statistics For Year 1999(Based on 14 full and 16 partial tracts) A) Conventional B) Refinancings C) Non-occupant Loans on Number Average Value Number Average Value Number Average Value
LOANS ORIGINATED 375 $209,648 199 $192,020 13 $166,485 APPLICATIONS APPROVED, NOT ACCEPTED 49 $221,530 72 $189,609 7 $148,979 APPLICATIONS DENIED 29 $204,377 18 $205,297 1 $151,790 APPLICATIONS WITHDRAWN 11 $203,678 9 $214,531 0 $0 FILES CLOSED FOR INCOMPLETENESS 1 $185,000 4 $275,612 0 $0
Fire-safe hotels and motels in Orange, California:
Hilton Suites Anaheim/Orange, 400 N State College Blvd, Orange, California 92868 Phone: (714) 938-1111, Fax: (714) 704-2323
DoubleTree by Hilton Hotel Anaheim - Orange County, 100 The City Dr, Orange, California 92868 Phone: (714) 634-4500, Fax: (714) 978-3839
Residence Inn Orange, 201 N State College Blvd, Orange, California 92668 Phone: (714) 978-7700
Motel 6, #1004, 2920 W Chapman, Orange, California 92668 Phone: (714) 634-2441
Extended Stay America - Orange County - Katella Ave, 1635 W Katella Ave, Orange, California 92867 Phone: (714) 639-8608, Fax: (714) 639-8472
Quality Suites, 3101 W Chapman Ave, Orange, California 92868 Phone: (714) 456-0007, Fax: (714) 456-0008
BW Meridian Inn & Suites, 720 The City Drive S, Orange, California 92868 Phone: (714) 740-2700, Fax: (714) 971-1692
Ayres Hotel Orange, 200 N The City Dr, Orange, California 92868 Phone: (714) 919-7940, Fax: (714) 919-7945
Doubletree Anaheim Orange, 100 The City Dr, Orange, California 92868 Phone: (800) 488-9031
All 9 fire-safe hotels and motels in Orange, California
Most common first names in Orange, CA among deceased individuals Name Count Lived (average)
Robert 194 75.0 years Mary 173 82.5 years John 160 76.6 years William 137 77.6 years James 131 73.9 years Helen 96 86.1 years Richard 93 70.6 years Dorothy 88 82.9 years Ruth 84 84.1 years George 80 79.0 years
Most common last names in Orange, CA among deceased individuals Last name Count Lived (average)
Smith 61 79.8 years Nguyen 43 78.1 years Johnson 39 82.7 years Miller 35 80.3 years Williams 34 75.4 years Lee 32 80.2 years Martinez 30 78.6 years Jones 29 76.3 years Brown 25 79.9 years Anderson 23 80.0 years
Orange compared to California state average:
Unemployed percentage significantly below state average. Black race population percentage significantly below state average. Institutionalized population percentage above state average. Percentage of population with a bachelor's degree or higher above state average. Orange, CA compared to other similar cities:
#4 on the list of "Top 101 cities with the highest cost per building permit(population 50,000+)"
#15 on the list of "Top 101 cities with fewest building permits per 10,000 residents (population 50,000+)"
#22 on the list of "Top 101 cities with largest percentage of females in occupations: personal care and service occupations (population 50,000+)"
#30 on the list of "Top 100 cities with highest median household income and median resident age less than 35 (pop. 50,000+)"
#35 on the list of "Top 101 cities with largest percentage of males in industries: administrative and support and waste management services (population 50,000+)"
#44 on the list of "Top 101 cities with the lowest number of rapes per 100,000 residents (population 50,000+)"
#48 on the list of "Top 101 cities with the most residents born in Other Western Europe (population 500+)"
#49 on the list of "Top 101 cities with the lowest number of assaults per 100,000 residents (population 50,000+)"
#59 on the list of "Top 101 cities with the lowest average snowfall in a year (population 50,000+)"
#61 on the list of "Top 101 cities with the most mentions on city-data.com forum"
#61 on the list of "Top 100 safest cities (lowest city-data.com crime index) (pop. 50,000+)"
#63 on the list of "Top 101 cities with largest percentage of males in occupations: healthcare support occupations (population 50,000+)"
#63 on the list of "Top 101 cities with largest percentage of males in occupations: installation, maintenance, and repair occupations (population 50,000+)"
#63 on the list of "Top 101 cities with the lowest city-data.com crime index (population 50,000+)"
#71 on the list of "Top 100 cities with the largest percentage of males (pop. 50,000+)"
#74 on the list of "Top 100 low-educated but high-earning cities (pop. 50,000+)"
#76 on the list of "Top 101 cities with the lowest average yearly precipitation (population 50,000+)"
#80 on the list of "Top 101 cities with largest percentage of males in occupations: health technologists and technicians (population 50,000+)"
#83 on the list of "Top 100 cities with highest median house value (pop. 50,000+)"
#95 on the list of "Top 101 cities with the highest percentage of family households, population 100,000+"
#4 on the list of "Top 101 counties with the highest total withdrawal of fresh water for public supply"
#5 on the list of "Top 101 counties with the most Catholic adherents"
#6 on the list of "Top 101 counties with the highest ground withdrawal of fresh water for public supply"
#7 on the list of "Top 101 counties with the most Evangelical Protestant adherents"
#8 on the list of "Top 101 counties with the highest Particulate Matter (PM2.5 ) Annual air pollution readings in 2012 (µg/m3 )"
Top Patent Applicants
Peter Piferi (39)
Brian S. Conklin (25)
Tommy Yu (23)
Xiaoping Jin (21)
Terry Blansfield (20)
Ajay Shah (19)
Alex Habibvand (18)
Wade Wan (17)
Wade Keith Wan (15)
Wade K. Wan (15)
Total of 1329 patent applications in 2008-2024.


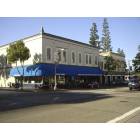

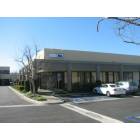
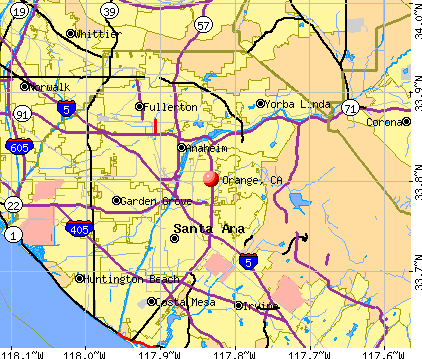


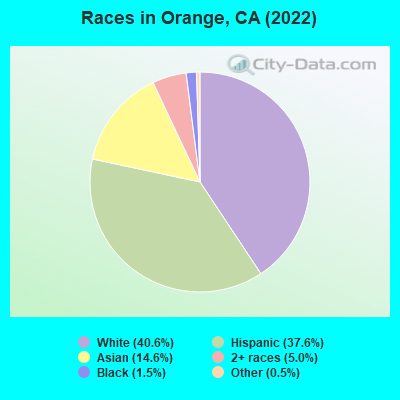
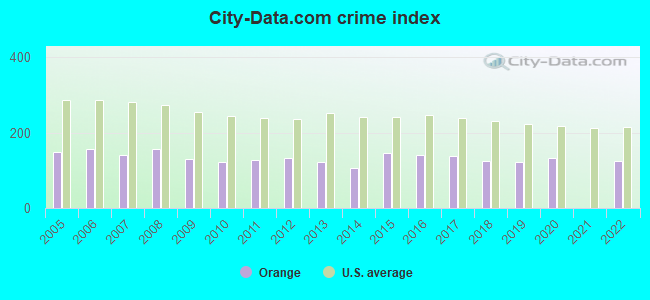
 Recent articles from our blog. Our writers, many of them Ph.D. graduates or candidates, create easy-to-read articles on a wide variety of topics.

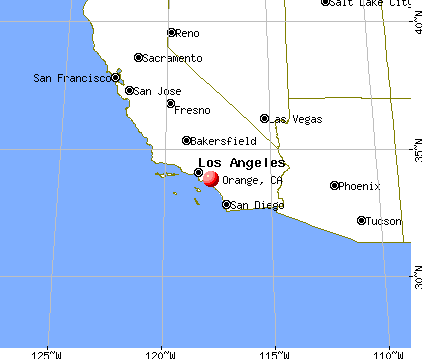
 (4.0 miles
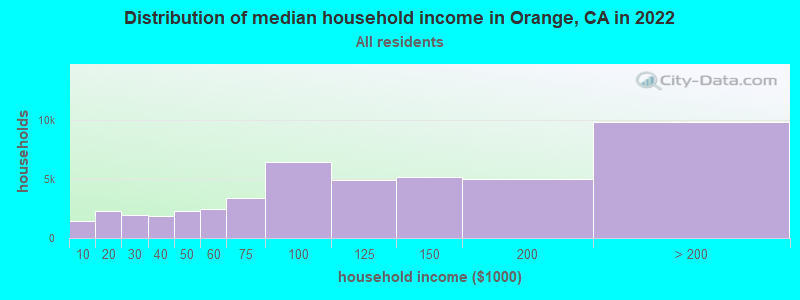
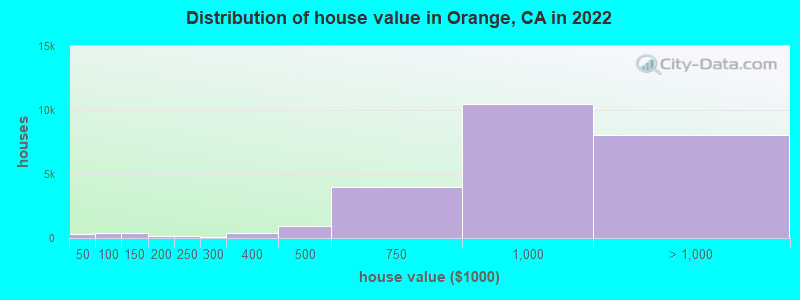
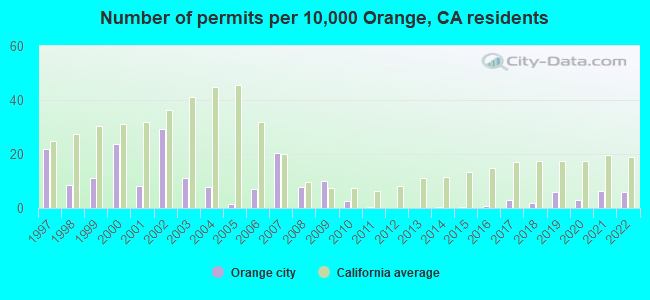
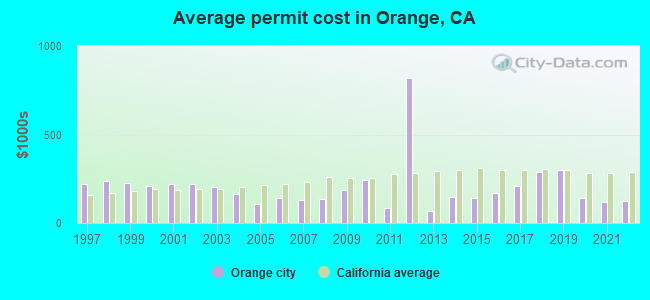
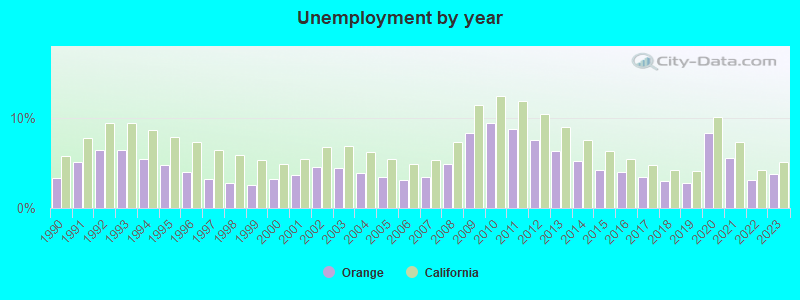
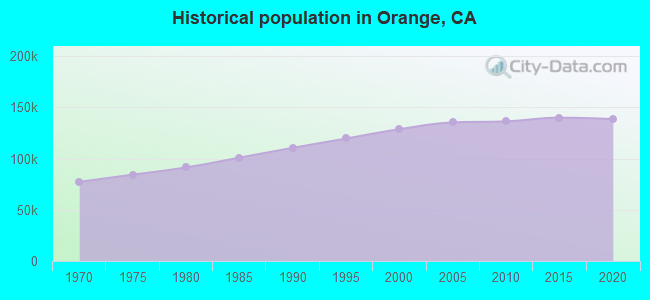
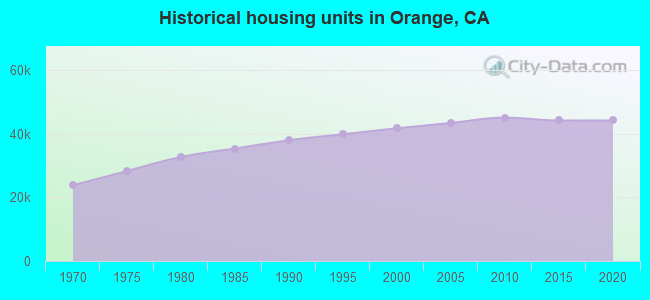
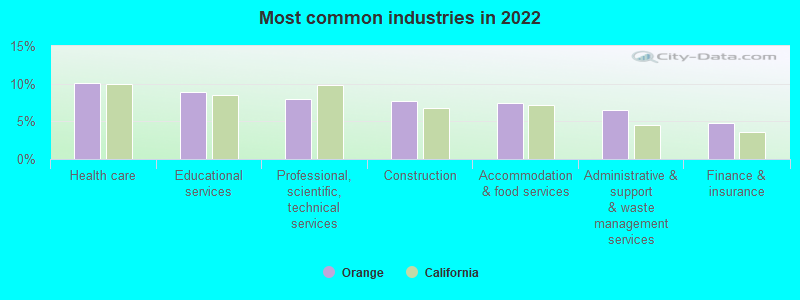
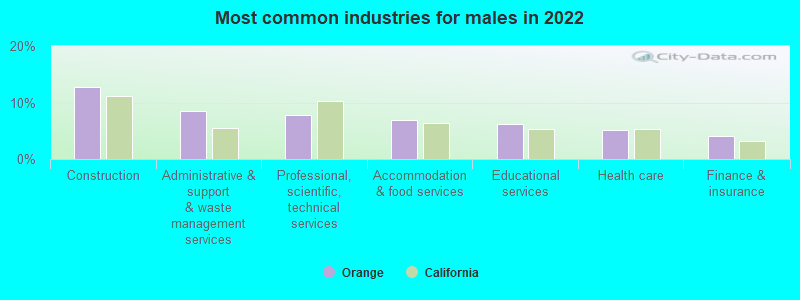
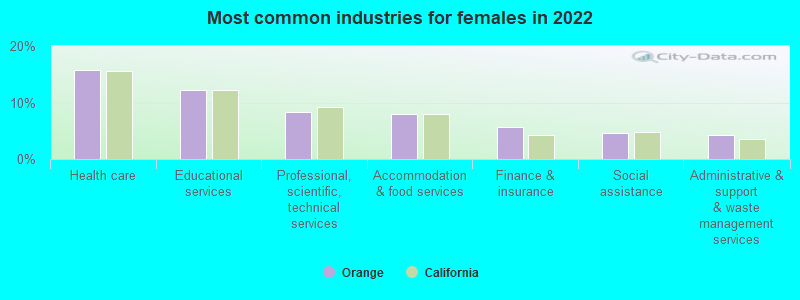
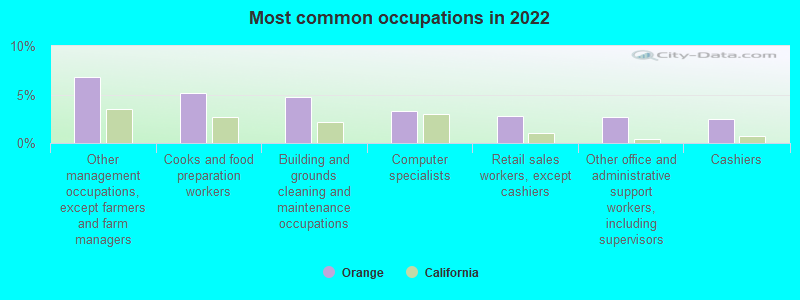
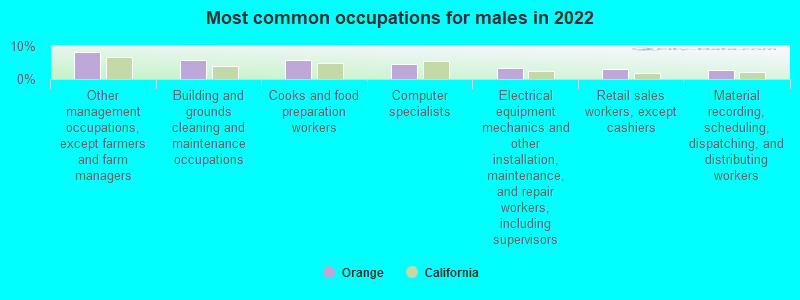
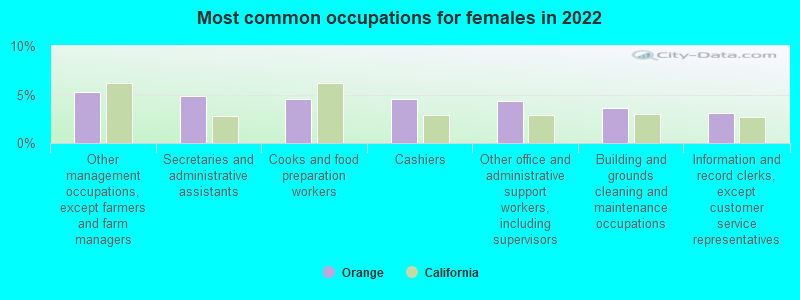

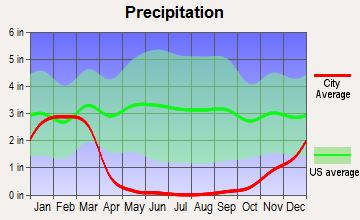
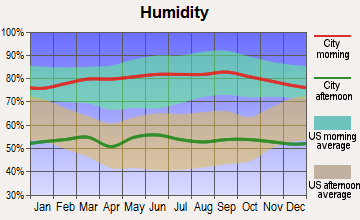
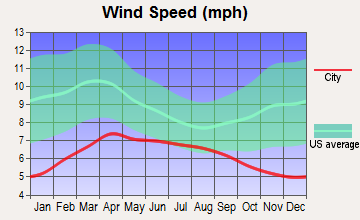
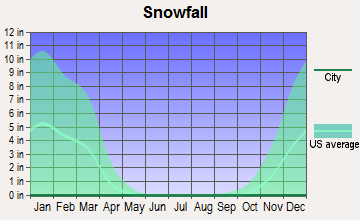
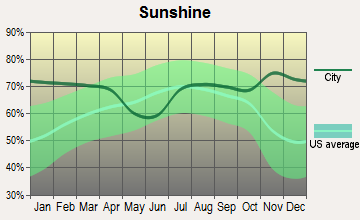
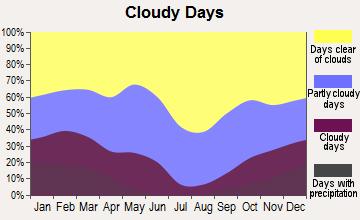


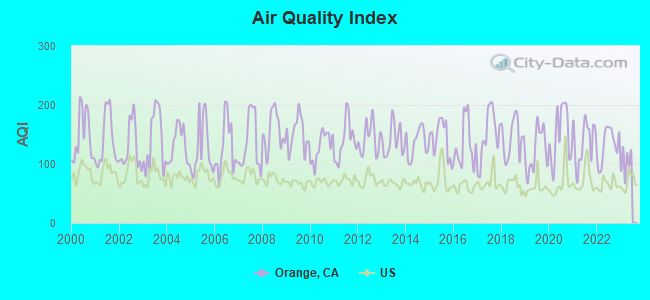
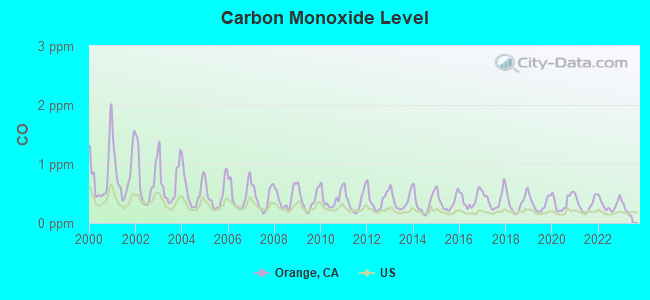
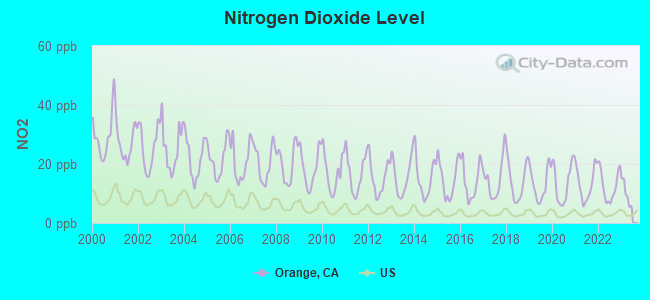
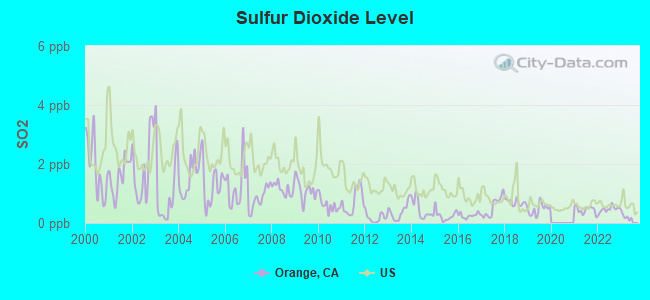
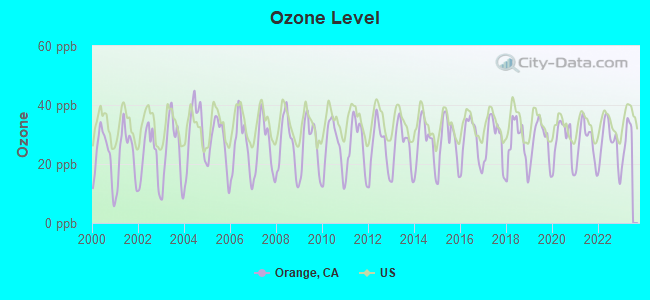
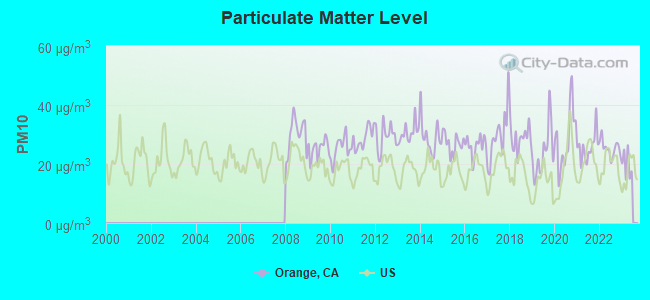
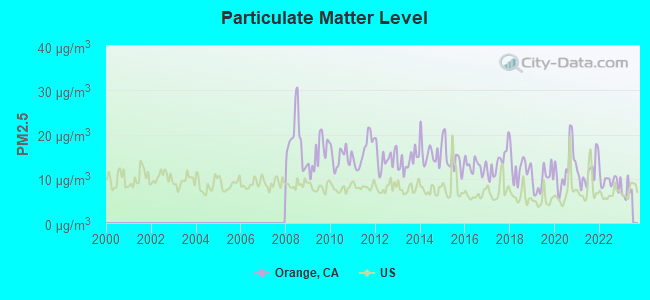
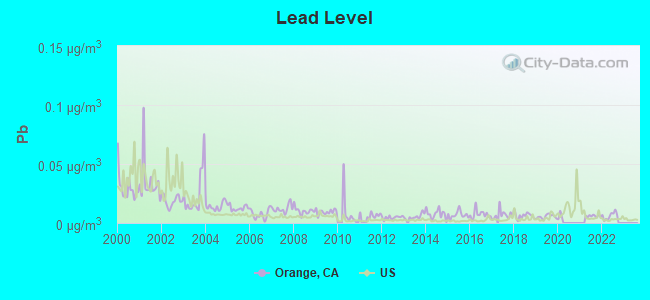
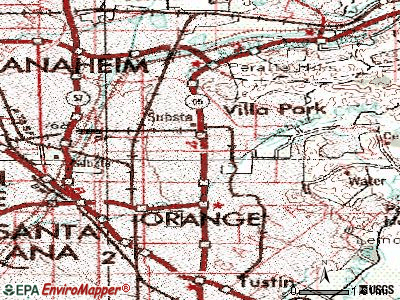
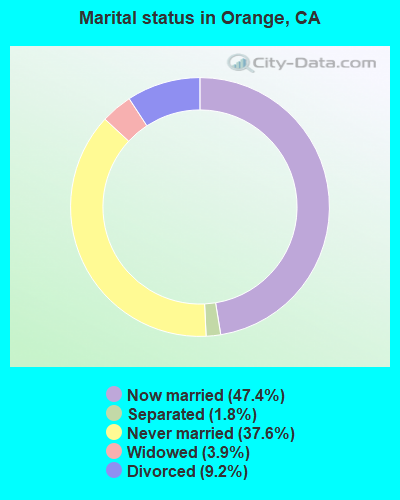
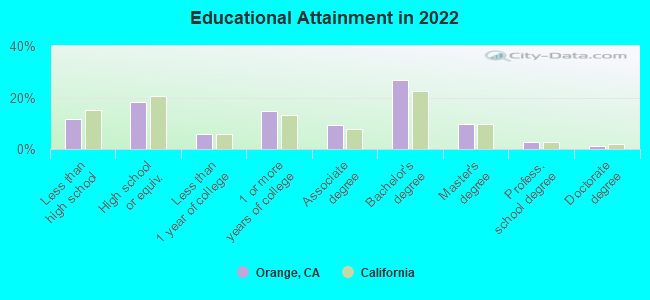
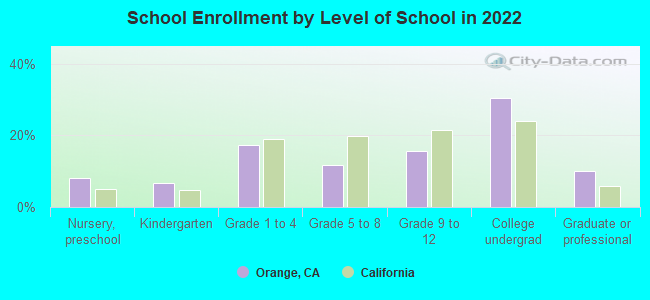
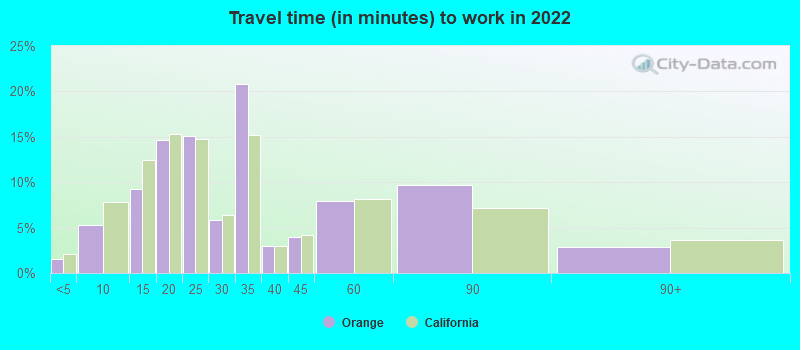
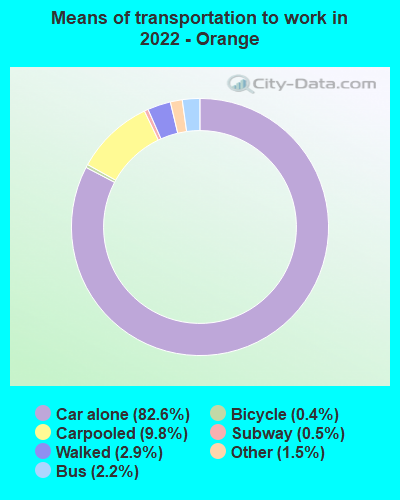


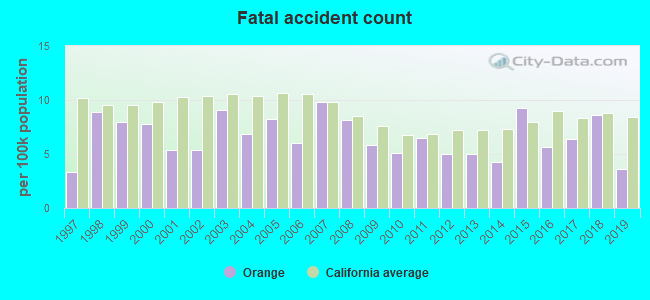
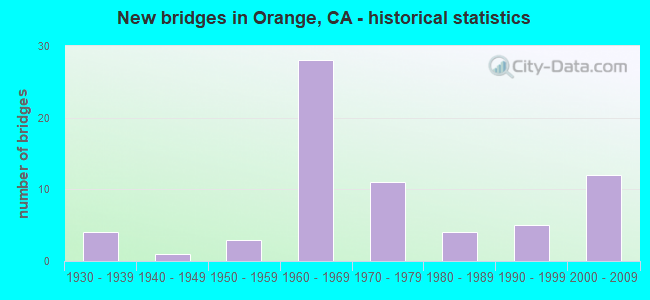
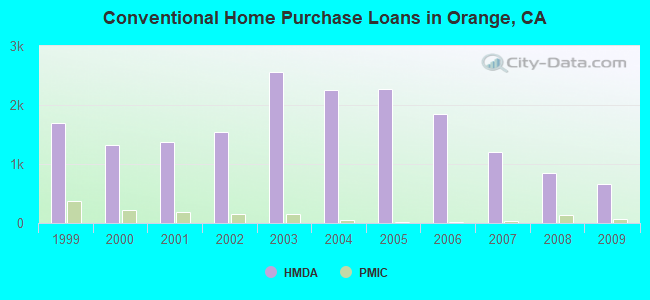
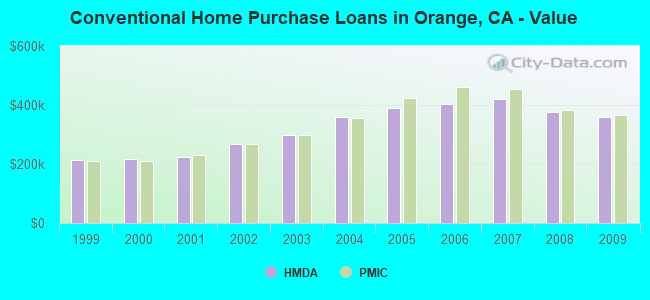
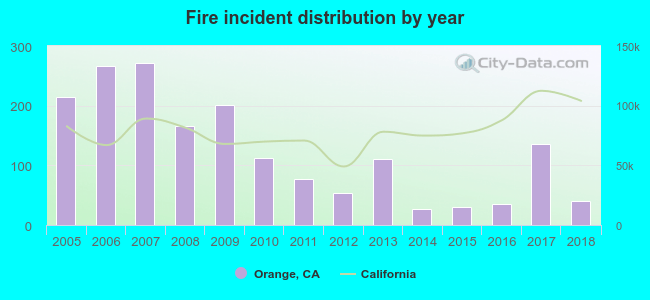 According to the data from the years 2005 - 2018 the average number of fires per year is 124. The highest number of reported fire incidents - 272 took place in 2007, and the least - 26 in 2014. The data has a declining trend.
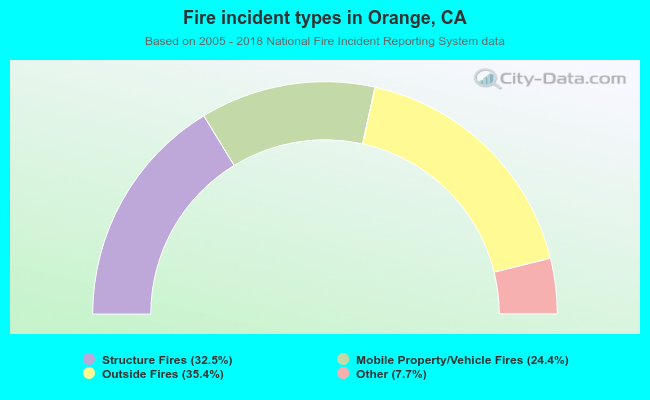 When looking into fire subcategories, the most incidents belonged to: Outside Fires (35.4%), and Structure Fires (32.5%).