Estimated zip code population in 2022: 25,809 Zip code population in 2010: 25,876 Zip code population in 2000: 24,891
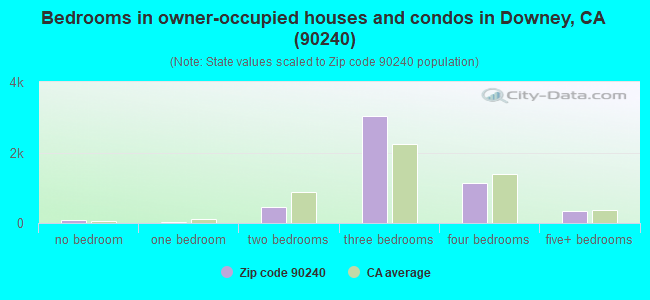
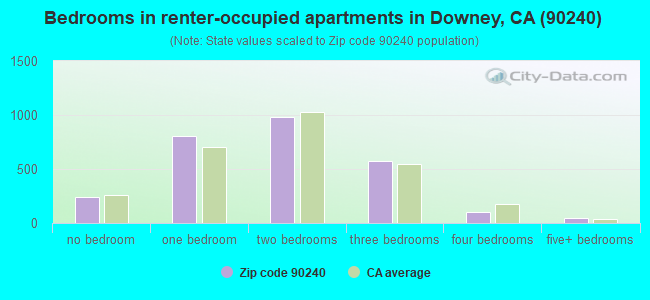
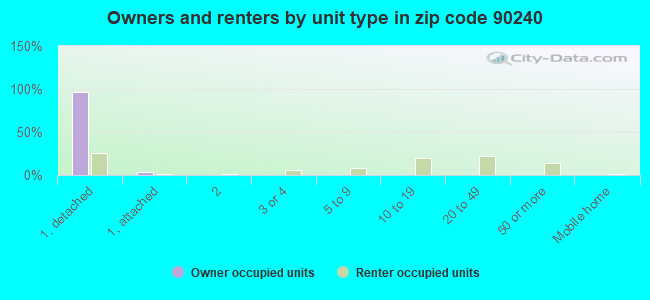
Houses and condos: 8,098 Renter-occupied apartments: 2,753
% of renters here:
35%
State:
44%
March 2022 cost of living index in zip code 90240: 133.5 (high, U.S. average is 100)
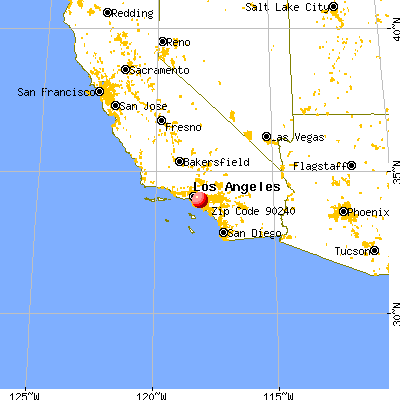
Land area: 2.9 sq. mi. Water area: 0.1 sq. mi.
Population density: 8,767 people per square mile
(high).
OSM Map
General Map
Google Map
MSN Map
OSM Map
General Map
Google Map
MSN Map
OSM Map
General Map
Google Map
MSN Map
OSM Map
General Map
Google Map
MSN Map
Please wait while loading the map...
Real estate property taxes paid for housing units in 2022:
This zip code:
0.7% ($5,562)
California:
0.7% ($4,831)
Median real estate property taxes paid for housing units with mortgages in 2022: $6,080 (0.8%) Median real estate property taxes paid for housing units with no mortgage in 2022: $4,857 (0.6%)
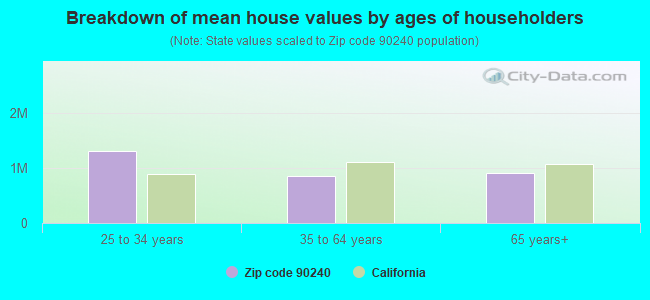
Estimated median house/condo value in 2022: $771,713
90240:
$771,713
California:
$715,900
According to our research of California and other state lists, there were 17 registered sex offenders living in 90240 zip code as of April 27, 2024. The ratio of all residents to sex offenders in zip code 90240 is 1,577 to 1. The ratio of registered sex offenders to all residents in this zip code is lower than the state average.
Median resident age:
This zip code:
39.3 years
California median age:
37.9 years
Average household size:
This zip code:
3.3 people
California:
2.8 people
Averages for the 2020 tax year for zip code 90240, filed in 2021:
Average Adjusted Gross Income (AGI) in 2020: $72,109 (Individual Income Tax Returns)
Here:
$72,109
State:
$95,910
Salary/wage: $61,360 (reported on 79.9% of returns)
Here:
$61,360
State:
$77,331
(% of AGI for various income ranges: 1181.8% for AGIs below $25k, 3949.7% for AGIs $25k-50k, 7576.4% for AGIs $50k-75k, 10514.7% for AGIs $75k-100k, 21767.0% for AGIs $100k-200k, 70223.9% for AGIs over 200k)
Taxable interest for individuals: $1,273 (reported on 33.5% of returns)
This zip code:
$1,273
California:
$2,294
(% of AGI for various income ranges: 11.7% for AGIs below $25k, 19.4% for AGIs $25k-50k, 46.7% for AGIs $50k-75k, 53.6% for AGIs $75k-100k, 157.1% for AGIs $100k-200k, 1254.4% for AGIs over 200k)
Ordinary dividends: $5,329 (reported on 11.6% of returns)
Here:
$5,329
State:
$10,949
(% of AGI for various income ranges: 10.5% for AGIs below $25k, 15.4% for AGIs $25k-50k, 45.6% for AGIs $50k-75k, 61.6% for AGIs $75k-100k, 171.0% for AGIs $100k-200k, 2597.2% for AGIs over 200k)
Net capital gain/loss in AGI: +$26,534 (reported on 12.9% of returns)
Here:
+$26,534
State:
+$49,306
(% of AGI for various income ranges: 10.0% for AGIs below $25k, 9.0% for AGIs $25k-50k, 59.4% for AGIs $50k-75k, 94.6% for AGIs $75k-100k, 480.1% for AGIs $100k-200k, 21033.9% for AGIs over 200k)
Profit/loss from business: +$13,249 (reported on 20.6% of returns)
Here:
+$13,249
State:
+$15,671
(% of AGI for various income ranges: 236.4% for AGIs below $25k, 245.5% for AGIs $25k-50k, 339.9% for AGIs $50k-75k, 372.3% for AGIs $75k-100k, 677.0% for AGIs $100k-200k, 5483.3% for AGIs over 200k)
Taxable individual retirement arrangement distribution: $18,498 (reported on 4.4% of returns)
90240:
$18,498
California:
$23,505
(% of AGI for various income ranges: 26.1% for AGIs below $25k, 55.1% for AGIs $25k-50k, 75.6% for AGIs $50k-75k, 197.0% for AGIs $75k-100k, 430.0% for AGIs $100k-200k, 1127.2% for AGIs over 200k)
Self-employed (Keogh) retirement plans: $26,400 (reported on 0.2% of returns)
90240:
$26,400
California:
$30,163
(% of AGI for various income ranges: 80.0% for AGIs $100k-200k)
Total itemized deductions: $32,938 (reported on 19.8% of returns)
Here:
$32,938
State:
$39,517
(% of AGI for various income ranges: 123.0% for AGIs below $25k, 288.0% for AGIs $25k-50k, 875.8% for AGIs $50k-75k, 1412.2% for AGIs $75k-100k, 3280.5% for AGIs $100k-200k, 11460.0% for AGIs over 200k)
Charity contributions: $6,264 (reported on 16.4% of returns)
Here:
$6,264
State:
$12,598
(% of AGI for various income ranges: 5.5% for AGIs below $25k, 35.2% for AGIs $25k-50k, 107.6% for AGIs $50k-75k, 183.6% for AGIs $75k-100k, 476.0% for AGIs $100k-200k, 2751.7% for AGIs over 200k)
Taxes paid: $9,061 (reported on 19.8% of returns)
90240:
$9,061
State:
$8,807
(% of AGI for various income ranges: 28.0% for AGIs below $25k, 77.2% for AGIs $25k-50k, 256.5% for AGIs $50k-75k, 431.9% for AGIs $75k-100k, 979.0% for AGIs $100k-200k, 2541.1% for AGIs over 200k)
Earned income credit: $2,020 (reported on 14.8% of returns)
Here:
$2,020
State:
$2,074
(% of AGI for various income ranges: 90.8% for AGIs below $25k, 66.8% for AGIs $25k-50k)
Percentage of individuals using paid preparers for their 2020 taxes: 91.9%
Here:
92%
State:
92%
(% for various income ranges: 90.8% for AGIs below $25k, 92.1% for AGIs $25k-50k, 92.6% for AGIs $50k-75k, 92.9% for AGIs $75k-100k, 92.1% for AGIs $100k-200k, 94.2% for AGIs over 200k)
Averages for the 2012 tax year for zip code 90240, filed in 2013:
Average Adjusted Gross Income (AGI) in 2012: $57,684 (Individual Income Tax Returns)
Here:
$57,684
State:
$72,726
Salary/wage: $50,411 (reported on 79.8% of returns)
Here:
$50,411
State:
$59,079
(% of AGI for various income ranges: 69.7% for AGIs below $25k, 80.1% for AGIs $25k-50k, 78.5% for AGIs $50k-75k, 76.9% for AGIs $75k-100k, 77.8% for AGIs $100k-200k, 38.7% for AGIs over 200k)
Taxable interest for individuals: $1,526 (reported on 35.1% of returns)
This zip code:
$1,526
California:
$2,146
(% of AGI for various income ranges: 1.0% for AGIs below $25k, 0.4% for AGIs $25k-50k, 0.7% for AGIs $50k-75k, 0.8% for AGIs $75k-100k, 0.9% for AGIs $100k-200k, 1.5% for AGIs over 200k)
Ordinary dividends: $4,844 (reported on 11.7% of returns)
Here:
$4,844
State:
$9,308
(% of AGI for various income ranges: 0.8% for AGIs below $25k, 0.5% for AGIs $25k-50k, 0.8% for AGIs $50k-75k, 0.8% for AGIs $75k-100k, 0.9% for AGIs $100k-200k, 1.7% for AGIs over 200k)
Net capital gain/loss in AGI: +$9,583 (reported on 10.2% of returns)
Here:
+$9,583
State:
+$30,460
(% of AGI for various income ranges: 0.4% for AGIs $50k-75k, 0.5% for AGIs $75k-100k, 0.8% for AGIs $100k-200k, 6.9% for AGIs over 200k)
Profit/loss from business: +$16,088 (reported on 19.7% of returns)
Here:
+$16,088
State:
+$17,064
(% of AGI for various income ranges: 16.1% for AGIs below $25k, 7.6% for AGIs $25k-50k, 4.8% for AGIs $50k-75k, 2.9% for AGIs $75k-100k, 3.1% for AGIs $100k-200k, 5.2% for AGIs over 200k)
Taxable individual retirement arrangement distribution: $17,931 (reported on 6.5% of returns)
90240:
$17,931
California:
$19,557
(% of AGI for various income ranges: 2.0% for AGIs below $25k, 1.5% for AGIs $25k-50k, 2.1% for AGIs $50k-75k, 1.5% for AGIs $75k-100k, 2.1% for AGIs $100k-200k, 2.7% for AGIs over 200k)
Self-employment retirement plans: $16,800 (reported on 0.3% of returns)
90240:
$16,800
California:
$24,530
Total itemized deductions: $28,979 (28% of AGI, reported on 39.3% of returns)
Here:
$28,979
State:
$34,004
Here:
28.1% of AGI
State:
22.7% of AGI
(% of AGI for various income ranges: 11.4% for AGIs below $25k, 15.3% for AGIs $25k-50k, 20.7% for AGIs $50k-75k, 23.2% for AGIs $75k-100k, 23.1% for AGIs $100k-200k, 18.5% for AGIs over 200k)
Charity contributions: $3,414 (reported on 32.3% of returns)
Here:
$3,414
State:
$4,659
(% of AGI for various income ranges: 0.5% for AGIs below $25k, 1.3% for AGIs $25k-50k, 1.9% for AGIs $50k-75k, 2.3% for AGIs $75k-100k, 2.3% for AGIs $100k-200k, 2.1% for AGIs over 200k)
Taxes paid: $9,525 (reported on 39.2% of returns)
90240:
$9,525
State:
$14,448
(% of AGI for various income ranges: 2.2% for AGIs below $25k, 3.5% for AGIs $25k-50k, 5.5% for AGIs $50k-75k, 6.9% for AGIs $75k-100k, 8.1% for AGIs $100k-200k, 8.8% for AGIs over 200k)
Earned income credit: $2,264 (reported on 19.5% of returns)
Here:
$2,264
State:
$2,286
(% of AGI for various income ranges: 7.1% for AGIs below $25k, 1.2% for AGIs $25k-50k)
Percentage of individuals using paid preparers for their 2012 taxes: 73.5%
Here:
74%
State:
64%
(% for various income ranges: 69.1% for AGIs below $25k, 72.9% for AGIs $25k-50k, 76.9% for AGIs $50k-75k, 77.9% for AGIs $75k-100k, 78.6% for AGIs $100k-200k, 84.8% for AGIs over 200k)
Averages for the 2004 tax year for zip code 90240, filed in 2005:
Average Adjusted Gross Income (AGI) in 2004: $56,250 (Individual Income Tax Returns)
Here:
$56,250
State:
$58,600
Salary/wage: $44,362 (reported on 79.2% of returns)
Here:
$44,362
State:
$49,455
(% of AGI for various income ranges: 184.5% for AGIs below $10k, 72.2% for AGIs $10k-25k, 79.5% for AGIs $25k-50k, 79.4% for AGIs $50k-75k, 77.1% for AGIs $75k-100k, 43.0% for AGIs over 100k)
Taxable interest for individuals: $2,571 (reported on 46.6% of returns)
This zip code:
$2,571
California:
$2,365
(% of AGI for various income ranges: 13.2% for AGIs below $10k, 2.1% for AGIs $10k-25k, 1.6% for AGIs $25k-50k, 1.5% for AGIs $50k-75k, 1.7% for AGIs $75k-100k, 2.5% for AGIs over 100k)
Taxable dividends: $3,931 (reported on 17.3% of returns)
Here:
$3,931
State:
$4,746
(% of AGI for various income ranges: 3.8% for AGIs below $10k, 0.9% for AGIs $10k-25k, 0.9% for AGIs $25k-50k, 0.8% for AGIs $50k-75k, 0.8% for AGIs $75k-100k, 1.6% for AGIs over 100k)
Net capital gain/loss: +$39,736 (reported on 15.2% of returns)
Here:
+$39,736
State:
+$23,418
(% of AGI for various income ranges: -1.1% for AGIs below $10k, 0.0% for AGIs $10k-25k, 1.0% for AGIs $25k-50k, 1.0% for AGIs $50k-75k, 1.3% for AGIs $75k-100k, 22.3% for AGIs over 100k)
Profit/loss from business: +$15,856 (reported on 20.6% of returns)
Here:
+$15,856
State:
+$16,826
(% of AGI for various income ranges: 26.7% for AGIs below $10k, 12.5% for AGIs $10k-25k, 7.4% for AGIs $25k-50k, 5.7% for AGIs $50k-75k, 4.6% for AGIs $75k-100k, 4.3% for AGIs over 100k)
IRA payment deduction: $3,241 (reported on 3.0% of returns)
90240:
$3,241
California:
$3,192
(% of AGI for various income ranges: 1.1% for AGIs below $10k, 0.2% for AGIs $10k-25k, 0.3% for AGIs $25k-50k, 0.2% for AGIs $50k-75k, 0.2% for AGIs $75k-100k, 0.1% for AGIs over 100k)
Self-employed pension: $13,952 (reported on 0.6% of returns)
Here:
$13,952
California:
$17,688
Total itemized deductions: $26,031 (27% of AGI, reported on 43.8% of returns)
Here:
$26,031
State:
$28,113
Here:
26.6% of AGI
State:
25.3% of AGI
(% of AGI for various income ranges: 31.3% for AGIs below $10k, 18.0% for AGIs $10k-25k, 20.3% for AGIs $25k-50k, 25.5% for AGIs $50k-75k, 26.2% for AGIs $75k-100k, 16.9% for AGIs over 100k)
Charity contributions deductions: $3,538 (3% of AGI, reported on 38.3% of returns)
Here:
$3,538
State:
$3,923
Here:
3.5% of AGI
State:
3.3% of AGI
(% of AGI for various income ranges: 1.3% for AGIs below $10k, 1.2% for AGIs $10k-25k, 1.9% for AGIs $25k-50k, 2.7% for AGIs $50k-75k, 2.9% for AGIs $75k-100k, 2.5% for AGIs over 100k)
Total tax: $8,919 (reported on 76.3% of returns)
90240:
$8,919
State:
$10,761
(% of AGI for various income ranges: 10.2% for AGIs below $10k, 4.5% for AGIs $10k-25k, 6.3% for AGIs $25k-50k, 8.0% for AGIs $50k-75k, 8.9% for AGIs $75k-100k, 17.7% for AGIs over 100k)
Earned income credit: $1,748 (reported on 15.6% of returns)
Here:
$1,748
State:
$1,763
Percentage of individuals using paid preparers for their 2004 taxes: 75.1%
Here:
75%
State:
66%
(% for various income ranges: 65.8% for AGIs below $10k, 74.4% for AGIs $10k-25k, 75.4% for AGIs $25k-50k, 78.6% for AGIs $50k-75k, 79.8% for AGIs $75k-100k, 81.3% for AGIs over 100k)
Household received Food Stamps/SNAP in the past 12 months: 569 Household did not receive Food Stamps/SNAP in the past 12 months: 7,159
Women who had a birth in the past 12 months: 312 (192 now married, 120 unmarried) Women who did not have a birth in the past 12 months: 5,922 (2,317 now married, 3,606 unmarried)
Housing units in zip code 90240 with a mortgage: 3,548 (480 second mortgage, 23 home equity loan, 296 both second mortgage and home equity loan) Median monthly owner costs for units with a mortgage: $3,063 Median monthly owner costs for units without a mortgage: $699
Residents with income below the poverty level in 2022:
This zip code:
9.8%
Whole state:
12.2%
Residents with income below 50% of the poverty level in 2022:
This zip code:
5.1%
Whole state:
6.2%
Median number of rooms in houses and condos:
Here:
6.0
State:
6.0
Median number of rooms in apartments:
Here:
3.9
State:
3.9
Notable locations in this zip code not listed on our city pages
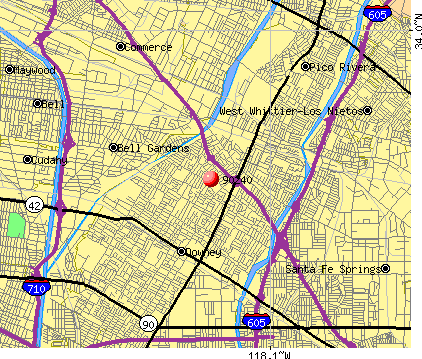
Notable locations in zip code 90240: City of Downey Fire Department Station 4 (A), City of Downey Fire Department Station 3 (B). Display/hide their locations on the map
Churches in zip code 90240 include: Christ Lutheran Church (A), New Living Way Church (B), Los Angeles Southern Baptist Church (C), La Vina Christian Center (D), Immanuel Armenian Church (E), Seventh Day Adventist Church (F), Downey Memorial Christian Church (G), Trinity Baptist Church (H), Downey Bible Church Reformed (I). Display/hide their locations on the map
In group quarters: 80 (-1 institutionalized population)
Size of family households: 1,558 2-persons, 1,654 3-persons, 1,691 4-persons, 900 5-persons, 303 6-persons, 213 7-or-more-persons
Size of nonfamily households: 1,202 1-person, 183 2-persons, 39 3-persons
3,363 married couples with children.
1,435 single-parent households (505 men, 930 women).
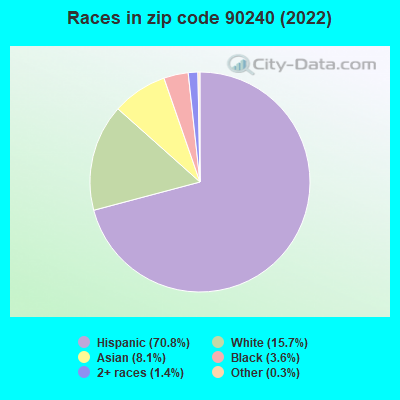
38.0% of residents of 90240 zip code speak English at home.
52.6% of residents speak Spanish at home (72% very well, 14% well, 10% not well, 4% not at all).
3.1% of residents speak other Indo-European language at home (57% very well, 16% well, 21% not well, 6% not at all).
5.8% of residents speak Asian or Pacific Island language at home (47% very well, 24% well, 27% not well, 2% not at all).
0.8% of residents speak other language at home (65% very well, 4% well, 30% not well).
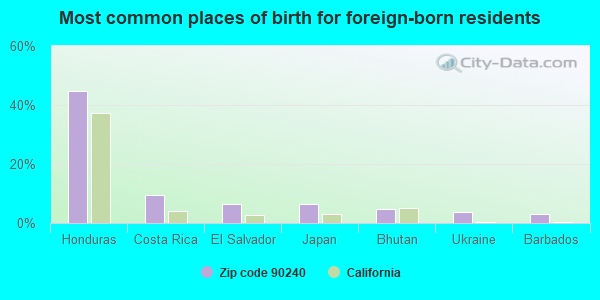
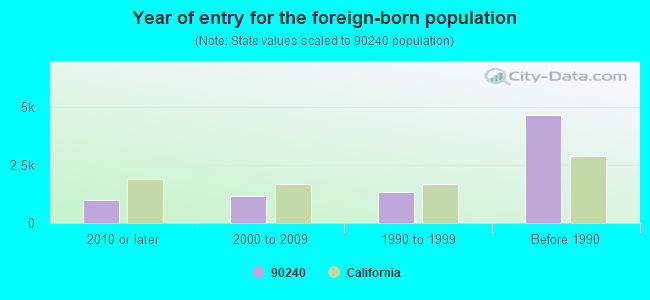
Foreign born population: 8,101 (31.4%) (69.8% of them are naturalized citizens)
Facilities with environmental interests located in this zip code:
EQUILON ENTERPRISES (7360 E FLORENCE in DOWNEY, CA) . Federal Facility
STATE MASTER (California - Hazardous Waste Tracking) - HAZARDOU WASTE PROGRAM Small Quantity Generators, between 100 kg and 1000 kg of hazardous waste/month (Resource Conservation and Recovery Act (tracking hazardous waste)) - notification Organizations: EQUILON ENTERPRISES L L C (CONTACT/OWNER)
Alternative names: SHELL
EXXON MOBIL OIL CORP (9000 TELEGRAPH RD in DOWNEY, CA)
HAZARDOUS WASTE BIENNIAL REPORTER (Resource Conservation and Recovery Act (tracking hazardous waste)) Large Quantity Generators, more that 1000 kg of hazardous waste/month (Resource Conservation and Recovery Act (tracking hazardous waste))
CALIFORNIA TRUCK EQUIP CO (12351 BELLFLOWER BLVD in DOWNEY, CA)
CRITERIA AND HAZARDOUS AIR POLLUTANT INVENTORY (Inventory of air pollution sources) Small Quantity Generators, between 100 kg and 1000 kg of hazardous waste/month (Resource Conservation and Recovery Act (tracking hazardous waste)) - notification Business SIC classification: TRUCK AND BUS BODIES Business NAICS classification: MOTOR VEHICLE BODY MANUFACTURING. Organizations: RODERICK LYNCH (CONTACT/OWNER)
Alternative names: CAL TRUCK EQUIP CO
FORTUNES CHEVRON & TOWING INC (8140 E TELEGRAPH RD in DOWNEY, CA)
Small Quantity Generators, between 100 kg and 1000 kg of hazardous waste/month (Resource Conservation and Recovery Act (tracking hazardous waste)) - notification Organizations: THOMAS FORTUNE (CONTACT/OWNER)
L & P EQUIPMENT (8836 LAKEWOOD BLVD in DOWNEY, CA)
Small Quantity Generators, between 100 kg and 1000 kg of hazardous waste/month (Resource Conservation and Recovery Act (tracking hazardous waste)) - notification Organizations: LAWRENCE STUFF (CONTACT/OWNER)
F H P DOWNEY SENIOR CENTER (8311 E FLORENCE AVE in DOWNEY, CA)
Small Quantity Generators, between 100 kg and 1000 kg of hazardous waste/month (Resource Conservation and Recovery Act (tracking hazardous waste)) - notification Organizations: F H P INC (CONTACT/OWNER)
CHEVRON STATION 92436 (10030 LAKEWOOD BLVD in DOWNEY, CA)
Small Quantity Generators, between 100 kg and 1000 kg of hazardous waste/month (Resource Conservation and Recovery Act (tracking hazardous waste)) - notification Organizations: CHEVRON PRODUCTS CO (CONTACT/OWNER)
MODEL CLEANERS (8001 E FLORENCE AVE in DOWNEY, CA)
Small Quantity Generators, between 100 kg and 1000 kg of hazardous waste/month (Resource Conservation and Recovery Act (tracking hazardous waste)) - notification Organizations: HYANG MI KU (CONTACT/OWNER)
FLORENTINE APARTMENTS (9070 FLORENCE AVENUE in DOWNEY, CA)
COMPLIANCE ACTIVITY (Tracking inspections of insecticide, fungicide, and rodenticide, and toxic substances)
GLEN HAVEN APARTMENTS (8250 TELEGRAPH in DOWNEY, CA)
COMPLIANCE ACTIVITY (Tracking inspections of insecticide, fungicide, and rodenticide, and toxic substances)
Housing units lacking complete kitchen facilities: 0.8%
69.5%Utility gas
17.0%Electricity
10.1%No fuel used
2.1%Bottled, tank, or LP gas
1.2%Solar energy
Population in 1990: 20,273. Population change in the 1990s: +4,618 (+22.8%).
Place of birth for U.S.-born residents:
This state: 16,194
Northeast: 606
Midwest: 311
South: 284
West: 204
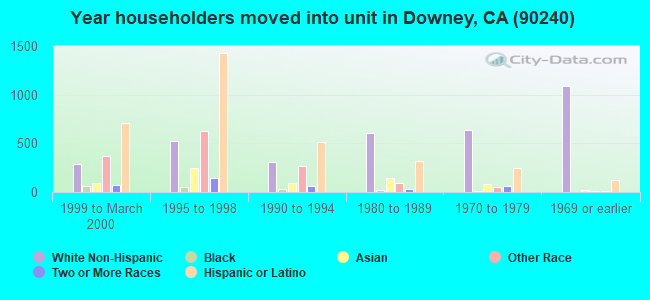
57% of the 90240 zip code residents lived in the same house 5 years ago. Out of people who lived in different houses, 91% lived in this county. Out of people who lived in different counties, 50% lived in California.
95% of the 90240 zip code residents lived in the same house 1 year ago. Out of people who lived in different houses, 84% moved from this county. Out of people who lived in different houses, 9% moved from different county within same state. Out of people who lived in different houses, 8% moved from different state. Out of people who lived in different houses, 1% moved from abroad.
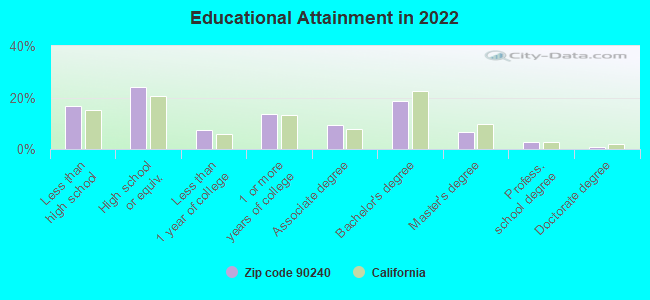
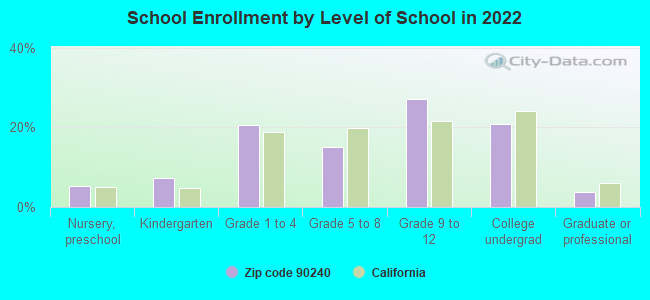
Private vs. public school enrollment:
Students in private schools in grades 1 to 8 (elementary and middle school): 455
Here:
19.5%
California:
10.5%
Students in private schools in grades 9 to 12 (high school): 150
Here:
8.6%
California:
8.5%
Students in private undergraduate colleges: 294
Here:
21.7%
California:
15.9%
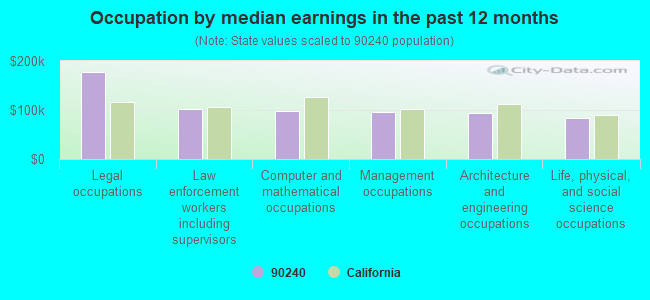
Occupation by median earnings in the past 12 months ($)
177,549Legal occupations
102,254Law enforcement workers including supervisors
98,176Computer and mathematical occupations
95,501Management occupations
94,777Architecture and engineering occupations
83,992Life, physical, and social science occupations
Top industries in this zip code by the number of employees in 2005:
Health Care and Social Assistance: Offices of Physicians (except Mental Health Specialists) (500-999 employees: 1 establishment, 20-49 employees: 5 establishments, 10-19 employees: 1 establishment, 5-9 employees: 7 establishments, 1-4 employees: 21 establishments)
Administrative and Support and Waste Management and Remediation Services: Temporary Help Services (500-999: 1, 50-99: 1, 20-49: 2, 1-4: 1)
2005 - 2018 National Fire Incident Reporting System (NFIRS) incidents
Based on the data from the years 2005 - 2018 the average number of fire incidents per year is 22. The highest number of reported fire incidents - 50 took place in 2016, and the least - 0 in 2008. The data has a declining trend.
When looking into fire subcategories, the most incidents belonged to: Outside Fires (54.2%), and Mobile Property/Vehicle Fires (22.9%).
Fire incident types reported to NFIRS in Zip Code 90240


 Nearest zip codes: 90241, 90242, 90660, 90040, 90201, 90606.


 . Federal Facility

 Based on the data from the years 2005 - 2018 the average number of fire incidents per year is 22. The highest number of reported fire incidents - 50 took place in 2016, and the least - 0 in 2008. The data has a declining trend.
 When looking into fire subcategories, the most incidents belonged to: Outside Fires (54.2%), and Mobile Property/Vehicle Fires (22.9%).