Downey, California Submit your own pictures of this city and show them to the world
OSM Map
General Map
Google Map
MSN Map
OSM Map
General Map
Google Map
MSN Map
OSM Map
General Map
Google Map
MSN Map
OSM Map
General Map
Google Map
MSN Map
Please wait while loading the map...
Population in 2022: 109,934 (100% urban, 0% rural). Population change since 2000: +2.4%Males: 55,483 Females: 54,451
March 2022 cost of living index in Downey: 138.3 (high, U.S. average is 100) Percentage of residents living in poverty in 2022: 7.9%for White Non-Hispanic residents , 13.5% for Black residents , 8.3% for Hispanic or Latino residents , 2.8% for American Indian residents , 1.8% for Native Hawaiian and other Pacific Islander residents , 9.1% for other race residents , 10.1% for two or more races residents )
Profiles of local businesses
Business Search - 14 Million verified businesses
Data:
Median household income ($)
Median household income (% change since 2000)
Household income diversity
Ratio of average income to average house value (%)
Ratio of average income to average rent
Median household income ($) - White
Median household income ($) - Black or African American
Median household income ($) - Asian
Median household income ($) - Hispanic or Latino
Median household income ($) - American Indian and Alaska Native
Median household income ($) - Multirace
Median household income ($) - Other Race
Median household income for houses/condos with a mortgage ($)
Median household income for apartments without a mortgage ($)
Races - White alone (%)
Races - White alone (% change since 2000)
Races - Black alone (%)
Races - Black alone (% change since 2000)
Races - American Indian alone (%)
Races - American Indian alone (% change since 2000)
Races - Asian alone (%)
Races - Asian alone (% change since 2000)
Races - Hispanic (%)
Races - Hispanic (% change since 2000)
Races - Native Hawaiian and Other Pacific Islander alone (%)
Races - Native Hawaiian and Other Pacific Islander alone (% change since 2000)
Races - Two or more races (%)
Races - Two or more races (% change since 2000)
Races - Other race alone (%)
Races - Other race alone (% change since 2000)
Racial diversity
Unemployment (%)
Unemployment (% change since 2000)
Unemployment (%) - White
Unemployment (%) - Black or African American
Unemployment (%) - Asian
Unemployment (%) - Hispanic or Latino
Unemployment (%) - American Indian and Alaska Native
Unemployment (%) - Multirace
Unemployment (%) - Other Race
Population density (people per square mile)
Population - Males (%)
Population - Females (%)
Population - Males (%) - White
Population - Males (%) - Black or African American
Population - Males (%) - Asian
Population - Males (%) - Hispanic or Latino
Population - Males (%) - American Indian and Alaska Native
Population - Males (%) - Multirace
Population - Males (%) - Other Race
Population - Females (%) - White
Population - Females (%) - Black or African American
Population - Females (%) - Asian
Population - Females (%) - Hispanic or Latino
Population - Females (%) - American Indian and Alaska Native
Population - Females (%) - Multirace
Population - Females (%) - Other Race
Coronavirus confirmed cases (Apr 27, 2024)
Deaths caused by coronavirus (Apr 27, 2024)
Coronavirus confirmed cases (per 100k population) (Apr 27, 2024)
Deaths caused by coronavirus (per 100k population) (Apr 27, 2024)
Daily increase in number of cases (Apr 27, 2024)
Weekly increase in number of cases (Apr 27, 2024)
Cases doubled (in days) (Apr 27, 2024)
Hospitalized patients (Apr 18, 2022)
Negative test results (Apr 18, 2022)
Total test results (Apr 18, 2022)
COVID Vaccine doses distributed (per 100k population) (Sep 19, 2023)
COVID Vaccine doses administered (per 100k population) (Sep 19, 2023)
COVID Vaccine doses distributed (Sep 19, 2023)
COVID Vaccine doses administered (Sep 19, 2023)
Likely homosexual households (%)
Likely homosexual households (% change since 2000)
Likely homosexual households - Lesbian couples (%)
Likely homosexual households - Lesbian couples (% change since 2000)
Likely homosexual households - Gay men (%)
Likely homosexual households - Gay men (% change since 2000)
Cost of living index
Median gross rent ($)
Median contract rent ($)
Median monthly housing costs ($)
Median house or condo value ($)
Median house or condo value ($ change since 2000)
Mean house or condo value by units in structure - 1, detached ($)
Mean house or condo value by units in structure - 1, attached ($)
Mean house or condo value by units in structure - 2 ($)
Mean house or condo value by units in structure by units in structure - 3 or 4 ($)
Mean house or condo value by units in structure - 5 or more ($)
Mean house or condo value by units in structure - Boat, RV, van, etc. ($)
Mean house or condo value by units in structure - Mobile home ($)
Median house or condo value ($) - White
Median house or condo value ($) - Black or African American
Median house or condo value ($) - Asian
Median house or condo value ($) - Hispanic or Latino
Median house or condo value ($) - American Indian and Alaska Native
Median house or condo value ($) - Multirace
Median house or condo value ($) - Other Race
Median resident age
Resident age diversity
Median resident age - Males
Median resident age - Females
Median resident age - White
Median resident age - Black or African American
Median resident age - Asian
Median resident age - Hispanic or Latino
Median resident age - American Indian and Alaska Native
Median resident age - Multirace
Median resident age - Other Race
Median resident age - Males - White
Median resident age - Males - Black or African American
Median resident age - Males - Asian
Median resident age - Males - Hispanic or Latino
Median resident age - Males - American Indian and Alaska Native
Median resident age - Males - Multirace
Median resident age - Males - Other Race
Median resident age - Females - White
Median resident age - Females - Black or African American
Median resident age - Females - Asian
Median resident age - Females - Hispanic or Latino
Median resident age - Females - American Indian and Alaska Native
Median resident age - Females - Multirace
Median resident age - Females - Other Race
Commute - mean travel time to work (minutes)
Travel time to work - Less than 5 minutes (%)
Travel time to work - Less than 5 minutes (% change since 2000)
Travel time to work - 5 to 9 minutes (%)
Travel time to work - 5 to 9 minutes (% change since 2000)
Travel time to work - 10 to 19 minutes (%)
Travel time to work - 10 to 19 minutes (% change since 2000)
Travel time to work - 20 to 29 minutes (%)
Travel time to work - 20 to 29 minutes (% change since 2000)
Travel time to work - 30 to 39 minutes (%)
Travel time to work - 30 to 39 minutes (% change since 2000)
Travel time to work - 40 to 59 minutes (%)
Travel time to work - 40 to 59 minutes (% change since 2000)
Travel time to work - 60 to 89 minutes (%)
Travel time to work - 60 to 89 minutes (% change since 2000)
Travel time to work - 90 or more minutes (%)
Travel time to work - 90 or more minutes (% change since 2000)
Marital status - Never married (%)
Marital status - Now married (%)
Marital status - Separated (%)
Marital status - Widowed (%)
Marital status - Divorced (%)
Median family income ($)
Median family income (% change since 2000)
Median non-family income ($)
Median non-family income (% change since 2000)
Median per capita income ($)
Median per capita income (% change since 2000)
Median family income ($) - White
Median family income ($) - Black or African American
Median family income ($) - Asian
Median family income ($) - Hispanic or Latino
Median family income ($) - American Indian and Alaska Native
Median family income ($) - Multirace
Median family income ($) - Other Race
Median year house/condo built
Median year apartment built
Year house built - Built 2005 or later (%)
Year house built - Built 2000 to 2004 (%)
Year house built - Built 1990 to 1999 (%)
Year house built - Built 1980 to 1989 (%)
Year house built - Built 1970 to 1979 (%)
Year house built - Built 1960 to 1969 (%)
Year house built - Built 1950 to 1959 (%)
Year house built - Built 1940 to 1949 (%)
Year house built - Built 1939 or earlier (%)
Average household size
Household density (households per square mile)
Average household size - White
Average household size - Black or African American
Average household size - Asian
Average household size - Hispanic or Latino
Average household size - American Indian and Alaska Native
Average household size - Multirace
Average household size - Other Race
Occupied housing units (%)
Vacant housing units (%)
Owner occupied housing units (%)
Renter occupied housing units (%)
Vacancy status - For rent (%)
Vacancy status - For sale only (%)
Vacancy status - Rented or sold, not occupied (%)
Vacancy status - For seasonal, recreational, or occasional use (%)
Vacancy status - For migrant workers (%)
Vacancy status - Other vacant (%)
Residents with income below the poverty level (%)
Residents with income below 50% of the poverty level (%)
Children below poverty level (%)
Poor families by family type - Married-couple family (%)
Poor families by family type - Male, no wife present (%)
Poor families by family type - Female, no husband present (%)
Poverty status for native-born residents (%)
Poverty status for foreign-born residents (%)
Poverty among high school graduates not in families (%)
Poverty among people who did not graduate high school not in families (%)
Residents with income below the poverty level (%) - White
Residents with income below the poverty level (%) - Black or African American
Residents with income below the poverty level (%) - Asian
Residents with income below the poverty level (%) - Hispanic or Latino
Residents with income below the poverty level (%) - American Indian and Alaska Native
Residents with income below the poverty level (%) - Multirace
Residents with income below the poverty level (%) - Other Race
Air pollution - Air Quality Index (AQI)
Air pollution - CO
Air pollution - NO2
Air pollution - SO2
Air pollution - Ozone
Air pollution - PM10
Air pollution - PM25
Air pollution - Pb
Crime - Murders per 100,000 population
Crime - Rapes per 100,000 population
Crime - Robberies per 100,000 population
Crime - Assaults per 100,000 population
Crime - Burglaries per 100,000 population
Crime - Thefts per 100,000 population
Crime - Auto thefts per 100,000 population
Crime - Arson per 100,000 population
Crime - City-data.com crime index
Crime - Violent crime index
Crime - Property crime index
Crime - Murders per 100,000 population (5 year average)
Crime - Rapes per 100,000 population (5 year average)
Crime - Robberies per 100,000 population (5 year average)
Crime - Assaults per 100,000 population (5 year average)
Crime - Burglaries per 100,000 population (5 year average)
Crime - Thefts per 100,000 population (5 year average)
Crime - Auto thefts per 100,000 population (5 year average)
Crime - Arson per 100,000 population (5 year average)
Crime - City-data.com crime index (5 year average)
Crime - Violent crime index (5 year average)
Crime - Property crime index (5 year average)
1996 Presidential Elections Results (%) - Democratic Party (Clinton)
1996 Presidential Elections Results (%) - Republican Party (Dole)
1996 Presidential Elections Results (%) - Other
2000 Presidential Elections Results (%) - Democratic Party (Gore)
2000 Presidential Elections Results (%) - Republican Party (Bush)
2000 Presidential Elections Results (%) - Other
2004 Presidential Elections Results (%) - Democratic Party (Kerry)
2004 Presidential Elections Results (%) - Republican Party (Bush)
2004 Presidential Elections Results (%) - Other
2008 Presidential Elections Results (%) - Democratic Party (Obama)
2008 Presidential Elections Results (%) - Republican Party (McCain)
2008 Presidential Elections Results (%) - Other
2012 Presidential Elections Results (%) - Democratic Party (Obama)
2012 Presidential Elections Results (%) - Republican Party (Romney)
2012 Presidential Elections Results (%) - Other
2016 Presidential Elections Results (%) - Democratic Party (Clinton)
2016 Presidential Elections Results (%) - Republican Party (Trump)
2016 Presidential Elections Results (%) - Other
2020 Presidential Elections Results (%) - Democratic Party (Biden)
2020 Presidential Elections Results (%) - Republican Party (Trump)
2020 Presidential Elections Results (%) - Other
Ancestries Reported - Arab (%)
Ancestries Reported - Czech (%)
Ancestries Reported - Danish (%)
Ancestries Reported - Dutch (%)
Ancestries Reported - English (%)
Ancestries Reported - French (%)
Ancestries Reported - French Canadian (%)
Ancestries Reported - German (%)
Ancestries Reported - Greek (%)
Ancestries Reported - Hungarian (%)
Ancestries Reported - Irish (%)
Ancestries Reported - Italian (%)
Ancestries Reported - Lithuanian (%)
Ancestries Reported - Norwegian (%)
Ancestries Reported - Polish (%)
Ancestries Reported - Portuguese (%)
Ancestries Reported - Russian (%)
Ancestries Reported - Scotch-Irish (%)
Ancestries Reported - Scottish (%)
Ancestries Reported - Slovak (%)
Ancestries Reported - Subsaharan African (%)
Ancestries Reported - Swedish (%)
Ancestries Reported - Swiss (%)
Ancestries Reported - Ukrainian (%)
Ancestries Reported - United States (%)
Ancestries Reported - Welsh (%)
Ancestries Reported - West Indian (%)
Ancestries Reported - Other (%)
Educational Attainment - No schooling completed (%)
Educational Attainment - Less than high school (%)
Educational Attainment - High school or equivalent (%)
Educational Attainment - Less than 1 year of college (%)
Educational Attainment - 1 or more years of college (%)
Educational Attainment - Associate degree (%)
Educational Attainment - Bachelor's degree (%)
Educational Attainment - Master's degree (%)
Educational Attainment - Professional school degree (%)
Educational Attainment - Doctorate degree (%)
School Enrollment - Nursery, preschool (%)
School Enrollment - Kindergarten (%)
School Enrollment - Grade 1 to 4 (%)
School Enrollment - Grade 5 to 8 (%)
School Enrollment - Grade 9 to 12 (%)
School Enrollment - College undergrad (%)
School Enrollment - Graduate or professional (%)
School Enrollment - Not enrolled in school (%)
School enrollment - Public schools (%)
School enrollment - Private schools (%)
School enrollment - Not enrolled (%)
Median number of rooms in houses and condos
Median number of rooms in apartments
Housing units lacking complete plumbing facilities (%)
Housing units lacking complete kitchen facilities (%)
Density of houses
Urban houses (%)
Rural houses (%)
Households with people 60 years and over (%)
Households with people 65 years and over (%)
Households with people 75 years and over (%)
Households with one or more nonrelatives (%)
Households with no nonrelatives (%)
Population in households (%)
Family households (%)
Nonfamily households (%)
Population in families (%)
Family households with own children (%)
Median number of bedrooms in owner occupied houses
Mean number of bedrooms in owner occupied houses
Median number of bedrooms in renter occupied houses
Mean number of bedrooms in renter occupied houses
Median number of vehichles in owner occupied houses
Mean number of vehichles in owner occupied houses
Median number of vehichles in renter occupied houses
Mean number of vehichles in renter occupied houses
Mortgage status - with mortgage (%)
Mortgage status - with second mortgage (%)
Mortgage status - with home equity loan (%)
Mortgage status - with both second mortgage and home equity loan (%)
Mortgage status - without a mortgage (%)
Average family size
Average family size - White
Average family size - Black or African American
Average family size - Asian
Average family size - Hispanic or Latino
Average family size - American Indian and Alaska Native
Average family size - Multirace
Average family size - Other Race
Geographical mobility - Same house 1 year ago (%)
Geographical mobility - Moved within same county (%)
Geographical mobility - Moved from different county within same state (%)
Geographical mobility - Moved from different state (%)
Geographical mobility - Moved from abroad (%)
Place of birth - Born in state of residence (%)
Place of birth - Born in other state (%)
Place of birth - Native, outside of US (%)
Place of birth - Foreign born (%)
Housing units in structures - 1, detached (%)
Housing units in structures - 1, attached (%)
Housing units in structures - 2 (%)
Housing units in structures - 3 or 4 (%)
Housing units in structures - 5 to 9 (%)
Housing units in structures - 10 to 19 (%)
Housing units in structures - 20 to 49 (%)
Housing units in structures - 50 or more (%)
Housing units in structures - Mobile home (%)
Housing units in structures - Boat, RV, van, etc. (%)
House/condo owner moved in on average (years ago)
Renter moved in on average (years ago)
Year householder moved into unit - Moved in 1999 to March 2000 (%)
Year householder moved into unit - Moved in 1995 to 1998 (%)
Year householder moved into unit - Moved in 1990 to 1994 (%)
Year householder moved into unit - Moved in 1980 to 1989 (%)
Year householder moved into unit - Moved in 1970 to 1979 (%)
Year householder moved into unit - Moved in 1969 or earlier (%)
Means of transportation to work - Drove car alone (%)
Means of transportation to work - Carpooled (%)
Means of transportation to work - Public transportation (%)
Means of transportation to work - Bus or trolley bus (%)
Means of transportation to work - Streetcar or trolley car (%)
Means of transportation to work - Subway or elevated (%)
Means of transportation to work - Railroad (%)
Means of transportation to work - Ferryboat (%)
Means of transportation to work - Taxicab (%)
Means of transportation to work - Motorcycle (%)
Means of transportation to work - Bicycle (%)
Means of transportation to work - Walked (%)
Means of transportation to work - Other means (%)
Working at home (%)
Industry diversity
Most Common Industries - Agriculture, forestry, fishing and hunting, and mining (%)
Most Common Industries - Agriculture, forestry, fishing and hunting (%)
Most Common Industries - Mining, quarrying, and oil and gas extraction (%)
Most Common Industries - Construction (%)
Most Common Industries - Manufacturing (%)
Most Common Industries - Wholesale trade (%)
Most Common Industries - Retail trade (%)
Most Common Industries - Transportation and warehousing, and utilities (%)
Most Common Industries - Transportation and warehousing (%)
Most Common Industries - Utilities (%)
Most Common Industries - Information (%)
Most Common Industries - Finance and insurance, and real estate and rental and leasing (%)
Most Common Industries - Finance and insurance (%)
Most Common Industries - Real estate and rental and leasing (%)
Most Common Industries - Professional, scientific, and management, and administrative and waste management services (%)
Most Common Industries - Professional, scientific, and technical services (%)
Most Common Industries - Management of companies and enterprises (%)
Most Common Industries - Administrative and support and waste management services (%)
Most Common Industries - Educational services, and health care and social assistance (%)
Most Common Industries - Educational services (%)
Most Common Industries - Health care and social assistance (%)
Most Common Industries - Arts, entertainment, and recreation, and accommodation and food services (%)
Most Common Industries - Arts, entertainment, and recreation (%)
Most Common Industries - Accommodation and food services (%)
Most Common Industries - Other services, except public administration (%)
Most Common Industries - Public administration (%)
Occupation diversity
Most Common Occupations - Management, business, science, and arts occupations (%)
Most Common Occupations - Management, business, and financial occupations (%)
Most Common Occupations - Management occupations (%)
Most Common Occupations - Business and financial operations occupations (%)
Most Common Occupations - Computer, engineering, and science occupations (%)
Most Common Occupations - Computer and mathematical occupations (%)
Most Common Occupations - Architecture and engineering occupations (%)
Most Common Occupations - Life, physical, and social science occupations (%)
Most Common Occupations - Education, legal, community service, arts, and media occupations (%)
Most Common Occupations - Community and social service occupations (%)
Most Common Occupations - Legal occupations (%)
Most Common Occupations - Education, training, and library occupations (%)
Most Common Occupations - Arts, design, entertainment, sports, and media occupations (%)
Most Common Occupations - Healthcare practitioners and technical occupations (%)
Most Common Occupations - Health diagnosing and treating practitioners and other technical occupations (%)
Most Common Occupations - Health technologists and technicians (%)
Most Common Occupations - Service occupations (%)
Most Common Occupations - Healthcare support occupations (%)
Most Common Occupations - Protective service occupations (%)
Most Common Occupations - Fire fighting and prevention, and other protective service workers including supervisors (%)
Most Common Occupations - Law enforcement workers including supervisors (%)
Most Common Occupations - Food preparation and serving related occupations (%)
Most Common Occupations - Building and grounds cleaning and maintenance occupations (%)
Most Common Occupations - Personal care and service occupations (%)
Most Common Occupations - Sales and office occupations (%)
Most Common Occupations - Sales and related occupations (%)
Most Common Occupations - Office and administrative support occupations (%)
Most Common Occupations - Natural resources, construction, and maintenance occupations (%)
Most Common Occupations - Farming, fishing, and forestry occupations (%)
Most Common Occupations - Construction and extraction occupations (%)
Most Common Occupations - Installation, maintenance, and repair occupations (%)
Most Common Occupations - Production, transportation, and material moving occupations (%)
Most Common Occupations - Production occupations (%)
Most Common Occupations - Transportation occupations (%)
Most Common Occupations - Material moving occupations (%)
People in Group quarters - Institutionalized population (%)
People in Group quarters - Correctional institutions (%)
People in Group quarters - Federal prisons and detention centers (%)
People in Group quarters - Halfway houses (%)
People in Group quarters - Local jails and other confinement facilities (including police lockups) (%)
People in Group quarters - Military disciplinary barracks (%)
People in Group quarters - State prisons (%)
People in Group quarters - Other types of correctional institutions (%)
People in Group quarters - Nursing homes (%)
People in Group quarters - Hospitals/wards, hospices, and schools for the handicapped (%)
People in Group quarters - Hospitals/wards and hospices for chronically ill (%)
People in Group quarters - Hospices or homes for chronically ill (%)
People in Group quarters - Military hospitals or wards for chronically ill (%)
People in Group quarters - Other hospitals or wards for chronically ill (%)
People in Group quarters - Hospitals or wards for drug/alcohol abuse (%)
People in Group quarters - Mental (Psychiatric) hospitals or wards (%)
People in Group quarters - Schools, hospitals, or wards for the mentally retarded (%)
People in Group quarters - Schools, hospitals, or wards for the physically handicapped (%)
People in Group quarters - Institutions for the deaf (%)
People in Group quarters - Institutions for the blind (%)
People in Group quarters - Orthopedic wards and institutions for the physically handicapped (%)
People in Group quarters - Wards in general hospitals for patients who have no usual home elsewhere (%)
People in Group quarters - Wards in military hospitals for patients who have no usual home elsewhere (%)
People in Group quarters - Juvenile institutions (%)
People in Group quarters - Long-term care (%)
People in Group quarters - Homes for abused, dependent, and neglected children (%)
People in Group quarters - Residential treatment centers for emotionally disturbed children (%)
People in Group quarters - Training schools for juvenile delinquents (%)
People in Group quarters - Short-term care, detention or diagnostic centers for delinquent children (%)
People in Group quarters - Type of juvenile institution unknown (%)
People in Group quarters - Noninstitutionalized population (%)
People in Group quarters - College dormitories (includes college quarters off campus) (%)
People in Group quarters - Military quarters (%)
People in Group quarters - On base (%)
People in Group quarters - Barracks, unaccompanied personnel housing (UPH), (Enlisted/Officer), ;and similar group living quarters for military personnel (%)
People in Group quarters - Transient quarters for temporary residents (%)
People in Group quarters - Military ships (%)
People in Group quarters - Group homes (%)
People in Group quarters - Homes or halfway houses for drug/alcohol abuse (%)
People in Group quarters - Homes for the mentally ill (%)
People in Group quarters - Homes for the mentally retarded (%)
People in Group quarters - Homes for the physically handicapped (%)
People in Group quarters - Other group homes (%)
People in Group quarters - Religious group quarters (%)
People in Group quarters - Dormitories (%)
People in Group quarters - Agriculture workers' dormitories on farms (%)
People in Group quarters - Job Corps and vocational training facilities (%)
People in Group quarters - Other workers' dormitories (%)
People in Group quarters - Crews of maritime vessels (%)
People in Group quarters - Other nonhousehold living situations (%)
People in Group quarters - Other noninstitutional group quarters (%)
Residents speaking English at home (%)
Residents speaking English at home - Born in the United States (%)
Residents speaking English at home - Native, born elsewhere (%)
Residents speaking English at home - Foreign born (%)
Residents speaking Spanish at home (%)
Residents speaking Spanish at home - Born in the United States (%)
Residents speaking Spanish at home - Native, born elsewhere (%)
Residents speaking Spanish at home - Foreign born (%)
Residents speaking other language at home (%)
Residents speaking other language at home - Born in the United States (%)
Residents speaking other language at home - Native, born elsewhere (%)
Residents speaking other language at home - Foreign born (%)
Class of Workers - Employee of private company (%)
Class of Workers - Self-employed in own incorporated business (%)
Class of Workers - Private not-for-profit wage and salary workers (%)
Class of Workers - Local government workers (%)
Class of Workers - State government workers (%)
Class of Workers - Federal government workers (%)
Class of Workers - Self-employed workers in own not incorporated business and Unpaid family workers (%)
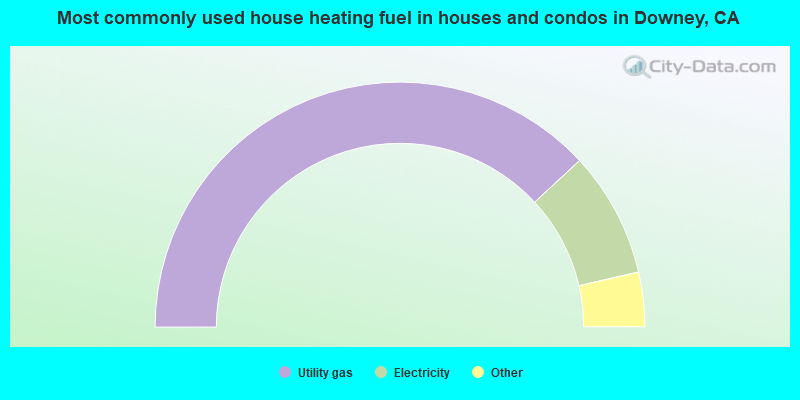
House heating fuel used in houses and condos - Utility gas (%)
House heating fuel used in houses and condos - Bottled, tank, or LP gas (%)
House heating fuel used in houses and condos - Electricity (%)
House heating fuel used in houses and condos - Fuel oil, kerosene, etc. (%)
House heating fuel used in houses and condos - Coal or coke (%)
House heating fuel used in houses and condos - Wood (%)
House heating fuel used in houses and condos - Solar energy (%)
House heating fuel used in houses and condos - Other fuel (%)
House heating fuel used in houses and condos - No fuel used (%)
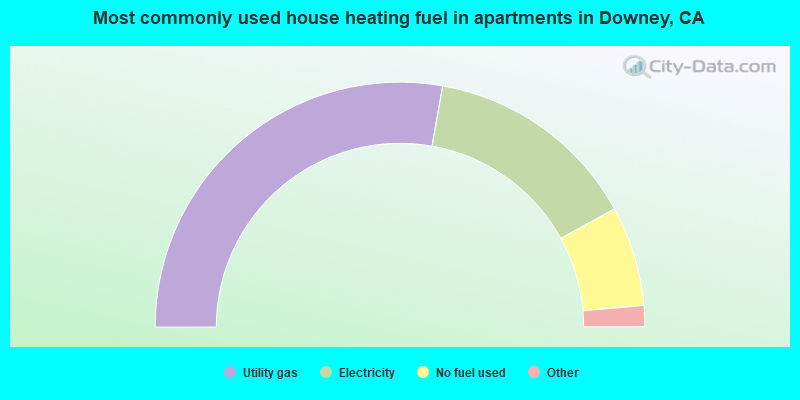
House heating fuel used in apartments - Utility gas (%)
House heating fuel used in apartments - Bottled, tank, or LP gas (%)
House heating fuel used in apartments - Electricity (%)
House heating fuel used in apartments - Fuel oil, kerosene, etc. (%)
House heating fuel used in apartments - Coal or coke (%)
House heating fuel used in apartments - Wood (%)
House heating fuel used in apartments - Solar energy (%)
House heating fuel used in apartments - Other fuel (%)
House heating fuel used in apartments - No fuel used (%)
Armed forces status - In Armed Forces (%)
Armed forces status - Civilian (%)
Armed forces status - Civilian - Veteran (%)
Armed forces status - Civilian - Nonveteran (%)
Fatal accidents locations in years 2005-2021
Fatal accidents locations in 2005
Fatal accidents locations in 2006
Fatal accidents locations in 2007
Fatal accidents locations in 2008
Fatal accidents locations in 2009
Fatal accidents locations in 2010
Fatal accidents locations in 2011
Fatal accidents locations in 2012
Fatal accidents locations in 2013
Fatal accidents locations in 2014
Fatal accidents locations in 2015
Fatal accidents locations in 2016
Fatal accidents locations in 2017
Fatal accidents locations in 2018
Fatal accidents locations in 2019
Fatal accidents locations in 2020
Fatal accidents locations in 2021
Alcohol use - People drinking some alcohol every month (%)
Alcohol use - People not drinking at all (%)
Alcohol use - Average days/month drinking alcohol
Alcohol use - Average drinks/week
Alcohol use - Average days/year people drink much
Audiometry - Average condition of hearing (%)
Audiometry - People that can hear a whisper from across a quiet room (%)
Audiometry - People that can hear normal voice from across a quiet room (%)
Audiometry - Ears ringing, roaring, buzzing (%)
Audiometry - Had a job exposure to loud noise (%)
Audiometry - Had off-work exposure to loud noise (%)
Blood Pressure & Cholesterol - Has high blood pressure (%)
Blood Pressure & Cholesterol - Checking blood pressure at home (%)
Blood Pressure & Cholesterol - Frequently checking blood cholesterol (%)
Blood Pressure & Cholesterol - Has high cholesterol level (%)
Consumer Behavior - Money monthly spent on food at supermarket/grocery store
Consumer Behavior - Money monthly spent on food at other stores
Consumer Behavior - Money monthly spent on eating out
Consumer Behavior - Money monthly spent on carryout/delivered foods
Consumer Behavior - Income spent on food at supermarket/grocery store (%)
Consumer Behavior - Income spent on food at other stores (%)
Consumer Behavior - Income spent on eating out (%)
Consumer Behavior - Income spent on carryout/delivered foods (%)
Current Health Status - General health condition (%)
Current Health Status - Blood donors (%)
Current Health Status - Has blood ever tested for HIV virus (%)
Current Health Status - Left-handed people (%)
Dermatology - People using sunscreen (%)
Diabetes - Diabetics (%)
Diabetes - Had a blood test for high blood sugar (%)
Diabetes - People taking insulin (%)
Diet Behavior & Nutrition - Diet health (%)
Diet Behavior & Nutrition - Milk product consumption (# of products/month)
Diet Behavior & Nutrition - Meals not home prepared (#/week)
Diet Behavior & Nutrition - Meals from fast food or pizza place (#/week)
Diet Behavior & Nutrition - Ready-to-eat foods (#/month)
Diet Behavior & Nutrition - Frozen meals/pizza (#/month)
Drug Use - People that ever used marijuana or hashish (%)
Drug Use - Ever used hard drugs (%)
Drug Use - Ever used any form of cocaine (%)
Drug Use - Ever used heroin (%)
Drug Use - Ever used methamphetamine (%)
Health Insurance - People covered by health insurance (%)
Kidney Conditions-Urology - Avg. # of times urinating at night
Medical Conditions - People with asthma (%)
Medical Conditions - People with anemia (%)
Medical Conditions - People with psoriasis (%)
Medical Conditions - People with overweight (%)
Medical Conditions - Elderly people having difficulties in thinking or remembering (%)
Medical Conditions - People who ever received blood transfusion (%)
Medical Conditions - People having trouble seeing even with glass/contacts (%)
Medical Conditions - People with arthritis (%)
Medical Conditions - People with gout (%)
Medical Conditions - People with congestive heart failure (%)
Medical Conditions - People with coronary heart disease (%)
Medical Conditions - People with angina pectoris (%)
Medical Conditions - People who ever had heart attack (%)
Medical Conditions - People who ever had stroke (%)
Medical Conditions - People with emphysema (%)
Medical Conditions - People with thyroid problem (%)
Medical Conditions - People with chronic bronchitis (%)
Medical Conditions - People with any liver condition (%)
Medical Conditions - People who ever had cancer or malignancy (%)
Mental Health - People who have little interest in doing things (%)
Mental Health - People feeling down, depressed, or hopeless (%)
Mental Health - People who have trouble sleeping or sleeping too much (%)
Mental Health - People feeling tired or having little energy (%)
Mental Health - People with poor appetite or overeating (%)
Mental Health - People feeling bad about themself (%)
Mental Health - People who have trouble concentrating on things (%)
Mental Health - People moving or speaking slowly or too fast (%)
Mental Health - People having thoughts they would be better off dead (%)
Oral Health - Average years since last visit a dentist
Oral Health - People embarrassed because of mouth (%)
Oral Health - People with gum disease (%)
Oral Health - General health of teeth and gums (%)
Oral Health - Average days a week using dental floss/device
Oral Health - Average days a week using mouthwash for dental problem
Oral Health - Average number of teeth
Pesticide Use - Households using pesticides to control insects (%)
Pesticide Use - Households using pesticides to kill weeds (%)
Physical Activity - People doing vigorous-intensity work activities (%)
Physical Activity - People doing moderate-intensity work activities (%)
Physical Activity - People walking or bicycling (%)
Physical Activity - People doing vigorous-intensity recreational activities (%)
Physical Activity - People doing moderate-intensity recreational activities (%)
Physical Activity - Average hours a day doing sedentary activities
Physical Activity - Average hours a day watching TV or videos
Physical Activity - Average hours a day using computer
Physical Functioning - People having limitations keeping them from working (%)
Physical Functioning - People limited in amount of work they can do (%)
Physical Functioning - People that need special equipment to walk (%)
Physical Functioning - People experiencing confusion/memory problems (%)
Physical Functioning - People requiring special healthcare equipment (%)
Prescription Medications - Average number of prescription medicines taking
Preventive Aspirin Use - Adults 40+ taking low-dose aspirin (%)
Reproductive Health - Vaginal deliveries (%)
Reproductive Health - Cesarean deliveries (%)
Reproductive Health - Deliveries resulted in a live birth (%)
Reproductive Health - Pregnancies resulted in a delivery (%)
Reproductive Health - Women breastfeeding newborns (%)
Reproductive Health - Women that had a hysterectomy (%)
Reproductive Health - Women that had both ovaries removed (%)
Reproductive Health - Women that have ever taken birth control pills (%)
Reproductive Health - Women taking birth control pills (%)
Reproductive Health - Women that have ever used Depo-Provera or injectables (%)
Reproductive Health - Women that have ever used female hormones (%)
Sexual Behavior - People 18+ that ever had sex (vaginal, anal, or oral) (%)
Sexual Behavior - Males 18+ that ever had vaginal sex with a woman (%)
Sexual Behavior - Males 18+ that ever performed oral sex on a woman (%)
Sexual Behavior - Males 18+ that ever had anal sex with a woman (%)
Sexual Behavior - Males 18+ that ever had any sex with a man (%)
Sexual Behavior - Females 18+ that ever had vaginal sex with a man (%)
Sexual Behavior - Females 18+ that ever performed oral sex on a man (%)
Sexual Behavior - Females 18+ that ever had anal sex with a man (%)
Sexual Behavior - Females 18+ that ever had any kind of sex with a woman (%)
Sexual Behavior - Average age people first had sex
Sexual Behavior - Average number of female sex partners in lifetime (males 18+)
Sexual Behavior - Average number of female vaginal sex partners in lifetime (males 18+)
Sexual Behavior - Average age people first performed oral sex on a woman (18+)
Sexual Behavior - Average number of woman performed oral sex on in lifetime (18+)
Sexual Behavior - Average number of male sex partners in lifetime (males 18+)
Sexual Behavior - Average number of male anal sex partners in lifetime (males 18+)
Sexual Behavior - Average age people first performed oral sex on a man (18+)
Sexual Behavior - Average number of male oral sex partners in lifetime (18+)
Sexual Behavior - People using protection when performing oral sex (%)
Sexual Behavior - Average number of times people have vaginal or anal sex a year
Sexual Behavior - People having sex without condom (%)
Sexual Behavior - Average number of male sex partners in lifetime (females 18+)
Sexual Behavior - Average number of male vaginal sex partners in lifetime (females 18+)
Sexual Behavior - Average number of female sex partners in lifetime (females 18+)
Sexual Behavior - Circumcised males 18+ (%)
Sleep Disorders - Average hours sleeping at night
Sleep Disorders - People that has trouble sleeping (%)
Smoking-Cigarette Use - People smoking cigarettes (%)
Taste & Smell - People 40+ having problems with smell (%)
Taste & Smell - People 40+ having problems with taste (%)
Taste & Smell - People 40+ that ever had wisdom teeth removed (%)
Taste & Smell - People 40+ that ever had tonsils teeth removed (%)
Taste & Smell - People 40+ that ever had a loss of consciousness because of a head injury (%)
Taste & Smell - People 40+ that ever had a broken nose or other serious injury to face or skull (%)
Taste & Smell - People 40+ that ever had two or more sinus infections (%)
Weight - Average height (inches)
Weight - Average weight (pounds)
Weight - Average BMI
Weight - People that are obese (%)
Weight - People that ever were obese (%)
Weight - People trying to lose weight (%)
84,274 76.7% Hispanic 10,305 9.4% White alone 9,665 8.8% Asian alone 4,087 3.7% Black alone 1,111 1.0% Two or more races 229 0.2% Other race alone 144 0.1% Native Hawaiian and Other 93 0.08% American Indian alone
According to our research of California and other state lists, there were 107 registered sex offenders living in Downey, California as of April 27, 2024 . The ratio of all residents to sex offenders in Downey is 1,059 to 1.The ratio of registered sex offenders to all residents in this city is lower than the state average.
The City-Data.com crime index weighs serious crimes and violent crimes more heavily. Higher means more crime, U.S. average is 246.1. It adjusts for the number of visitors and daily workers commuting into cities.
- means the value is smaller than the state average.
- means the value is about the same as the state average.
- means the value is bigger than the state average.
- means the value is much bigger than the state average.
Crime rate in Downey detailed stats: murders, rapes, robberies, assaults, burglaries, thefts, arson Officers per 1,000 residents here:
1.03California average:
2.30
Latest news from Downey, CA collected exclusively by city-data.com from local newspapers, TV, and radio stations
Ancestries: American (2.4%).
Current Local Time:
Land area: 12.4 square miles.
Population density: 8,852 people per square mile (high).
34,748 residents are foreign born (24.1% Latin America , 5.5% Asia ).
This city:
31.4%California:
26.5%
Median real estate property taxes paid for housing units with mortgages in 2022: $5,005 (0.7%)Median real estate property taxes paid for housing units with no mortgage in 2022: $3,510 (0.5%)
Nearest city with pop. 200,000+: Southwest San Gabriel Valley, CA (8.7 miles
Nearest city with pop. 1,000,000+: Los Angeles, CA
Nearest cities:
Latitude: 33.94 N, Longitude: 118.13 W
Daytime population change due to commuting: -6,744 (-6.1%)Workers who live and work in this city: 15,024 (26.2%)
Property values in Downey, CA
Downey tourist attractions:
Single-family new house construction building permits:
2022: 153 buildings , average cost: $116,1002021: 121 buildings , average cost: $223,2002020: 57 buildings , average cost: $130,9002019: 20 buildings , average cost: $367,8002018: 56 buildings , average cost: $247,0002017: 138 buildings , average cost: $271,8002016: 44 buildings , average cost: $271,7002015: 18 buildings , average cost: $477,8002014: 42 buildings , average cost: $248,6002013: 56 buildings , average cost: $227,2002010: 6 buildings , average cost: $411,4002009: 14 buildings , average cost: $394,3002008: 16 buildings , average cost: $457,9002007: 79 buildings , average cost: $438,3002006: 36 buildings , average cost: $386,7002005: 24 buildings , average cost: $227,5002004: 25 buildings , average cost: $216,9002003: 22 buildings , average cost: $216,9002002: 21 buildings , average cost: $216,9002001: 17 buildings , average cost: $216,9002000: 16 buildings , average cost: $216,9001999: 15 buildings , average cost: $216,9001998: 16 buildings , average cost: $217,2001997: 13 buildings , average cost: $215,700Unemployment in December 2023:
Population change in the 1990s: +15,718 (+17.2%).
Most common occupations in Downey, CA (%)
Both Males Females
Cooks and food preparation workers (5.5%)
Other management occupations, except farmers and farm managers (4.0%)
Building and grounds cleaning and maintenance occupations (4.0%)
Driver/sales workers and truck drivers (3.9%)
Retail sales workers, except cashiers (3.4%)
Other office and administrative support workers, including supervisors (3.4%)
Material recording, scheduling, dispatching, and distributing workers (3.1%)
Driver/sales workers and truck drivers (7.1%)
Building and grounds cleaning and maintenance occupations (4.6%)
Other management occupations, except farmers and farm managers (4.4%)
Cooks and food preparation workers (4.3%)
Other production occupations, including supervisors (3.7%)
Electrical equipment mechanics and other installation, maintenance, and repair workers, including supervisors (3.6%)
Material recording, scheduling, dispatching, and distributing workers (3.4%)
Cooks and food preparation workers (6.7%)
Other office and administrative support workers, including supervisors (5.5%)
Secretaries and administrative assistants (4.6%)
Information and record clerks, except customer service representatives (4.4%)
Retail sales workers, except cashiers (3.8%)
Cashiers (3.7%)
Supervisors and other personal care and service workers, except child care workers (3.6%)
Earthquake activity:
Downey-area historical earthquake activity is significantly above California state average. It is 6942% greater than the overall U.S. average. On 7/21/1952 at 11:52:14, a magnitude 7.7 (7.7 UK, Class: Major, Intensity: VIII - XII) earthquake occurred 88.6 miles away from Downey center, causing $50,000,000 total damage On 6/28/1992 at 11:57:34, a magnitude 7.6 (6.2 MB, 7.6 MS, 7.3 MW, Depth: 0.7 mi) earthquake occurred 93.2 miles away from Downey center, causing 3 deaths ( 1 shaking deaths, 2 other deaths) and 400 injuries, causing $100,000,000 total damage and $40,000,000 insured lossesOn 10/16/1999 at 09:46:44, a magnitude 7.4 (6.3 MB, 7.4 MS, 7.2 MW, 7.3 ML) earthquake occurred 104.9 miles away from Downey center On 11/4/1927 at 13:51:53, a magnitude 7.5 (7.5 UK) earthquake occurred 178.7 miles away from Downey center On 1/17/1994 at 12:30:55, a magnitude 6.8 (6.4 MB, 6.8 MS, 6.7 MW, Depth: 11.4 mi, Class: Strong, Intensity: VII - IX) earthquake occurred 29.6 miles away from the city center, causing 60 deaths ( 60 shaking deaths) and 7000 injuriesOn 4/21/1918 at 22:32:30, a magnitude 6.8 (6.8 UK) earthquake occurred 40.6 miles away from Downey center Magnitude types: body-wave magnitude (MB), local magnitude (ML), surface-wave magnitude (MS), moment magnitude (MW) Natural disasters: The number of natural disasters in Los Angeles County (57) is a lot greater than the US average (15).Major Disasters (Presidential) Declared: 27Emergencies Declared: 3Fires: 37, Floods: 16, Storms: 9, Winter Storms: 6, Landslides: 5, Mudslides: 5, Earthquakes: 3, Freeze: 1, Heavy Rain: 1, Hurricane: 1, Snow: 1, Tornado: 1, Wind: 1, Other: 1 (Note: some incidents may be assigned to more than one category). Hospitals in Downey: DOWNEY ADULT HOME CARE (7943 7TH STREET) DOWNEY ADULT HOME CARE II (10247 WILEY BURKE AVENUE) DOWNEY ADULT HOME CARE III (7446 MULLER STREET) DOWNEY REGIONAL MEDICAL CENTER (Voluntary non-profit - Private, provides emergency services, 11500 BROOKSHIRE AVENUE) HOME CARE FORTE INC (7908 QUILL DRIVE) HOSPICE FAMILY CARE INC (10642 DOWNEY AVENUE SUITE 205) KAISER FOUNDATION HOSP HOSPICE PROGRAM (12500 BELLFLOWER BLVD) KAISER FOUNDATION HOSPITAL - DOWNEY (Voluntary non-profit - Other, provides emergency services, 9333 IMPERIAL HIGHWAY) LAC/RANCHO LOS AMIGOS NATIONAL REHABILITATION CTR (Government - Local, provides emergency services, 7601 EAST IMPERIAL HIGHWAY) MIMIS HOMES (7142 DE PALMA STREET) RIO HONDO MEMORIAL HOSPITAL (8300 E TELEGRAPH ROAD) Amtrak stations near Downey: 11 miles: LOS ANGELES (800 N. ALAMEDA ST.) Services: ticket office, fully wheelchair accessible, enclosed waiting area, public restrooms, public payphones, snack bar, free short-term parking, paid long-term parking, car rental agency, taxi stand, public transit connection.
12 miles: LONG BEACH (601 N. LONG BEACH BLVD.) - Bus Station Services: fully wheelchair accessible, public restrooms, public payphones, full-service food facilities, paid short-term parking, paid long-term parking, call for taxi service, public transit connection.
13 miles: FULLERTON (120 E. SANTA FE AVE.) Services: ticket office, fully wheelchair accessible, enclosed waiting area, public restrooms, public payphones, full-service food facilities, free short-term parking, paid long-term parking, taxi stand, public transit connection.
College/University in Downey: Downey Adult School Full-time enrollment: 497; Location: 12340 Woodruff Ave; Public; Website: www.das.edu)
Colleges/universities with over 2000 students nearest to Downey:
Cerritos College (about 5 miles; Norwalk, CA ; Full-time enrollment: 13,090)
ICDC College (about 7 miles; Huntington Park, CA ; FT enrollment: 2,621)
El Camino College-Compton Center (about 7 miles; Compton, CA ; FT enrollment: 4,506)
United Education Institute-Huntington Park Campus (about 7 miles; Huntington Park, CA ; FT enrollment: 5,151)
Biola University (about 7 miles; La Mirada, CA ; FT enrollment: 5,325)
East Los Angeles College (about 8 miles; Monterey Park, CA ; FT enrollment: 17,297)
Long Beach City College (about 8 miles; Long Beach, CA ; FT enrollment: 15,602)
Public high schools in Downey: DOWNEY HIGH Students: 2,804, Location: 11040 BROOKSHIRE AVE., Grades: 9-12)WARREN HIGH Students: 2,535, Location: 8141 DE PALMA ST., Grades: 9-12)LOS ANGELES COUNTY SPECIAL EDUCATION Students: 1,293, Location: 9300 IMPERIAL HWY., Grades: KG-12)ALTERNATIVE OPPORTUNITY PROGRAMS Students: 164, Location: 12830 COLUMBIA WAY, Grades: KG-12)COLUMBUS CONTINUATION Students: 60, Location: 12330 WOODRUFF AVE., Grades: 9-12)LOS ANGELES COUNTY ROP Location: 9300 IMPERIAL HWY., Grades: 9-12)LOS PADRINOS JUVENILE HALL Location: 7285 E. QUILL DR., Grades: 6-12)Private high schools in Downey: CALVARY CHAPEL CHRISTIAN SCHOOL Students: 988, Location: 12808 WOODRUFF AVE, Grades: UG-12)
ST MATTHIAS HIGH SCHOOL Students: 248, Location: 7851 GARDENDALE ST, Grades: 9-12, Girls only )
Biggest public elementary/middle schools in Downey: SUSSMAN MIDDLE Students: 1,348, Location: 12500 BIRCHDALE AVE., Grades: 6-8)GRIFFITHS MIDDLE Students: 1,272, Location: 9633 TWEEDY LN., Grades: 6-8)OLD RIVER ELEMENTARY Students: 764, Location: 11995 OLD RIVER SCH RD., Grades: 4-5)CARPENTER ELEMENTARY Students: 631, Location: 9439 E. FOSTER RD., Grades: 4-5)RIO HONDO ELEMENTARY Students: 574, Location: 7731 E. MULLER ST., Grades: KG-5)RIO SAN GABRIEL ELEMENTARY Students: 526, Location: 9338 GOTHAM ST., Grades: KG-5)PRICE ELEMENTARY Students: 488, Location: 9525 S. TWEEDY LN., Grades: KG-5)GALLATIN ELEMENTARY Students: 481, Location: 9513 BROOKSHIRE AVE., Grades: KG-5)LEWIS ELEMENTARY Students: 467, Location: 13220 S. BELLFLOWER BLVD., Grades: KG-5)GAULDIN ELEMENTARY Students: 448, Location: 9724 SPRY ST., Grades: KG-5)Private elementary/middle schools in Downey: OUR LADY OF PERPETUAL HELP SCHOOL Students: 312, Location: 10441 DOWNEY AVE, Grades: KG-8)
ST RAYMOND SCHOOL Students: 309, Location: 12320 S PARAMOUNT BLVD, Grades: KG-8)
KIRKWOOD CHRISTIAN SCHOOLS Students: 245, Location: 11115 PANGBORN AVE, Grades: PK-3)
ST MARK'S EPISCOPAL SCHOOL Students: 129, Location: 10354 DOWNEY AVE, Grades: PK-8)
CREATIVE BEGINNINGS ELEMENTARY Students: 122, Location: 8033 3RD ST, Grades: KG-5)
AROUND THE WORLD CHILDREN CENTER Students: 110, Location: 10441 LAKEWOOD BLVD, Grades: PK-T1)
MONTESSORI CHILDREN'S ACADEMY Students: 106, Location: 7515 FIRESTONE BLVD, Grades: PK-6)
DOWNEY CHRISTIAN EARLY LEARNING CENTER Students: 100, Location: 10335 PARAMOUNT BLVD, Grades: PK-7)
CHILDREN'S ACADEMY OF SUCCESS Students: 24, Location: 10839 LA REINA AVE, Grades: PK-2)
See full list of schools located in Downey Libraries in Downey: COUNTY OF LOS ANGELES PUBLIC LIBRARY Operating income: $121,749,203; Location: 7400 E. IMPERIAL HIGHWAY; 6,871,850 books ; 3,801 e-books ; 322,854 audio materials ; 577,328 video materials ; 36 local licensed databases ; 1 other licensed databases ; 10,777 print serial subscriptions ; 2 electronic serial subscriptions )
DOWNEY CITY LIBRARY Operating income: $2,784,518; Location: 11121 BROOKSHIRE AVE.; 125,397 books ; 1,792 e-books ; 3,779 audio materials ; 3,561 video materials ; 1 state licensed databases ; 46 other licensed databases ; 260 print serial subscriptions )
User-submitted facts and corrections:
Birthplace of Robert (Bob) Illes, 4-time Emmy award winning television writer/producer added by Dino
There is no "Plus X-St. Matthias" high school. The correct name is St. Matthias High School, Pius X Campus (Pius X is a former pope and saint). Our current enrollment average is 520.
Notable locations in Downey: (A) , Los Padrinos Juvenile Hall (B) , Los Amigos Golf Course (C) , Downey City Library (D) , Downey City Hall (E) , Downey Art Museum (F) , City of Downey Fire Department Station 4 (G) , City of Downey Fire Department Station 3 (H) , City of Downey Fire Department Station 2 (I) , City of Downey Fire Department Station 1 Headquarters (J) . Display/hide their locations on the map
Shopping Center: (1) . Display/hide its location on the map
Churches in Downey include: (A) , Church of Christ (B) , Downey United Methodist Church (C) , First Baptist Church of Downey (D) , First Christian Church of Downey (E) , First Church of Christ Scientist (F) , First Presbyterian Church of Downey (G) , First Southern Baptist Church of Downey (H) , Grace Baptist Church (I) . Display/hide their locations on the map
Cemetery: (1) . Display/hide its location on the map
Parks in Downey include: (1) , Dennis the Menace Park (2) , Furman Park (3) , Rio San Gabriel Park (4) , Apollo Park (5) , Brookshire Childrens Park (6) , Crawford Park (7) , Golden Park (8) , Independence Park (9) . Display/hide their locations on the map
Tourist attractions:
Hotel:
Birthplace of: "Weird Al" Yankovic - Musician, Tinker Juarez - Bicycle motocross rider, Dan Henderson - Sport wrestler and martial artist, Evan Longoria - Professional baseball player, James Hetfield - Baritone, Wayne Rainey - Motorcycle racer, Aimee Teegarden - Child actor, Alanna Ubach - Child actor, Anthony Reyes - 2005 Major League Baseball player (St. Louis Cardinals, born : Oct 16, 1981), Bob Bennett (singer-songwriter) - Singer-songwriter and guitarist.
Los Angeles County has a predicted average indoor radon screening level between 2 and 4 pCi/L (pico curies per liter) - Moderate Potential Average household size: This city:
3.3 peopleCalifornia:
2.9 people
Percentage of family households: This city:
78.1%Whole state:
68.7%
Percentage of households with unmarried partners: This city:
7.6%Whole state:
7.2%
Likely homosexual households (counted as self-reported same-sex unmarried-partner households)
Lesbian couples: 0.3% of all households Gay men: 0.3% of all households
People in group quarters in Downey in 2010:
534 people in nursing facilities/skilled-nursing facilities
51 people in residential treatment centers for adults
35 people in group homes intended for adults
23 people in other noninstitutional facilities
13 people in correctional facilities intended for juveniles
13 people in workers' group living quarters and job corps centers
5 people in group homes for juveniles (non-correctional)
5 people in hospitals with patients who have no usual home elsewhere
4 people in in-patient hospice facilities
People in group quarters in Downey in 2000:
565 people in short-term care, detention or diagnostic centers for delinquent children
412 people in nursing homes
286 people in other noninstitutional group quarters
216 people in mental (psychiatric) hospitals or wards
189 people in hospitals/wards and hospices for chronically ill
189 people in other hospitals or wards for chronically ill
36 people in wards in general hospitals for patients who have no usual home elsewhere
28 people in homes for the mentally retarded
11 people in religious group quarters
10 people in other group homes
7 people in homes for the mentally ill
5 people in schools, hospitals, or wards for the intellectually disabled
Banks with most branches in Downey (2011 data):
Bank of America, National Association: Imperial-Paramount Branch, Firestone-Woodruff Branch, Downey Main Branch, Paramount-Florence Branch. Info updated 2009/11/18: Bank assets: $1,451,969.3 mil, Deposits: $1,077,176.8 mil, headquarters in Charlotte, NC, positive income , 5782 total offices , Holding Company: Bank Of America Corporation
Wells Fargo Bank, National Association: Firestone And Patton Branch, Downey Branch, Downey Branch, Sba Department Branch. Info updated 2011/04/05: Bank assets: $1,161,490.0 mil, Deposits: $905,653.0 mil, headquarters in Sioux Falls, SD, positive income , 6395 total offices , Holding Company: Wells Fargo & Company
JPMorgan Chase Bank, National Association: 10200 Paramount Boulevard Branch at 10200 Paramount Boulevard, branch established on 1965/05/05; Downey Branch at 8450 Firestone Boulevard, branch established on 1889/01/01. Info updated 2011/11/10: Bank assets: $1,811,678.0 mil, Deposits: $1,190,738.0 mil, headquarters in Columbus, OH, positive income , International Specialization, 5577 total offices , Holding Company: Jpmorgan Chase & Co.
U.S. Bank National Association: Downey Florence Avenue Branch at 8444 East Florence Ave, branch established on 1957/10/16; Downey Main Branch at 10990 Downey Avenue, branch established on 1993/12/17. Info updated 2012/01/30: Bank assets: $330,470.8 mil, Deposits: $236,091.5 mil, headquarters in Cincinnati, OH, positive income , 3121 total offices , Holding Company: U.S. Bancorp
OneWest Bank, FSB: Downey Branch at 12148 Lakewood Blvd, branch established on 2005/11/21. Info updated 2011/07/21: Bank assets: $26,181.3 mil, Deposits: $15,408.4 mil, headquarters in Pasadena, CA, positive income , 79 total offices
Citibank, National Association: Stonewood St Branch at 121 Stonewood St, branch established on 1934/10/01. Info updated 2012/01/10: Bank assets: $1,288,658.0 mil, Deposits: $882,541.0 mil, headquarters in Sioux Falls, SD, positive income , International Specialization, 1048 total offices , Holding Company: Citigroup Inc.
Bank of the West: Downey Branch at 10230 South Paramount Boulevard, branch established on 1947/04/29. Info updated 2009/11/16: Bank assets: $62,408.3 mil, Deposits: $43,995.2 mil, headquarters in San Francisco, CA, positive income , 647 total offices , Holding Company: Bnp Paribas
Pacific Western Bank: Downey Branch at 10245 Paramount Boulevard, branch established on 1984/01/30. Info updated 2011/03/14: Bank assets: $5,513.1 mil, Deposits: $4,614.5 mil, headquarters in Los Angeles, CA, positive income , Commercial Lending Specialization, 78 total offices , Holding Company: Capgen Capital Group Ii Lp
Banco Popular North America: Downey Branch at 11101 La Reina Avenue, branch established on 1926/04/03. Info updated 2012/01/27: Bank assets: $8,605.3 mil, Deposits: $6,167.7 mil, headquarters in New York, NY, positive income , Commercial Lending Specialization, 97 total offices , Holding Company: Popular, Inc.
For population 15 years and over in Downey:
Never married: 43.5%Now married: 39.6%Separated: 2.5%Widowed: 4.3%Divorced: 10.1% For population 25 years and over in Downey:
High school or higher: 80.9%Bachelor's degree or higher: 27.7%Graduate or professional degree: 9.1%Unemployed: 6.5%Mean travel time to work (commute): 25.8 minutes
Education Gini index (Inequality in education) Here:
16.2California average:
15.5
Religion statistics for Downey, CA (based on Los Angeles County data)
Religion Adherents Congregations Catholic 3,542,994 275 Evangelical Protestant 814,611 3,249 Other 451,594 1,023 Mainline Protestant 229,056 860 Black Protestant 112,338 290 Orthodox 63,517 76 None 4,604,495 -
Source: Clifford Grammich, Kirk Hadaway, Richard Houseal, Dale E.Jones, Alexei Krindatch, Richie Stanley and Richard H.Taylor. 2012. 2010 U.S.Religion Census: Religious Congregations & Membership Study. Association of Statisticians of American Religious Bodies. Jones, Dale E., et al. 2002. Congregations and Membership in the United States 2000. Nashville, TN: Glenmary Research Center. Graphs represent county-level data
Food Environment Statistics: Number of grocery stores : 2,084Los Angeles County :
2.12 / 10,000 pop.State :
2.14 / 10,000 pop.
Number of supercenters and club stores : 32Los Angeles County :
0.03 / 10,000 pop.State :
0.04 / 10,000 pop.
Number of convenience stores (no gas) : 567Los Angeles County :
0.58 / 10,000 pop.California :
0.62 / 10,000 pop.
Number of convenience stores (with gas) : 1,206Los Angeles County :
1.23 / 10,000 pop.California :
1.49 / 10,000 pop.
Number of full-service restaurants : 7,008Here :
7.15 / 10,000 pop.California :
7.42 / 10,000 pop.
Adult diabetes rate : This county :
7.5%California :
7.3%
Adult obesity rate : This county :
20.4%California :
21.3%
Low-income preschool obesity rate : Los Angeles County :
18.6%California :
17.9%
Health and Nutrition: Healthy diet rate : Downey:
49.1%California:
49.4%
Average overall health of teeth and gums : This city:
48.9%California:
48.0%
Average BMI : This city:
28.3California:
28.1
People feeling badly about themselves : Downey:
19.5%California:
20.2%
People not drinking alcohol at all : Downey:
11.4%California:
11.2%
Average hours sleeping at night : Overweight people : Downey:
32.4%California:
31.5%
General health condition : This city:
56.6%State:
56.4%
Average condition of hearing : This city:
81.6%California:
80.9%
More about Health and Nutrition of Downey, CA Residents
Local government employment and payroll (March 2022)
Function
Full-time employees
Monthly full-time payroll
Average yearly full-time wage
Part-time employees
Monthly part-time payroll
Police Protection - Officers
120 $1,484,774 $148,477 0 $0 Firefighters
66 $1,077,159 $195,847 0 $0 Police - Other
41 $239,966 $70,234 21 $30,883 Fire - Other
37 $252,947 $82,037 2 $2,964 Streets and Highways
36 $274,523 $91,508 13 $13,524 Water Supply
21 $154,375 $88,214 0 $0 Housing and Community Development (Local)
20 $153,634 $92,180 0 $0 Financial Administration
15 $103,080 $82,464 0 $0 Other Government Administration
15 $159,762 $127,810 2 $3,234 Parks and Recreation
8 $53,074 $79,611 120 $60,179 Local Libraries
7 $41,236 $70,690 24 $29,492 Sewerage
2 $11,731 $70,386 0 $0 Other and Unallocable
2 $14,128 $84,768 22 $28,976 Solid Waste Management
1 $8,233 $98,796 1 $1,122 Transit
1 $3,450 $41,400 0 $0 Judicial and Legal
1 $19,450 $233,400 1 $2,950
Totals for Government
393 $4,051,520 $123,711 206 $173,324
Downey government finances - Expenditure in 2017 (per resident):
Construction - Housing and Community Development: $4,159,000 ($37.83)
Parks and Recreation: $1,534,000 ($13.95)Water Utilities: $610,000 ($5.55)Police Protection: $136,000 ($1.24)Current Operations - Police Protection: $35,771,000 ($325.39)
Local Fire Protection: $17,870,000 ($162.55)Central Staff Services: $14,179,000 ($128.98)Parks and Recreation: $11,773,000 ($107.09)Water Utilities: $10,473,000 ($95.27)Health - Other: $5,121,000 ($46.58)Regular Highways: $4,471,000 ($40.67)Financial Administration: $2,752,000 ($25.03)Sewerage: $2,512,000 ($22.85)Transit Utilities: $2,512,000 ($22.85)Libraries: $2,034,000 ($18.50)Housing and Community Development: $1,395,000 ($12.69)Protective Inspection and Regulation - Other: $984,000 ($8.95)Solid Waste Management: $576,000 ($5.24)General - Interest on Debt: $1,160,000 ($10.55)
Other Capital Outlay - Parks and Recreation: $941,000 ($8.56)
Local Fire Protection: $80,000 ($0.73)Transit Utilities: $75,000 ($0.68)Regular Highways: $60,000 ($0.55)Protective Inspection and Regulation - Other: $58,000 ($0.53)Central Staff Services: $8,000 ($0.07)Total Salaries and Wages: $648,000 ($5.89)
Downey government finances - Revenue in 2017 (per resident):
Charges - Other: $7,301,000 ($66.41)
Parks and Recreation: $4,527,000 ($41.18)Regular Highways: $1,783,000 ($16.22)Sewerage: $1,583,000 ($14.40)Federal Intergovernmental - Other: $7,631,000 ($69.41)
Housing and Community Development: $1,070,000 ($9.73)Local Intergovernmental - Transit Utilities: $2,973,000 ($27.04)
Other: $234,000 ($2.13)Miscellaneous - General Revenue - Other: $6,645,000 ($60.45)
Fines and Forfeits: $2,851,000 ($25.93)Interest Earnings: $1,525,000 ($13.87)Rents: $1,278,000 ($11.63)Sale of Property: $700,000 ($6.37)Donations From Private Sources: $20,000 ($0.18)Revenue - Water Utilities: $16,902,000 ($153.75)
Transit Utilities: $127,000 ($1.16)State Intergovernmental - Other: $4,890,000 ($44.48)
Highways: $2,200,000 ($20.01)General Local Government Support: $84,000 ($0.76)Tax - Property: $26,382,000 ($239.98)
General Sales and Gross Receipts: $22,203,000 ($201.97)Public Utilities Sales: $9,617,000 ($87.48)Other License: $2,298,000 ($20.90)Other Selective Sales: $1,701,000 ($15.47)Occupation and Business License - Other: $1,383,000 ($12.58)Documentary and Stock Transfer: $300,000 ($2.73)
Downey government finances - Debt in 2017 (per resident):
Long Term Debt - Beginning Outstanding - Unspecified Public Purpose: $28,979,000 ($263.60)
Outstanding Unspecified Public Purpose: $28,400,000 ($258.34)Retired Unspecified Public Purpose: $1,275,000 ($11.60)Issue, Unspecified Public Purpose: $696,000 ($6.33)
Downey government finances - Cash and Securities in 2017 (per resident):
Bond Funds - Cash and Securities: $2,988,000 ($27.18)
Other Funds - Cash and Securities: $75,041,000 ($682.60)
Sinking Funds - Cash and Securities: $2,816,000 ($25.62)
2.98% of this county's 2021 resident taxpayers lived in other counties in 2020 ($81,235 average adjusted gross income )
Here:
2.98%California average:
5.19%
0.01% of residents moved from foreign countries ($155 average AGI )Los Angeles County:
0.01%California average:
0.03%
Top counties from which taxpayers relocated into this county between 2020 and 2021:
4.68% of this county's 2020 resident taxpayers moved to other counties in 2021 ($97,324 average adjusted gross income )
Here:
4.68%California average:
6.14%
0.01% of residents moved to foreign countries ($196 average AGI )Los Angeles County:
0.01%California average:
0.02%
Top counties to which taxpayers relocated from this county between 2020 and 2021:
Businesses in Downey, CA
Name Count Name Count
7-Eleven 2 Journeys 1 99 Cents Only Stores 1 Just Tires 1 ALDO 1 KFC 2 AT&T 1 Kohl's 1 Aeropostale 1 Kroger 3 Albertsons 1 LA Fitness 2 Arby's 1 Lane Bryant 1 AutoZone 2 Lane Furniture 2 Avenue 1 LensCrafters 1 Bakers 1 Little Caesars Pizza 2 Bally Total Fitness 1 Macy's 1 Baskin-Robbins 1 Marshalls 1 Bath & Body Works 1 MasterBrand Cabinets 3 Bed Bath & Beyond 1 McDonald's 7 Blockbuster 2 Men's Wearhouse 1 Burger King 2 Motherhood Maternity 2 CVS 3 New York & Co 1 Carl\s Jr. 3 Nike 10 Casual Male XL 1 Nissan 1 Charlotte Russe 1 OfficeMax 1 Chipotle 1 Old Navy 1 Cinnabon 1 Olive Garden 1 Circle K 1 Pac Sun 1 Cold Stone Creamery 1 Panda Express 1 Comfort Inn 1 Papa John's Pizza 1 Curves 1 Penske 1 Dairy Queen 1 PetSmart 1 Days Inn 1 Pier 1 Imports 1 Dennys 1 Pizza Hut 2 Domino's Pizza 2 Quiznos 1 El Pollo Loco 2 RadioShack 2 Express 1 Rite Aid 1 Famous Footwear 1 SAS Shoes 1 FedEx 11 Sears 2 Finish Line 1 Sephora 1 Firestone Complete Auto Care 1 Spencer Gifts 1 Foot Locker 1 Sprint Nextel 4 Forever 21 1 Staples 1 Fredericks Of Hollywood 1 Starbucks 3 GNC 2 T-Mobile 7 GameStop 2 Taco Bell 2 Goodwill 1 Torrid 1 H&R Block 3 Toyota 1 Hilton 1 Toys"R"Us 1 Hollister Co. 1 U-Haul 1 Home Depot 1 UPS 6 HomeTown Buffet 1 Vans 6 Honda 1 Verizon Wireless 4 Hot Topic 1 Victoria's Secret 1 IHOP 1 Walgreens 2 JCPenney 1 Wendy's 1 Jack In The Box 5 Wet Seal 1 Jamba Juice 1 YMCA 1 Jones New York 4
Strongest AM radio stations in Downey:
KFI (640 AM; 50 kW; LOS ANGELES, CA; Owner: CAPSTAR TX LIMITED PARTNERSHIP)
KFWB (980 AM; 50 kW; LOS ANGELES, CA; Owner: INFINITY BROADCASTING OPERATIONS, INC.)
KTNQ (1020 AM; 50 kW; LOS ANGELES, CA; Owner: KTNQ-AM LICENSE CORP.)
KLAC (570 AM; 50 kW; LOS ANGELES, CA; Owner: AMFM RADIO LICENSES, L.L.C.)
KXTA (1150 AM; 50 kW; LOS ANGELES, CA; Owner: CITICASTERS LICENSES, L.P.)
KMPC (1540 AM; 50 kW; LOS ANGELES, CA; Owner: ROSE CITY RADIO CORPORATION)
KNX (1070 AM; 50 kW; LOS ANGELES, CA; Owner: INFINITY BROADCASTING OPERATIONS, INC.)
KDIS (1110 AM; 50 kW; PASADENA, CA; Owner: ABC,INC.)
KBLA (1580 AM; 50 kW; SANTA MONICA, CA)
KLTX (1390 AM; 5 kW; LONG BEACH, CA; Owner: HI-FAVOR BROADCASTING, LLC)
KXMX (1190 AM; 25 kW; ANAHEIM, CA; Owner: NEW INSPIRATION BROADCASTING COMPANY)
KSPN (710 AM; 50 kW; LOS ANGELES, CA; Owner: KABC-AM RADIO, INC.)
KRLA (870 AM; 20 kW; GLENDALE, CA; Owner: NEW INSPIRATION BROADCASTING COMPANY)
Strongest FM radio stations in Downey:
KZLA-FM (93.9 FM; LOS ANGELES, CA; Owner: EMMIS RADIO LICENSE CORPORATION)
KPWR (105.9 FM; LOS ANGELES, CA; Owner: EMMIS RADIO LICENSE CORPORATION)
KLSX (97.1 FM; LOS ANGELES, CA; Owner: INFINITY BROADCASTING OPERATIONS, INC.)
KUSC (91.5 FM; LOS ANGELES, CA; Owner: UNIVERSITY OF SOUTHERN CALIFORNIA)
KKLA-FM (99.5 FM; LOS ANGELES, CA; Owner: NEW INSPIRATION BROADCASTING CO., INC.)
KCBS-FM (93.1 FM; LOS ANGELES, CA; Owner: INFINITY BROADCASTING OPERATIONS, INC.)
KRTH-FM (101.1 FM; LOS ANGELES, CA; Owner: INFINITY BROADCASTING OPERATIONS, INC.)
KKBT (100.3 FM; LOS ANGELES, CA; Owner: RADIO ONE LICENSES, LLC)
KSCA (101.9 FM; GLENDALE, CA; Owner: HBC LICENSE CORPORATION)
KLOS (95.5 FM; LOS ANGELES, CA; Owner: KLOS-FM RADIO, INC.)
K212FA (90.3 FM; TEMPLE CITY, CA; Owner: EDUCATIONAL MEDIA FOUNDATION)
KOST (103.5 FM; LOS ANGELES, CA; Owner: CAPSTAR TX LIMITED PARTNERSHIP)
KIIS-FM (102.7 FM; LOS ANGELES, CA; Owner: CITICASTERS LICENSES, L.P.)
KLVE (107.5 FM; LOS ANGELES, CA; Owner: KLVE-FM LICENSE CORP.)
KPCC (89.3 FM; PASADENA, CA; Owner: PASADENA AREA COMMUNITY COLLEGE DISTRICT)
KHHT (92.3 FM; LOS ANGELES, CA; Owner: AMFM RADIO LICENSES, L.L.C.)
KBIG-FM (104.3 FM; LOS ANGELES, CA; Owner: AMFM RADIO LICENSES, L.L.C.)
KMZT-FM (105.1 FM; LOS ANGELES, CA; Owner: MOUNT WILSON FM BROADCASTERS, INC.)
KTWV (94.7 FM; LOS ANGELES, CA; Owner: INFINITY BROADCASTING OPERATIONS, INC.)
KPFK (90.7 FM; LOS ANGELES, CA; Owner: PACIFICA FOUNDATION, INC)
TV broadcast stations around Downey:
KCBS-TV (Channel 2; LOS ANGELES, CA; Owner: CBS BROADCASTING INC.)
KTRO-LP (Channel 50; LANCASTER, CA; Owner: ROBERT D. ADELMAN)
KTLA-TV (Channel 5; LOS ANGELES, CA; Owner: KTLA INC.)
KABC-TV (Channel 7; LOS ANGELES, CA; Owner: ABC HOLDING COMPANY, INC.)
KCAL-TV (Channel 9; LOS ANGELES, CA; Owner: VIACOM TELEVISION STATIONS GROUP OF LOS ANGELES LLC)
KNBC (Channel 4; LOS ANGELES, CA; Owner: NBC SUBSIDIARY (KNBC-TV), INC.)
KMEX-TV (Channel 34; LOS ANGELES, CA; Owner: KMEX LICENSE PARTNERSHIP, G.P.)
KAZA-TV (Channel 54; AVALON, CA; Owner: PAPPAS SOUTHERN CALIFORNIA LICENSE LLC)
KDOC-TV (Channel 56; ANAHEIM, CA; Owner: GOLDEN ORANGE BROADCASTING CO., INC.)
KOCE-TV (Channel 50; HUNTINGTON BEACH, CA; Owner: BD. OF TRUSTEES, COAST COMMUNITY COLLEGE DIST.)
KSCI (Channel 18; LONG BEACH, CA; Owner: KSLS, INC.)
KXLA (Channel 44; RANCHO PALOS VERDES, CA; Owner: RANCHO PALOS VERDES BROADCASTERS, INC.)
KCET (Channel 28; LOS ANGELES, CA; Owner: COMMUNITY TELEVISION OF SOUTHERN CALIFORNIA)
KFTR (Channel 46; ONTARIO, CA; Owner: TELEFUTURA LOS ANGELES LLC)
KTTV (Channel 11; LOS ANGELES, CA; Owner: FOX TELEVISION STATIONS, INC.)
KWHY-TV (Channel 22; LOS ANGELES, CA; Owner: TELEMUNDO OF LOS ANGELES LICENSE CORPORATION)
KVEA (Channel 52; CORONA, CA; Owner: ESTRELLA LICENSE CORPORATION)
KCOP-TV (Channel 13; LOS ANGELES, CA; Owner: FOX TELEVISION STATIONS, INC.)
National Bridge Inventory (NBI) Statistics 51 Number of bridges702ft / 214m Total length $7,530,000 Total costs4,976,401 Total average daily traffic330,231 Total average daily truck traffic
New bridges - historical statistics
1 1910-1919 8 1950-1959 13 1960-1969 2 1970-1979 24 1980-1989 3 1990-1999
See full National Bridge Inventory statistics for Downey, CA
Home Mortgage Disclosure Act Aggregated Statistics For Year 2009(Based on 17 full tracts) A) FHA, FSA/RHS & VA B) Conventional C) Refinancings D) Home Improvement Loans E) Loans on Dwellings For 5+ Families F) Non-occupant Loans on G) Loans On Manufactured Number Average Value Number Average Value Number Average Value Number Average Value Number Average Value Number Average Value Number Average Value
LOANS ORIGINATED 353 $345,081 364 $312,858 1,127 $281,584 51 $173,957 12 $2,509,083 108 $274,760 0 $0 APPLICATIONS APPROVED, NOT ACCEPTED 38 $332,921 59 $330,147 160 $315,524 13 $166,460 1 $1,700,000 10 $251,700 1 $50,000 APPLICATIONS DENIED 93 $382,234 109 $352,620 556 $329,094 34 $137,875 6 $1,652,500 42 $304,059 0 $0 APPLICATIONS WITHDRAWN 57 $342,347 90 $319,753 281 $319,233 12 $193,000 1 $7,600,000 23 $267,322 0 $0 FILES CLOSED FOR INCOMPLETENESS 21 $349,739 34 $329,309 114 $337,369 10 $91,400 0 $0 3 $363,667 0 $0
Aggregated Statistics For Year 2008(Based on 17 full tracts) A) FHA, FSA/RHS & VA B) Conventional C) Refinancings D) Home Improvement Loans E) Loans on Dwellings For 5+ Families F) Non-occupant Loans on G) Loans On Manufactured Number Average Value Number Average Value Number Average Value Number Average Value Number Average Value Number Average Value Number Average Value
LOANS ORIGINATED 151 $372,298 492 $339,362 695 $315,485 119 $187,058 39 $3,301,205 104 $285,175 3 $59,000 APPLICATIONS APPROVED, NOT ACCEPTED 11 $413,000 133 $340,894 249 $338,717 23 $159,782 3 $2,037,000 27 $310,148 4 $97,962 APPLICATIONS DENIED 44 $375,418 249 $384,791 714 $403,156 132 $176,001 1 $500,000 65 $351,517 12 $68,914 APPLICATIONS WITHDRAWN 32 $353,049 150 $352,632 245 $365,118 32 $195,851 4 $13,782,750 32 $302,781 1 $73,000 FILES CLOSED FOR INCOMPLETENESS 11 $345,033 31 $368,725 95 $439,225 13 $281,842 1 $581,000 7 $377,429 0 $0
Aggregated Statistics For Year 2007(Based on 16 full tracts) A) FHA, FSA/RHS & VA B) Conventional C) Refinancings D) Home Improvement Loans E) Loans on Dwellings For 5+ Families F) Non-occupant Loans on G) Loans On Manufactured Number Average Value Number Average Value Number Average Value Number Average Value Number Average Value Number Average Value Number Average Value
LOANS ORIGINATED 0 $0 814 $409,024 1,865 $391,651 324 $239,508 41 $1,171,902 194 $403,505 3 $61,667 APPLICATIONS APPROVED, NOT ACCEPTED 0 $0 274 $369,929 499 $399,513 72 $253,651 2 $500,000 50 $406,575 11 $60,635 APPLICATIONS DENIED 0 $0 667 $449,930 1,418 $433,709 266 $225,443 3 $1,292,000 132 $414,324 12 $134,397 APPLICATIONS WITHDRAWN 1 $54,000 241 $400,759 577 $405,470 95 $291,242 4 $1,230,825 63 $411,885 1 $108,000 FILES CLOSED FOR INCOMPLETENESS 0 $0 104 $398,134 204 $404,995 16 $269,562 1 $635,000 19 $385,683 0 $0
Aggregated Statistics For Year 2006(Based on 17 full tracts) A) FHA, FSA/RHS & VA B) Conventional C) Refinancings D) Home Improvement Loans E) Loans on Dwellings For 5+ Families F) Non-occupant Loans on G) Loans On Manufactured Number Average Value Number Average Value Number Average Value Number Average Value Number Average Value Number Average Value Number Average Value
LOANS ORIGINATED 1 $354,000 1,652 $376,704 2,544 $386,268 501 $396,264 50 $2,173,420 278 $373,804 4 $77,750 APPLICATIONS APPROVED, NOT ACCEPTED 0 $0 400 $377,591 639 $394,138 60 $304,100 0 $0 74 $400,615 16 $71,498 APPLICATIONS DENIED 0 $0 922 $407,831 1,343 $424,831 293 $225,993 9 $1,235,444 155 $413,606 7 $123,987 APPLICATIONS WITHDRAWN 0 $0 434 $414,720 910 $387,115 137 $293,086 5 $2,918,400 83 $388,653 0 $0 FILES CLOSED FOR INCOMPLETENESS 0 $0 99 $353,099 258 $418,789 23 $245,565 0 $0 15 $370,633 1 $377,000
Aggregated Statistics For Year 2005(Based on 17 full tracts) A) FHA, FSA/RHS & VA B) Conventional C) Refinancings D) Home Improvement Loans E) Loans on Dwellings For 5+ Families F) Non-occupant Loans on G) Loans On Manufactured Number Average Value Number Average Value Number Average Value Number Average Value Number Average Value Number Average Value Number Average Value
LOANS ORIGINATED 2 $286,500 1,910 $339,125 3,076 $339,333 488 $217,562 50 $1,404,813 329 $322,267 3 $180,597 APPLICATIONS APPROVED, NOT ACCEPTED 0 $0 379 $289,604 604 $323,196 86 $202,273 0 $0 66 $299,708 13 $73,148 APPLICATIONS DENIED 1 $313,000 775 $356,814 1,300 $363,154 306 $171,536 3 $745,000 133 $340,162 15 $76,733 APPLICATIONS WITHDRAWN 2 $215,500 453 $353,617 987 $348,385 173 $224,107 2 $1,260,000 71 $342,913 2 $325,000 FILES CLOSED FOR INCOMPLETENESS 0 $0 129 $355,456 337 $347,388 33 $178,620 0 $0 18 $283,319 0 $0
Aggregated Statistics For Year 2004(Based on 17 full tracts) A) FHA, FSA/RHS & VA B) Conventional C) Refinancings D) Home Improvement Loans E) Loans on Dwellings For 5+ Families F) Non-occupant Loans on G) Loans On Manufactured Number Average Value Number Average Value Number Average Value Number Average Value Number Average Value Number Average Value Number Average Value
LOANS ORIGINATED 14 $264,426 1,882 $287,683 3,547 $272,150 428 $190,364 50 $1,302,750 302 $265,270 5 $57,400 APPLICATIONS APPROVED, NOT ACCEPTED 0 $0 358 $289,581 706 $274,959 63 $192,655 0 $0 70 $283,378 0 $0 APPLICATIONS DENIED 1 $200,000 556 $286,636 1,181 $280,804 262 $145,222 3 $314,667 128 $270,609 4 $77,000 APPLICATIONS WITHDRAWN 2 $106,395 372 $271,403 892 $275,058 97 $152,976 4 $997,500 56 $238,800 3 $33,983 FILES CLOSED FOR INCOMPLETENESS 1 $163,000 81 $285,770 443 $289,101 19 $167,315 0 $0 21 $301,429 0 $0
Aggregated Statistics For Year 2003(Based on 17 full tracts) A) FHA, FSA/RHS & VA B) Conventional C) Refinancings D) Home Improvement Loans E) Loans on Dwellings For 5+ Families F) Non-occupant Loans on Number Average Value Number Average Value Number Average Value Number Average Value Number Average Value Number Average Value
LOANS ORIGINATED 44 $206,935 1,554 $233,435 5,924 $209,362 175 $56,566 61 $1,073,197 361 $205,687 APPLICATIONS APPROVED, NOT ACCEPTED 1 $226,000 283 $250,720 883 $218,347 54 $95,276 1 $500,000 75 $229,529 APPLICATIONS DENIED 9 $239,537 435 $234,078 1,478 $222,929 124 $61,343 2 $558,500 105 $225,679 APPLICATIONS WITHDRAWN 11 $217,909 273 $227,483 1,124 $212,734 32 $96,872 1 $3,600,000 59 $204,287 FILES CLOSED FOR INCOMPLETENESS 1 $230,000 66 $231,881 270 $217,351 18 $45,109 0 $0 14 $188,857
Aggregated Statistics For Year 2002(Based on 15 full tracts) A) FHA, FSA/RHS & VA B) Conventional C) Refinancings D) Home Improvement Loans E) Loans on Dwellings For 5+ Families F) Non-occupant Loans on Number Average Value Number Average Value Number Average Value Number Average Value Number Average Value Number Average Value
LOANS ORIGINATED 86 $202,615 1,219 $210,497 3,396 $194,591 119 $50,469 49 $874,837 197 $175,218 APPLICATIONS APPROVED, NOT ACCEPTED 11 $166,995 202 $222,377 534 $200,150 32 $37,594 2 $1,587,500 33 $171,936 APPLICATIONS DENIED 24 $190,717 284 $221,547 900 $191,195 118 $38,558 4 $1,165,000 37 $202,811 APPLICATIONS WITHDRAWN 19 $189,720 226 $199,590 695 $195,008 41 $48,779 5 $708,000 26 $171,962 FILES CLOSED FOR INCOMPLETENESS 4 $179,150 83 $189,673 333 $199,852 6 $47,000 3 $1,433,333 17 $181,524
Aggregated Statistics For Year 2001(Based on 14 full tracts) A) FHA, FSA/RHS & VA B) Conventional C) Refinancings D) Home Improvement Loans E) Loans on Dwellings For 5+ Families F) Non-occupant Loans on Number Average Value Number Average Value Number Average Value Number Average Value Number Average Value Number Average Value
LOANS ORIGINATED 240 $193,101 1,020 $184,186 2,433 $174,759 111 $38,566 36 $736,611 158 $171,738 APPLICATIONS APPROVED, NOT ACCEPTED 30 $183,205 129 $182,599 397 $179,545 28 $50,857 2 $390,000 23 $164,261 APPLICATIONS DENIED 38 $190,387 218 $191,451 940 $174,506 143 $38,230 10 $801,000 39 $158,046 APPLICATIONS WITHDRAWN 57 $189,583 157 $189,528 671 $176,140 68 $51,026 6 $804,000 42 $158,304 FILES CLOSED FOR INCOMPLETENESS 8 $157,844 44 $176,836 188 $196,104 2 $29,990 12 $1,079,333 12 $123,083
Aggregated Statistics For Year 2000(Based on 15 full tracts) A) FHA, FSA/RHS & VA B) Conventional C) Refinancings D) Home Improvement Loans E) Loans on Dwellings For 5+ Families F) Non-occupant Loans on Number Average Value Number Average Value Number Average Value Number Average Value Number Average Value Number Average Value
LOANS ORIGINATED 259 $180,171 889 $175,782 573 $168,676 153 $37,660 21 $603,238 53 $170,337 APPLICATIONS APPROVED, NOT ACCEPTED 21 $174,686 104 $182,027 145 $140,830 60 $27,350 0 $0 21 $131,619 APPLICATIONS DENIED 37 $162,103 247 $187,250 498 $131,970 166 $32,413 7 $540,286 24 $143,537 APPLICATIONS WITHDRAWN 33 $171,325 161 $184,209 213 $116,792 35 $39,086 3 $3,555,000 6 $153,167 FILES CLOSED FOR INCOMPLETENESS 9 $164,207 58 $194,704 150 $183,008 10 $34,100 6 $1,433,833 7 $159,000
Aggregated Statistics For Year 1999(Based on 13 full and 3 partial tracts) A) FHA, FSA/RHS & VA B) Conventional C) Refinancings D) Home Improvement Loans E) Loans on Dwellings For 5+ Families F) Non-occupant Loans on Number Average Value Number Average Value Number Average Value Number Average Value Number Average Value Number Average Value
LOANS ORIGINATED 370 $170,830 896 $170,702 1,239 $150,798 185 $24,716 32 $583,299 110 $136,910 APPLICATIONS APPROVED, NOT ACCEPTED 18 $183,023 114 $175,511 285 $154,728 92 $27,952 2 $77,815 20 $127,418 APPLICATIONS DENIED 60 $154,911 251 $163,394 639 $145,470 162 $30,989 4 $397,870 41 $113,293 APPLICATIONS WITHDRAWN 55 $159,860 164 $161,251 407 $153,897 27 $47,147 5 $415,572 27 $159,747 FILES CLOSED FOR INCOMPLETENESS 11 $167,213 48 $179,715 183 $169,498 6 $30,860 3 $761,407 10 $171,025
Detailed mortgage data for all 17 tracts in Downey, CA
Private Mortgage Insurance Companies Aggregated Statistics For Year 2009(Based on 16 full tracts) A) Conventional B) Refinancings C) Non-occupant Loans on Number Average Value Number Average Value Number Average Value
LOANS ORIGINATED 58 $339,759 4 $369,250 0 $0 APPLICATIONS APPROVED, NOT ACCEPTED 34 $318,416 7 $350,714 1 $289,000 APPLICATIONS DENIED 11 $394,636 6 $350,950 0 $0 APPLICATIONS WITHDRAWN 5 $395,600 3 $342,667 0 $0 FILES CLOSED FOR INCOMPLETENESS 6 $382,667 0 $0 0 $0
Aggregated Statistics For Year 2008(Based on 16 full tracts) A) Conventional B) Refinancings C) Non-occupant Loans on Number Average Value Number Average Value Number Average Value
LOANS ORIGINATED 163 $362,306 18 $411,167 4 $338,750 APPLICATIONS APPROVED, NOT ACCEPTED 65 $402,931 20 $425,518 7 $358,714 APPLICATIONS DENIED 16 $403,663 4 $387,402 5 $308,200 APPLICATIONS WITHDRAWN 14 $369,111 5 $353,726 0 $0 FILES CLOSED FOR INCOMPLETENESS 5 $399,000 0 $0 0 $0
Aggregated Statistics For Year 2007(Based on 16 full tracts) A) Conventional B) Refinancings C) Non-occupant Loans on Number Average Value Number Average Value Number Average Value
LOANS ORIGINATED 48 $471,109 30 $466,119 3 $403,333 APPLICATIONS APPROVED, NOT ACCEPTED 7 $526,571 26 $483,319 0 $0 APPLICATIONS DENIED 6 $549,000 6 $562,010 2 $578,725 APPLICATIONS WITHDRAWN 6 $405,095 4 $557,750 0 $0 FILES CLOSED FOR INCOMPLETENESS 0 $0 0 $0 0 $0
Aggregated Statistics For Year 2006(Based on 16 full tracts) A) Conventional B) Refinancings C) Non-occupant Loans on Number Average Value Number Average Value Number Average Value
LOANS ORIGINATED 20 $514,270 12 $450,234 2 $283,500 APPLICATIONS APPROVED, NOT ACCEPTED 5 $506,200 9 $473,111 1 $594,000 APPLICATIONS DENIED 0 $0 0 $0 0 $0 APPLICATIONS WITHDRAWN 2 $470,500 6 $552,000 0 $0 FILES CLOSED FOR INCOMPLETENESS 0 $0 1 $529,000 0 $0
Aggregated Statistics For Year 2005(Based on 15 full tracts) A) Conventional B) Refinancings C) Non-occupant Loans on Number Average Value Number Average Value Number Average Value
LOANS ORIGINATED 27 $437,111 17 $360,862 5 $492,000 APPLICATIONS APPROVED, NOT ACCEPTED 8 $354,750 9 $396,000 1 $392,000 APPLICATIONS DENIED 1 $446,000 2 $405,000 1 $446,000 APPLICATIONS WITHDRAWN 0 $0 5 $455,924 0 $0 FILES CLOSED FOR INCOMPLETENESS 0 $0 2 $410,000 0 $0
Aggregated Statistics For Year 2004(Based on 17 full tracts) A) Conventional B) Refinancings C) Non-occupant Loans on Number Average Value Number Average Value Number Average Value
LOANS ORIGINATED 65 $356,161 46 $335,359 8 $355,500 APPLICATIONS APPROVED, NOT ACCEPTED 30 $331,650 34 $284,107 4 $318,200 APPLICATIONS DENIED 4 $313,695 0 $0 1 $356,000 APPLICATIONS WITHDRAWN 9 $303,418 2 $391,000 2 $260,500 FILES CLOSED FOR INCOMPLETENESS 2 $373,000 1 $269,000 0 $0
Aggregated Statistics For Year 2003(Based on 16 full tracts) A) Conventional B) Refinancings C) Non-occupant Loans on Number Average Value Number Average Value Number Average Value
LOANS ORIGINATED 229 $272,073 131 $254,516 10 $248,900 APPLICATIONS APPROVED, NOT ACCEPTED 51 $263,233 54 $242,210 1 $297,000 APPLICATIONS DENIED 4 $311,500 2 $271,500 0 $0 APPLICATIONS WITHDRAWN 9 $269,778 12 $234,750 0 $0 FILES CLOSED FOR INCOMPLETENESS 0 $0 1 $270,000 0 $0
Aggregated Statistics For Year 2002(Based on 14 full tracts) A) Conventional B) Refinancings C) Non-occupant Loans on Number Average Value Number Average Value Number Average Value
LOANS ORIGINATED 310 $239,732 153 $222,036 5 $192,368 APPLICATIONS APPROVED, NOT ACCEPTED 92 $242,395 65 $220,640 2 $65,500 APPLICATIONS DENIED 7 $223,571 3 $219,333 2 $216,000 APPLICATIONS WITHDRAWN 9 $221,544 13 $236,615 1 $103,900 FILES CLOSED FOR INCOMPLETENESS 3 $219,000 2 $202,000 0 $0
Aggregated Statistics For Year 2001(Based on 14 full tracts) A) Conventional B) Refinancings C) Non-occupant Loans on Number Average Value Number Average Value Number Average Value
LOANS ORIGINATED 288 $219,893 167 $209,543 9 $206,408 APPLICATIONS APPROVED, NOT ACCEPTED 64 $213,462 57 $206,365 4 $241,750 APPLICATIONS DENIED 16 $224,366 10 $220,900 0 $0 APPLICATIONS WITHDRAWN 21 $209,704 7 $246,683 0 $0 FILES CLOSED FOR INCOMPLETENESS 3 $133,627 0 $0 0 $0
Aggregated Statistics For Year 2000(Based on 15 full tracts) A) Conventional B) Refinancings C) Non-occupant Loans on Number Average Value Number Average Value Number Average Value
LOANS ORIGINATED 247 $198,961 59 $194,446 3 $165,667 APPLICATIONS APPROVED, NOT ACCEPTED 43 $199,417 25 $185,520 3 $152,333 APPLICATIONS DENIED 18 $238,270 3 $252,000 2 $142,000 APPLICATIONS WITHDRAWN 5 $179,400 3 $173,000 0 $0 FILES CLOSED FOR INCOMPLETENESS 3 $232,667 2 $351,000 0 $0
Aggregated Statistics For Year 1999(Based on 12 full and 3 partial tracts) A) Conventional B) Refinancings C) Non-occupant Loans on Number Average Value Number Average Value Number Average Value
LOANS ORIGINATED 276 $184,573 184 $177,692 9 $135,342 APPLICATIONS APPROVED, NOT ACCEPTED 38 $192,836 52 $184,003 3 $152,167 APPLICATIONS DENIED 15 $215,968 8 $228,974 0 $0 APPLICATIONS WITHDRAWN 11 $204,969 11 $213,578 1 $137,000 FILES CLOSED FOR INCOMPLETENESS 1 $300,860 6 $178,442 0 $0
Fire-safe hotels and motels in Downey, California:
Embassy Suites Hotel Los Angeles - Downey, 8425 Firestone Blvd, Downey, California 90241 Phone: (562) 861-1900, Fax: (562) 861-8885
Comfort Inn Downey, 9438 Firestone Blvd, Downey, California 90241 Phone: (562) 803-3555, Fax: (562) 803-0551
All 2 fire-safe hotels and motels in Downey, California
Most common first names in Downey, CA among deceased individuals Name Count Lived (average)
Mary 513 79.2 years John 491 73.9 years William 451 74.0 years Robert 368 70.9 years James 335 73.2 years Charles 306 73.7 years George 270 74.3 years Joseph 253 73.6 years Frank 219 75.7 years Margaret 201 79.5 years
Most common last names in Downey, CA among deceased individuals Last name Count Lived (average)
Smith 164 74.5 years Miller 113 77.6 years Johnson 111 78.3 years Jones 109 75.8 years Brown 98 75.4 years Williams 93 76.5 years Wilson 78 75.8 years Davis 77 72.5 years Garcia 73 68.7 years Moore 65 79.8 years
Downey compared to California state average:
Unemployed percentage below state average. Hispanic race population percentage above state average. Downey, CA compared to other similar cities:
#19 on the list of "Top 101 cities with the least people having professional degrees (population 50,000+)"
#22 on the list of "Top 101 cities with largest percentage of males in industries: wholesale trade (population 50,000+)"
#30 on the list of "Top 101 cities with largest percentage of males in occupations: fire fighting and prevention workers including supervisors (population 50,000+)"
#39 on the list of "Top 101 cities with the highest number of auto thefts per 100,000 residents, excludes tourist destinations and others with a lot of outsiders visiting based on city industries data (population 50,000+)"
#39 on the list of "Top 101 cities with the highest percentage of family households, population 100,000+"
#40 on the list of "Top 101 cities with largest percentage of females in occupations: sales and related occupations (population 50,000+)"
#41 on the list of "Top 101 cities with the highest cost per building permit(population 50,000+)"
#43 on the list of "Top 100 low-educated but high-earning cities (pop. 50,000+)"
#47 on the list of "Top 101 cities with the most cars per house, population 50,000+"
#48 on the list of "Top 101 cities with the lowest number of police officers per 1000 residents (population 50,000+)"
#49 on the list of "Top 101 cities with the largest racial income disparity between any two races with at least 2,000 householders"
#51 on the list of "Top 101 cities with largest percentage of males in occupations: health technologists and technicians (population 50,000+)"
#51 on the list of "Top 101 cities with the lowest percentage of English-only speaking households, population 50,000+"
#53 on the list of "Top 101 cities with the largest percentage of people in short-term care, detention or diagnostic centers for delinquent children (population 1,000+)"
#56 on the list of "Top 101 cities with largest percentage of females in occupations: construction and extraction occupations (population 50,000+)"
#66 on the list of "Top 101 cities with largest percentage of females in occupations: material moving occupations (population 50,000+)"
#69 on the list of "Top 101 cities with the largest city-data.com crime index per police officer (population 50,000+)"
#70 on the list of "Top 101 cities with fewest building permits per 10,000 residents (population 50,000+)"
#71 on the list of "Top 101 cities with the lowest number of arson incidents per 100,000 residents (population 50,000+)"
#74 on the list of "Top 101 larger cities with the highest increase in household income from 2000 (population 50,000+)"
#16 (90670) on the list of "Top 101 zip codes with the largest percentage of Welsh first ancestries (pop 5,000+)"
#66 (90240) on the list of "Top 101 zip codes with the largest percentage of Arab first ancestries"
#1 on the list of "Top 101 counties with the most Evangelical Protestant congregations"
#1 on the list of "Top 101 counties with the most Mainline Protestant congregations"
#1 on the list of "Top 101 counties with the most Orthodox adherents"
#1 on the list of "Top 101 counties with the highest ground withdrawal of fresh water for public supply (pop. 50,000+)"
#1 on the list of "Top 101 counties with the most Catholic adherents (pop. 50,000+)"
Top Patent Applicants
Michael Raley (18)
John Mccoy (9)
Roberto Aguayo (7)
Byung Chan Kang (6)
Franjo Baltorinic (6)
Larry Hayashigawa (6)
Michael C. Raley (6)
Oscar A. Puluc (4)
John Lin (4)
Andrea Furia (4)
Total of 166 patent applications in 2008-2024.
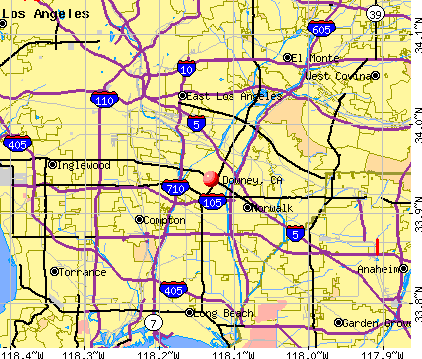


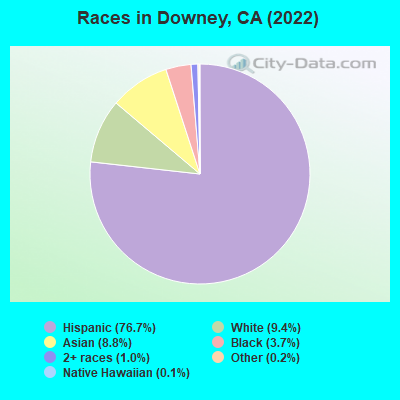
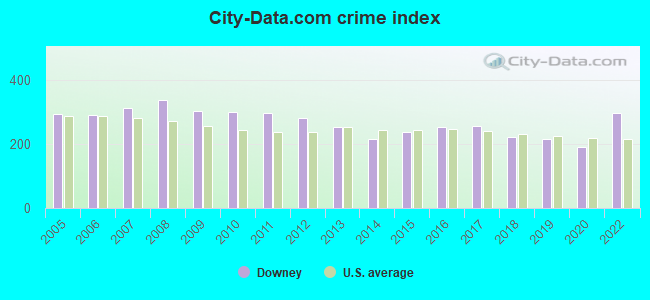
 Recent articles from our blog. Our writers, many of them Ph.D. graduates or candidates, create easy-to-read articles on a wide variety of topics.

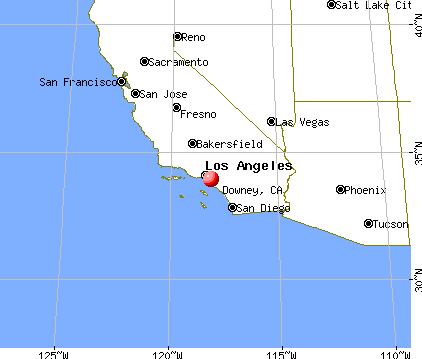
 , pop. 320,008).
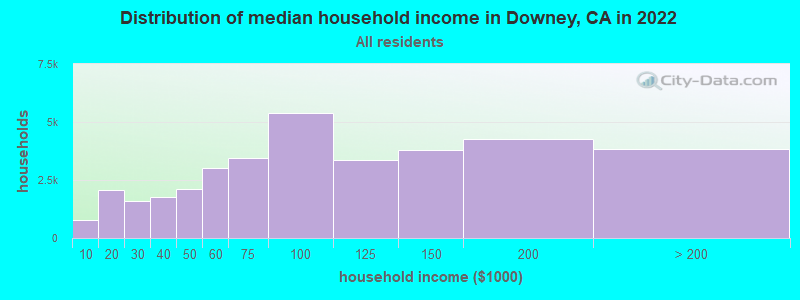

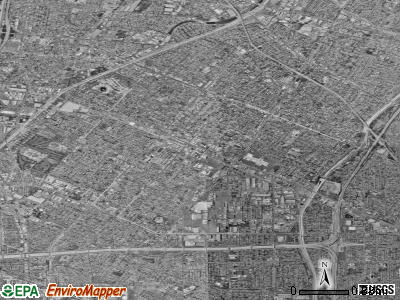
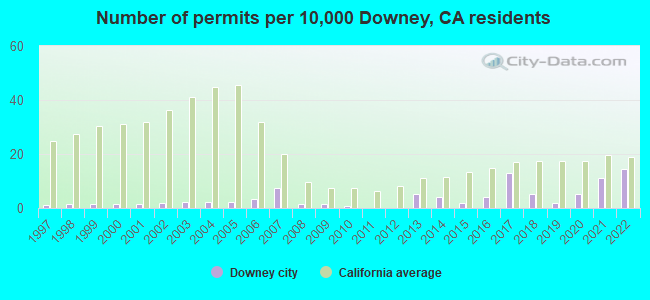
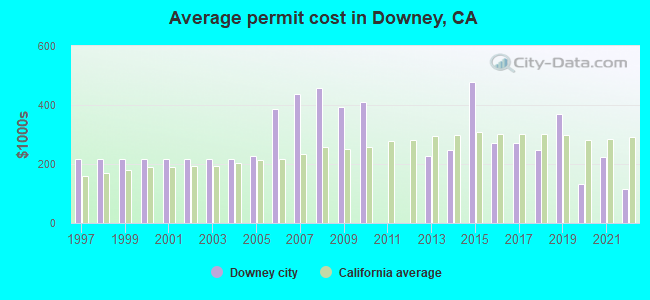
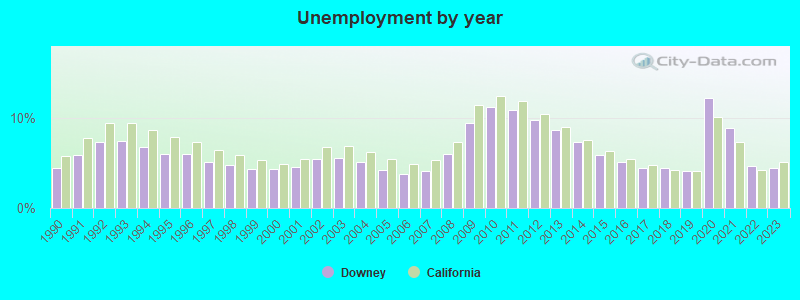
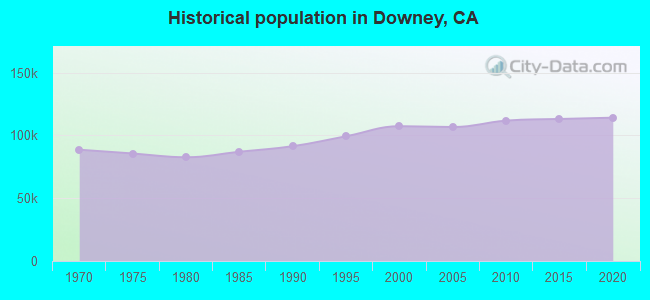
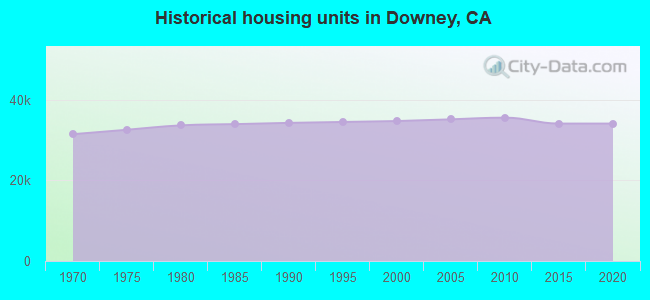
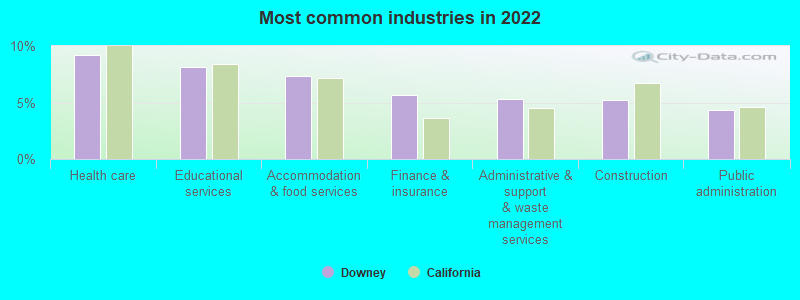
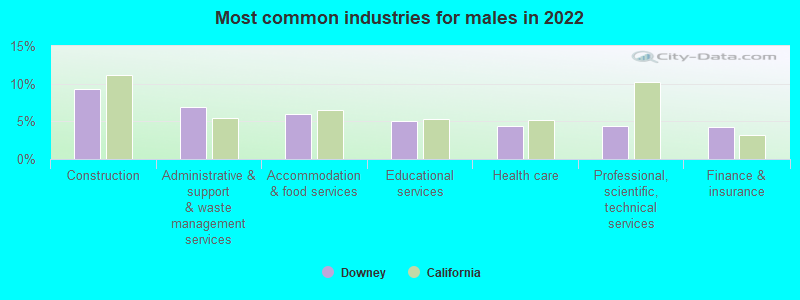
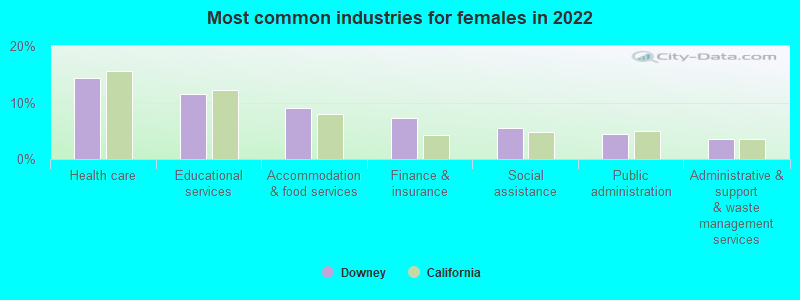
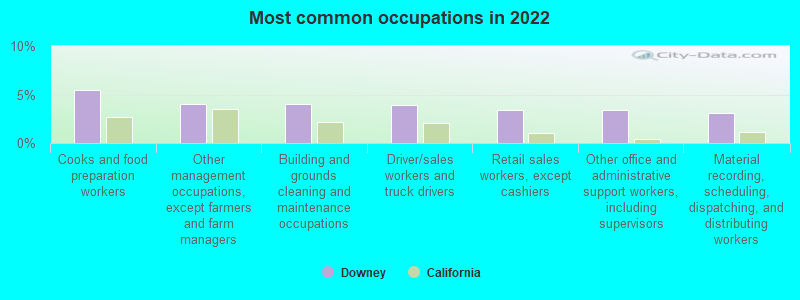
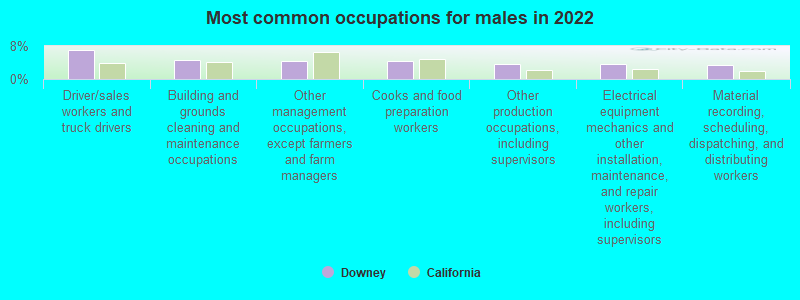
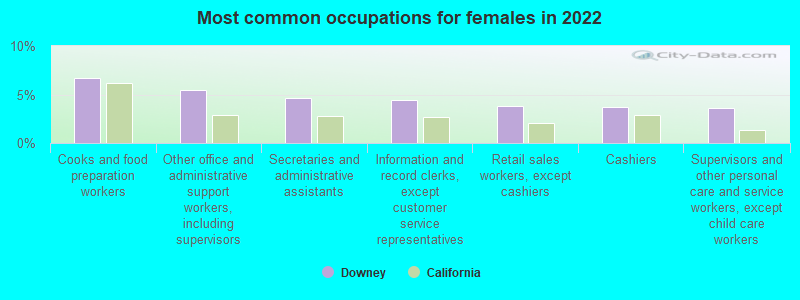
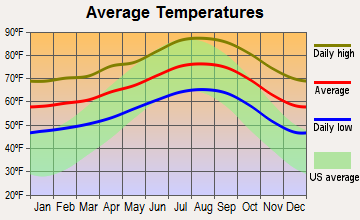
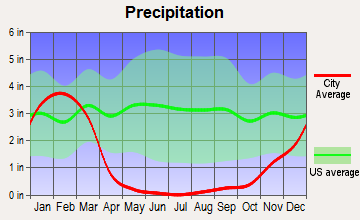
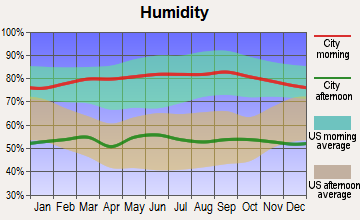
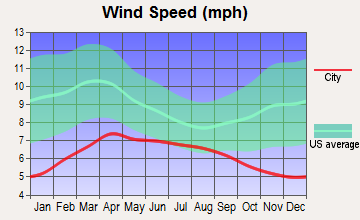
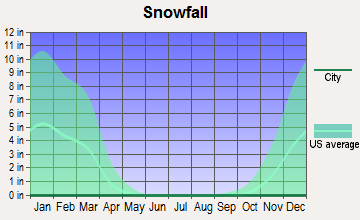
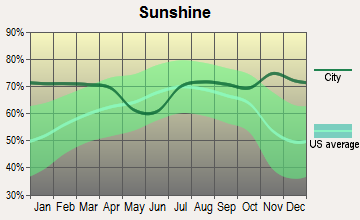
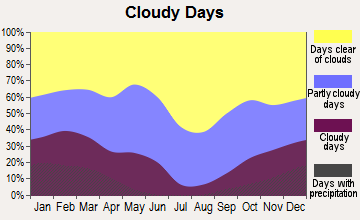
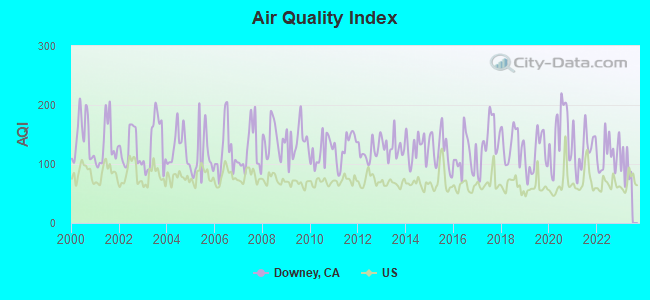
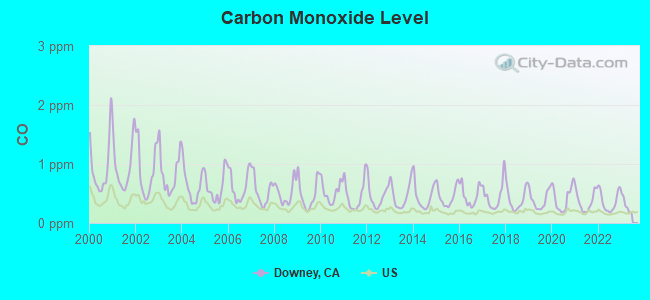
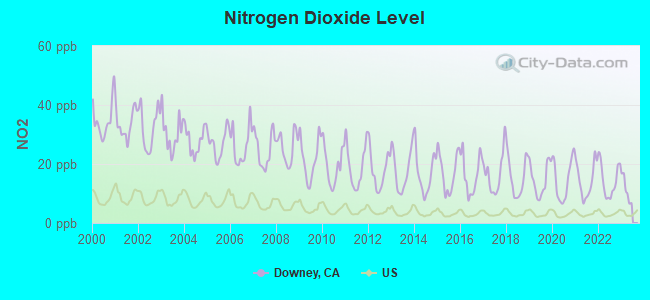
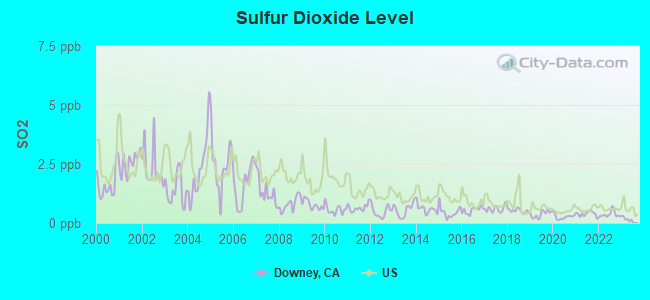
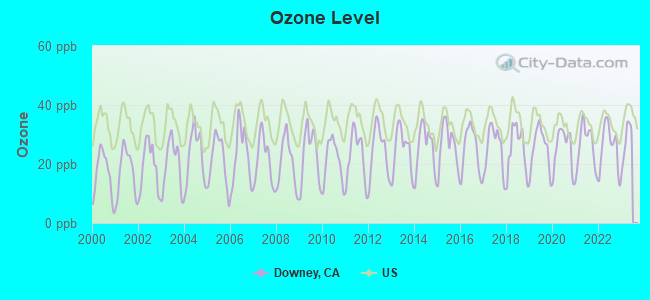
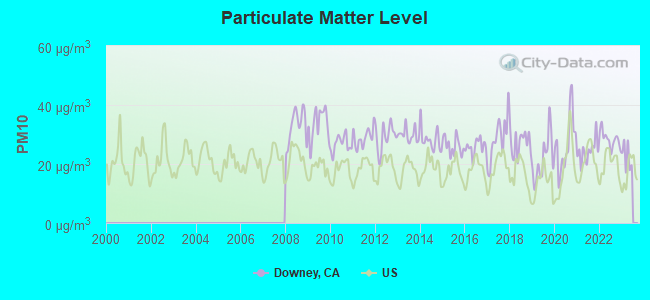
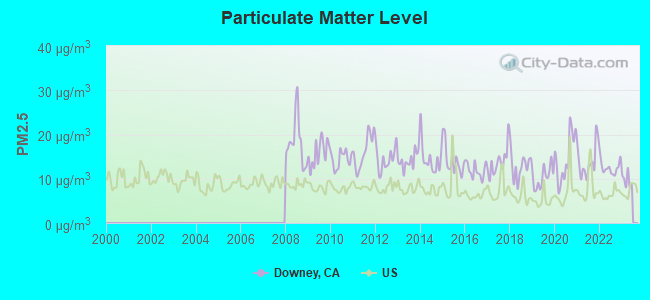
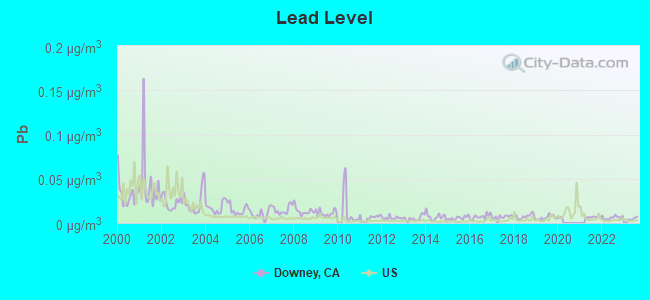
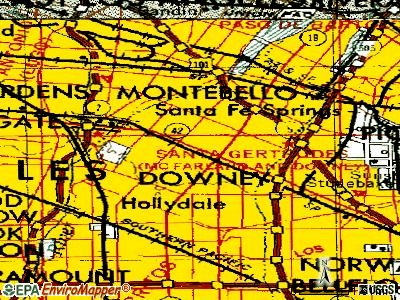
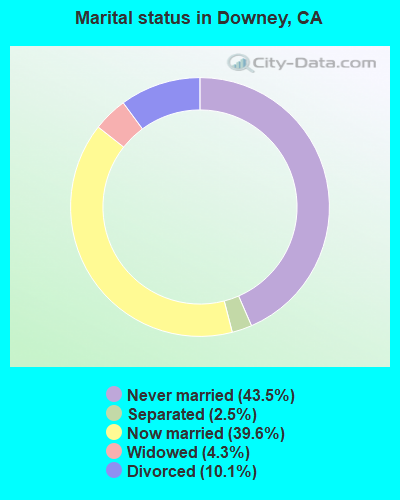
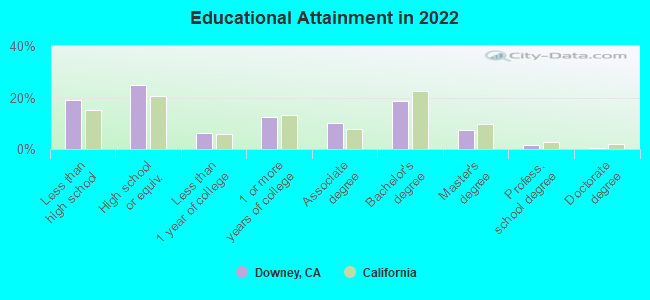
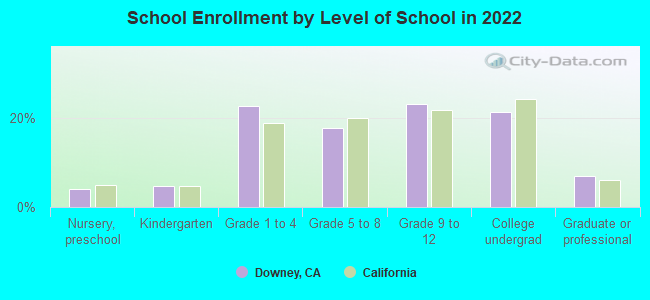
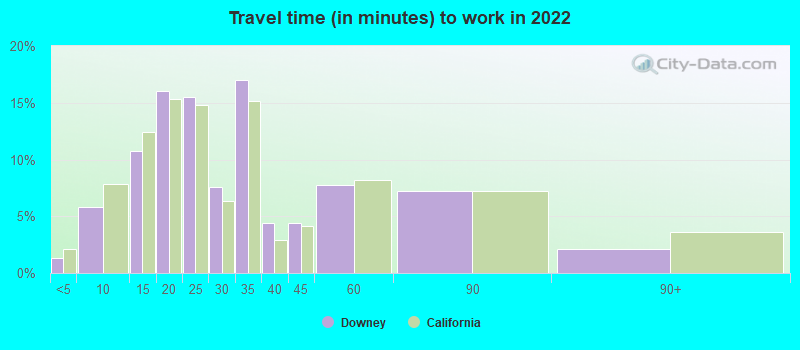
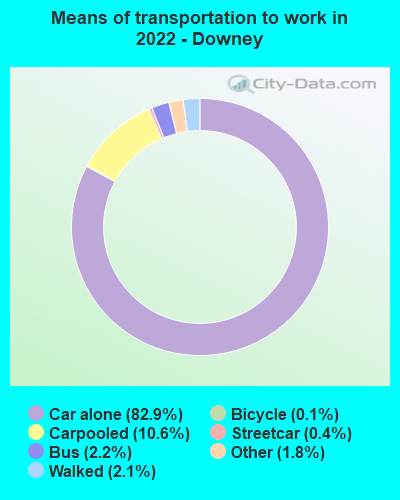


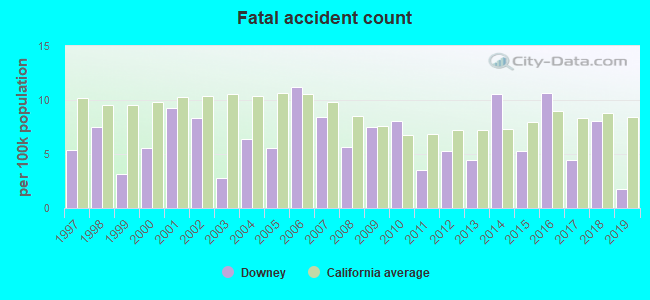
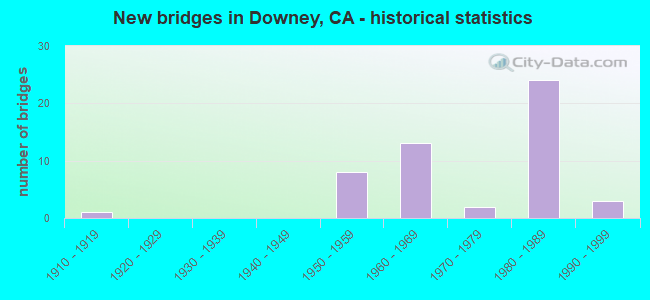
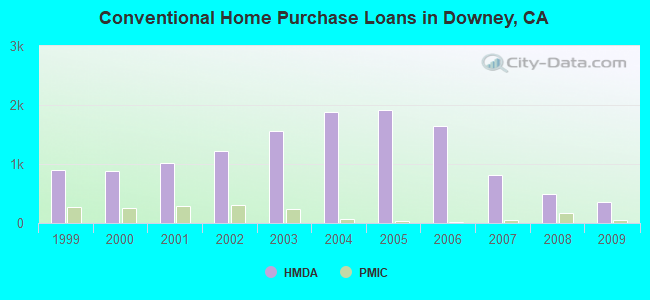
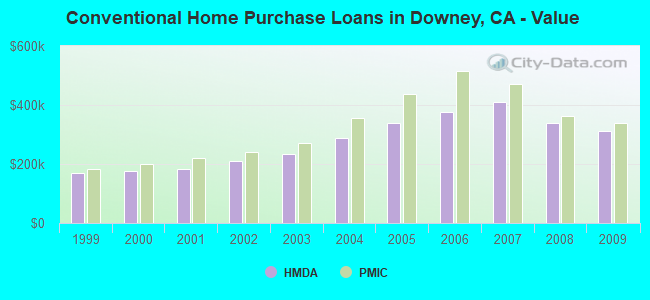
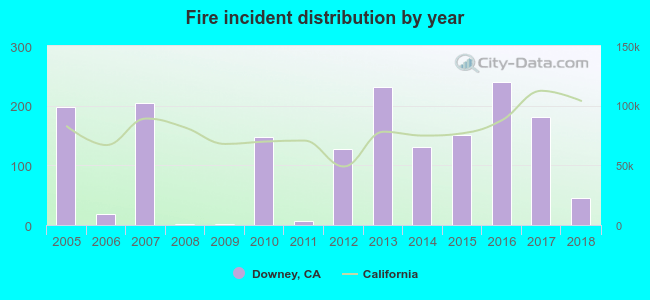 According to the data from the years 2005 - 2018 the average number of fires per year is 120. The highest number of fire incidents - 239 took place in 2016, and the least - 1 in 2008. The data has a decreasing trend.
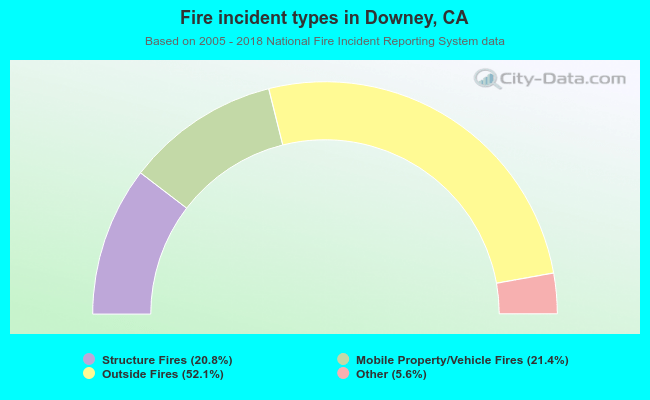 When looking into fire subcategories, the most reports belonged to: Outside Fires (52.1%), and Mobile Property/Vehicle Fires (21.4%).