Comparing Long Beach, CA to Downey, CA provides an interesting study in contrasts and likenesses. These cities, situated in the expansive Los Angeles County, offer unique living experiences with various advantages and drawbacks according to crime and safety, weather, cost of living, education, and other factors. While Long Beach boasts a vibrant seaside town feel with a diverse economy and cultural prowess, Downey is a more suburban residential community known for its esteemed school districts and lower cost of living. The choice depends on personal preference, career, and lifestyle.
Distance between
Long Beach, CA and
Downey, CA : 9.4 miles
Long Beach's population is larger by 309%. Its population has decreased by 5,460 people (1.2%) since 2000. The population of Downey has grown by 4,322 people (4.0%) during that time.
Relative to Downey, Long Beach has a somewhat higher crime rate. Statistics indicate that Downey has a lower crime rate compared to the national average. Long Beach, due to its larger population size and urban nature, has a crime rate higher than the national average. Both cities have many initiatives in place to keep citizens safe, although the type of community one prefers is a significant factor to consider while deciding on relocation or a visit.
City-data.com crime index counts serious crimes and violent crime more heavily. It adjusts for the number of visitors and daily workers commuting into cities. (higher means more crime, U.S. average = 301.1)
City-data.com crime index counts serious crimes and violent crime more heavily. It adjusts for the number of visitors and daily workers commuting into cities. (higher means more crime, U.S. average = 301.1)
Sex Offenders
According to our data, there are 807 registered sex offenders living in Long Beach and 107 registered sex offenders living in . The ratio of residents to sex offenders in Long Beach is 583 to 1; the ratio in Downey is 1,059 to 1. The number of registered sex offenders compared to the number of residents is larger in Long Beach than in Downey.
Cost of Living
Overall cost of living is higher in Long Beach, especially housing. Downey, while still above the national average, offers a lower cost alternative. Downey's cost of living is 62.1% higher than the US average, while Long Beach is 88.6% higher.
Income Tax
Income tax in both cities is based on California's state income tax, which ranges from 1% to 13.3% depending on income level.
Property Tax
Average property taxes in Downey are slightly lower than in Long Beach due to the difference in home values. However, rates vary depending on specific neighborhoods.
Sales Tax
Sales tax is nearly identical in both towns. As part of LA county, they are subject to California's statewide 6% sales tax and a county-wide sales tax of 2.25%, totaling 8.25%.
Income
Type
Long Beach
Downey
Estimated median household income
$73,905
$72,556
Estimated per capita income
$37,217
$32,469
Cost of living index (U.S. average is 100)
142
141
If you make $50,000 in Downey, you will have to make $50,355 in Long Beach to maintain the same standard of living.
Geographical Conditions
Located on the Pacific Coast, Long Beach offers beaches, marinas, and parks. Downey, inland, features many green spaces but lacks the coastal exposure of Long Beach.
Both cities host reputed schools, yet Downey generally outperforms Long Beach in school quality. Downey Unified School District is highly rated and boasts a high graduation rate. Long Beach, despite having some underperforming schools, is home to the comprehensive California State University, Long Beach.
Economic opportunities in both cities are broad. Downey's economy relies heavily on the health care, manufacturing and retail sectors. In contrast, Long Beach has a more diverse economy with sectors ranging from education, health care, to trade, transportation, and utilities.
Biggest Employers
In Long Beach, the biggest employers are Long Beach Unified School District, City of Long Beach, California State University, and the Boeing Company. Downey's primary employers are Kaiser Permanente, Downey Unified School District, and the Stonewood Center.
There were 304 building permits issued in Long Beach in 2012 (238 more than in 2011) compared to 121 building permits issued in Downey in 2012 (121 more than in 2011).
Weather
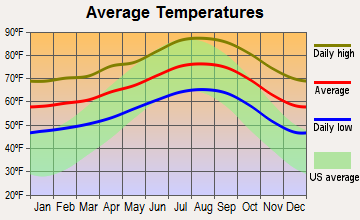
Long Beach, as a coastal city, gives access to milder weather and ocean breezes. It averages about 345 sunny days per year more than the national average. Downey, situated about 10 miles inland, experiences a very similar Mediterranean climate with slightly less cooling from the ocean, presenting warmer summer days.
Weather and climate
Type
Long Beach
Downey
Temperature - Average
65.3°F
66.7°F
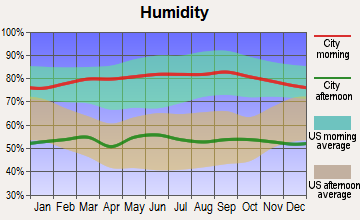
Humidity - Average morning or afternoon humidity
70.4%
66.3%
Humidity - Differences between morning and afternoon humidity
27%
21.1%
Humidity - Maximum monthly morning or afternoon humidity
79%
73%
Humidity - Minimum monthly morning or afternoon humidity
52%
51.9%
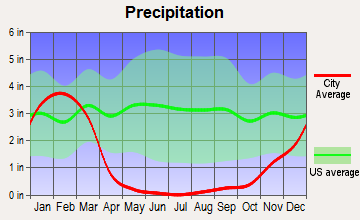
Precipitation - Yearly average
13.1 in
15 in
Snowfall - Yearly average
0 in
0 in
Clouds - Number of days clear of clouds
26.4%
27.9%
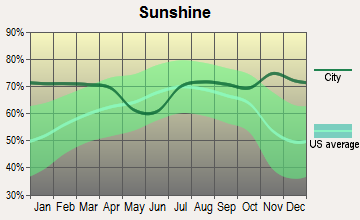
Sunshine amount - Average
78.4%
78.4%
Sunshine amount - Differences during a year
22%
22%
Sunshine amount - Maximum monthly
85%
85%
Sunshine amount - Minimum monthly
63%
63%
Wind speed - Average
6.1 mph
4.3 mph
Average climate in Long Beach, California
Average climate in Downey, California
Air pollution
Type
AQI
CO
NO2
OZONE
PB
PM10
PM25
SO2
Year
Long Beach
Downey
Long Beach
Downey
Long Beach
Downey
Long Beach
Downey
Long Beach
Downey
Long Beach
Downey
Long Beach
Downey
Long Beach
Downey
2018
124
140
0.37
0.41
17.2
14.7
22.1
25.3
0.008
0.008
27.5
27.2
13.5
14.0
0.7
0.5
2017
122
142
0.36
0.44
18.1
15.6
23.2
26.3
0.007
0.007
26.7
28.6
14.5
14.6
0.8
0.6
2016
115
128
0.36
0.48
18.5
15.3
21.9
25.6
0.007
0.007
24.1
25.9
11.6
13.1
0.9
0.5
2015
111
137
0.38
0.46
19.9
16.2
22.5
26.6
0.005
0.006
25.0
26.2
13.9
15.3
0.9
0.5
2014
127
138
0.50
0.43
20.3
15.8
22.0
25.9
0.007
0.007
26.7
28.3
14.3
16.3
1.3
0.6
2013
126
140
0.48
0.47
20.0
17.2
24.7
25.5
0.005
0.006
32.3
29.9
14.6
15.3
1.0
0.6
2012
132
144
0.48
0.47
19.3
17.3
24.4
24.8
0.004
0.006
30.8
29.1
14.1
15.8
0.6
0.5
2011
119
142
0.43
0.45
20.2
18.4
23.4
23.8
0.006
0.007
28.4
29.0
15.6
16.4
1.2
0.6
2010
115
128
0.38
0.55
20.8
18.5
22.7
21.8
0.011
0.015
24.1
26.8
11.9
14.4
0.7
0.6
2009
132
150
0.50
0.52
21.0
20.7
22.0
23.6
0.008
0.011
27.7
33.5
13.1
15.8
1.1
0.8
2008
124
152
0.53
0.52
20.8
25.4
23.2
20.9
0.008
0.013
27.2
32.9
21.6
18.3
1.0
0.8
2007
109
128
0.60
0.52
20.3
24.8
21.1
21.6
0.010
0.015
N/A
N/A
N/A
N/A
1.4
1.3
2006
119
125
0.76
0.59
21.4
26.0
19.9
23.7
0.005
0.010
N/A
N/A
N/A
N/A
1.7
1.6
2005
108
123
0.74
0.60
24.3
26.8
20.5
21.2
0.011
0.015
N/A
N/A
N/A
N/A
2.7
2.5
2004
125
132
0.56
0.65
28.0
27.8
22.9
23.0
0.012
0.018
N/A
N/A
N/A
N/A
2.0
2.3
2003
130
143
0.83
0.85
28.1
30.3
22.4
20.1
0.032
0.024
N/A
N/A
N/A
N/A
1.1
1.4
2002
120
137
0.90
0.90
29.6
32.1
22.2
19.3
0.011
0.023
N/A
N/A
N/A
N/A
2.8
2.3
2001
124
143
0.81
0.96
30.3
33.5
21.5
17.6
0.011
0.044
N/A
N/A
N/A
N/A
3.3
2.6
2000
142
149
0.71
0.95
31.5
34.9
19.6
16.5
0.018
0.033
N/A
N/A
N/A
N/A
2.0
1.7
Natural disasters
Type
Long Beach
Downey
Tornado activity compared to U.S. average
18.3%
18.5%
Earthquake activity compared to U.S. average
6,875.1%
7,042.3%
Natural disasters compared to U.S. average
57%
57%
Transportation
Both cities have an array of transportation options. Long Beach has more robust public transit with bus, light rail, and aquabus services. Downey, while serviced by major freeways and public buses, is more suited to private transportation.
Transport
Type
Long Beach
Downey
Amtrak stations
1
0
Amtrak stations nearby
3
3
FAA registered aircraft
312
38
FAA registered aircraft manufacturers and dealers
29
1
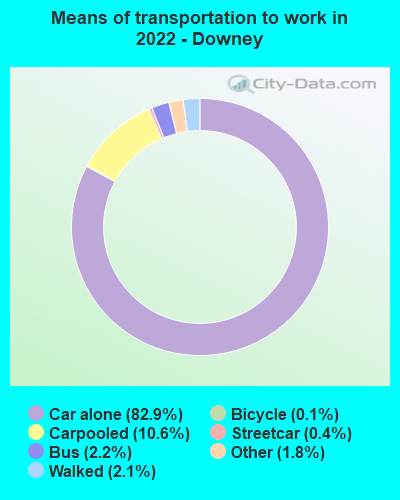
Means of transportation to work
Type
Long Beach
Downey
Bicycle
0.5%
0.6%
Bus
3.3%
2.3%
Carpooled
9.8%
10.6%
Car alone
81.8%
82.1%
Motorcycle
0.2%
0.2%
Railroad
0%
0.3%
Subway
0.5%
0%
Walked
2.8%
2.3%
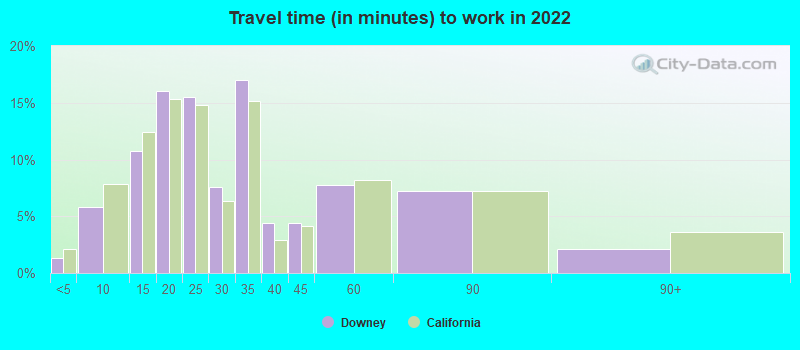
Average travel time to work
Type
Long Beach
Downey
Average
30.7 min
30.7 min
Other means
28.5 min
28.2 min
Public transportation
46.4 min
52 min
Private vehicle occupancy
Type
Long Beach
Downey
Average
1.1
1.2
Drove alone
89.7%
87%
In 2 person carpool
8.5%
10.2%
In 3 person carpool
1.4%
2.1%
In 4 person carpool
0.3%
0.5%
In 5-6 person carpool
0%
0.2%
In 7+ person carpool
0%
0.1%
How many people usually rode to work in the car, truck or van.
Real Estate
Real estate prices are generally higher in Long Beach given its geographical location and charm. Downey has more affordable homes though still above the national average.
Neighborhoods
Long Beach offers a blend of urban and suburban neighborhoods, with a touch of charm from historic homes and seaside properties. Downey, considered a comfortable suburb, has family-friendly neighborhoods with a median home price cheaper than in Long Beach.
Houses and residents
Type
Long Beach
Downey
Houses
179,856
37,581
Average household size (people)
2.8
3.3
Median year apartment built
1964
1967
Median year house/condo built
1954
1956
Length of stay in the house since moving in
15.7 years
18 years
Houses occupied
172,599 (96%)
36,008 (95.8%)
Houses occupied by owners
69,470 (40.2%)
18,808 (52.2%)
Houses occupied by renters
103,129 (59.8%)
17,200 (47.8%)
Median rent asked for vacant for-rent units
$1,057
$1,709
Median monthly housing costs
$1,692
$1,726
Median price asked for vacant for-sale houses and condos
$520,992
$713,288
Estimated median house or condo value
$693,600
$686,000
Median numbers of rooms
4.2
4.9
Median number of rooms in apartments
3.6
3.8
Median number of rooms in houses and condos
5.5
5.8
Median house price - detached houses
$900,658
$720,911
Median house price - in 2-unit structures
$823,515
$461,967
Median house price - in 3-to-4-unit structures
$495,928
$546,599
Median house price - in 5 or more unit structures
$488,399
$677,801
Median house price - mobile homes
$333,777
$134,829
Median house price - Townhouses or other attached units
$634,684
$524,501
Median house price - All housing units
$805,766
$700,040
Median house age
62
62
Renting percentage
58.4%
49.5%
Housing density (houses/condos per square mile)
3,565.7
3,026
House value disparities
21.3%
16.2%
Household income disparities
44.7%
42.6%
Median household income for houses/condes with a mortgage
$116,421
$135,248
Median household income for apartments without a mortgage
$79,392
$72,240
Housing units without a mortgage
394 (0.8%)
0 (0%)
Housing units with both a second mortgage and home equity loan
3,069 (6.2%)
853 (7.1%)
Housing units with a mortgage
49,321 (99.2%)
11,974 (100%)
Housing units with a home equity loan
48 (0.1%)
227 (1.9%)
Housing units with a second mortgage
3,709 (7.5%)
1,294 (10.8%)
House/condo owner moved in on average (years ago)
15
19
House/condo renter moved in on average (years ago)
3
4
Housing units lacking complete kitchen facilities
2.6%
4%
Housing units lacking complete plumbing facilities
0.4%
1.5%
Housing units in structures
Housing units in structures
Long Beach
Downey
One, detached
40.2%
57.4%
One, attached
4.9%
5.3%
Two
5.3%
1.9%
3 or 4
8.8%
2.7%
5 to 9
10.4%
7.2%
10 to 19
10.8%
8.9%
20 to 49
8.0%
10.1%
50 or more
10.6%
6.0%
Mobile homes
0.8%
0.3%
Boats, RVs, vans, etc.
0.2%
0.2%
Median real estate property taxes paid for housing units
Self-employed workers in own not incorporated business
18,532
3,243
State government workers
6,550
2,699
Unpaid family workers
178
83
Industries and Occupations
Downey has a strong concentration of health care and social assistance, retail trade, and manufacturing jobs. Long Beach presents a more diverse array of jobs, including professions in management, science, and arts, educational services, and health care.
Health diagnosing and treating practitioners and other technical occupations
4.9%
3.7%
Community and social service occupations
4.4%
3.6%
Personal care and service occupations
3.6%
1.3%
Arts, design, entertainment, sports, and media occupations
3.0%
2.6%
Building and grounds cleaning and maintenance occupations
2.9%
2.6%
Health technologists and technicians
2.8%
2.7%
Material moving occupations
2.8%
2.9%
Production occupations
2.7%
3.3%
Computer and mathematical occupations
1.9%
0.8%
Transportation occupations
1.4%
2.0%
Life, physical, and social science occupations
1.3%
0.0%
Legal occupations
1.3%
1.7%
Health Care
Both cities provide ample health care. Long Beach has a larger range of specialist and general healthcare facilities due to its size, whilst Downey has renowned health facilities like the Kaiser Permanente Downey Medical Center.
Both cities have state-of-the-art infrastructure, though Long Beach has a distinct lead due to its significant port where much of the nation's imports enter. Downey, smaller in scale, still offers good infrastructure particularly in residential servicing.
HMDA - Conventional home purchase loans - Applications denied
Year
Long Beach
Downey
1999
1,159
251
2000
710
247
2001
677
218
2002
708
284
2003
1,861
435
2004
2,162
556
2005
3,065
775
2006
3,591
922
2007
2,287
667
2008
887
249
2009
475
109
Culture and Food
Long Beach has an enriched cultural scene with a thriving arts community, world-class restaurants and an extensive range of cuisines. Downey, while largely suburban, does have restaurants that cater to a variety of tastes.
Sports Teams
Both cities are a short drive away from Los Angeles, the home of major sports teams like the Lakers, Kings, Dodgers, and Rams. Yet, Long Beach does host minor league and college sports teams compared to Downey.


 Long Beach, CA
 Downey, CA