Estimated zip code population in 2022: 94,344 Zip code population in 2010: 101,279 Zip code population in 2000: 105,275
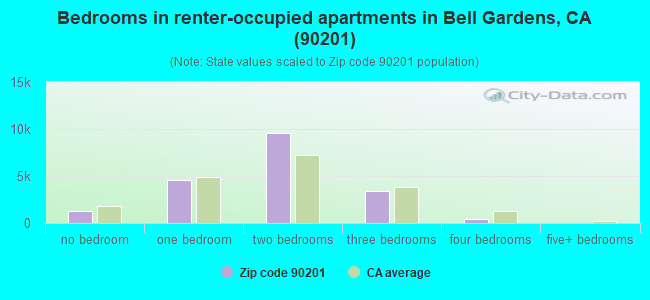
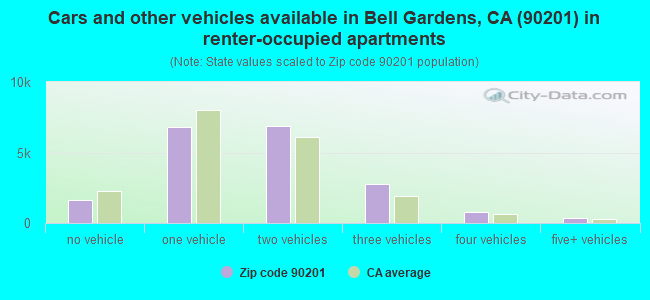
Houses and condos: 25,016 Renter-occupied apartments: 19,338
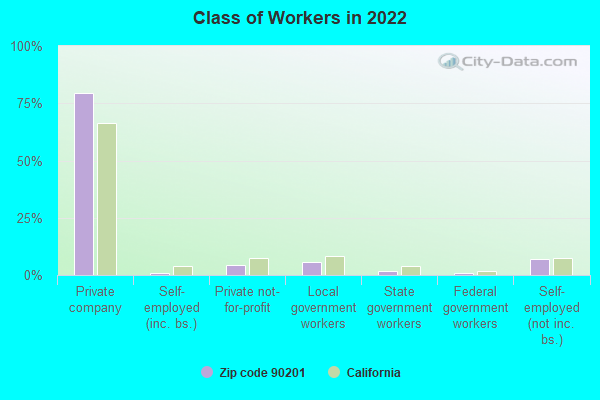
% of renters here:
79%
State:
44%
March 2022 cost of living index in zip code 90201: 136.4 (high, U.S. average is 100)
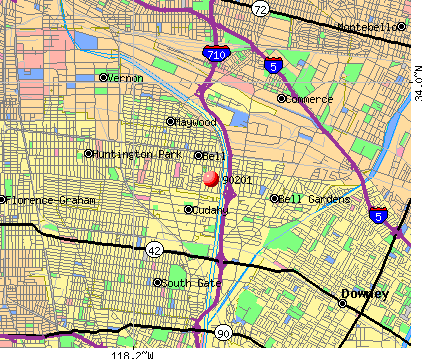
Land area: 5.9 sq. mi. Water area: 0.1 sq. mi.
Population density: 15,890 people per square mile
(very high).
OSM Map
General Map
Google Map
MSN Map
OSM Map
General Map
Google Map
MSN Map
OSM Map
General Map
Google Map
MSN Map
OSM Map
General Map
Google Map
MSN Map
Please wait while loading the map...
Real estate property taxes paid for housing units in 2022:
This zip code:
0.8% ($4,508)
California:
0.7% ($4,831)
Median real estate property taxes paid for housing units with mortgages in 2022: $5,248 (0.9%) Median real estate property taxes paid for housing units with no mortgage in 2022: $3,044 (0.6%)
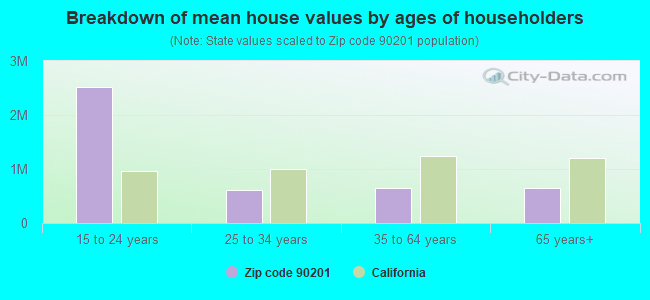
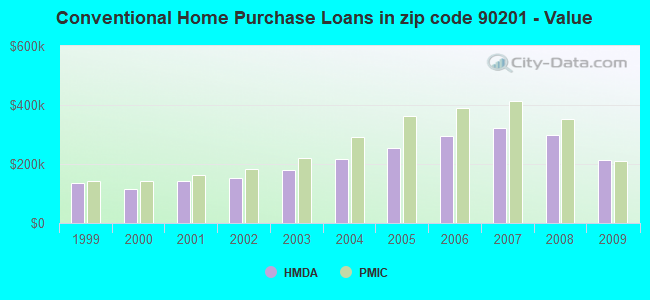
Estimated median house/condo value in 2022: $554,977
90201:
$554,977
California:
$715,900
According to our research of California and other state lists, there were 86 registered sex offenders living in 90201 zip code as of April 27, 2024. The ratio of all residents to sex offenders in zip code 90201 is 1,212 to 1. The ratio of registered sex offenders to all residents in this zip code is lower than the state average.
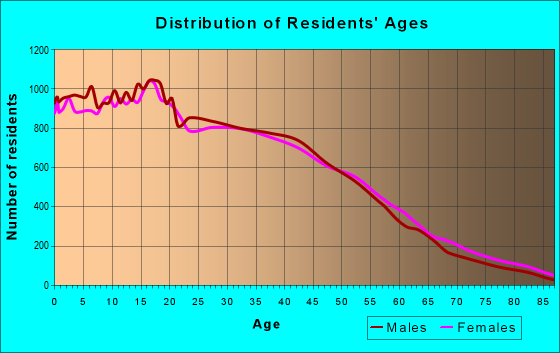
Median resident age:
This zip code:
32.3 years
California median age:
37.9 years
Average household size:
This zip code:
3.8 people
California:
2.8 people
Averages for the 2020 tax year for zip code 90201, filed in 2021:
Average Adjusted Gross Income (AGI) in 2020: $35,553 (Individual Income Tax Returns)
Here:
$35,553
State:
$95,910
Salary/wage: $34,913 (reported on 84.7% of returns)
Here:
$34,913
State:
$77,331
(% of AGI for various income ranges: 1308.3% for AGIs below $25k, 4048.2% for AGIs $25k-50k, 7693.7% for AGIs $50k-75k, 11446.3% for AGIs $75k-100k, 19922.4% for AGIs $100k-200k, 59056.7% for AGIs over 200k)
Taxable interest for individuals: $258 (reported on 10.8% of returns)
This zip code:
$258
California:
$2,294
(% of AGI for various income ranges: 1.9% for AGIs below $25k, 2.5% for AGIs $25k-50k, 5.2% for AGIs $50k-75k, 12.8% for AGIs $75k-100k, 29.1% for AGIs $100k-200k, 260.0% for AGIs over 200k)
Ordinary dividends: $568 (reported on 1.9% of returns)
Here:
$568
State:
$10,949
(% of AGI for various income ranges: 0.5% for AGIs below $25k, 1.3% for AGIs $25k-50k, 1.6% for AGIs $50k-75k, 2.6% for AGIs $75k-100k, 22.7% for AGIs $100k-200k)
Net capital gain/loss in AGI: +$1,618 (reported on 3.2% of returns)
Here:
+$1,618
State:
+$49,306
(% of AGI for various income ranges: 3.8% for AGIs $50k-75k, 22.9% for AGIs $75k-100k, 148.2% for AGIs $100k-200k, 3120.0% for AGIs over 200k)
Profit/loss from business: +$8,575 (reported on 19.2% of returns)
Here:
+$8,575
State:
+$15,671
(% of AGI for various income ranges: 297.5% for AGIs below $25k, 146.4% for AGIs $25k-50k, 229.3% for AGIs $50k-75k, 253.6% for AGIs $75k-100k, 649.6% for AGIs $100k-200k)
Taxable individual retirement arrangement distribution: $8,921 (reported on 0.8% of returns)
90201:
$8,921
California:
$23,505
(% of AGI for various income ranges: 4.2% for AGIs below $25k, 6.8% for AGIs $25k-50k, 16.0% for AGIs $50k-75k, 34.7% for AGIs $75k-100k, 67.6% for AGIs $100k-200k)
Total itemized deductions: $25,707 (reported on 3.9% of returns)
Here:
$25,707
State:
$39,517
(% of AGI for various income ranges: 20.1% for AGIs below $25k, 90.4% for AGIs $25k-50k, 253.1% for AGIs $50k-75k, 603.4% for AGIs $75k-100k, 1323.4% for AGIs $100k-200k, 6363.3% for AGIs over 200k)
Charity contributions: $5,231 (reported on 3.2% of returns)
Here:
$5,231
State:
$12,598
(% of AGI for various income ranges: 2.5% for AGIs below $25k, 17.5% for AGIs $25k-50k, 42.8% for AGIs $50k-75k, 89.7% for AGIs $75k-100k, 185.7% for AGIs $100k-200k, 1410.0% for AGIs over 200k)
Taxes paid: $7,968 (reported on 3.9% of returns)
90201:
$7,968
State:
$8,807
(% of AGI for various income ranges: 6.4% for AGIs below $25k, 25.6% for AGIs $25k-50k, 79.8% for AGIs $50k-75k, 197.9% for AGIs $75k-100k, 426.0% for AGIs $100k-200k, 1540.0% for AGIs over 200k)
Earned income credit: $2,356 (reported on 25.9% of returns)
Here:
$2,356
State:
$2,074
(% of AGI for various income ranges: 133.2% for AGIs below $25k, 84.4% for AGIs $25k-50k, 1.6% for AGIs $50k-75k)
Percentage of individuals using paid preparers for their 2020 taxes: 90.2%
Here:
90%
State:
92%
(% for various income ranges: 88.0% for AGIs below $25k, 91.6% for AGIs $25k-50k, 91.8% for AGIs $50k-75k, 92.3% for AGIs $75k-100k, 92.7% for AGIs $100k-200k, 100.0% for AGIs over 200k)
Averages for the 2012 tax year for zip code 90201, filed in 2013:
Average Adjusted Gross Income (AGI) in 2012: $27,143 (Individual Income Tax Returns)
Here:
$27,143
State:
$72,726
Salary/wage: $27,210 (reported on 86.4% of returns)
Here:
$27,210
State:
$59,079
(% of AGI for various income ranges: 78.8% for AGIs below $25k, 92.1% for AGIs $25k-50k, 91.9% for AGIs $50k-75k, 89.2% for AGIs $75k-100k, 85.0% for AGIs $100k-200k, 32.0% for AGIs over 200k)
Taxable interest for individuals: $243 (reported on 10.6% of returns)
This zip code:
$243
California:
$2,146
(% of AGI for various income ranges: 0.1% for AGIs $50k-75k, 0.3% for AGIs $100k-200k)
Ordinary dividends: $1,275 (reported on 1.2% of returns)
Here:
$1,275
State:
$9,308
(% of AGI for various income ranges: 0.2% for AGIs $100k-200k)
Net capital gain/loss in AGI: +$214 (reported on 1.1% of returns)
Here:
+$214
State:
+$30,460
(% of AGI for various income ranges: 0.9% for AGIs $100k-200k)
Profit/loss from business: +$10,068 (reported on 18.4% of returns)
Here:
+$10,068
State:
+$17,064
(% of AGI for various income ranges: 15.9% for AGIs below $25k, 3.8% for AGIs $25k-50k, 2.5% for AGIs $50k-75k, 0.9% for AGIs $75k-100k, 2.1% for AGIs $100k-200k)
Taxable individual retirement arrangement distribution: $8,525 (reported on 0.9% of returns)
90201:
$8,525
California:
$19,557
(% of AGI for various income ranges: 0.2% for AGIs below $25k, 0.2% for AGIs $25k-50k, 0.4% for AGIs $50k-75k, 1.0% for AGIs $75k-100k)
Total itemized deductions: $18,601 (34% of AGI, reported on 12.4% of returns)
Here:
$18,601
State:
$34,004
Here:
34.4% of AGI
State:
22.7% of AGI
(% of AGI for various income ranges: 3.4% for AGIs below $25k, 7.8% for AGIs $25k-50k, 12.7% for AGIs $50k-75k, 15.9% for AGIs $75k-100k, 17.8% for AGIs $100k-200k, 15.7% for AGIs over 200k)
Charity contributions: $1,863 (reported on 9.3% of returns)
Here:
$1,863
State:
$4,659
(% of AGI for various income ranges: 0.2% for AGIs below $25k, 0.6% for AGIs $25k-50k, 0.9% for AGIs $50k-75k, 1.4% for AGIs $75k-100k, 1.6% for AGIs $100k-200k)
Taxes paid: $5,074 (reported on 12.4% of returns)
90201:
$5,074
State:
$14,448
(% of AGI for various income ranges: 0.7% for AGIs below $25k, 1.7% for AGIs $25k-50k, 3.5% for AGIs $50k-75k, 5.1% for AGIs $75k-100k, 6.4% for AGIs $100k-200k, 8.3% for AGIs over 200k)
Earned income credit: $2,745 (reported on 37.1% of returns)
Here:
$2,745
State:
$2,286
(% of AGI for various income ranges: 9.9% for AGIs below $25k, 2.0% for AGIs $25k-50k)
Percentage of individuals using paid preparers for their 2012 taxes: 82.4%
Here:
82%
State:
64%
(% for various income ranges: 81.5% for AGIs below $25k, 83.2% for AGIs $25k-50k, 85.3% for AGIs $50k-75k, 83.7% for AGIs $75k-100k, 82.1% for AGIs $100k-200k, 100.0% for AGIs over 200k)
Averages for the 2004 tax year for zip code 90201, filed in 2005:
Average Adjusted Gross Income (AGI) in 2004: $24,562 (Individual Income Tax Returns)
Here:
$24,562
State:
$58,600
Salary/wage: $24,655 (reported on 89.6% of returns)
Here:
$24,655
State:
$49,455
(% of AGI for various income ranges: 77.3% for AGIs below $10k, 87.9% for AGIs $10k-25k, 94.1% for AGIs $25k-50k, 93.1% for AGIs $50k-75k, 90.6% for AGIs $75k-100k, 54.4% for AGIs over 100k)
Taxable interest for individuals: $534 (reported on 14.8% of returns)
This zip code:
$534
California:
$2,365
(% of AGI for various income ranges: 0.5% for AGIs below $10k, 0.2% for AGIs $10k-25k, 0.2% for AGIs $25k-50k, 0.3% for AGIs $50k-75k, 0.4% for AGIs $75k-100k, 2.2% for AGIs over 100k)
Taxable dividends: $1,017 (reported on 1.7% of returns)
Here:
$1,017
State:
$4,746
(% of AGI for various income ranges: 0.2% for AGIs below $10k, 0.0% for AGIs $10k-25k, 0.0% for AGIs $25k-50k, 0.1% for AGIs $50k-75k, 0.1% for AGIs $75k-100k, 0.5% for AGIs over 100k)
Net capital gain/loss: +$11,735 (reported on 1.6% of returns)
Here:
+$11,735
State:
+$23,418
(% of AGI for various income ranges: 0.0% for AGIs below $10k, -0.0% for AGIs $10k-25k, 0.1% for AGIs $25k-50k, 0.5% for AGIs $50k-75k, 1.0% for AGIs $75k-100k, 18.4% for AGIs over 100k)
Profit/loss from business: +$9,693 (reported on 15.4% of returns)
Here:
+$9,693
State:
+$16,826
(% of AGI for various income ranges: 23.7% for AGIs below $10k, 9.4% for AGIs $10k-25k, 3.6% for AGIs $25k-50k, 2.5% for AGIs $50k-75k, 2.5% for AGIs $75k-100k, 6.5% for AGIs over 100k)
IRA payment deduction: $2,317 (reported on 0.5% of returns)
90201:
$2,317
California:
$3,192
(% of AGI for various income ranges: 0.0% for AGIs $10k-25k, 0.1% for AGIs $25k-50k, 0.1% for AGIs $50k-75k, 0.2% for AGIs $75k-100k)
Total itemized deductions: $16,605 (37% of AGI, reported on 15.1% of returns)
Here:
$16,605
State:
$28,113
Here:
37.3% of AGI
State:
25.3% of AGI
(% of AGI for various income ranges: 3.5% for AGIs below $10k, 4.9% for AGIs $10k-25k, 10.8% for AGIs $25k-50k, 16.5% for AGIs $50k-75k, 18.6% for AGIs $75k-100k, 16.8% for AGIs over 100k)
Charity contributions deductions: $1,833 (4% of AGI, reported on 12.4% of returns)
Here:
$1,833
State:
$3,923
Here:
3.9% of AGI
State:
3.3% of AGI
(% of AGI for various income ranges: 0.1% for AGIs below $10k, 0.3% for AGIs $10k-25k, 1.0% for AGIs $25k-50k, 1.6% for AGIs $50k-75k, 2.1% for AGIs $75k-100k, 2.1% for AGIs over 100k)
Total tax: $2,013 (reported on 53.5% of returns)
90201:
$2,013
State:
$10,761
(% of AGI for various income ranges: 4.2% for AGIs below $10k, 2.9% for AGIs $10k-25k, 3.7% for AGIs $25k-50k, 5.8% for AGIs $50k-75k, 8.1% for AGIs $75k-100k, 15.3% for AGIs over 100k)
Earned income credit: $2,114 (reported on 37.6% of returns)
Here:
$2,114
State:
$1,763
Percentage of individuals using paid preparers for their 2004 taxes: 82.7%
Here:
83%
State:
66%
(% for various income ranges: 78.3% for AGIs below $10k, 84.0% for AGIs $10k-25k, 83.0% for AGIs $25k-50k, 84.4% for AGIs $50k-75k, 85.0% for AGIs $75k-100k, 87.7% for AGIs over 100k)
Likely homosexual households (counted as self-reported same-sex unmarried-partner households)
Lesbian couples: 0.1% of all households
Gay men: 0.0% of all households
Household received Food Stamps/SNAP in the past 12 months: 5,695 Household did not receive Food Stamps/SNAP in the past 12 months: 19,401
Women who had a birth in the past 12 months: 1,081 (574 now married, 510 unmarried) Women who did not have a birth in the past 12 months: 23,287 (6,699 now married, 16,693 unmarried)
Housing units in zip code 90201 with a mortgage: 2,906 (102 second mortgage, 11 home equity loan, 63 both second mortgage and home equity loan) Houses without a mortgage: 84
Median monthly owner costs for units with a mortgage: $2,250 Median monthly owner costs for units without a mortgage: $536
Residents with income below the poverty level in 2022:
This zip code:
24.2%
Whole state:
12.2%
Residents with income below 50% of the poverty level in 2022:
This zip code:
15.6%
Whole state:
6.2%
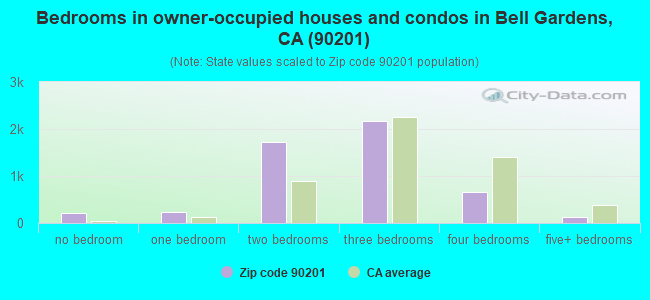
Median number of rooms in houses and condos:
Here:
5.0
State:
6.0
Median number of rooms in apartments:
Here:
4.0
State:
3.9
Notable locations in this zip code not listed on our city pages
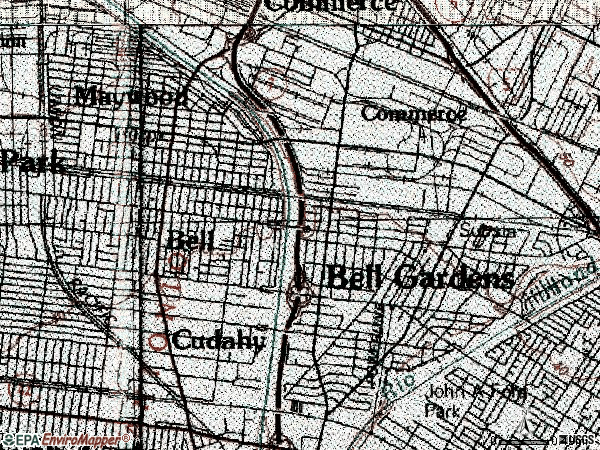
Notable locations in zip code 90201: Cudahy Sub-Station (A), Ford Park Golf Course (B), Ross Auditorium (C), Los Angeles County Fire Department Station 39 (D), Bell Gardens City Hall (E), Cudahy City Hall (F), Cudahy Branch County of Los Angeles Public Library (G), Bell Gardens Branch County of Los Angeles Public Library (H), Bell City Hall (I), Bell Branch County of Los Angeles Public Library (J), Los Angeles County Fire Department Station 163 (K). Display/hide their locations on the map
Shopping Centers: Bell Gardens Marketplace Shopping Center (1), Bell Shopping Center (2), Bell Palm Plaza Shopping Center (3). Display/hide their locations on the map
Churches in zip code 90201 include: Church of Jesus Christ (A), El Calvario Church (B), First Christian Church (C), Grace Lutheran Church (D), Bell Gardens Baptist Church (E), Bell Gardens Christian Church (F), Bell Gardens Four Square Church (G), Central Missionary Baptist Church (H), Crown Glory Church (I). Display/hide their locations on the map
Parks in zip code 90201 include: John A Ford Park (1), Lentz Field (2), Little Bear Park (3), Pritchard Field (4), Veterans Park (5), Bell Gardens Park (6), Clara Park (7), Cudahy Park (8), Lugo Park (9). Display/hide their locations on the map
9,776 married couples with children.
10,235 single-parent households (2,110 men, 8,125 women).
10.5% of residents of 90201 zip code speak English at home.
87.4% of residents speak Spanish at home (55% very well, 16% well, 19% not well, 10% not at all).
0.3% of residents speak other Indo-European language at home (86% very well, 13% well, 2% not well).
0.5% of residents speak Asian or Pacific Island language at home (46% very well, 25% well, 30% not well).
1.6% of residents speak other language at home (70% very well, 17% well, 8% not well, 5% not at all).
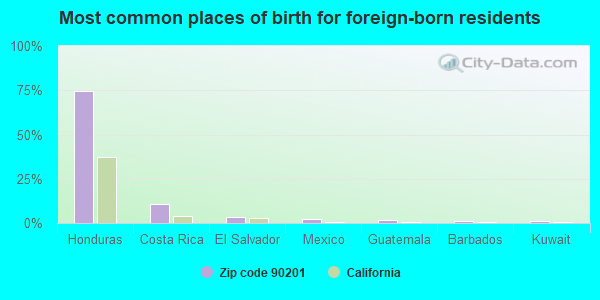
Foreign born population: 39,633 (42.0%) (30.9% of them are naturalized citizens)
This zip code:
42.0%
Whole state:
26.7%
75%Honduras
11%Costa Rica
4%El Salvador
2%Mexico
2%Guatemala
1%Barbados
1%Kuwait
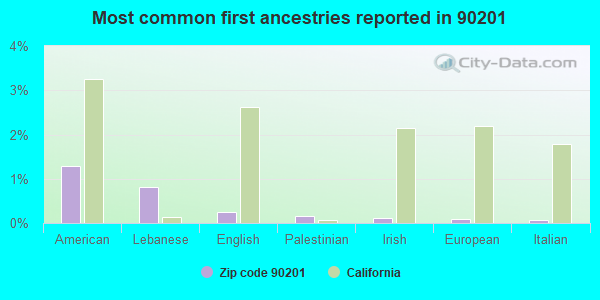
1%American
1%Lebanese
0%English
0%Palestinian
0%Irish
0%European
0%Italian
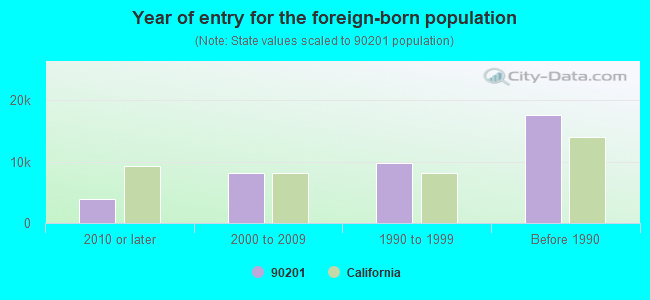
Year of entry for the foreign-born population
3,9792010 or later
8,1102000 to 2009
9,8241990 to 1999
17,573Before 1990
Major facilities with environmental interests located in this zip code:
MONTEBELLO USD BELL GARDENS INTERMEDIATE SCHOOL (5841 LIVE OAK STREET in BELL GARDENS, CA)
STATE MASTER (California - Hazardous Waste Tracking) - HAZARDOU WASTE PROGRAM (National Center for Education Statistics) - STATE ID-6058408 Small Quantity Generators, between 100 kg and 1000 kg of hazardous waste/month (Resource Conservation and Recovery Act (tracking hazardous waste)) - notification Organizations: MONTEBELLO UNIFIED (SCHOOL DISTRICT)
METAL SURFACES INCORPORATED (6060 SHULL ST. in BELL GARDENS, CA)
STATE MASTER (California - Hazardous Waste Tracking) - HAZARDOU WASTE PROGRAM CRITERIA AND HAZARDOUS AIR POLLUTANT INVENTORY (Inventory of air pollution sources) HAZARDOUS WASTE BIENNIAL REPORTER (Resource Conservation and Recovery Act (tracking hazardous waste)) Large Quantity Generators, more that 1000 kg of hazardous waste/month (Resource Conservation and Recovery Act (tracking hazardous waste)) TRI REPORTER (Tracking of toxic chemicals releasing facilities) Business SIC and NAICS classification: ELECTROPLATING, PLATING, POLISHING, ANODIZING, AND COLORING Organizations: METAL SURFACES, INC. (CONTACT/OPERATOR)
GENERAL INSPECTION LABS INC (8427 ATLANTIC AVE in CUDAHY, CA)
STATE MASTER (California - Hazardous Waste Tracking) - HAZARDOU WASTE PROGRAM CRITERIA AND HAZARDOUS AIR POLLUTANT INVENTORY (Inventory of air pollution sources) HAZARDOUS WASTE BIENNIAL REPORTER (Resource Conservation and Recovery Act (tracking hazardous waste)) Large Quantity Generators, more that 1000 kg of hazardous waste/month (Resource Conservation and Recovery Act (tracking hazardous waste)) Business SIC classification: TESTING LABORATORIES Business NAICS classification: METAL HEAT TREATING. Organizations: JAY HABER (CONTACT/OPERATOR)
, JULIE DYKSTRA (CONTACT/OWNER)
Alternative names: GENERAL INSPECT LAB
HUGHES ELEMENTARY SCHOOL (4242 CLARA ST in CUDAHY, CA)
STATE MASTER (California - Hazardous Waste Tracking) - HAZARDOU WASTE PROGRAM Large Quantity Generators, more that 1000 kg of hazardous waste/month (Resource Conservation and Recovery Act (tracking hazardous waste)) Organizations: LOS ANGELES UNIFIED SCHOOL DISTRICT (CONTACT/OWNER)
MONTEBELLO USD BELLA VISTA ELEMMENTARY (5620 QUINN ST in BELL GARDENS, CA)
(National Center for Education Statistics) - STATE ID-6020515 Small Quantity Generators, between 100 kg and 1000 kg of hazardous waste/month (Resource Conservation and Recovery Act (tracking hazardous waste)) - notification Organizations: MONTEBELLO UNIFIED (SCHOOL DISTRICT)
GARFIELD ELEMENTARY (7425 S. GARFIELD AVE. in BELL GARDENS, CA)
(National Center for Education Statistics) - STATE ID-6020564 Small Quantity Generators, between 100 kg and 1000 kg of hazardous waste/month (Resource Conservation and Recovery Act (tracking hazardous waste)) - notification Organizations: MONTEBELLO USD (CONTACT/OWNER)
, MONTEBELLO UNIFIED (SCHOOL DISTRICT)
Alternative names: MONTEBELLO USD GARFIELD ELEMEMTARY SCHL
J P TURGEON & SONS (7758 SCOUT AVE. in BELL GARDENS, CA)
STATE MASTER (California - Hazardous Waste Tracking) - HAZARDOU WASTE PROGRAM CRITERIA AND HAZARDOUS AIR POLLUTANT INVENTORY (Inventory of air pollution sources) Small Quantity Generators, between 100 kg and 1000 kg of hazardous waste/month (Resource Conservation and Recovery Act (tracking hazardous waste)) TRI REPORTER (Tracking of toxic chemicals releasing facilities) Business SIC classification: SHEET METALWORK; ELECTROPLATING, PLATING, POLISHING, ANODIZING, AND COLORING Business NAICS classification: ELECTROPLATING, PLATING, POLISHING, ANODIZING, AND COLORING. Alternative names: JP TURGEON & SON INC, TURGEON J P & SONS' INC
MONTEBELLO USD BELL GARDENS HIGH SCHL (6119 AGRA ST in BELL GARDENS, CA)
(National Center for Education Statistics) - STATE ID-1930825 Small Quantity Generators, between 100 kg and 1000 kg of hazardous waste/month (Resource Conservation and Recovery Act (tracking hazardous waste)) - notification Organizations: MONTEBELLO UNIFIED (SCHOOL DISTRICT)
MONTEBELLO USD SUVA ELEMENTARY SCHL (6740 E SUVA ST in BELL GARDENS, CA)
(National Center for Education Statistics) - STATE ID-6020655 Small Quantity Generators, between 100 kg and 1000 kg of hazardous waste/month (Resource Conservation and Recovery Act (tracking hazardous waste)) - notification Organizations: MONTEBELLO UNIFIED (SCHOOL DISTRICT)
MONTEBELLO USD SUVA INTERMEDIATE SCHL (6660 E SUVA ST in BELL GARDENS, CA)
(National Center for Education Statistics) - STATE ID-6085682 Small Quantity Generators, between 100 kg and 1000 kg of hazardous waste/month (Resource Conservation and Recovery Act (tracking hazardous waste)) - notification Organizations: MONTEBELLO UNIFIED (SCHOOL DISTRICT)
ALVAREZ TRUCKING INC (4843 CECILIA in CUDAHY, CA)
STATE MASTER (California - Hazardous Waste Tracking) - HAZARDOU WASTE PROGRAM Small Quantity Generators, between 100 kg and 1000 kg of hazardous waste/month (Resource Conservation and Recovery Act (tracking hazardous waste)) - notification Organizations: ALVAREZ R GILBERT (CONTACT/OWNER)
C T & F CORP (7228 SCOUT AVE in BELL GARDENS, CA)
STATE MASTER (California - Hazardous Waste Tracking) - HAZARDOU WASTE PROGRAM Small Quantity Generators, between 100 kg and 1000 kg of hazardous waste/month (Resource Conservation and Recovery Act (tracking hazardous waste)) - notification Organizations: TOM GALLAND INC (CONTACT/OWNER)
LUCKY CLEANERS (690334 ATLANTIC BLVD in BELL, CA)
STATE MASTER (California - Hazardous Waste Tracking) - HAZARDOU WASTE PROGRAM Small Quantity Generators, between 100 kg and 1000 kg of hazardous waste/month (Resource Conservation and Recovery Act (tracking hazardous waste)) - notification Organizations: KIM PYONG SUK (CONTACT/OWNER)
Housing units lacking complete plumbing facilities: 0.6% Housing units lacking complete kitchen facilities: 2.2%
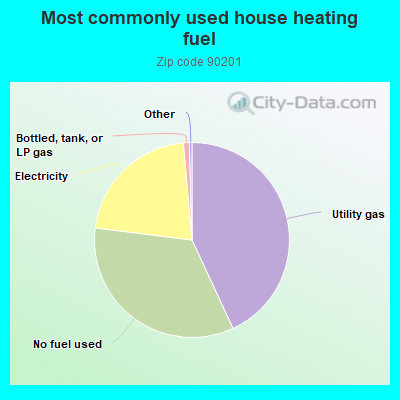
43.1%Utility gas
33.9%No fuel used
21.6%Electricity
1.0%Bottled, tank, or LP gas
Population in 1990: 99,568. Population change in the 1990s: +5,707 (+5.7%).
Place of birth for U.S.-born residents:
This state: 52,808
Northeast: 256
Midwest: 295
South: 636
West: 355
50% of the 90201 zip code residents lived in the same house 5 years ago. Out of people who lived in different houses, 93% lived in this county. Out of people who lived in different counties, 50% lived in California.
96% of the 90201 zip code residents lived in the same house 1 year ago. Out of people who lived in different houses, 88% moved from this county. Out of people who lived in different houses, 4% moved from different county within same state. Out of people who lived in different houses, 9% moved from different state. Out of people who lived in different houses, 6% moved from abroad.
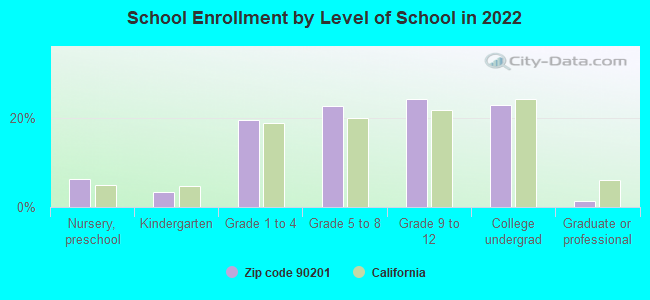
Private vs. public school enrollment:
Students in private schools in grades 1 to 8 (elementary and middle school): 311
Here:
2.7%
California:
10.5%
Students in private schools in grades 9 to 12 (high school): 162
Here:
2.4%
California:
8.5%
Students in private undergraduate colleges: 321
Here:
5.1%
California:
15.9%
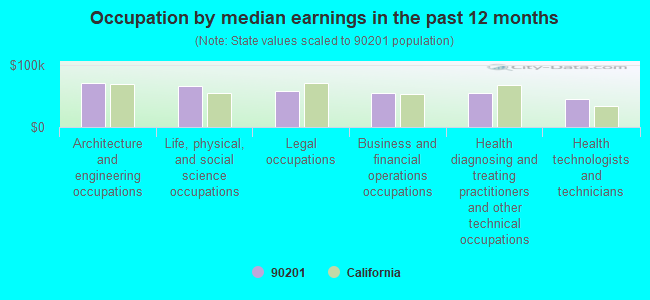
Occupation by median earnings in the past 12 months ($)
71,374Architecture and engineering occupations
66,708Life, physical, and social science occupations
57,611Legal occupations
55,086Business and financial operations occupations
54,600Health diagnosing and treating practitioners and other technical occupations
44,622Health technologists and technicians
Companies with biggest federal contracts located in this zip code:
MADISON PAVING, INC (4820 CECELIA STREET, SUITE in CUDAHY, CA; small business) : $1,832,770 in 17 contractsfrom 1999 to 2005
Contracts for Maintenance, Repair or Alteration of Real Property -- Highways, Roads, Streets, Bridges, and Railways (includes resurfacing) by Air Force, Army Signed by year:2000: $1,282,620; 2001: $16,140; 2002: $295,529; 2003: $0; 2004: $0; 2005: $217,083; 2006: $0.
Biggest contracts:
$1,253,646 with Air Force for Maintenance, Repair or Alteration of Real Property -- Highways, Roads, Streets, Bridges, and Railways (includes resurfacing). Signed on 2000-09-26. Completion date: 2001-09-01.
$224,768, same as above.Signed on 2002-07-31. Completion date: 2002-11-11.
$217,083 with Army for Maintenance, Repair or Alteration of Real Property -- Highways, Roads, Streets, Bridges, and Railways (includes resurfacing). Signed on 2005-09-22. Completion date: 2006-02-08.
$25,932 with Air Force for Maintenance, Repair or Alteration of Real Property -- Highways, Roads, Streets, Bridges, and Railways (includes resurfacing). Signed on 2002-09-30. Completion date: 2002-12-18.
SCOTT CRAFT CO (4601 CECILIA ST in BELL, CA; small business) : $1,109,248 in 44 contractsfrom 1999 to 2006
Contracts for Airfield Specialized Trucks and Trailers, Pipe, Tube and Rigid Tubing, Aircraft Ground Servicing Equipment, Aircraft Launching Equipment, and moreby Navy, Defense Logistics Agency, Army, Air Force, and others Signed by year:2000: $97,054; 2001: $303,377; 2002: $56,736; 2003: $407,740; 2004: $90,958; 2005: $205,585; 2006: $3,778.
Biggest contracts:
$190,800 with Navy for Airfield Specialized Trucks and Trailers. Signed on 2003-02-20. Completion date: 2003-08-21.
$106,923 with Defense Logistics Agency for Pipe, Tube and Rigid Tubing. Signed on 2001-03-06. Completion date: 2001-07-12.
$92,000 with Navy for Aircraft Ground Servicing Equipment. Signed on 2005-05-18. Completion date: 2006-12-30.
$82,360 with Navy for Aircraft Launching Equipment. Signed on 2003-03-25. Completion date: 2004-04-30.
SOUTHERN CALIFORNIA BRAIDING C (7450 SCOUT AVE in BELL, CA; small business) : $968,159 in 43 contractsfrom 2000 to 2006
Contracts for Miscellaneous Electric Power and Distribution Equipment, Cable, Cord, and Wire Assemblies: Communications Equipment, Electrical and Electronic Properties Measuring and Testing Instruments, Maintenance, Repair and Rebuilding of Equipment -- Engines, Turbines, and Components, and moreby Defense Logistics Agency, Navy, Army, U.S. Coast Guard, and others Signed by year:2000: $368,635; 2001: $73,854; 2002: $44,946; 2003: $59,850; 2004: $51,751; 2005: $221,107; 2006: $148,016.
Biggest contracts:
$67,200 with Defense Logistics Agency for Miscellaneous Electric Power and Distribution Equipment. Signed on 2000-07-05. Completion date: 2000-10-03.
$57,000 with Defense Logistics Agency for Cable, Cord, and Wire Assemblies: Communications Equipment. Signed on 2005-10-19. Completion date: 2006-05-10.
$54,934, same as above.Signed on 2000-10-15. Completion date: 2001-07-12.
$54,350 with Navy for Miscellaneous Electric Power and Distribution Equipment. Signed on 2000-10-06. Completion date: 2001-02-13.
FLEXCO INC (6855 SUVA ST in BELL, CA; small business) : $620,460 in 36 contractsfrom 2000 to 2006
Contracts for Hose and Flexible Tubing, Aircraft Air Conditioning, Heating, and Pressurizing Equipment, Airframe Structural Components, Hardware, Commercial, and moreby Army, Defense Logistics Agency Signed by year:2000: $65,839; 2001: $39,418; 2002: $53,883; 2003: $260,536; 2004: $80,621; 2005: $54,467; 2006: $65,696.
Biggest contracts:
$191,760 with Army for Hose and Flexible Tubing. Signed on 2003-11-17. Completion date: 2004-06-20.
$65,839, same as above.Signed on 2000-08-09. Completion date: 2000-11-17.
$53,883, same as above.Signed on 2002-11-22. Completion date: 2003-02-27.
$41,565, same as above.Signed on 2004-05-12. Completion date: 2004-08-27.
ACE CRANE SERVICE, INC (8221 WILCOX AVE in BELL, CA; small business) : $324,831 in 44 contractsfrom 2000 to 2006
Contracts for Construction of Structures and Facilities -- Dams, Winches, Hoists, Cranes, and Derricks, Facilities Operations Support Services, Inspection Services (including commercial testing and lab services, except medical/dental) -- Materials Handling Equipment by Army, Navy, Air Force Signed by year:2000: $49,900; 2001: -$1,281; 2002: $37,895; 2003: $57,318; 2004: $29,175; 2005: $55,840; 2006: $95,984.
Biggest contracts:
$82,750 with Army for Construction of Structures and Facilities -- Dams. Taking place in OR. Signed on 2006-03-20. Completion date: 2006-05-26.
$49,900 with Army for Winches, Hoists, Cranes, and Derricks. Signed on 2000-09-07. Completion date: 2000-10-20.
$31,283 with Navy for Facilities Operations Support Services. Signed on 2005-09-06. Completion date: 2005-09-08.
$29,175, same as above.Signed on 2004-09-08. Completion date: 2005-09-08.
WEST COAST ACCUDYNE INC (7180 S SCOUT AVE in BELL GARDENS, CA; small business) : $140,660 in 2 contractsfrom 2005 to 2006
$114,800 with Navy for Laboratory Equipment and Supplies. Signed on 2005-03-18. Completion date: 2005-06-24.
$25,860 with Air Force for Defense Missile and Space Systems -- Applied Research and Exploratory Development (R&D). Signed on 2006-04-28. Completion date: 2006-08-04.
BRYANT, C L, INC (8330 ATLANTIC AVE in BELL, CA; small business)
$80,833 with Defense Logistics Agency for Fuel Oils. Signed on 2000-10-17. Completion date: 2001-08-31.
L A FRESH CUT CORPORATION (6218 MAYWOOD AVE in BELL, CA; small business) : $55,198 in 11 contractsfrom 2004 to 2005
Contracts for Fruits and Vegetables by Defense Logistics Agency Signed by year:2000: $0; 2001: $0; 2002: $0; 2003: $0; 2004: $10,625; 2005: $44,573; 2006: $0.
Biggest contracts:
$10,722 with Defense Logistics Agency for Fruits and Vegetables. Signed on 2005-01-13. Completion date: 2005-01-13.
$7,775, same as above.Signed on 2005-01-08. Completion date: 2005-01-08.
$6,711, same as above.Signed on 2005-12-08. Completion date: 2005-12-08.
$6,134, same as above.Signed on 2004-12-09. Completion date: 2004-12-09.
INDUSTRIAL MACHINING &REPAIR (6334 CLARA ST in BELL GARDENS, CA; small business) 50 employees, $0 revenue.
$28,500 with Navy for Maintenance, Repair and Rebuilding of Equipment -- Miscellaneous. Signed on 2003-04-18. Completion date: 2003-05-12.
LISEE, JOHN PUMPS INC (7516 S GARFIELD in BELL, CA; small business) 50 employees, $0 revenue: $20,461 in 2 contractsin 2005
$16,681 with Navy for Non-nuclear Ship Repair (West) Ship repair (including overhauls and conversions) performed on. non-nuclear propelled and nonpropelled ships west of the 108th meridian. Signed on 2005-09-02. Completion date: 2005-11-04.
$3,780 with Department of State for . Taking place in IL. Signed on 2005-08-04. Completion date: 2005-12-30.
Top industries in this zip code by the number of employees in 2005:
Arts, Entertainment, and Recreation: Other Gambling Industries (over 1000 employees: 1 establishment, 100-249 employees: 1 establishment)
Administrative and Support and Waste Management and Remediation Services: Temporary Help Services (500-999: 1, 250-499: 2, 100-249: 1, 20-49: 1)


 Nearest zip codes: 90270, 90040, 90280, 90255, 90241, 90240.