Commerce: Fire Incidents, California (CA)
Where are fire incidents reported in Commerce, CA
Something went wrong! Please refresh the page.
|
| |||||||||||||||||||||||||||||||||||||||||||||||||||||||||||||||||||||||||||||||||||||||||||||||||||||||||||||
2005 - 2018 National Fire Incident Reporting System (NFIRS) incidents
- Incident types reported to NFIRS in Commerce, CA
- 7,09254.8%Rescue & EMS
- 2,28317.6%Good Intent Call
- 2,01615.6%False Alarm
- 7615.9%Fire
- 4243.3%Hazardous Condition
- 3422.6%Service Call
- Fire incident types reported to NFIRS in Commerce, CA
- 30840.5%Mobile Property/Vehicle Fires
- 28437.3%Outside Fires
- 11815.5%Structure Fires
- 516.7%Other
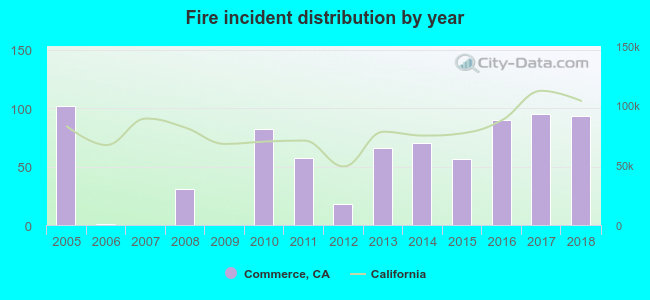 Based on the data from the years 2005 - 2018 the average number of fires per year is 54. The highest number of fires - 102 took place in 2005, and the least - 0 in 2007. The data has a decreasing trend.
The average number of yearly fire incidents per 10k residents in Commerce, CA compared to nearest cities:
(Note: Based on data for the last 3 years, including only cities with population 5,000 and above)
| Commerce: | 70.9 |
| Maywood: | 12.2 |
| Bell: | 19.0 |
| Bell Gardens: | 18.3 |
| East Los Angeles: | 17.0 |
| Montebello: | 3.6 |
| Cudahy: | 13.6 |
| Monterey Park: | 3.6 |
| Huntington Park: | 19.9 |
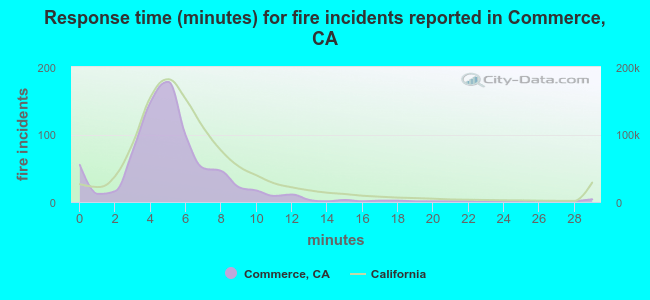 The median response time based on all reported fire incidents is 5 minutes. This is lower than the state median value.
The median response time in Commerce, CA compared to nearest cities:
(Note: Based on data for all years, including only cities with at least 500 fire incidents)
| Commerce: | 5 minutes |
| Bell: | 5 minutes |
| Bell Gardens: | 5 minutes |
| East Los Angeles: | 5 minutes |
| Montebello: | 7 minutes |
| Vernon: | 5 minutes |
| Monterey Park: | 5 minutes |
| Huntington Park: | 4 minutes |
| Pico Rivera: | 5 minutes |
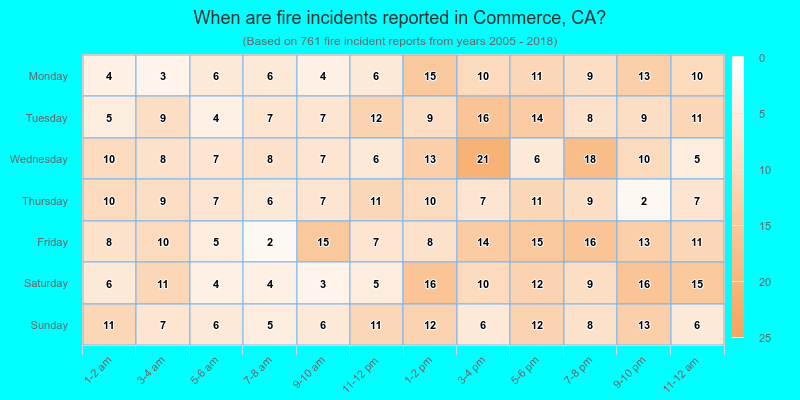
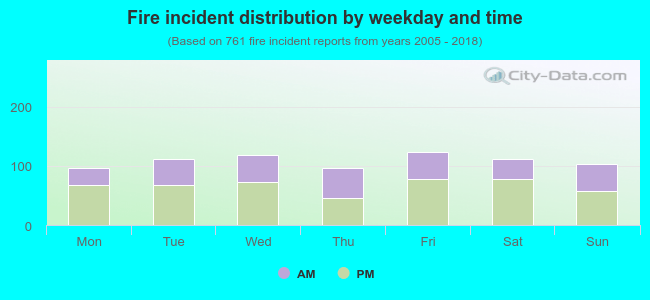 38.8% incidents where reported in the morning and 61.2% in the evening. The most fires (16.3%) took place on Friday, and the least (12.6%) on Thursday.
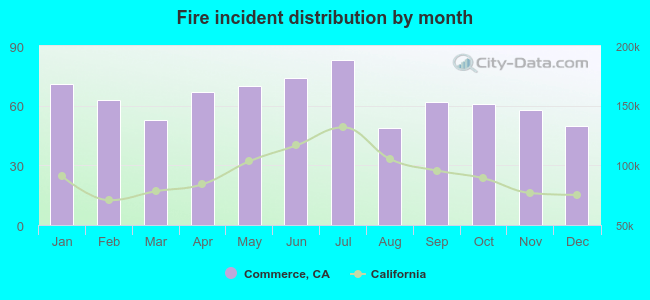 Based on the 761 fires from years 2005 - 2018 most fires (10.9%) took place during July, and the least (6.4%) in August.
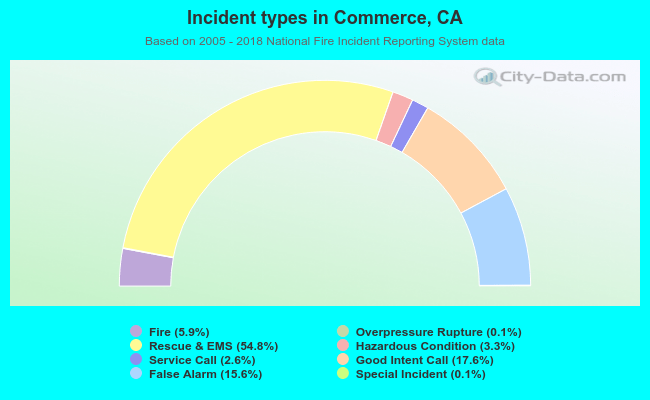 Out of all 12,941 cases reported during the years 2005 - 2018, the most belonged to the categories: Rescue & EMS (54.8%), Good Intent Call (17.6%), and False Alarm (15.6%).
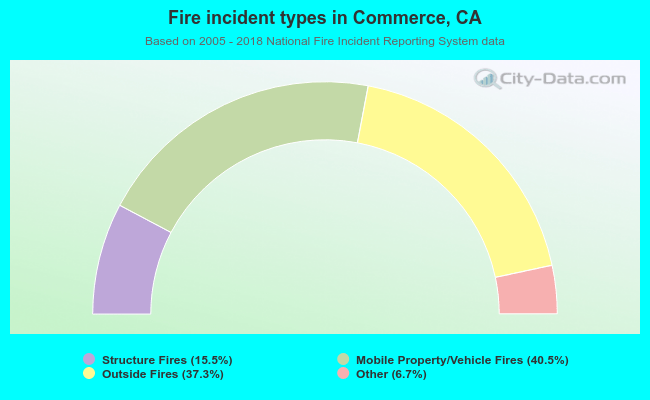 When looking into fire subcategories, the most reports belonged to: Mobile Property/Vehicle Fires (40.5%), and Outside Fires (37.3%).