Estimated zip code population in 2022: 32,746 Zip code population in 2010: 31,869 Zip code population in 2000: 29,823
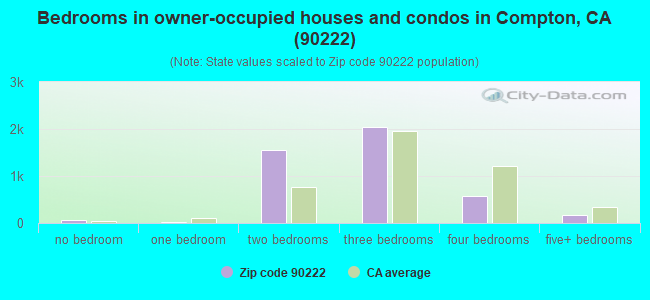
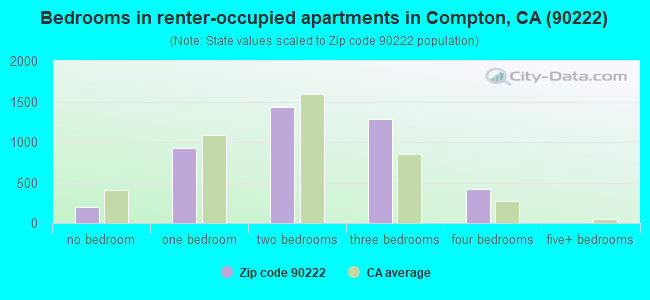
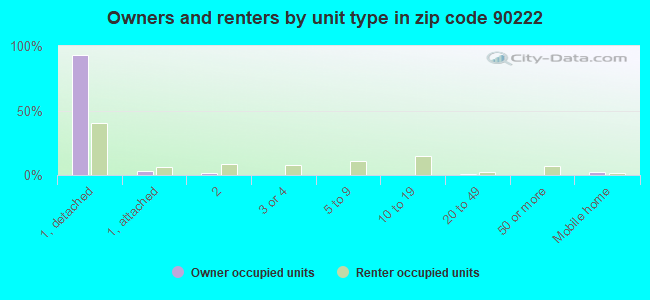
Houses and condos: 9,036 Renter-occupied apartments: 4,266
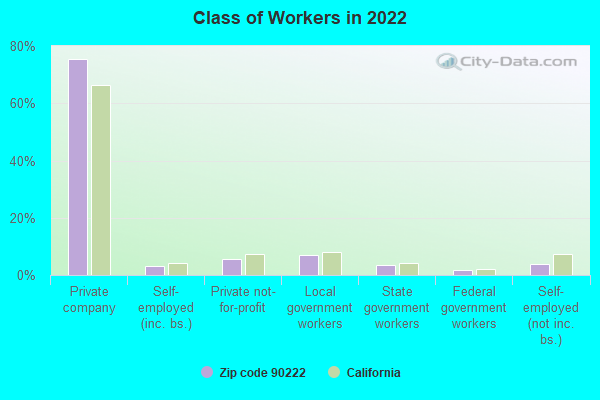
% of renters here:
49%
State:
44%
March 2022 cost of living index in zip code 90222: 132.5 (high, U.S. average is 100)
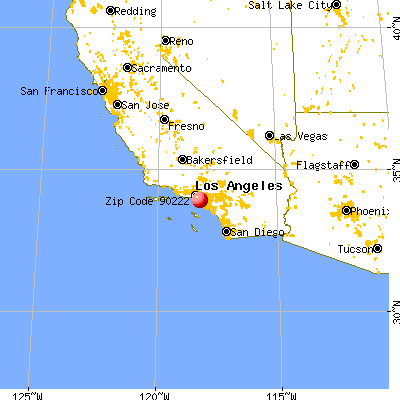
Land area: 2.6 sq. mi. Water area: 0.0 sq. mi.
Population density: 12,808 people per square mile
(very high).
OSM Map
General Map
Google Map
MSN Map
OSM Map
General Map
Google Map
MSN Map
OSM Map
General Map
Google Map
MSN Map
OSM Map
General Map
Google Map
MSN Map
Please wait while loading the map...
Real estate property taxes paid for housing units in 2022:
This zip code:
0.7% ($3,727)
California:
0.7% ($4,831)
Median real estate property taxes paid for housing units with mortgages in 2022: $4,017 (0.7%) Median real estate property taxes paid for housing units with no mortgage in 2022: $2,868 (0.5%)
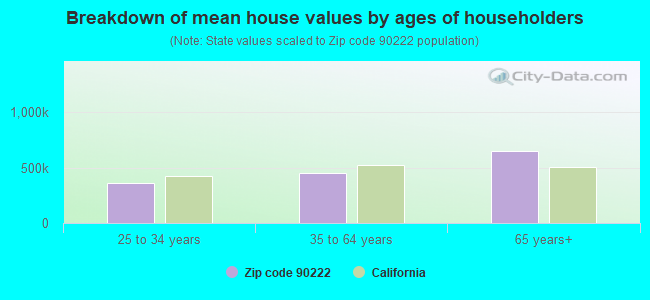
Estimated median house/condo value in 2022: $553,131
90222:
$553,131
California:
$715,900
According to our research of California and other state lists, there were 33 registered sex offenders living in 90222 zip code as of April 27, 2024. The ratio of all residents to sex offenders in zip code 90222 is 990 to 1. The ratio of registered sex offenders to all residents in this zip code is lower than the state average.
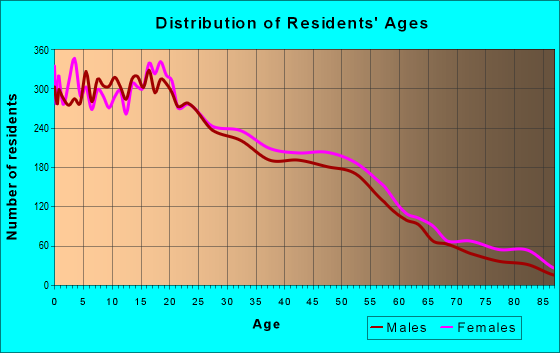
Median resident age:
This zip code:
31.6 years
California median age:
37.9 years
Average household size:
This zip code:
3.7 people
California:
2.8 people
Averages for the 2020 tax year for zip code 90222, filed in 2021:
Average Adjusted Gross Income (AGI) in 2020: $36,868 (Individual Income Tax Returns)
Here:
$36,868
State:
$95,910
Salary/wage: $36,035 (reported on 85.1% of returns)
Here:
$36,035
State:
$77,331
(% of AGI for various income ranges: 1246.2% for AGIs below $25k, 4008.1% for AGIs $25k-50k, 7547.0% for AGIs $50k-75k, 11377.1% for AGIs $75k-100k, 19010.0% for AGIs $100k-200k)
Taxable interest for individuals: $146 (reported on 17.1% of returns)
This zip code:
$146
California:
$2,294
(% of AGI for various income ranges: 1.8% for AGIs below $25k, 2.7% for AGIs $25k-50k, 5.4% for AGIs $50k-75k, 6.0% for AGIs $75k-100k, 21.6% for AGIs $100k-200k)
Ordinary dividends: $289 (reported on 1.9% of returns)
Here:
$289
State:
$10,949
(% of AGI for various income ranges: 0.3% for AGIs below $25k, 0.7% for AGIs $25k-50k, 0.6% for AGIs $50k-75k, 1.1% for AGIs $75k-100k, 6.9% for AGIs $100k-200k)
Net capital gain/loss in AGI: +$3,731 (reported on 2.7% of returns)
Here:
+$3,731
State:
+$49,306
(% of AGI for various income ranges: 2.0% for AGIs $50k-75k, 471.6% for AGIs $100k-200k)
Profit/loss from business: +$5,206 (reported on 19.1% of returns)
Here:
+$5,206
State:
+$15,671
(% of AGI for various income ranges: 199.0% for AGIs below $25k, 73.8% for AGIs $25k-50k, 84.8% for AGIs $50k-75k, 192.2% for AGIs $75k-100k, 198.8% for AGIs $100k-200k)
Taxable individual retirement arrangement distribution: $11,025 (reported on 1.1% of returns)
90222:
$11,025
California:
$23,505
(% of AGI for various income ranges: 6.1% for AGIs below $25k, 8.3% for AGIs $25k-50k, 25.4% for AGIs $50k-75k, 148.9% for AGIs $75k-100k)
Total itemized deductions: $25,816 (reported on 10.0% of returns)
Here:
$25,816
State:
$39,517
(% of AGI for various income ranges: 44.7% for AGIs below $25k, 219.9% for AGIs $25k-50k, 720.5% for AGIs $50k-75k, 1538.2% for AGIs $75k-100k, 2474.1% for AGIs $100k-200k)
Charity contributions: $4,875 (reported on 7.9% of returns)
Here:
$4,875
State:
$12,598
(% of AGI for various income ranges: 4.0% for AGIs below $25k, 29.5% for AGIs $25k-50k, 107.2% for AGIs $50k-75k, 240.4% for AGIs $75k-100k, 432.5% for AGIs $100k-200k)
Taxes paid: $7,631 (reported on 10.0% of returns)
90222:
$7,631
State:
$8,807
(% of AGI for various income ranges: 12.6% for AGIs below $25k, 58.5% for AGIs $25k-50k, 209.6% for AGIs $50k-75k, 500.7% for AGIs $75k-100k, 756.2% for AGIs $100k-200k)
Earned income credit: $2,584 (reported on 29.3% of returns)
Here:
$2,584
State:
$2,074
(% of AGI for various income ranges: 164.2% for AGIs below $25k, 97.5% for AGIs $25k-50k, 1.4% for AGIs $50k-75k)
Percentage of individuals using paid preparers for their 2020 taxes: 90.4%
Here:
90%
State:
92%
(% for various income ranges: 88.9% for AGIs below $25k, 91.2% for AGIs $25k-50k, 92.0% for AGIs $50k-75k, 91.7% for AGIs $75k-100k, 90.9% for AGIs $100k-200k, 100.0% for AGIs over 200k)
Averages for the 2012 tax year for zip code 90222, filed in 2013:
Average Adjusted Gross Income (AGI) in 2012: $27,806 (Individual Income Tax Returns)
Here:
$27,806
State:
$72,726
Salary/wage: $27,665 (reported on 85.3% of returns)
Here:
$27,665
State:
$59,079
(% of AGI for various income ranges: 77.2% for AGIs below $25k, 89.5% for AGIs $25k-50k, 88.9% for AGIs $50k-75k, 86.0% for AGIs $75k-100k, 79.6% for AGIs $100k-200k)
Taxable interest for individuals: $149 (reported on 13.8% of returns)
This zip code:
$149
California:
$2,146
(% of AGI for various income ranges: )
Ordinary dividends: $312 (reported on 1.3% of returns)
Here:
$312
State:
$9,308
(% of AGI for various income ranges: )
Profit/loss from business: +$8,103 (reported on 18.9% of returns)
Here:
+$8,103
State:
+$17,064
(% of AGI for various income ranges: 15.7% for AGIs below $25k, 2.1% for AGIs $25k-50k, 0.8% for AGIs $50k-75k, 0.3% for AGIs $75k-100k)
Taxable individual retirement arrangement distribution: $9,356 (reported on 1.5% of returns)
90222:
$9,356
California:
$19,557
(% of AGI for various income ranges: 0.3% for AGIs below $25k, 0.3% for AGIs $25k-50k, 0.6% for AGIs $50k-75k, 2.2% for AGIs $75k-100k)
Total itemized deductions: $18,457 (37% of AGI, reported on 21.2% of returns)
Here:
$18,457
State:
$34,004
Here:
36.9% of AGI
State:
22.7% of AGI
(% of AGI for various income ranges: 5.8% for AGIs below $25k, 14.0% for AGIs $25k-50k, 20.0% for AGIs $50k-75k, 22.0% for AGIs $75k-100k, 22.8% for AGIs $100k-200k)
Charity contributions: $2,922 (reported on 16.6% of returns)
Here:
$2,922
State:
$4,659
(% of AGI for various income ranges: 0.5% for AGIs below $25k, 1.6% for AGIs $25k-50k, 2.6% for AGIs $50k-75k, 3.1% for AGIs $75k-100k, 3.9% for AGIs $100k-200k)
Taxes paid: $4,655 (reported on 21.1% of returns)
90222:
$4,655
State:
$14,448
(% of AGI for various income ranges: 1.3% for AGIs below $25k, 3.1% for AGIs $25k-50k, 5.4% for AGIs $50k-75k, 6.1% for AGIs $75k-100k, 7.2% for AGIs $100k-200k)
Earned income credit: $2,885 (reported on 40.9% of returns)
Here:
$2,885
State:
$2,286
(% of AGI for various income ranges: 12.1% for AGIs below $25k, 2.0% for AGIs $25k-50k)
Percentage of individuals using paid preparers for their 2012 taxes: 77.3%
Here:
77%
State:
64%
(% for various income ranges: 76.9% for AGIs below $25k, 78.9% for AGIs $25k-50k, 76.4% for AGIs $50k-75k, 74.3% for AGIs $75k-100k, 76.5% for AGIs $100k-200k)
Averages for the 2004 tax year for zip code 90222, filed in 2005:
Average Adjusted Gross Income (AGI) in 2004: $25,332 (Individual Income Tax Returns)
Here:
$25,332
State:
$58,600
Salary/wage: $25,144 (reported on 87.8% of returns)
Here:
$25,144
State:
$49,455
(% of AGI for various income ranges: 79.3% for AGIs below $10k, 84.7% for AGIs $10k-25k, 90.8% for AGIs $25k-50k, 89.2% for AGIs $50k-75k, 87.1% for AGIs $75k-100k, 68.6% for AGIs over 100k)
Taxable interest for individuals: $453 (reported on 19.2% of returns)
This zip code:
$453
California:
$2,365
(% of AGI for various income ranges: 0.6% for AGIs below $10k, 0.3% for AGIs $10k-25k, 0.4% for AGIs $25k-50k, 0.3% for AGIs $50k-75k, 0.3% for AGIs $75k-100k, 0.2% for AGIs over 100k)
Taxable dividends: $312 (reported on 2.5% of returns)
Here:
$312
State:
$4,746
(% of AGI for various income ranges: 0.0% for AGIs below $10k, 0.0% for AGIs $10k-25k, 0.0% for AGIs $25k-50k, 0.0% for AGIs $50k-75k, 0.1% for AGIs $75k-100k, 0.0% for AGIs over 100k)
Net capital gain/loss: +$10,464 (reported on 1.8% of returns)
Here:
+$10,464
State:
+$23,418
(% of AGI for various income ranges: 0.0% for AGIs below $10k, -0.0% for AGIs $10k-25k, -0.0% for AGIs $25k-50k, 0.4% for AGIs $50k-75k, -0.1% for AGIs $75k-100k, 16.1% for AGIs over 100k)
Profit/loss from business: +$7,602 (reported on 13.8% of returns)
Here:
+$7,602
State:
+$16,826
(% of AGI for various income ranges: 19.3% for AGIs below $10k, 8.4% for AGIs $10k-25k, 1.9% for AGIs $25k-50k, 1.2% for AGIs $50k-75k, -0.5% for AGIs $75k-100k, 0.9% for AGIs over 100k)
IRA payment deduction: $1,604 (reported on 0.5% of returns)
90222:
$1,604
California:
$3,192
Total itemized deductions: $17,426 (40% of AGI, reported on 24.8% of returns)
Here:
$17,426
State:
$28,113
Here:
39.7% of AGI
State:
25.3% of AGI
(% of AGI for various income ranges: 5.0% for AGIs below $10k, 8.5% for AGIs $10k-25k, 18.8% for AGIs $25k-50k, 25.5% for AGIs $50k-75k, 27.3% for AGIs $75k-100k, 21.2% for AGIs over 100k)
Charity contributions deductions: $2,840 (6% of AGI, reported on 21.0% of returns)
Here:
$2,840
State:
$3,923
Here:
6.2% of AGI
State:
3.3% of AGI
(% of AGI for various income ranges: 0.3% for AGIs below $10k, 0.7% for AGIs $10k-25k, 2.5% for AGIs $25k-50k, 3.8% for AGIs $50k-75k, 5.0% for AGIs $75k-100k, 4.7% for AGIs over 100k)
Total tax: $2,203 (reported on 50.3% of returns)
90222:
$2,203
State:
$10,761
(% of AGI for various income ranges: 3.6% for AGIs below $10k, 2.6% for AGIs $10k-25k, 3.5% for AGIs $25k-50k, 6.2% for AGIs $50k-75k, 8.3% for AGIs $75k-100k, 12.8% for AGIs over 100k)
Earned income credit: $2,210 (reported on 41.8% of returns)
Here:
$2,210
State:
$1,763
Percentage of individuals using paid preparers for their 2004 taxes: 79.2%
Here:
79%
State:
66%
(% for various income ranges: 73.4% for AGIs below $10k, 80.4% for AGIs $10k-25k, 81.2% for AGIs $25k-50k, 80.3% for AGIs $50k-75k, 75.7% for AGIs $75k-100k, 82.7% for AGIs over 100k)
Likely homosexual households (counted as self-reported same-sex unmarried-partner households)
Lesbian couples: 0.1% of all households
Gay men: 0.0% of all households
Household received Food Stamps/SNAP in the past 12 months: 3,287 Household did not receive Food Stamps/SNAP in the past 12 months: 5,895
Women who had a birth in the past 12 months: 492 (187 now married, 309 unmarried) Women who did not have a birth in the past 12 months: 7,825 (2,452 now married, 5,400 unmarried)
Housing units in zip code 90222 with a mortgage: 3,280 (153 second mortgage, 16 home equity loan, 85 both second mortgage and home equity loan) Houses without a mortgage: 10
Median monthly owner costs for units with a mortgage: $2,249 Median monthly owner costs for units without a mortgage: $551
Residents with income below the poverty level in 2022:
This zip code:
16.4%
Whole state:
12.2%
Residents with income below 50% of the poverty level in 2022:
This zip code:
10.5%
Whole state:
6.2%
Median number of rooms in houses and condos:
Here:
5.1
State:
6.0
Median number of rooms in apartments:
Here:
4.3
State:
3.9
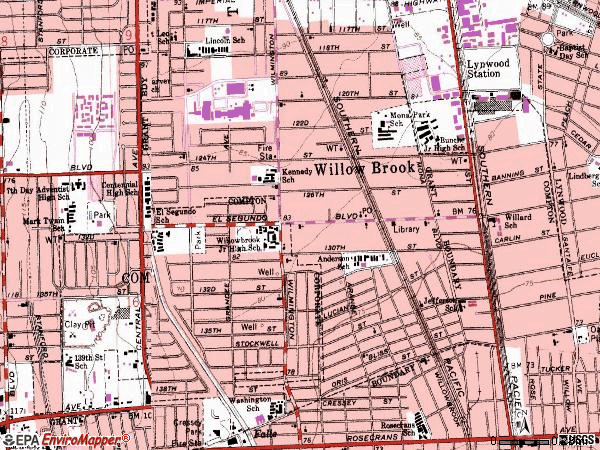
Notable locations in this zip code not listed on our city pages
Notable locations in zip code 90222: A C Bilbrew Branch County of Los Angeles Public Library (A), Cressey Park Fire Station (B), City of Compton Fire Department Station 3 (C). Display/hide their locations on the map
Churches in zip code 90222 include: Greater Mount Sinai Missionary Church (A), Calvary Resurrectional Baptist Church (B), God's Temple of Deliverance (C), New Testimony Temple (D), Nehemiah Missionary Baptist Church (E), Willowbrook Foursquare Church (F), Second Benevolent Baptist Church (G), Progress Baptist Church (H), Holy Revival Missionary Baptist Church (I). Display/hide their locations on the map
3,511 married couples with children.
3,139 single-parent households (880 men, 2,259 women).
32.4% of residents of 90222 zip code speak English at home.
66.3% of residents speak Spanish at home (67% very well, 11% well, 11% not well, 11% not at all).
0.1% of residents speak other Indo-European language at home (86% very well, 14% well).
1.0% of residents speak Asian or Pacific Island language at home (45% very well, 22% well, 27% not well, 5% not at all).
0.1% of residents speak other language at home (6% very well, 94% well).
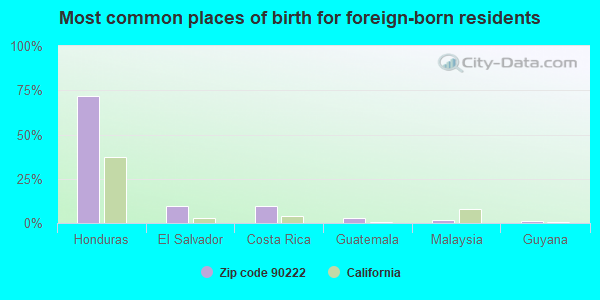
Foreign born population: 9,657 (29.5%) (44.5% of them are naturalized citizens)
This zip code:
29.5%
Whole state:
26.7%
72%Honduras
10%El Salvador
10%Costa Rica
3%Guatemala
2%Malaysia
1%Guyana
1%Mexico
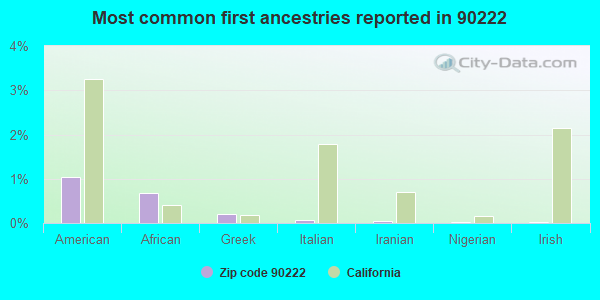
1%American
1%African
0%Greek
0%Italian
0%Iranian
0%Nigerian
0%Irish
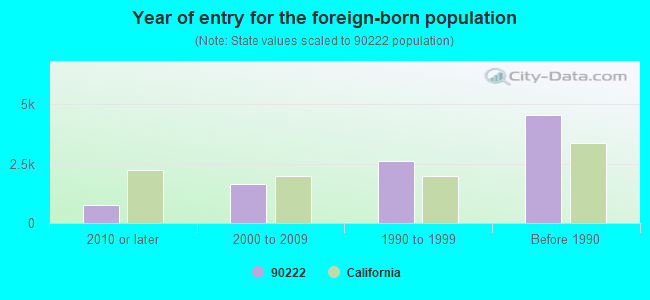
Year of entry for the foreign-born population
7522010 or later
1,6532000 to 2009
2,6311990 to 1999
4,550Before 1990
Major facilities with environmental interests located in this zip code:
AAA PLATING & INSPECTION INCORPORATED (424 DIXON in COMPTON, CA)
STATE MASTER (California - Hazardous Waste Tracking) - HAZARDOU WASTE PROGRAM CRITERIA AND HAZARDOUS AIR POLLUTANT INVENTORY (Inventory of air pollution sources) HAZARDOUS WASTE BIENNIAL REPORTER (Resource Conservation and Recovery Act (tracking hazardous waste)) Large Quantity Generators, more that 1000 kg of hazardous waste/month (Resource Conservation and Recovery Act (tracking hazardous waste)) - notification TRI REPORTER (Tracking of toxic chemicals releasing facilities) Business SIC and NAICS classification: ELECTROPLATING, PLATING, POLISHING, ANODIZING, AND COLORING Organizations: AAA PLATING AND INSPECTION, INC (CONTACT/OPERATOR)
Alternative names: A A A PLATING & INSPECTION INC
ACCURATE ANODIZING (1801 W. EL SEGUNDO BLVD in COMPTON, CA)
STATE MASTER (California - Hazardous Waste Tracking) - HAZARDOU WASTE PROGRAM HAZARDOUS WASTE BIENNIAL REPORTER (Resource Conservation and Recovery Act (tracking hazardous waste)) Large Quantity Generators, more that 1000 kg of hazardous waste/month (Resource Conservation and Recovery Act (tracking hazardous waste)) Business NAICS classification: ELECTROPLATING, PLATING, POLISHING, ANODIZING, AND COLORING. Organizations: ACCURATE ANODIZING INC. (CONTACT/OPERATOR)
IDEAL METAL PROCESSING COMPANY (1437 W. EL SEGUNDO BLVD. in COMPTON, CA)
(Integrated Compliance Information System) - ICIS-09-1997-0117, FORMAL ENFORCEMENT ACTION COMPLIANCE ACTIVITY (Tracking inspections of insecticide, fungicide, and rodenticide, and toxic substances) CRITERIA AND HAZARDOUS AIR POLLUTANT INVENTORY (Inventory of air pollution sources) TRI REPORTER (Tracking of toxic chemicals releasing facilities) Business SIC classification: COATING, ENGRAVING, AND ALLIED SERVICES; METAL FOIL AND LEAF
CEMEX CONSTRUCTION MATERIALS L P (2722 N ALAMEDA in COMPTON, CA) . Federal Facility
STATE MASTER (California - Hazardous Waste Tracking) - HAZARDOU WASTE PROGRAM Small Quantity Generators, between 100 kg and 1000 kg of hazardous waste/month (Resource Conservation and Recovery Act (tracking hazardous waste)) - notification TRI REPORTER (Tracking of toxic chemicals releasing facilities) Business SIC classification: READY-MIXED CONCRETE Organizations: MELVIN CHAMBERS (CONTACT/OWNER)
Alternative names: CEMEX CONSTRUCTION MATERIALS LP, CITY CONCRETE
ANNS TOP HAT CLEANERS (12809 S WILLOWBROOK AVE in COMPTON, CA)
STATE MASTER (California - Hazardous Waste Tracking) - HAZARDOU WASTE PROGRAM Small Quantity Generators, between 100 kg and 1000 kg of hazardous waste/month (Resource Conservation and Recovery Act (tracking hazardous waste))
ECONOMIC RESOURCES CORPORATION (3221 ALAMEDA ST STE K in COMPTON, CA)
STATE MASTER (California - Hazardous Waste Tracking) - HAZARDOU WASTE PROGRAM Small Quantity Generators, between 100 kg and 1000 kg of hazardous waste/month (Resource Conservation and Recovery Act (tracking hazardous waste)) - notification Organizations: ECONOMIC RESOURCES CORPORATN (CONTACT/OWNER)
J CAL TRANSPORTATION INC (522 E WEBER ST in COMPTON, CA)
STATE MASTER (California - Hazardous Waste Tracking) - HAZARDOU WASTE PROGRAM TRANSPORTER (Resource Conservation and Recovery Act (tracking hazardous waste)) Alternative names: J CAL TRANSPORATION INC
ANDERSON ELEMENTARY (2210 E. 130TH ST. in COMPTON, CA)
(National Center for Education Statistics) - STATE ID-6023741 Organizations: COMPTON UNIFIED (SCHOOL DISTRICT)
JEFFERSON ELEMENTARY (2508 E. 133RD ST. in COMPTON, CA)
(National Center for Education Statistics) - STATE ID-6012298 Organizations: COMPTON UNIFIED (SCHOOL DISTRICT)
KING (MARTIN LUTHER) ELEMENTAR (2270 E. 122ND ST. in COMPTON, CA)
(National Center for Education Statistics) - STATE ID-6023782 Organizations: COMPTON UNIFIED (SCHOOL DISTRICT)
MCNAIR (RONALD E.) ELEMENTARY (1450 W. EL SEGUNDO BLVD. in COMPTON, CA)
(National Center for Education Statistics) - STATE ID-6012264 Organizations: COMPTON UNIFIED (SCHOOL DISTRICT)
CENTENNIAL HIGH (2600 N. CENTRAL AVE. in COMPTON, CA)
(National Center for Education Statistics) - STATE ID-1931567 Organizations: COMPTON UNIFIED (SCHOOL DISTRICT)
MILPARK DRILLING FLUIDS (1706 MONA BLVD in COMPTON, CA)
(Resource Conservation and Recovery Act (tracking hazardous waste))
Housing units lacking complete plumbing facilities: 1.0% Housing units lacking complete kitchen facilities: 1.3%
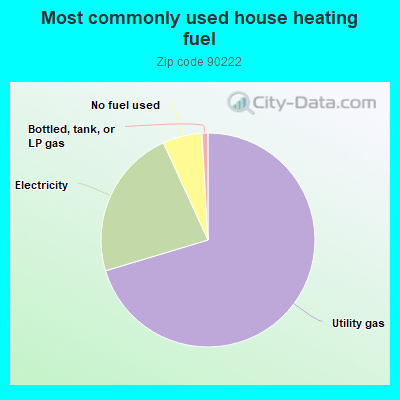
70.0%Utility gas
22.7%Electricity
5.9%No fuel used
0.9%Bottled, tank, or LP gas
Population in 1990: 28,754. Population change in the 1990s: +1,069 (+3.7%).
Place of birth for U.S.-born residents:
This state: 20,983
Northeast: 167
Midwest: 225
South: 1,329
West: 266
62% of the 90222 zip code residents lived in the same house 5 years ago. Out of people who lived in different houses, 92% lived in this county. Out of people who lived in different counties, 50% lived in California.
95% of the 90222 zip code residents lived in the same house 1 year ago. Out of people who lived in different houses, 94% moved from this county. Out of people who lived in different houses, 6% moved from different county within same state. Out of people who lived in different houses, 1% moved from different state.
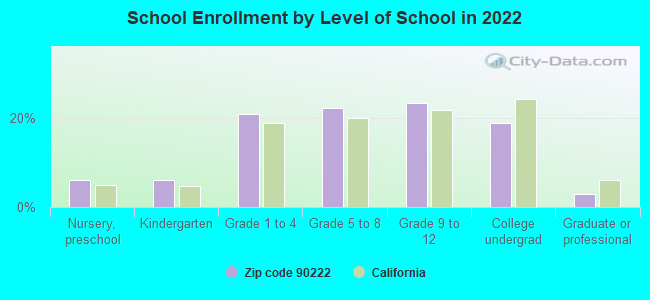
Private vs. public school enrollment:
Students in private schools in grades 1 to 8 (elementary and middle school): 78
Here:
2.2%
California:
10.5%
Students in private schools in grades 9 to 12 (high school):
Here:
0.0%
California:
8.5%
Students in private undergraduate colleges: 139
Here:
8.8%
California:
15.9%
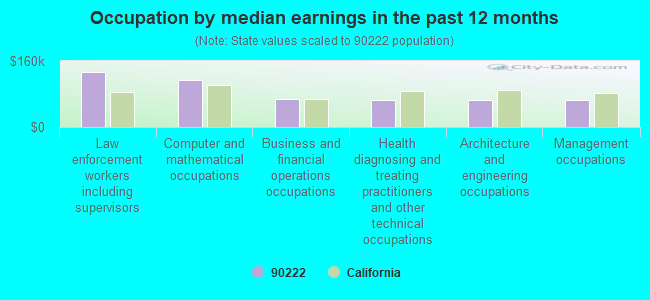
Occupation by median earnings in the past 12 months ($)
133,825Law enforcement workers including supervisors
114,790Computer and mathematical occupations
66,931Business and financial operations occupations
66,475Health diagnosing and treating practitioners and other technical occupations
66,190Architecture and engineering occupations
65,636Management occupations
Companies with federal contracts located in this zip code (COMPTON, CA):
SIERRA PACIFIC SUPPLY CO INC (1801 W EL SEGUNDO BLVD; small business) : $1,101,864 in 190 contractsfrom 2003 to 2006
Contracts for Bolts, Rivets, Fastening Device, Nails, Machine Keys, and Pins, and moreby Defense Logistics Agency, Navy, Army Signed by year:2000: $0; 2001: $0; 2002: $0; 2003: $40,000; 2004: $447,139; 2005: $478,475; 2006: $136,250.
Biggest contracts:
$57,658 with Defense Logistics Agency for Bolts. Signed on 2004-02-04. Completion date: 2004-06-04.
$40,000 with Defense Logistics Agency for Rivets. Signed on 2003-10-21. Completion date: 2004-03-20.
$35,976 with Defense Logistics Agency for Bolts. Signed on 2004-02-28. Completion date: 2004-06-28.
$32,240 with Defense Logistics Agency for Rivets. Signed on 2004-05-24. Completion date: 2004-06-10.
BOWMAN PLATING INC (2631 E 126TH ST; small business) : $79,800 in 2 contractsfrom 2002 to 2003
$44,800 with Navy for Specialized Ammunition Handling Servicing Equipment. Signed on 2002-05-13. Completion date: 2002-10-01.
$35,000, same as above.Signed on 2003-02-03. Completion date: 2003-08-30.
ALAMEDA CONSTRUCTION SERVICES (2528 E 125TH ST; small business) : $70,528 in 2 contractsin 2003
$45,564 with Air Force for Maintenance, Repair or Alteration of Real Property -- Other Administrative Facilities and Service Buildings. Signed on 2003-09-30. Completion date: 2003-12-30.
$24,964 with Air Force for Fencing, Fences, Gates and Components. Signed on 2003-08-07. Completion date: 2004-11-25.
WHITE, JANET L (12817 SOUTH WILLOWBROOK AV; small business) : $65,359 in 2 contractsfrom 2005 to 2006
$52,859 with Defense Logistics Agency for Airframe Structural Components. Signed on 2006-02-17. Completion date: 2020-09-02.
$12,500 with Defense Logistics Agency for Optical Sighting and Ranging Equipment. Signed on 2005-10-07. Completion date: 2006-03-16.
CONTINENTAL FORGE COMPANY (412 E EL SEGUNDO BLVD; small business) : $34,742 in 3 contractsfrom 2004 to 2005
$26,599 with Defense Logistics Agency for Airframe Structural Components. Signed on 2004-09-24. Completion date: 2005-09-23.
$4,402, same as above.Signed on 2005-03-30. Completion date: 2006-06-01.
$3,741, same as above.Signed on 2005-09-03. Completion date: 2006-03-29.
JACK RUBIN & SONS INC (13103 S ALAMEDA ST; small business) : $31,498 in 3 contractsfrom 2004 to 2006
$19,733 with Navy for Rigging and Rigging Gear. Signed on 2006-06-08. Completion date: 2006-05-12.
$7,473 with Navy for Chain and Wire Rope. Signed on 2004-10-14. Completion date: 2004-11-11.
$4,292 with Navy for Rigging and Rigging Gear. Signed on 2006-05-09. Completion date: 2006-05-12.
Top industries in this zip code by the number of employees in 2005:
Administrative and Support and Waste Management and Remediation Services: Solid Waste Collection (100-249 employees: 1 establishment, 1-4 employees: 1 establishment)
People in group quarters in 2010:
84 people in nursing facilities/skilled-nursing facilities
71 people in emergency and transitional shelters (with sleeping facilities) for people experiencing homelessness
28 people in other noninstitutional facilities
12 people in workers' group living quarters and job corps centers
6 people in group homes intended for adults
People in group quarters in 2000:
73 people in nursing homes
38 people in other noninstitutional group quarters
10 people in homes for the mentally retarded
Fatal accident statistics in 2014:
Fatal accident count: 2
Vehicles involved in fatal accidents: 2
Fatal accidents caused by drunken drivers: 1
Fatalities: 2
Persons involved in fatal accidents: 2
Pedestrians involved in fatal accidents: 1
Fatal accident statistics in 2013:
Fatal accident count: 1
Vehicles involved in fatal accidents: 2
Fatal accidents caused by drunken drivers: 0
Fatalities: 1
Persons involved in fatal accidents: 2
Pedestrians involved in fatal accidents: 1
Home Mortgage Disclosure Act Aggregated Statistics For Year 2009 (Based on 5 full and 10 partial tracts)
A) FHA, FSA/RHS & VA Home Purchase Loans
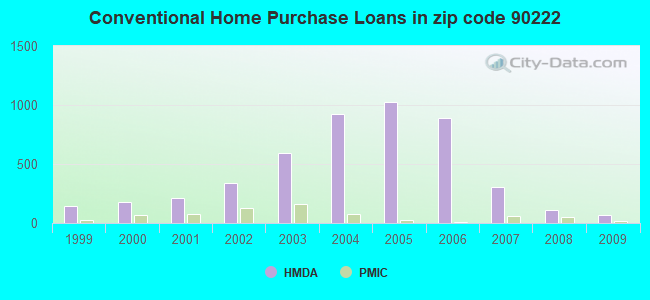
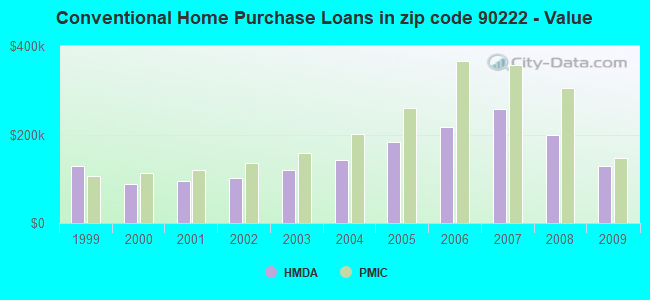
B) Conventional Home Purchase Loans
C) Refinancings
D) Home Improvement Loans
E) Loans on Dwellings For 5+ Families
F) Non-occupant Loans on < 5 Family Dwellings (A B C & D)
G) Loans On Manufactured Home Dwelling (A B C & D)
Number
Average Value
Number
Average Value
Number
Average Value
Number
Average Value
Number
Average Value
Number
Average Value
Number
Average Value
LOANS ORIGINATED
224
$175,295
67
$128,292
153
$192,305
7
$123,154
3
$230,117
42
$140,946
0
$0
APPLICATIONS APPROVED, NOT ACCEPTED
23
$202,423
8
$155,078
34
$179,018
5
$29,334
0
$0
9
$129,936
0
$0
APPLICATIONS DENIED
60
$193,682
27
$155,580
221
$221,394
20
$86,767
0
$0
29
$148,968
1
$497,000
APPLICATIONS WITHDRAWN
49
$171,452
23
$133,569
58
$186,102
13
$86,718
0
$0
18
$132,026
0
$0
FILES CLOSED FOR INCOMPLETENESS
10
$193,886
9
$122,817
36
$225,637
1
$3,000
0
$0
10
$136,609
0
$0
Aggregated Statistics For Year 2008 (Based on 5 full and 10 partial tracts)
A) FHA, FSA/RHS & VA Home Purchase Loans
B) Conventional Home Purchase Loans
C) Refinancings
D) Home Improvement Loans
E) Loans on Dwellings For 5+ Families
F) Non-occupant Loans on < 5 Family Dwellings (A B C & D)
G) Loans On Manufactured Home Dwelling (A B C & D)
Number
Average Value
Number
Average Value
Number
Average Value
Number
Average Value
Number
Average Value
Number
Average Value
Number
Average Value
LOANS ORIGINATED
44
$213,131
113
$198,922
329
$237,601
47
$185,138
3
$494,750
73
$209,196
1
$98,330
APPLICATIONS APPROVED, NOT ACCEPTED
10
$190,114
36
$217,051
117
$260,046
14
$111,156
0
$0
16
$232,324
2
$84,240
APPLICATIONS DENIED
18
$223,736
87
$267,457
543
$273,172
113
$102,667
1
$80,060
73
$226,723
2
$237,470
APPLICATIONS WITHDRAWN
20
$245,642
39
$217,039
159
$266,927
24
$157,257
0
$0
19
$233,679
0
$0
FILES CLOSED FOR INCOMPLETENESS
4
$241,125
15
$305,345
62
$294,650
5
$112,412
1
$244,980
4
$300,525
0
$0
Aggregated Statistics For Year 2007 (Based on 5 full and 10 partial tracts)
A) FHA, FSA/RHS & VA Home Purchase Loans
B) Conventional Home Purchase Loans
C) Refinancings
D) Home Improvement Loans
E) Loans on Dwellings For 5+ Families
F) Non-occupant Loans on < 5 Family Dwellings (A B C & D)
G) Loans On Manufactured Home Dwelling (A B C & D)
Number
Average Value
Number
Average Value
Number
Average Value
Number
Average Value
Number
Average Value
Number
Average Value
Number
Average Value
LOANS ORIGINATED
8
$379,968
307
$258,535
1,126
$259,735
174
$195,532
9
$721,963
171
$255,122
0
$0
APPLICATIONS APPROVED, NOT ACCEPTED
0
$0
121
$258,722
386
$283,829
39
$163,573
0
$0
48
$279,182
0
$0
APPLICATIONS DENIED
6
$224,892
329
$287,726
1,055
$297,326
193
$153,083
1
$393,900
136
$286,793
8
$130,261
APPLICATIONS WITHDRAWN
3
$300,720
113
$249,751
384
$281,762
51
$219,201
1
$393,900
39
$290,463
0
$0
FILES CLOSED FOR INCOMPLETENESS
0
$0
45
$276,064
117
$308,863
15
$237,448
0
$0
8
$342,332
0
$0
Aggregated Statistics For Year 2006 (Based on 5 full and 10 partial tracts)
B) Conventional Home Purchase Loans
C) Refinancings
D) Home Improvement Loans
E) Loans on Dwellings For 5+ Families
F) Non-occupant Loans on < 5 Family Dwellings (A B C & D)
G) Loans On Manufactured Home Dwelling (A B C & D)
Number
Average Value
Number
Average Value
Number
Average Value
Number
Average Value
Number
Average Value
Number
Average Value
LOANS ORIGINATED
893
$217,345
1,711
$251,166
245
$193,166
5
$528,734
273
$235,188
0
$0
APPLICATIONS APPROVED, NOT ACCEPTED
262
$215,104
418
$252,049
38
$208,224
0
$0
85
$238,542
3
$80,257
APPLICATIONS DENIED
639
$223,158
1,120
$265,044
228
$147,968
0
$0
172
$248,250
1
$179,800
APPLICATIONS WITHDRAWN
283
$212,665
747
$256,916
73
$147,469
1
$353,000
70
$235,839
0
$0
FILES CLOSED FOR INCOMPLETENESS
47
$206,804
170
$254,340
13
$199,073
0
$0
15
$246,007
0
$0
Aggregated Statistics For Year 2005 (Based on 5 full and 10 partial tracts)
A) FHA, FSA/RHS & VA Home Purchase Loans
B) Conventional Home Purchase Loans
C) Refinancings
D) Home Improvement Loans
E) Loans on Dwellings For 5+ Families
F) Non-occupant Loans on < 5 Family Dwellings (A B C & D)
G) Loans On Manufactured Home Dwelling (A B C & D)
Number
Average Value
Number
Average Value
Number
Average Value
Number
Average Value
Number
Average Value
Number
Average Value
Number
Average Value
LOANS ORIGINATED
6
$234,792
1,022
$183,207
1,991
$209,930
184
$159,751
4
$596,475
333
$189,725
1
$160,000
APPLICATIONS APPROVED, NOT ACCEPTED
2
$200,780
248
$189,340
424
$211,756
43
$173,504
0
$0
65
$192,929
2
$180,710
APPLICATIONS DENIED
1
$335,350
500
$190,432
1,064
$220,754
175
$133,587
0
$0
146
$214,137
1
$168,690
APPLICATIONS WITHDRAWN
2
$132,855
303
$188,529
790
$215,645
61
$155,809
0
$0
88
$199,656
1
$175,000
FILES CLOSED FOR INCOMPLETENESS
0
$0
47
$208,261
172
$221,484
7
$157,820
0
$0
24
$187,565
1
$188,000
Aggregated Statistics For Year 2004 (Based on 5 full and 10 partial tracts)
A) FHA, FSA/RHS & VA Home Purchase Loans
B) Conventional Home Purchase Loans
C) Refinancings
D) Home Improvement Loans
E) Loans on Dwellings For 5+ Families
F) Non-occupant Loans on < 5 Family Dwellings (A B C & D)
G) Loans On Manufactured Home Dwelling (A B C & D)
Number
Average Value
Number
Average Value
Number
Average Value
Number
Average Value
Number
Average Value
Number
Average Value
Number
Average Value
LOANS ORIGINATED
20
$211,688
923
$143,468
1,698
$166,561
176
$134,043
8
$458,565
252
$158,401
0
$0
APPLICATIONS APPROVED, NOT ACCEPTED
5
$215,666
264
$147,999
429
$163,268
41
$150,818
1
$469,000
60
$159,849
0
$0
APPLICATIONS DENIED
3
$243,473
434
$142,216
1,020
$162,883
168
$97,927
0
$0
125
$154,033
1
$7,440
APPLICATIONS WITHDRAWN
4
$235,932
233
$141,490
628
$155,021
49
$96,607
2
$4,195,380
47
$151,874
1
$2,000
FILES CLOSED FOR INCOMPLETENESS
4
$213,250
47
$150,095
188
$161,015
6
$91,517
0
$0
12
$177,616
0
$0
Aggregated Statistics For Year 2003 (Based on 5 full and 10 partial tracts)
A) FHA, FSA/RHS & VA Home Purchase Loans
B) Conventional Home Purchase Loans
C) Refinancings
D) Home Improvement Loans
E) Loans on Dwellings For 5+ Families
F) Non-occupant Loans on < 5 Family Dwellings (A B C & D)
Number
Average Value
Number
Average Value
Number
Average Value
Number
Average Value
Number
Average Value
Number
Average Value
LOANS ORIGINATED
105
$157,717
595
$120,312
1,483
$128,054
38
$62,503
10
$371,152
238
$125,416
APPLICATIONS APPROVED, NOT ACCEPTED
10
$163,414
137
$124,632
350
$124,576
20
$34,032
1
$400,000
76
$110,867
APPLICATIONS DENIED
20
$164,438
306
$131,950
929
$131,338
83
$37,240
1
$380,340
108
$133,424
APPLICATIONS WITHDRAWN
20
$166,812
133
$127,302
516
$132,403
15
$66,905
2
$807,500
29
$107,422
FILES CLOSED FOR INCOMPLETENESS
7
$157,453
33
$111,318
93
$124,370
2
$62,185
0
$0
13
$115,096
Aggregated Statistics For Year 2002 (Based on 3 full and 8 partial tracts)
A) FHA, FSA/RHS & VA Home Purchase Loans
B) Conventional Home Purchase Loans
C) Refinancings
D) Home Improvement Loans
E) Loans on Dwellings For 5+ Families
F) Non-occupant Loans on < 5 Family Dwellings (A B C & D)
Number
Average Value
Number
Average Value
Number
Average Value
Number
Average Value
Number
Average Value
Number
Average Value
LOANS ORIGINATED
127
$141,847
342
$101,275
635
$112,778
19
$28,644
2
$2,021,675
101
$96,879
APPLICATIONS APPROVED, NOT ACCEPTED
9
$111,734
66
$113,040
172
$118,369
2
$66,620
0
$0
26
$103,276
APPLICATIONS DENIED
34
$139,286
146
$109,029
486
$119,395
59
$23,765
0
$0
48
$118,673
APPLICATIONS WITHDRAWN
22
$156,639
69
$108,558
311
$122,900
27
$29,909
0
$0
22
$115,158
FILES CLOSED FOR INCOMPLETENESS
8
$150,666
31
$107,784
179
$124,314
0
$0
0
$0
17
$97,755
Aggregated Statistics For Year 2001 (Based on 3 full and 8 partial tracts)
A) FHA, FSA/RHS & VA Home Purchase Loans
B) Conventional Home Purchase Loans
C) Refinancings
D) Home Improvement Loans
E) Loans on Dwellings For 5+ Families
F) Non-occupant Loans on < 5 Family Dwellings (A B C & D)
Number
Average Value
Number
Average Value
Number
Average Value
Number
Average Value
Number
Average Value
Number
Average Value
LOANS ORIGINATED
167
$126,302
216
$95,722
503
$107,997
27
$23,519
2
$325,000
114
$94,277
APPLICATIONS APPROVED, NOT ACCEPTED
12
$159,081
44
$102,202
97
$111,082
11
$16,530
0
$0
15
$100,300
APPLICATIONS DENIED
40
$137,108
116
$107,537
597
$104,369
85
$32,729
2
$195,000
58
$102,220
APPLICATIONS WITHDRAWN
38
$135,934
61
$109,463
285
$115,264
15
$30,772
0
$0
12
$111,189
FILES CLOSED FOR INCOMPLETENESS
18
$135,168
12
$88,617
88
$118,446
4
$11,155
0
$0
8
$97,054
Aggregated Statistics For Year 2000 (Based on 3 full and 8 partial tracts)
A) FHA, FSA/RHS & VA Home Purchase Loans
B) Conventional Home Purchase Loans
C) Refinancings
D) Home Improvement Loans
F) Non-occupant Loans on < 5 Family Dwellings (A B C & D)
Number
Average Value
Number
Average Value
Number
Average Value
Number
Average Value
Number
Average Value
LOANS ORIGINATED
200
$123,367
179
$87,603
263
$97,116
44
$26,804
57
$73,815
APPLICATIONS APPROVED, NOT ACCEPTED
16
$133,512
29
$116,512
83
$86,450
18
$32,656
15
$95,577
APPLICATIONS DENIED
39
$136,131
91
$108,524
376
$92,351
82
$29,647
42
$100,166
APPLICATIONS WITHDRAWN
32
$128,112
57
$99,529
142
$92,241
9
$30,989
15
$110,241
FILES CLOSED FOR INCOMPLETENESS
8
$107,421
5
$53,650
145
$113,434
0
$0
14
$98,831
Aggregated Statistics For Year 1999 (Based on 3 full and 6 partial tracts)
A) FHA, FSA/RHS & VA Home Purchase Loans
B) Conventional Home Purchase Loans
C) Refinancings
D) Home Improvement Loans
E) Loans on Dwellings For 5+ Families
F) Non-occupant Loans on < 5 Family Dwellings (A B C & D)
2005 - 2018 National Fire Incident Reporting System (NFIRS) incidents
Based on the data from the years 2005 - 2018 the average number of fire incidents per year is 35. The highest number of reported fire incidents - 103 took place in 2007, and the least - 0 in 2006. The data has a declining trend.
When looking into fire subcategories, the most incidents belonged to: Outside Fires (53.8%), and Mobile Property/Vehicle Fires (24.5%).
Fire incident types reported to NFIRS in Zip Code 90222


 Nearest zip codes: 90059, 90220, 90262, 90002, 90061, 90221.


 Based on the data from the years 2005 - 2018 the average number of fire incidents per year is 35. The highest number of reported fire incidents - 103 took place in 2007, and the least - 0 in 2006. The data has a declining trend.
 When looking into fire subcategories, the most incidents belonged to: Outside Fires (53.8%), and Mobile Property/Vehicle Fires (24.5%).