Estimated zip code population in 2022: 52,667
Zip code population in 2010: 51,223
Zip code population in 2000: 44,584
Houses and condos: 13,830
Renter-occupied apartments: 7,798
% of renters here:
59%State:
44%
March 2022 cost of living index in zip code 90002: 134.5
(high, U.S. average is 100)
Land area: 3.1
sq. mi.
Water area: 0.0
sq. mi.
Population density: 17,200 people per square mile (very high).
OSM Map
General Map
Google Map
MSN Map
OSM Map
General Map
Google Map
MSN Map
OSM Map
General Map
Google Map
MSN Map
OSM Map
General Map
Google Map
MSN Map
Please wait while loading the map...
Real estate property taxes paid for housing units in 2022:
This zip code:
0.6% ($3,146)California:
0.7% ($4,831)
Median real estate property taxes paid for housing units with mortgages in 2022: $3,708 (0.7%)
Median real estate property taxes paid for housing units with no mortgage in 2022: $2,071 (0.4%)
Profiles of local businesses
Business Search - 14 Million verified businesses
Males: 25,812 Females: 26,855
For population 25 years and over in 90002:
High school or higher: 51.5%Bachelor's degree or higher: 6.8%Graduate or professional degree: 1.7%Unemployed: 9.4%Mean travel time to work (commute): 33.4 minutes
For population 15 years and over in 90002:
Never married: 53.2%Now married: 33.5%Separated: 3.5%Widowed: 3.9%Divorced: 6.0%
Zip code 90002 compared to state average:
Median household income below state average. Unemployed percentage above state average. Black race population percentage above state average. Hispanic race population percentage above state average. Median age below state average. Length of stay since moving in significantly above state average. House age above state average. Percentage of population with a bachelor's degree or higher significantly below state average. 43,402 82.4% Hispanic or Latino 8,028 15.2% Black 467 0.9% Asian 332 0.6% Two or more races 198 0.4% White 128 0.2% American Indian 88 0.2% Some other race 20 0.04% Native Hawaiian and Other
Data:
Median household income ($)
Median household income (% change since 2000)
Household income diversity
Ratio of average income to average house value (%)
Ratio of average income to average rent
Median household income ($) - White
Median household income ($) - Black or African American
Median household income ($) - Asian
Median household income ($) - Hispanic or Latino
Median household income ($) - American Indian and Alaska Native
Median household income ($) - Multirace
Median household income ($) - Other Race
Median household income for houses/condos with a mortgage ($)
Median household income for apartments without a mortgage ($)
Races - White alone (%)
Races - White alone (% change since 2000)
Races - Black alone (%)
Races - Black alone (% change since 2000)
Races - American Indian alone (%)
Races - American Indian alone (% change since 2000)
Races - Asian alone (%)
Races - Asian alone (% change since 2000)
Races - Hispanic (%)
Races - Hispanic (% change since 2000)
Races - Native Hawaiian and Other Pacific Islander alone (%)
Races - Native Hawaiian and Other Pacific Islander alone (% change since 2000)
Races - Two or more races (%)
Races - Two or more races (% change since 2000)
Races - Other race alone (%)
Races - Other race alone (% change since 2000)
Racial diversity
Unemployment (%)
Unemployment (% change since 2000)
Unemployment (%) - White
Unemployment (%) - Black or African American
Unemployment (%) - Asian
Unemployment (%) - Hispanic or Latino
Unemployment (%) - American Indian and Alaska Native
Unemployment (%) - Multirace
Unemployment (%) - Other Race
Population density (people per square mile)
Population - Males (%)
Population - Females (%)
Population - Males (%) - White
Population - Males (%) - Black or African American
Population - Males (%) - Asian
Population - Males (%) - Hispanic or Latino
Population - Males (%) - American Indian and Alaska Native
Population - Males (%) - Multirace
Population - Males (%) - Other Race
Population - Females (%) - White
Population - Females (%) - Black or African American
Population - Females (%) - Asian
Population - Females (%) - Hispanic or Latino
Population - Females (%) - American Indian and Alaska Native
Population - Females (%) - Multirace
Population - Females (%) - Other Race
Coronavirus confirmed cases (Apr 27, 2024)
Deaths caused by coronavirus (Apr 27, 2024)
Coronavirus confirmed cases (per 100k population) (Apr 27, 2024)
Deaths caused by coronavirus (per 100k population) (Apr 27, 2024)
Daily increase in number of cases (Apr 27, 2024)
Weekly increase in number of cases (Apr 27, 2024)
Cases doubled (in days) (Apr 27, 2024)
Hospitalized patients (Apr 18, 2022)
Negative test results (Apr 18, 2022)
Total test results (Apr 18, 2022)
COVID Vaccine doses distributed (per 100k population) (Sep 19, 2023)
COVID Vaccine doses administered (per 100k population) (Sep 19, 2023)
COVID Vaccine doses distributed (Sep 19, 2023)
COVID Vaccine doses administered (Sep 19, 2023)
Likely homosexual households (%)
Likely homosexual households (% change since 2000)
Likely homosexual households - Lesbian couples (%)
Likely homosexual households - Lesbian couples (% change since 2000)
Likely homosexual households - Gay men (%)
Likely homosexual households - Gay men (% change since 2000)
Cost of living index
Median gross rent ($)
Median contract rent ($)
Median monthly housing costs ($)
Median house or condo value ($)
Median house or condo value ($ change since 2000)
Mean house or condo value by units in structure - 1, detached ($)
Mean house or condo value by units in structure - 1, attached ($)
Mean house or condo value by units in structure - 2 ($)
Mean house or condo value by units in structure by units in structure - 3 or 4 ($)
Mean house or condo value by units in structure - 5 or more ($)
Mean house or condo value by units in structure - Boat, RV, van, etc. ($)
Mean house or condo value by units in structure - Mobile home ($)
Median house or condo value ($) - White
Median house or condo value ($) - Black or African American
Median house or condo value ($) - Asian
Median house or condo value ($) - Hispanic or Latino
Median house or condo value ($) - American Indian and Alaska Native
Median house or condo value ($) - Multirace
Median house or condo value ($) - Other Race
Median resident age
Resident age diversity
Median resident age - Males
Median resident age - Females
Median resident age - White
Median resident age - Black or African American
Median resident age - Asian
Median resident age - Hispanic or Latino
Median resident age - American Indian and Alaska Native
Median resident age - Multirace
Median resident age - Other Race
Median resident age - Males - White
Median resident age - Males - Black or African American
Median resident age - Males - Asian
Median resident age - Males - Hispanic or Latino
Median resident age - Males - American Indian and Alaska Native
Median resident age - Males - Multirace
Median resident age - Males - Other Race
Median resident age - Females - White
Median resident age - Females - Black or African American
Median resident age - Females - Asian
Median resident age - Females - Hispanic or Latino
Median resident age - Females - American Indian and Alaska Native
Median resident age - Females - Multirace
Median resident age - Females - Other Race
Commute - mean travel time to work (minutes)
Travel time to work - Less than 5 minutes (%)
Travel time to work - Less than 5 minutes (% change since 2000)
Travel time to work - 5 to 9 minutes (%)
Travel time to work - 5 to 9 minutes (% change since 2000)
Travel time to work - 10 to 19 minutes (%)
Travel time to work - 10 to 19 minutes (% change since 2000)
Travel time to work - 20 to 29 minutes (%)
Travel time to work - 20 to 29 minutes (% change since 2000)
Travel time to work - 30 to 39 minutes (%)
Travel time to work - 30 to 39 minutes (% change since 2000)
Travel time to work - 40 to 59 minutes (%)
Travel time to work - 40 to 59 minutes (% change since 2000)
Travel time to work - 60 to 89 minutes (%)
Travel time to work - 60 to 89 minutes (% change since 2000)
Travel time to work - 90 or more minutes (%)
Travel time to work - 90 or more minutes (% change since 2000)
Marital status - Never married (%)
Marital status - Now married (%)
Marital status - Separated (%)
Marital status - Widowed (%)
Marital status - Divorced (%)
Median family income ($)
Median family income (% change since 2000)
Median non-family income ($)
Median non-family income (% change since 2000)
Median per capita income ($)
Median per capita income (% change since 2000)
Median family income ($) - White
Median family income ($) - Black or African American
Median family income ($) - Asian
Median family income ($) - Hispanic or Latino
Median family income ($) - American Indian and Alaska Native
Median family income ($) - Multirace
Median family income ($) - Other Race
Median year house/condo built
Median year apartment built
Year house built - Built 2005 or later (%)
Year house built - Built 2000 to 2004 (%)
Year house built - Built 1990 to 1999 (%)
Year house built - Built 1980 to 1989 (%)
Year house built - Built 1970 to 1979 (%)
Year house built - Built 1960 to 1969 (%)
Year house built - Built 1950 to 1959 (%)
Year house built - Built 1940 to 1949 (%)
Year house built - Built 1939 or earlier (%)
Average household size
Household density (households per square mile)
Average household size - White
Average household size - Black or African American
Average household size - Asian
Average household size - Hispanic or Latino
Average household size - American Indian and Alaska Native
Average household size - Multirace
Average household size - Other Race
Occupied housing units (%)
Vacant housing units (%)
Owner occupied housing units (%)
Renter occupied housing units (%)
Vacancy status - For rent (%)
Vacancy status - For sale only (%)
Vacancy status - Rented or sold, not occupied (%)
Vacancy status - For seasonal, recreational, or occasional use (%)
Vacancy status - For migrant workers (%)
Vacancy status - Other vacant (%)
Residents with income below the poverty level (%)
Residents with income below 50% of the poverty level (%)
Children below poverty level (%)
Poor families by family type - Married-couple family (%)
Poor families by family type - Male, no wife present (%)
Poor families by family type - Female, no husband present (%)
Poverty status for native-born residents (%)
Poverty status for foreign-born residents (%)
Poverty among high school graduates not in families (%)
Poverty among people who did not graduate high school not in families (%)
Residents with income below the poverty level (%) - White
Residents with income below the poverty level (%) - Black or African American
Residents with income below the poverty level (%) - Asian
Residents with income below the poverty level (%) - Hispanic or Latino
Residents with income below the poverty level (%) - American Indian and Alaska Native
Residents with income below the poverty level (%) - Multirace
Residents with income below the poverty level (%) - Other Race
Air pollution - Air Quality Index (AQI)
Air pollution - CO
Air pollution - NO2
Air pollution - SO2
Air pollution - Ozone
Air pollution - PM10
Air pollution - PM25
Air pollution - Pb
Crime - Murders per 100,000 population
Crime - Rapes per 100,000 population
Crime - Robberies per 100,000 population
Crime - Assaults per 100,000 population
Crime - Burglaries per 100,000 population
Crime - Thefts per 100,000 population
Crime - Auto thefts per 100,000 population
Crime - Arson per 100,000 population
Crime - City-data.com crime index
Crime - Violent crime index
Crime - Property crime index
Crime - Murders per 100,000 population (5 year average)
Crime - Rapes per 100,000 population (5 year average)
Crime - Robberies per 100,000 population (5 year average)
Crime - Assaults per 100,000 population (5 year average)
Crime - Burglaries per 100,000 population (5 year average)
Crime - Thefts per 100,000 population (5 year average)
Crime - Auto thefts per 100,000 population (5 year average)
Crime - Arson per 100,000 population (5 year average)
Crime - City-data.com crime index (5 year average)
Crime - Violent crime index (5 year average)
Crime - Property crime index (5 year average)
1996 Presidential Elections Results (%) - Democratic Party (Clinton)
1996 Presidential Elections Results (%) - Republican Party (Dole)
1996 Presidential Elections Results (%) - Other
2000 Presidential Elections Results (%) - Democratic Party (Gore)
2000 Presidential Elections Results (%) - Republican Party (Bush)
2000 Presidential Elections Results (%) - Other
2004 Presidential Elections Results (%) - Democratic Party (Kerry)
2004 Presidential Elections Results (%) - Republican Party (Bush)
2004 Presidential Elections Results (%) - Other
2008 Presidential Elections Results (%) - Democratic Party (Obama)
2008 Presidential Elections Results (%) - Republican Party (McCain)
2008 Presidential Elections Results (%) - Other
2012 Presidential Elections Results (%) - Democratic Party (Obama)
2012 Presidential Elections Results (%) - Republican Party (Romney)
2012 Presidential Elections Results (%) - Other
2016 Presidential Elections Results (%) - Democratic Party (Clinton)
2016 Presidential Elections Results (%) - Republican Party (Trump)
2016 Presidential Elections Results (%) - Other
2020 Presidential Elections Results (%) - Democratic Party (Biden)
2020 Presidential Elections Results (%) - Republican Party (Trump)
2020 Presidential Elections Results (%) - Other
Ancestries Reported - Arab (%)
Ancestries Reported - Czech (%)
Ancestries Reported - Danish (%)
Ancestries Reported - Dutch (%)
Ancestries Reported - English (%)
Ancestries Reported - French (%)
Ancestries Reported - French Canadian (%)
Ancestries Reported - German (%)
Ancestries Reported - Greek (%)
Ancestries Reported - Hungarian (%)
Ancestries Reported - Irish (%)
Ancestries Reported - Italian (%)
Ancestries Reported - Lithuanian (%)
Ancestries Reported - Norwegian (%)
Ancestries Reported - Polish (%)
Ancestries Reported - Portuguese (%)
Ancestries Reported - Russian (%)
Ancestries Reported - Scotch-Irish (%)
Ancestries Reported - Scottish (%)
Ancestries Reported - Slovak (%)
Ancestries Reported - Subsaharan African (%)
Ancestries Reported - Swedish (%)
Ancestries Reported - Swiss (%)
Ancestries Reported - Ukrainian (%)
Ancestries Reported - United States (%)
Ancestries Reported - Welsh (%)
Ancestries Reported - West Indian (%)
Ancestries Reported - Other (%)
Educational Attainment - No schooling completed (%)
Educational Attainment - Less than high school (%)
Educational Attainment - High school or equivalent (%)
Educational Attainment - Less than 1 year of college (%)
Educational Attainment - 1 or more years of college (%)
Educational Attainment - Associate degree (%)
Educational Attainment - Bachelor's degree (%)
Educational Attainment - Master's degree (%)
Educational Attainment - Professional school degree (%)
Educational Attainment - Doctorate degree (%)
School Enrollment - Nursery, preschool (%)
School Enrollment - Kindergarten (%)
School Enrollment - Grade 1 to 4 (%)
School Enrollment - Grade 5 to 8 (%)
School Enrollment - Grade 9 to 12 (%)
School Enrollment - College undergrad (%)
School Enrollment - Graduate or professional (%)
School Enrollment - Not enrolled in school (%)
School enrollment - Public schools (%)
School enrollment - Private schools (%)
School enrollment - Not enrolled (%)
Median number of rooms in houses and condos
Median number of rooms in apartments
Housing units lacking complete plumbing facilities (%)
Housing units lacking complete kitchen facilities (%)
Density of houses
Urban houses (%)
Rural houses (%)
Households with people 60 years and over (%)
Households with people 65 years and over (%)
Households with people 75 years and over (%)
Households with one or more nonrelatives (%)
Households with no nonrelatives (%)
Population in households (%)
Family households (%)
Nonfamily households (%)
Population in families (%)
Family households with own children (%)
Median number of bedrooms in owner occupied houses
Mean number of bedrooms in owner occupied houses
Median number of bedrooms in renter occupied houses
Mean number of bedrooms in renter occupied houses
Median number of vehichles in owner occupied houses
Mean number of vehichles in owner occupied houses
Median number of vehichles in renter occupied houses
Mean number of vehichles in renter occupied houses
Mortgage status - with mortgage (%)
Mortgage status - with second mortgage (%)
Mortgage status - with home equity loan (%)
Mortgage status - with both second mortgage and home equity loan (%)
Mortgage status - without a mortgage (%)
Average family size
Average family size - White
Average family size - Black or African American
Average family size - Asian
Average family size - Hispanic or Latino
Average family size - American Indian and Alaska Native
Average family size - Multirace
Average family size - Other Race
Geographical mobility - Same house 1 year ago (%)
Geographical mobility - Moved within same county (%)
Geographical mobility - Moved from different county within same state (%)
Geographical mobility - Moved from different state (%)
Geographical mobility - Moved from abroad (%)
Place of birth - Born in state of residence (%)
Place of birth - Born in other state (%)
Place of birth - Native, outside of US (%)
Place of birth - Foreign born (%)
Housing units in structures - 1, detached (%)
Housing units in structures - 1, attached (%)
Housing units in structures - 2 (%)
Housing units in structures - 3 or 4 (%)
Housing units in structures - 5 to 9 (%)
Housing units in structures - 10 to 19 (%)
Housing units in structures - 20 to 49 (%)
Housing units in structures - 50 or more (%)
Housing units in structures - Mobile home (%)
Housing units in structures - Boat, RV, van, etc. (%)
House/condo owner moved in on average (years ago)
Renter moved in on average (years ago)
Year householder moved into unit - Moved in 1999 to March 2000 (%)
Year householder moved into unit - Moved in 1995 to 1998 (%)
Year householder moved into unit - Moved in 1990 to 1994 (%)
Year householder moved into unit - Moved in 1980 to 1989 (%)
Year householder moved into unit - Moved in 1970 to 1979 (%)
Year householder moved into unit - Moved in 1969 or earlier (%)
Means of transportation to work - Drove car alone (%)
Means of transportation to work - Carpooled (%)
Means of transportation to work - Public transportation (%)
Means of transportation to work - Bus or trolley bus (%)
Means of transportation to work - Streetcar or trolley car (%)
Means of transportation to work - Subway or elevated (%)
Means of transportation to work - Railroad (%)
Means of transportation to work - Ferryboat (%)
Means of transportation to work - Taxicab (%)
Means of transportation to work - Motorcycle (%)
Means of transportation to work - Bicycle (%)
Means of transportation to work - Walked (%)
Means of transportation to work - Other means (%)
Working at home (%)
Industry diversity
Most Common Industries - Agriculture, forestry, fishing and hunting, and mining (%)
Most Common Industries - Agriculture, forestry, fishing and hunting (%)
Most Common Industries - Mining, quarrying, and oil and gas extraction (%)
Most Common Industries - Construction (%)
Most Common Industries - Manufacturing (%)
Most Common Industries - Wholesale trade (%)
Most Common Industries - Retail trade (%)
Most Common Industries - Transportation and warehousing, and utilities (%)
Most Common Industries - Transportation and warehousing (%)
Most Common Industries - Utilities (%)
Most Common Industries - Information (%)
Most Common Industries - Finance and insurance, and real estate and rental and leasing (%)
Most Common Industries - Finance and insurance (%)
Most Common Industries - Real estate and rental and leasing (%)
Most Common Industries - Professional, scientific, and management, and administrative and waste management services (%)
Most Common Industries - Professional, scientific, and technical services (%)
Most Common Industries - Management of companies and enterprises (%)
Most Common Industries - Administrative and support and waste management services (%)
Most Common Industries - Educational services, and health care and social assistance (%)
Most Common Industries - Educational services (%)
Most Common Industries - Health care and social assistance (%)
Most Common Industries - Arts, entertainment, and recreation, and accommodation and food services (%)
Most Common Industries - Arts, entertainment, and recreation (%)
Most Common Industries - Accommodation and food services (%)
Most Common Industries - Other services, except public administration (%)
Most Common Industries - Public administration (%)
Occupation diversity
Most Common Occupations - Management, business, science, and arts occupations (%)
Most Common Occupations - Management, business, and financial occupations (%)
Most Common Occupations - Management occupations (%)
Most Common Occupations - Business and financial operations occupations (%)
Most Common Occupations - Computer, engineering, and science occupations (%)
Most Common Occupations - Computer and mathematical occupations (%)
Most Common Occupations - Architecture and engineering occupations (%)
Most Common Occupations - Life, physical, and social science occupations (%)
Most Common Occupations - Education, legal, community service, arts, and media occupations (%)
Most Common Occupations - Community and social service occupations (%)
Most Common Occupations - Legal occupations (%)
Most Common Occupations - Education, training, and library occupations (%)
Most Common Occupations - Arts, design, entertainment, sports, and media occupations (%)
Most Common Occupations - Healthcare practitioners and technical occupations (%)
Most Common Occupations - Health diagnosing and treating practitioners and other technical occupations (%)
Most Common Occupations - Health technologists and technicians (%)
Most Common Occupations - Service occupations (%)
Most Common Occupations - Healthcare support occupations (%)
Most Common Occupations - Protective service occupations (%)
Most Common Occupations - Fire fighting and prevention, and other protective service workers including supervisors (%)
Most Common Occupations - Law enforcement workers including supervisors (%)
Most Common Occupations - Food preparation and serving related occupations (%)
Most Common Occupations - Building and grounds cleaning and maintenance occupations (%)
Most Common Occupations - Personal care and service occupations (%)
Most Common Occupations - Sales and office occupations (%)
Most Common Occupations - Sales and related occupations (%)
Most Common Occupations - Office and administrative support occupations (%)
Most Common Occupations - Natural resources, construction, and maintenance occupations (%)
Most Common Occupations - Farming, fishing, and forestry occupations (%)
Most Common Occupations - Construction and extraction occupations (%)
Most Common Occupations - Installation, maintenance, and repair occupations (%)
Most Common Occupations - Production, transportation, and material moving occupations (%)
Most Common Occupations - Production occupations (%)
Most Common Occupations - Transportation occupations (%)
Most Common Occupations - Material moving occupations (%)
People in Group quarters - Institutionalized population (%)
People in Group quarters - Correctional institutions (%)
People in Group quarters - Federal prisons and detention centers (%)
People in Group quarters - Halfway houses (%)
People in Group quarters - Local jails and other confinement facilities (including police lockups) (%)
People in Group quarters - Military disciplinary barracks (%)
People in Group quarters - State prisons (%)
People in Group quarters - Other types of correctional institutions (%)
People in Group quarters - Nursing homes (%)
People in Group quarters - Hospitals/wards, hospices, and schools for the handicapped (%)
People in Group quarters - Hospitals/wards and hospices for chronically ill (%)
People in Group quarters - Hospices or homes for chronically ill (%)
People in Group quarters - Military hospitals or wards for chronically ill (%)
People in Group quarters - Other hospitals or wards for chronically ill (%)
People in Group quarters - Hospitals or wards for drug/alcohol abuse (%)
People in Group quarters - Mental (Psychiatric) hospitals or wards (%)
People in Group quarters - Schools, hospitals, or wards for the mentally retarded (%)
People in Group quarters - Schools, hospitals, or wards for the physically handicapped (%)
People in Group quarters - Institutions for the deaf (%)
People in Group quarters - Institutions for the blind (%)
People in Group quarters - Orthopedic wards and institutions for the physically handicapped (%)
People in Group quarters - Wards in general hospitals for patients who have no usual home elsewhere (%)
People in Group quarters - Wards in military hospitals for patients who have no usual home elsewhere (%)
People in Group quarters - Juvenile institutions (%)
People in Group quarters - Long-term care (%)
People in Group quarters - Homes for abused, dependent, and neglected children (%)
People in Group quarters - Residential treatment centers for emotionally disturbed children (%)
People in Group quarters - Training schools for juvenile delinquents (%)
People in Group quarters - Short-term care, detention or diagnostic centers for delinquent children (%)
People in Group quarters - Type of juvenile institution unknown (%)
People in Group quarters - Noninstitutionalized population (%)
People in Group quarters - College dormitories (includes college quarters off campus) (%)
People in Group quarters - Military quarters (%)
People in Group quarters - On base (%)
People in Group quarters - Barracks, unaccompanied personnel housing (UPH), (Enlisted/Officer), ;and similar group living quarters for military personnel (%)
People in Group quarters - Transient quarters for temporary residents (%)
People in Group quarters - Military ships (%)
People in Group quarters - Group homes (%)
People in Group quarters - Homes or halfway houses for drug/alcohol abuse (%)
People in Group quarters - Homes for the mentally ill (%)
People in Group quarters - Homes for the mentally retarded (%)
People in Group quarters - Homes for the physically handicapped (%)
People in Group quarters - Other group homes (%)
People in Group quarters - Religious group quarters (%)
People in Group quarters - Dormitories (%)
People in Group quarters - Agriculture workers' dormitories on farms (%)
People in Group quarters - Job Corps and vocational training facilities (%)
People in Group quarters - Other workers' dormitories (%)
People in Group quarters - Crews of maritime vessels (%)
People in Group quarters - Other nonhousehold living situations (%)
People in Group quarters - Other noninstitutional group quarters (%)
Residents speaking English at home (%)
Residents speaking English at home - Born in the United States (%)
Residents speaking English at home - Native, born elsewhere (%)
Residents speaking English at home - Foreign born (%)
Residents speaking Spanish at home (%)
Residents speaking Spanish at home - Born in the United States (%)
Residents speaking Spanish at home - Native, born elsewhere (%)
Residents speaking Spanish at home - Foreign born (%)
Residents speaking other language at home (%)
Residents speaking other language at home - Born in the United States (%)
Residents speaking other language at home - Native, born elsewhere (%)
Residents speaking other language at home - Foreign born (%)
Class of Workers - Employee of private company (%)
Class of Workers - Self-employed in own incorporated business (%)
Class of Workers - Private not-for-profit wage and salary workers (%)
Class of Workers - Local government workers (%)
Class of Workers - State government workers (%)
Class of Workers - Federal government workers (%)
Class of Workers - Self-employed workers in own not incorporated business and Unpaid family workers (%)
House heating fuel used in houses and condos - Utility gas (%)
House heating fuel used in houses and condos - Bottled, tank, or LP gas (%)
House heating fuel used in houses and condos - Electricity (%)
House heating fuel used in houses and condos - Fuel oil, kerosene, etc. (%)
House heating fuel used in houses and condos - Coal or coke (%)
House heating fuel used in houses and condos - Wood (%)
House heating fuel used in houses and condos - Solar energy (%)
House heating fuel used in houses and condos - Other fuel (%)
House heating fuel used in houses and condos - No fuel used (%)
House heating fuel used in apartments - Utility gas (%)
House heating fuel used in apartments - Bottled, tank, or LP gas (%)
House heating fuel used in apartments - Electricity (%)
House heating fuel used in apartments - Fuel oil, kerosene, etc. (%)
House heating fuel used in apartments - Coal or coke (%)
House heating fuel used in apartments - Wood (%)
House heating fuel used in apartments - Solar energy (%)
House heating fuel used in apartments - Other fuel (%)
House heating fuel used in apartments - No fuel used (%)
Armed forces status - In Armed Forces (%)
Armed forces status - Civilian (%)
Armed forces status - Civilian - Veteran (%)
Armed forces status - Civilian - Nonveteran (%)
Fatal accidents locations in years 2005-2021
Fatal accidents locations in 2005
Fatal accidents locations in 2006
Fatal accidents locations in 2007
Fatal accidents locations in 2008
Fatal accidents locations in 2009
Fatal accidents locations in 2010
Fatal accidents locations in 2011
Fatal accidents locations in 2012
Fatal accidents locations in 2013
Fatal accidents locations in 2014
Fatal accidents locations in 2015
Fatal accidents locations in 2016
Fatal accidents locations in 2017
Fatal accidents locations in 2018
Fatal accidents locations in 2019
Fatal accidents locations in 2020
Fatal accidents locations in 2021
Alcohol use - People drinking some alcohol every month (%)
Alcohol use - People not drinking at all (%)
Alcohol use - Average days/month drinking alcohol
Alcohol use - Average drinks/week
Alcohol use - Average days/year people drink much
Audiometry - Average condition of hearing (%)
Audiometry - People that can hear a whisper from across a quiet room (%)
Audiometry - People that can hear normal voice from across a quiet room (%)
Audiometry - Ears ringing, roaring, buzzing (%)
Audiometry - Had a job exposure to loud noise (%)
Audiometry - Had off-work exposure to loud noise (%)
Blood Pressure & Cholesterol - Has high blood pressure (%)
Blood Pressure & Cholesterol - Checking blood pressure at home (%)
Blood Pressure & Cholesterol - Frequently checking blood cholesterol (%)
Blood Pressure & Cholesterol - Has high cholesterol level (%)
Consumer Behavior - Money monthly spent on food at supermarket/grocery store
Consumer Behavior - Money monthly spent on food at other stores
Consumer Behavior - Money monthly spent on eating out
Consumer Behavior - Money monthly spent on carryout/delivered foods
Consumer Behavior - Income spent on food at supermarket/grocery store (%)
Consumer Behavior - Income spent on food at other stores (%)
Consumer Behavior - Income spent on eating out (%)
Consumer Behavior - Income spent on carryout/delivered foods (%)
Current Health Status - General health condition (%)
Current Health Status - Blood donors (%)
Current Health Status - Has blood ever tested for HIV virus (%)
Current Health Status - Left-handed people (%)
Dermatology - People using sunscreen (%)
Diabetes - Diabetics (%)
Diabetes - Had a blood test for high blood sugar (%)
Diabetes - People taking insulin (%)
Diet Behavior & Nutrition - Diet health (%)
Diet Behavior & Nutrition - Milk product consumption (# of products/month)
Diet Behavior & Nutrition - Meals not home prepared (#/week)
Diet Behavior & Nutrition - Meals from fast food or pizza place (#/week)
Diet Behavior & Nutrition - Ready-to-eat foods (#/month)
Diet Behavior & Nutrition - Frozen meals/pizza (#/month)
Drug Use - People that ever used marijuana or hashish (%)
Drug Use - Ever used hard drugs (%)
Drug Use - Ever used any form of cocaine (%)
Drug Use - Ever used heroin (%)
Drug Use - Ever used methamphetamine (%)
Health Insurance - People covered by health insurance (%)
Kidney Conditions-Urology - Avg. # of times urinating at night
Medical Conditions - People with asthma (%)
Medical Conditions - People with anemia (%)
Medical Conditions - People with psoriasis (%)
Medical Conditions - People with overweight (%)
Medical Conditions - Elderly people having difficulties in thinking or remembering (%)
Medical Conditions - People who ever received blood transfusion (%)
Medical Conditions - People having trouble seeing even with glass/contacts (%)
Medical Conditions - People with arthritis (%)
Medical Conditions - People with gout (%)
Medical Conditions - People with congestive heart failure (%)
Medical Conditions - People with coronary heart disease (%)
Medical Conditions - People with angina pectoris (%)
Medical Conditions - People who ever had heart attack (%)
Medical Conditions - People who ever had stroke (%)
Medical Conditions - People with emphysema (%)
Medical Conditions - People with thyroid problem (%)
Medical Conditions - People with chronic bronchitis (%)
Medical Conditions - People with any liver condition (%)
Medical Conditions - People who ever had cancer or malignancy (%)
Mental Health - People who have little interest in doing things (%)
Mental Health - People feeling down, depressed, or hopeless (%)
Mental Health - People who have trouble sleeping or sleeping too much (%)
Mental Health - People feeling tired or having little energy (%)
Mental Health - People with poor appetite or overeating (%)
Mental Health - People feeling bad about themself (%)
Mental Health - People who have trouble concentrating on things (%)
Mental Health - People moving or speaking slowly or too fast (%)
Mental Health - People having thoughts they would be better off dead (%)
Oral Health - Average years since last visit a dentist
Oral Health - People embarrassed because of mouth (%)
Oral Health - People with gum disease (%)
Oral Health - General health of teeth and gums (%)
Oral Health - Average days a week using dental floss/device
Oral Health - Average days a week using mouthwash for dental problem
Oral Health - Average number of teeth
Pesticide Use - Households using pesticides to control insects (%)
Pesticide Use - Households using pesticides to kill weeds (%)
Physical Activity - People doing vigorous-intensity work activities (%)
Physical Activity - People doing moderate-intensity work activities (%)
Physical Activity - People walking or bicycling (%)
Physical Activity - People doing vigorous-intensity recreational activities (%)
Physical Activity - People doing moderate-intensity recreational activities (%)
Physical Activity - Average hours a day doing sedentary activities
Physical Activity - Average hours a day watching TV or videos
Physical Activity - Average hours a day using computer
Physical Functioning - People having limitations keeping them from working (%)
Physical Functioning - People limited in amount of work they can do (%)
Physical Functioning - People that need special equipment to walk (%)
Physical Functioning - People experiencing confusion/memory problems (%)
Physical Functioning - People requiring special healthcare equipment (%)
Prescription Medications - Average number of prescription medicines taking
Preventive Aspirin Use - Adults 40+ taking low-dose aspirin (%)
Reproductive Health - Vaginal deliveries (%)
Reproductive Health - Cesarean deliveries (%)
Reproductive Health - Deliveries resulted in a live birth (%)
Reproductive Health - Pregnancies resulted in a delivery (%)
Reproductive Health - Women breastfeeding newborns (%)
Reproductive Health - Women that had a hysterectomy (%)
Reproductive Health - Women that had both ovaries removed (%)
Reproductive Health - Women that have ever taken birth control pills (%)
Reproductive Health - Women taking birth control pills (%)
Reproductive Health - Women that have ever used Depo-Provera or injectables (%)
Reproductive Health - Women that have ever used female hormones (%)
Sexual Behavior - People 18+ that ever had sex (vaginal, anal, or oral) (%)
Sexual Behavior - Males 18+ that ever had vaginal sex with a woman (%)
Sexual Behavior - Males 18+ that ever performed oral sex on a woman (%)
Sexual Behavior - Males 18+ that ever had anal sex with a woman (%)
Sexual Behavior - Males 18+ that ever had any sex with a man (%)
Sexual Behavior - Females 18+ that ever had vaginal sex with a man (%)
Sexual Behavior - Females 18+ that ever performed oral sex on a man (%)
Sexual Behavior - Females 18+ that ever had anal sex with a man (%)
Sexual Behavior - Females 18+ that ever had any kind of sex with a woman (%)
Sexual Behavior - Average age people first had sex
Sexual Behavior - Average number of female sex partners in lifetime (males 18+)
Sexual Behavior - Average number of female vaginal sex partners in lifetime (males 18+)
Sexual Behavior - Average age people first performed oral sex on a woman (18+)
Sexual Behavior - Average number of woman performed oral sex on in lifetime (18+)
Sexual Behavior - Average number of male sex partners in lifetime (males 18+)
Sexual Behavior - Average number of male anal sex partners in lifetime (males 18+)
Sexual Behavior - Average age people first performed oral sex on a man (18+)
Sexual Behavior - Average number of male oral sex partners in lifetime (18+)
Sexual Behavior - People using protection when performing oral sex (%)
Sexual Behavior - Average number of times people have vaginal or anal sex a year
Sexual Behavior - People having sex without condom (%)
Sexual Behavior - Average number of male sex partners in lifetime (females 18+)
Sexual Behavior - Average number of male vaginal sex partners in lifetime (females 18+)
Sexual Behavior - Average number of female sex partners in lifetime (females 18+)
Sexual Behavior - Circumcised males 18+ (%)
Sleep Disorders - Average hours sleeping at night
Sleep Disorders - People that has trouble sleeping (%)
Smoking-Cigarette Use - People smoking cigarettes (%)
Taste & Smell - People 40+ having problems with smell (%)
Taste & Smell - People 40+ having problems with taste (%)
Taste & Smell - People 40+ that ever had wisdom teeth removed (%)
Taste & Smell - People 40+ that ever had tonsils teeth removed (%)
Taste & Smell - People 40+ that ever had a loss of consciousness because of a head injury (%)
Taste & Smell - People 40+ that ever had a broken nose or other serious injury to face or skull (%)
Taste & Smell - People 40+ that ever had two or more sinus infections (%)
Weight - Average height (inches)
Weight - Average weight (pounds)
Weight - Average BMI
Weight - People that are obese (%)
Weight - People that ever were obese (%)
Weight - People trying to lose weight (%)
100%
urban population.
Estimated median house/condo value in 2022: $502,096
90002:
$502,096California:
$715,900
Median resident age: This zip code:
30.7 yearsCalifornia median age:
37.9 years
Average household size: This zip code:
4.0 peopleCalifornia:
2.8 people
Averages for the 2020 tax year for zip code 90002, filed in 2021:
Average Adjusted Gross Income (AGI) in 2020: $32,401 (Individual Income Tax Returns) Here:
$32,401State:
$95,910
Salary/wage: $32,117 (reported on 82.8% of returns )Here:
$32,117State:
$77,331
(% of AGI for various income ranges: 1202.8% for AGIs below $25k , 3854.2% for AGIs $25k-50k , 7537.4% for AGIs $50k-75k , 11014.7% for AGIs $75k-100k , 18621.3% for AGIs $100k-200k ) Taxable interest for individuals: $116 (reported on 13.8% of returns )This zip code:
$116California:
$2,294
(% of AGI for various income ranges: 1.2% for AGIs below $25k , 1.8% for AGIs $25k-50k , 3.0% for AGIs $50k-75k , 8.8% for AGIs $75k-100k , 16.1% for AGIs $100k-200k ) Ordinary dividends: $333 (reported on 1.7% of returns )(% of AGI for various income ranges: 0.9% for AGIs $25k-50k , 1.8% for AGIs $50k-75k , 2.5% for AGIs $75k-100k , 4.5% for AGIs $100k-200k ) Net capital gain/loss in AGI: +$130 (reported on 2.5% of returns )(% of AGI for various income ranges: 8.6% for AGIs $75k-100k , 61.3% for AGIs $100k-200k ) Profit/loss from business: +$7,428 (reported on 21.9% of returns )Here:
+$7,428State:
+$15,671
(% of AGI for various income ranges: 303.9% for AGIs below $25k , 127.8% for AGIs $25k-50k , 162.6% for AGIs $50k-75k , 249.2% for AGIs $75k-100k , 559.4% for AGIs $100k-200k ) Taxable individual retirement arrangement distribution: $7,136 (reported on 0.6% of returns )90002:
$7,136California:
$23,505
(% of AGI for various income ranges: 2.6% for AGIs below $25k , 3.9% for AGIs $25k-50k , 16.8% for AGIs $50k-75k , 37.3% for AGIs $75k-100k ) Total itemized deductions: $24,912 (reported on 6.5% of returns )Here:
$24,912State:
$39,517
(% of AGI for various income ranges: 33.8% for AGIs below $25k , 154.8% for AGIs $25k-50k , 574.3% for AGIs $50k-75k , 1135.5% for AGIs $75k-100k , 1958.7% for AGIs $100k-200k ) Charity contributions: $4,671 (reported on 4.8% of returns )(% of AGI for various income ranges: 2.4% for AGIs below $25k , 20.3% for AGIs $25k-50k , 82.6% for AGIs $50k-75k , 158.1% for AGIs $75k-100k , 335.8% for AGIs $100k-200k ) Taxes paid: $7,212 (reported on 6.5% of returns )(% of AGI for various income ranges: 7.9% for AGIs below $25k , 40.4% for AGIs $25k-50k , 170.6% for AGIs $50k-75k , 354.7% for AGIs $75k-100k , 621.3% for AGIs $100k-200k ) Earned income credit: $2,662 (reported on 33.1% of returns )(% of AGI for various income ranges: 180.8% for AGIs below $25k , 105.3% for AGIs $25k-50k , 1.5% for AGIs $50k-75k ) Percentage of individuals using paid preparers for their 2020 taxes: 89.9%(% for various income ranges: 88.2% for AGIs below $25k , 91.1% for AGIs $25k-50k , 91.8% for AGIs $50k-75k , 91.6% for AGIs $75k-100k , 92.3% for AGIs $100k-200k , 100.0% for AGIs over 200k )
Averages for the 2012 tax year for zip code 90002, filed in 2013:
Average Adjusted Gross Income (AGI) in 2012: $24,191 (Individual Income Tax Returns) Here:
$24,191State:
$72,726
Salary/wage: $24,634 (reported on 83.3% of returns )Here:
$24,634State:
$59,079
(% of AGI for various income ranges: 75.8% for AGIs below $25k , 91.5% for AGIs $25k-50k , 90.3% for AGIs $50k-75k , 90.0% for AGIs $75k-100k , 73.4% for AGIs $100k-200k ) Taxable interest for individuals: $129 (reported on 11.2% of returns )This zip code:
$129California:
$2,146
(% of AGI for various income ranges: ) Ordinary dividends: $575 (reported on 0.9% of returns )(% of AGI for various income ranges: ) Profit/loss from business: +$9,424 (reported on 22.5% of returns )Here:
+$9,424State:
+$17,064
(% of AGI for various income ranges: 19.6% for AGIs below $25k , 3.1% for AGIs $25k-50k , 1.5% for AGIs $50k-75k , 1.7% for AGIs $75k-100k ) Taxable individual retirement arrangement distribution: $6,754 (reported on 0.7% of returns )90002:
$6,754California:
$19,557
(% of AGI for various income ranges: 0.1% for AGIs below $25k , 0.2% for AGIs $25k-50k , 0.5% for AGIs $50k-75k ) Total itemized deductions: $17,602 (39% of AGI, reported on 16.1% of returns )Here:
$17,602State:
$34,004
Here:
39.2% of AGIState:
22.7% of AGI
(% of AGI for various income ranges: 5.4% for AGIs below $25k , 12.9% for AGIs $25k-50k , 19.3% for AGIs $50k-75k , 19.0% for AGIs $75k-100k , 18.3% for AGIs $100k-200k ) Charity contributions: $2,426 (reported on 11.3% of returns )(% of AGI for various income ranges: 0.3% for AGIs below $25k , 1.3% for AGIs $25k-50k , 2.1% for AGIs $50k-75k , 2.1% for AGIs $75k-100k , 2.7% for AGIs $100k-200k ) Taxes paid: $4,196 (reported on 15.9% of returns )90002:
$4,196State:
$14,448
(% of AGI for various income ranges: 1.0% for AGIs below $25k , 2.7% for AGIs $25k-50k , 5.2% for AGIs $50k-75k , 5.9% for AGIs $75k-100k , 5.4% for AGIs $100k-200k ) Earned income credit: $3,026 (reported on 46.6% of returns )(% of AGI for various income ranges: 13.4% for AGIs below $25k , 2.3% for AGIs $25k-50k ) Percentage of individuals using paid preparers for their 2012 taxes: 78.1%(% for various income ranges: 77.1% for AGIs below $25k , 80.3% for AGIs $25k-50k , 79.5% for AGIs $50k-75k , 78.6% for AGIs $75k-100k , 75.0% for AGIs $100k-200k )
Averages for the 2004 tax year for zip code 90002, filed in 2005:
Average Adjusted Gross Income (AGI) in 2004: $21,979 (Individual Income Tax Returns) Here:
$21,979State:
$58,600
Salary/wage: $22,188 (reported on 88.5% of returns )Here:
$22,188State:
$49,455
(% of AGI for various income ranges: 84.5% for AGIs below $10k , 85.6% for AGIs $10k-25k , 93.2% for AGIs $25k-50k , 91.9% for AGIs $50k-75k , 85.9% for AGIs $75k-100k , 74.1% for AGIs over 100k ) Taxable interest for individuals: $248 (reported on 14.6% of returns )This zip code:
$248California:
$2,365
(% of AGI for various income ranges: 0.4% for AGIs below $10k , 0.1% for AGIs $10k-25k , 0.2% for AGIs $25k-50k , 0.2% for AGIs $50k-75k , 0.2% for AGIs $75k-100k , 0.2% for AGIs over 100k ) Taxable dividends: $346 (reported on 1.7% of returns )(% of AGI for various income ranges: 0.1% for AGIs below $10k , 0.0% for AGIs $10k-25k , 0.0% for AGIs $25k-50k , 0.0% for AGIs $50k-75k , 0.1% for AGIs $75k-100k ) Net capital gain/loss: +$3,469 (reported on 0.9% of returns )Here:
+$3,469State:
+$23,418
(% of AGI for various income ranges: 0.1% for AGIs below $10k , -0.0% for AGIs $10k-25k , 0.1% for AGIs $25k-50k , 0.2% for AGIs $50k-75k , 2.6% for AGIs $75k-100k ) Profit/loss from business: +$8,044 (reported on 15.5% of returns )Here:
+$8,044State:
+$16,826
(% of AGI for various income ranges: 21.7% for AGIs below $10k , 10.1% for AGIs $10k-25k , 2.2% for AGIs $25k-50k , 1.2% for AGIs $50k-75k , -0.1% for AGIs $75k-100k ) IRA payment deduction: $1,283 (reported on 0.6% of returns )90002:
$1,283California:
$3,192
Total itemized deductions: $15,683 (41% of AGI, reported on 20.3% of returns )Here:
$15,683State:
$28,113
Here:
41.0% of AGIState:
25.3% of AGI
(% of AGI for various income ranges: 7.1% for AGIs below $10k , 7.6% for AGIs $10k-25k , 17.7% for AGIs $25k-50k , 22.4% for AGIs $50k-75k , 22.1% for AGIs $75k-100k , 17.8% for AGIs over 100k ) Charity contributions deductions: $2,264 (6% of AGI, reported on 16.0% of returns )Here:
5.5% of AGIState:
3.3% of AGI
(% of AGI for various income ranges: 0.3% for AGIs below $10k , 0.5% for AGIs $10k-25k , 2.0% for AGIs $25k-50k , 3.1% for AGIs $50k-75k , 3.5% for AGIs $75k-100k , 4.4% for AGIs over 100k ) Total tax: $1,790 (reported on 47.5% of returns )90002:
$1,790State:
$10,761
(% of AGI for various income ranges: 4.2% for AGIs below $10k , 2.7% for AGIs $10k-25k , 3.3% for AGIs $25k-50k , 5.8% for AGIs $50k-75k , 8.9% for AGIs $75k-100k , 14.2% for AGIs over 100k ) Earned income credit: $2,255 (reported on 48.1% of returns )Percentage of individuals using paid preparers for their 2004 taxes: 79.9%(% for various income ranges: 76.3% for AGIs below $10k , 81.8% for AGIs $10k-25k , 80.2% for AGIs $25k-50k , 78.9% for AGIs $50k-75k , 77.8% for AGIs $75k-100k , 70.5% for AGIs over 100k )
Estimated median household income in 2022: This zip code:
$54,012California:
$91,551
Nearest zip codes: 90059 ,
90001 ,
90003 ,
90222 ,
90061 ,
90255 .
Lynwood Zip Code Map
Percentage of family households: This zip code:
59.0%California:
46.8%
Percentage of households with unmarried partners: This zip code:
8.2%California:
48.1%
Likely homosexual households (counted as self-reported same-sex unmarried-partner households)
Lesbian couples: 0.0% of all households Gay men: 0.1% of all households
Household received Food Stamps/SNAP in the past 12 months: 4,893Household did not receive Food Stamps/SNAP in the past 12 months: 9,031
Women who had a birth in the past 12 months: 786 (319 now married , 472 unmarried) Women who did not have a birth in the past 12 months: 13,216 (3,661 now married , 9,621 unmarried)
Housing units in zip code 90002 with a mortgage: 3,997 (202
second mortgage , 150
both second mortgage and home equity loan )
Median monthly owner costs for units with a mortgage: $2,059
Median monthly owner costs for units without a mortgage: $593
Residents with income below the poverty level in 2022:
This zip code:
24.2%Whole state:
12.2%
Residents with income below 50% of the poverty level in 2022:
This zip code:
13.7%Whole state:
6.2%
Median number of rooms in houses and condos: Median number of rooms in apartments: Notable locations in this zip code not listed on our city pages
Click to draw/clear zip code borders Notable locations in zip code 90002: (A) , Watts Branch Los Angeles Public Library (B) , Simon Rodia Community Art Center (C) , One Hundred Second Street Childrens Center (D) , Allen Ambulance Service (E) , City of Los Angeles Fire Department Station 65 (F) . Display/hide their locations on the map
Churches in zip code 90002 include: (A) , Laurel Street Baptist Church (B) , Shiloh Baptist Mission Church (C) , Sweet Home Baptist Church (D) , First Antioch Baptist Church (E) , Grant African Methodist Episcopal Church (F) , Greater New Light Baptist Church (G) , Hays Tabernacle Christian Methodist Episcopal Church (H) , Kingdom Hall of Jehovahs Witnesses (I) . Display/hide their locations on the map
Parks in zip code 90002 include: (1) , Will Rogers Memorial Park (2) , Colonel Leo H Washington Park (3) , Watts Senior Center (4) , Watts Towers State Historical Park (5) . Display/hide their locations on the map
Year house built (houses)
18 2020 or later509 2010 to 2019839 2000 to 2009786 1990 to 1999784 1980 to 1989877 1970 to 19791,610 1960 to 19692,059 1950 to 19592,900 1940 to 19493,248 1939 or earlier
Zip code 90002 household income distribution in 2022 1,000 Less than $10,0001,056 $10,000 to $14,999612 $15,000 to $19,999699 $20,000 to $24,999574 $25,000 to $29,999564 $30,000 to $34,999296 $35,000 to $39,999713 $40,000 to $44,999641 $45,000 to $49,9991,051 $50,000 to $59,9991,353 $60,000 to $74,9991,963 $75,000 to $99,9991,059 $100,000 to $124,999651 $125,000 to $149,999584 $150,000 to $199,999425 $200,000 or moreEstimate of home value of owner-occupied houses/condos in 2022 in zip code 90002 36 Less than $10,00017 $25,000 to $29,9998 $35,000 to $39,99937 $40,000 to $49,99962 $50,000 to $59,99922 $70,000 to $79,99919 $125,000 to $149,9997 $150,000 to $174,99936 $175,000 to $199,99962 $200,000 to $249,999133 $250,000 to $299,999829 $300,000 to $399,9991,589 $400,000 to $499,9991,725 $500,000 to $749,999244 $750,000 to $999,9997 $1,000,000 to $1,499,99990 $2,000,000 or moreRent paid by renters in 2022 in zip code 90002 86 Less than $100156 $100 to $149129 $150 to $199371 $200 to $249117 $250 to $299207 $300 to $349100 $350 to $39984 $400 to $44957 $450 to $499127 $500 to $54953 $550 to $599132 $600 to $64966 $650 to $69963 $700 to $749189 $750 to $799302 $800 to $899465 $900 to $9991,010 $1,000 to $1,2491,201 $1,250 to $1,4991,831 $1,500 to $1,999751 $2,000 to $2,49972 $2,500 to $2,99920 $3,000 to $3,499150 No cash rent
Median gross rent in 2022: $1,445.
Median price asked for vacant for-sale houses and condos in 2022: $693,944.
Estimated median house (or condo) value in 2022 for: White Non-Hispanic householders: $331,609Black or African American householders: $497,804American Indian or Alaska Native householders: $536,427Asian householders: $617,574Native Hawaiian and other Pacific Islander householders: $475,567Some other race householders: $494,293Two or more races householders: $518,871Hispanic or Latino householders: $500,145Estimated median house or condo value in 2022: $502,096
90002:
$502,096California:
$715,900
Lower value quartile - upper value quartile: $420,310 - $650,296
Mean price in 2022: Detached houses: $435,624Here:
$435,624State:
$988,808
Townhouses or other attached units: $396,912Here:
$396,912State:
$838,546
In 3-to-4-unit structures: $694,864Here:
$694,864State:
$824,253
Mobile homes: $873,940Here:
$873,940State:
$184,506
Housing units in structures:
One, detached: 7,973One, attached: 1,589Two: 8423 or 4: 1,0785 to 9: 1,12310 to 19: 29520 to 49: 19050 or more: 621Mobile homes: 95Unemployment : 9.4%
Means of transportation to work in zip code 90002 64.0% 13,744 Drove a car alone14.6% 3,143 Carpooled5.2% 1,117 Bus or trolley bus0.9% 203 Streetcar or trolley car0.2% 35 Subway or elevated0.1% 31 Railroad1.3% 277 Taxi0.1% 25 Motorcycle0.6% 135 Bicycle1.5% 332 Walked2.3% 497 Other means5.6% 1,199 Worked at homeTravel time to work (commute) in zip code 90002 148 Less than 5 minutes487 5 to 9 minutes1,183 10 to 14 minutes1,882 15 to 19 minutes2,960 20 to 24 minutes1,434 25 to 29 minutes3,879 30 to 34 minutes847 35 to 39 minutes1,311 40 to 44 minutes2,373 45 to 59 minutes2,331 60 to 89 minutes839 90 or more minutes
Neighborhoods in zip code 90002: Percentage of zip code residents living and working in this county: 97.4%
Household type by relationship:
Households: 52,667
Male householders: 6,132 (733 living alone ), Female householders: 7,122 (1,281 living alone )4,633 spouses (4,543 opposite-sex spouses ), 1,611 unmarried partners , (1,611 opposite-sex unmarried partners ), 19,345 children (18,341 natural , 220 adopted , 779 stepchildren ), 3,546 grandchildren , 2,110 brothers or sisters , 2,083 parents , 108 foster children , 3,570 other relatives , 1,873 non-relatives In group quarters: 202 (-1 institutionalized population )
Size of family households: 1,804 2-persons , 2,008 3-persons , 2,361 4-persons , 1,650 5-persons , 1,327 6-persons , 1,426 7-or-more-persons
Size of nonfamily households: 2,018 1-person , 426 2-persons , 55 3-persons , 22 4-persons , 15 6-persons
4,308 married couples with children. single-parent households (1,427 men , 4,531 women ).
24.2% of residents of 90002 zip code speak English at home. of residents speak Spanish at home (47% very well, 24% well, 17% not well, 11% not at all ).of residents speak other Indo-European language at home (100% very well ).of residents speak Asian or Pacific Island language at home (47% very well, 33% well, 19% not well ).
Foreign born population: 18,345 (34.8%)
(32.9%
of them are naturalized citizens )
This zip code:
34.8%Whole state:
26.7%
65% Honduras 18% Costa Rica 11% El Salvador 1% Guatemala 1% Mexico 0% Chile 0% Malaysia 1% American 0% Portuguese 0% African 0% Belizean 0% Nigerian 0% Jamaican 0% Italian
Year of entry for the foreign-born population
3,080 2010 or later 3,731 2000 to 2009 4,315 1990 to 1999 7,363 Before 1990
There are
100 Medical Specialists in Zip Code 90002 .
Major facilities with environmental interests located in this zip code:
LA DEPT OF WATER AND POWER 99TH ST WELLS (9800 S WADSWORTH AVE in LOS ANGELES, CA)
STATE MASTER (California - Hazardous Waste Tracking) - HAZARDOU WASTE PROGRAM Large Quantity Generators, more that 1000 kg of hazardous waste/month (Resource Conservation and Recovery Act (tracking hazardous waste))
JORDAN DOWNS (9800 GRAPE ST in LOS ANGELES, CA)
STATE MASTER (California - Hazardous Waste Tracking) - HAZARDOU WASTE PROGRAM HAZARDOUS WASTE BIENNIAL REPORTER (Resource Conservation and Recovery Act (tracking hazardous waste)) Large Quantity Generators, more that 1000 kg of hazardous waste/month (Resource Conservation and Recovery Act (tracking hazardous waste)) Alternative names: CITY OF LA/HOUSING AUTHORITY, JORDAN DOWNS LA HSNG AUTHORITY
HACIENDA VILLAGE LA HSNG AUTHORITY (1515 E 105TH ST in LOS ANGELES, CA)
STATE MASTER (California - Hazardous Waste Tracking) - HAZARDOU WASTE PROGRAM Small Quantity Generators, between 100 kg and 1000 kg of hazardous waste/month (Resource Conservation and Recovery Act (tracking hazardous waste)) - notification Organizations: LA CITY HOUSING AUTHORITY (CONTACT/OWNER)
Alternative names: CITY OF LA/HOUSING AUTHORITY
LA WATTS CULTURAL CENTER (1827 EAST 103RD STREET in LOS ANGELES, CA)
STATE MASTER (California - Hazardous Waste Tracking) - HAZARDOU WASTE PROGRAM Small Quantity Generators, between 100 kg and 1000 kg of hazardous waste/month (Resource Conservation and Recovery Act (tracking hazardous waste)) - notification Organizations: CITY OF LOS ANGELES (CONTACT/OWNER)
Alternative names: CITY OF LA GENERAL SERVICES
LADWP RECEIVING STATION B (9615 S CENTRAL AVE in LOS ANGELES, CA)
STATE MASTER (California - Hazardous Waste Tracking) - HAZARDOU WASTE PROGRAM Small Quantity Generators, between 100 kg and 1000 kg of hazardous waste/month (Resource Conservation and Recovery Act (tracking hazardous waste)) Business NAICS classification: ELECTRIC POWER DISTRIBUTION.Alternative names: LOS ANGELES D W P RECEIVING STATION B
GARCIA CHIROPRACTIC CLINIC (1260 S ATLANTIC BLVD in LOS ANGELES, CA)
STATE MASTER (California - Hazardous Waste Tracking) - HAZARDOU WASTE PROGRAM Small Quantity Generators, between 100 kg and 1000 kg of hazardous waste/month (Resource Conservation and Recovery Act (tracking hazardous waste)) - notification Organizations: RICARDO GARCIA DC (CONTACT/OWNER)
Alternative names: RICARDO GARCIA CHIROPRACTIC CORP
GRIFFITH JOYNER (FLORENCE) ELEMENTARY (1963 E. 103RD ST. in LOS ANGELES, CA)
(National Center for Education Statistics) - STATE ID-6018527 Organizations: LOS ANGELES UNIFIED (SCHOOL DISTRICT)
JORDAN (DAVID STARR) SENIOR HI (2265 E. 103RD ST. in LOS ANGELES, CA)
(National Center for Education Statistics) - STATE ID-1934454 Organizations: LOS ANGELES UNIFIED (SCHOOL DISTRICT)
MARKHAM (EDWIN) MIDDLE (1650 E. 104TH ST. in LOS ANGELES, CA)
(National Center for Education Statistics) - STATE ID-6061527 Organizations: LOS ANGELES UNIFIED (SCHOOL DISTRICT)
NINETY-NINTH STREET ELEMENTARY (9900 S. WADSWORTH AVE. in LOS ANGELES, CA)
(National Center for Education Statistics) - STATE ID-6018345 Organizations: LOS ANGELES UNIFIED (SCHOOL DISTRICT)
NINETY-SECOND STREET ELEMENTAR (9211 GRAPE ST. in LOS ANGELES, CA)
(National Center for Education Statistics) - STATE ID-6018352 Organizations: LOS ANGELES UNIFIED (SCHOOL DISTRICT)
NINETY-SIXTH STREET ELEMENTARY (1471 E. 96TH ST. in LOS ANGELES, CA)
(National Center for Education Statistics) - STATE ID-6018378 Organizations: LOS ANGELES UNIFIED (SCHOOL DISTRICT)
G K DISPOSAL INC (9622 KALMIA ST in LOS ANGELES, CA)
(Resource Conservation and Recovery Act (tracking hazardous waste)) Organizations: MARGARET KADASHIAN (CONTACT/OWNER)
Housing units lacking complete plumbing facilities: 1.9%
Housing units lacking complete kitchen facilities: 3.3%
58.0% Utility gas 25.2% Electricity 14.3% No fuel used 1.6% Bottled, tank, or LP gas 0.6% Other fuel
Population in 1990: 40,629. Population change in the 1990s: +3,955 (+9.7%).
Place of birth for U.S.-born residents:
This state: 31,312Northeast: 131Midwest: 546South: 1,877West: 267
59% of the 90002 zip code residents lived in the same house 5 years ago.
Out of people who lived in different houses, 94% lived in this county.
Out of people who lived in different counties, 50% lived in California.
96% of the 90002 zip code residents lived in the same house 1 year ago.
Out of people who lived in different houses, 88% moved from this county.
Out of people who lived in different houses, 6% moved from different county within same state.
Out of people who lived in different houses, 6% moved from different state.
Out of people who lived in different houses, 6% moved from abroad.
Private vs. public school enrollment:
Students in private schools in grades 1 to 8 (elementary and middle school): 352
Here:
5.1%California:
10.5%
Students in private schools in grades 9 to 12 (high school): 155
Students in private undergraduate colleges: 368
Here:
14.1%California:
15.9%
Occupation by median earnings in the past 12 months ($)
81,032 Computer and mathematical occupations 76,700 Law enforcement workers including supervisors 46,855 Legal occupations 46,182 Health technologists and technicians 46,139 Business and financial operations occupations 42,208 Management occupations
Top industries in this zip code by the number of employees in 2005:
Accommodation and Food Services: Limited-Service Restaurants (20-49 employees: 3 establishments, 10-19 employees: 2 establishments, 1-4 employees: 3 establishments)Wholesale Trade: Recyclable Material Merchant Wholesalers (20-49: 2, 10-19: 2, 1-4: 1)Health Care and Social Assistance: Child Day Care Services (20-49: 1, 10-19: 1, 5-9: 1, 1-4: 6)Wholesale Trade: Metal Service Centers and Other Metal Merchant Wholesalers (20-49: 1, 10-19: 1, 5-9: 1, 1-4: 2)Educational Services: Elementary and Secondary Schools (20-49: 1, 5-9: 1)
People in group quarters in 2010:
72 people in other noninstitutional facilities
42 people in residential treatment centers for adults
18 people in group homes intended for adults
People in group quarters in 2000:
36 people in other noninstitutional group quarters
31 people in halfway houses
20 people in hospitals or wards for drug/alcohol abuse
17 people in homes for the mentally retarded
3 people in religious group quarters
Fatal accident statistics in 2014:
Fatal accident count: 5Vehicles involved in fatal accidents: 18Fatal accidents caused by drunken drivers: 0Fatalities: 5Persons involved in fatal accidents: 19Pedestrians involved in fatal accidents: 3
Fatal accident statistics in 2013:
Fatal accident count: 5Vehicles involved in fatal accidents: 10Fatal accidents caused by drunken drivers: 2Fatalities: 5Persons involved in fatal accidents: 21Pedestrians involved in fatal accidents: 2
Home Mortgage Disclosure Act Aggregated Statistics For Year 2009(Based on 7 full and 16 partial tracts) A) FHA, FSA/RHS & VA B) Conventional C) Refinancings D) Home Improvement Loans E) Loans on Dwellings For 5+ Families F) Non-occupant Loans on G) Loans On Manufactured Number Average Value Number Average Value Number Average Value Number Average Value Number Average Value Number Average Value Number Average Value
LOANS ORIGINATED 293 $170,660 129 $167,379 139 $171,634 14 $92,869 4 $402,530 98 $165,779 1 $187,000 APPLICATIONS APPROVED, NOT ACCEPTED 37 $166,800 29 $164,100 39 $208,094 4 $82,000 0 $0 18 $186,006 0 $0 APPLICATIONS DENIED 71 $177,934 72 $151,255 227 $211,402 41 $122,487 1 $1,303,260 72 $194,818 2 $4,000 APPLICATIONS WITHDRAWN 61 $181,443 24 $140,043 74 $205,730 9 $67,567 1 $710,000 22 $140,442 0 $0 FILES CLOSED FOR INCOMPLETENESS 17 $178,534 17 $166,618 40 $200,364 3 $185,340 2 $475,000 8 $184,906 0 $0
Aggregated Statistics For Year 2008(Based on 7 full and 16 partial tracts) A) FHA, FSA/RHS & VA B) Conventional C) Refinancings D) Home Improvement Loans E) Loans on Dwellings For 5+ Families F) Non-occupant Loans on G) Loans On Manufactured Number Average Value Number Average Value Number Average Value Number Average Value Number Average Value Number Average Value Number Average Value
LOANS ORIGINATED 75 $225,490 137 $252,184 419 $251,844 60 $189,548 8 $509,756 130 $252,966 1 $75,000 APPLICATIONS APPROVED, NOT ACCEPTED 10 $228,328 53 $296,417 179 $266,835 15 $81,295 0 $0 30 $236,933 0 $0 APPLICATIONS DENIED 31 $279,198 178 $284,585 736 $297,475 129 $123,559 6 $1,489,397 146 $254,972 1 $266,760 APPLICATIONS WITHDRAWN 21 $248,674 78 $293,396 181 $276,545 27 $177,689 1 $1,190,000 29 $259,962 0 $0 FILES CLOSED FOR INCOMPLETENESS 10 $263,534 24 $318,878 76 $312,248 6 $76,732 0 $0 12 $252,666 0 $0
Aggregated Statistics For Year 2007(Based on 7 full and 16 partial tracts) A) FHA, FSA/RHS & VA B) Conventional C) Refinancings D) Home Improvement Loans E) Loans on Dwellings For 5+ Families F) Non-occupant Loans on G) Loans On Manufactured Number Average Value Number Average Value Number Average Value Number Average Value Number Average Value Number Average Value Number Average Value
LOANS ORIGINATED 1 $180,890 569 $280,331 1,527 $283,139 254 $220,987 11 $621,217 363 $286,472 3 $54,547 APPLICATIONS APPROVED, NOT ACCEPTED 0 $0 211 $292,132 477 $302,204 50 $207,617 0 $0 79 $328,664 0 $0 APPLICATIONS DENIED 0 $0 626 $318,051 1,571 $320,956 295 $184,469 5 $362,376 308 $306,218 2 $281,880 APPLICATIONS WITHDRAWN 1 $224,430 205 $298,902 560 $298,910 65 $215,223 3 $468,950 87 $291,830 0 $0 FILES CLOSED FOR INCOMPLETENESS 0 $0 61 $339,960 224 $320,548 20 $273,990 0 $0 33 $302,068 0 $0
Aggregated Statistics For Year 2006(Based on 7 full and 16 partial tracts) A) FHA, FSA/RHS & VA B) Conventional C) Refinancings D) Home Improvement Loans E) Loans on Dwellings For 5+ Families F) Non-occupant Loans on G) Loans On Manufactured Number Average Value Number Average Value Number Average Value Number Average Value Number Average Value Number Average Value Number Average Value
LOANS ORIGINATED 1 $345,150 1,559 $228,281 2,557 $270,716 344 $210,071 12 $869,525 435 $263,654 1 $47,000 APPLICATIONS APPROVED, NOT ACCEPTED 0 $0 410 $223,437 604 $279,499 70 $181,145 1 $312,000 123 $243,583 0 $0 APPLICATIONS DENIED 0 $0 983 $237,292 1,493 $282,545 270 $177,047 12 $423,711 221 $270,258 4 $198,535 APPLICATIONS WITHDRAWN 0 $0 419 $235,482 994 $270,127 92 $186,225 1 $203,530 147 $266,015 4 $233,542 FILES CLOSED FOR INCOMPLETENESS 0 $0 97 $246,379 216 $273,474 18 $208,066 2 $466,900 32 $286,542 1 $190,000
Aggregated Statistics For Year 2005(Based on 8 full and 16 partial tracts) A) FHA, FSA/RHS & VA B) Conventional C) Refinancings D) Home Improvement Loans E) Loans on Dwellings For 5+ Families F) Non-occupant Loans on G) Loans On Manufactured Number Average Value Number Average Value Number Average Value Number Average Value Number Average Value Number Average Value Number Average Value
LOANS ORIGINATED 6 $252,695 1,737 $193,224 2,585 $219,165 277 $162,549 22 $517,079 482 $221,493 0 $0 APPLICATIONS APPROVED, NOT ACCEPTED 0 $0 462 $196,682 571 $212,970 50 $110,533 0 $0 134 $206,173 10 $93,881 APPLICATIONS DENIED 2 $303,000 851 $198,815 1,285 $225,506 237 $131,676 7 $687,699 251 $228,747 3 $73,347 APPLICATIONS WITHDRAWN 2 $268,110 548 $199,826 955 $212,093 92 $162,352 2 $342,285 153 $203,381 1 $225,000 FILES CLOSED FOR INCOMPLETENESS 0 $0 87 $219,948 302 $221,281 14 $152,917 1 $329,020 22 $243,355 0 $0
Aggregated Statistics For Year 2004(Based on 8 full and 16 partial tracts) A) FHA, FSA/RHS & VA B) Conventional C) Refinancings D) Home Improvement Loans E) Loans on Dwellings For 5+ Families F) Non-occupant Loans on G) Loans On Manufactured Number Average Value Number Average Value Number Average Value Number Average Value Number Average Value Number Average Value Number Average Value
LOANS ORIGINATED 45 $207,354 1,619 $142,707 2,346 $167,313 251 $136,198 16 $395,232 435 $165,561 0 $0 APPLICATIONS APPROVED, NOT ACCEPTED 10 $224,485 380 $161,744 565 $167,952 57 $156,493 4 $170,132 122 $174,265 0 $0 APPLICATIONS DENIED 16 $208,906 669 $146,062 1,327 $168,505 215 $106,532 4 $515,940 205 $177,871 9 $101,853 APPLICATIONS WITHDRAWN 19 $210,158 344 $151,393 817 $164,986 46 $142,903 7 $99,870 92 $184,523 0 $0 FILES CLOSED FOR INCOMPLETENESS 2 $130,225 47 $146,442 290 $170,640 14 $153,102 0 $0 35 $191,098 0 $0
Aggregated Statistics For Year 2003(Based on 8 full and 16 partial tracts) A) FHA, FSA/RHS & VA B) Conventional C) Refinancings D) Home Improvement Loans E) Loans on Dwellings For 5+ Families F) Non-occupant Loans on Number Average Value Number Average Value Number Average Value Number Average Value Number Average Value Number Average Value
LOANS ORIGINATED 129 $163,383 988 $128,200 1,915 $130,608 57 $46,202 19 $470,759 312 $131,531 APPLICATIONS APPROVED, NOT ACCEPTED 11 $155,313 258 $144,268 438 $132,454 16 $51,670 1 $320,000 129 $140,499 APPLICATIONS DENIED 32 $167,336 466 $131,722 1,222 $132,644 91 $49,736 4 $165,500 198 $131,233 APPLICATIONS WITHDRAWN 34 $171,835 204 $132,843 638 $133,776 19 $71,737 1 $252,000 88 $143,470 FILES CLOSED FOR INCOMPLETENESS 12 $207,962 42 $129,525 133 $132,947 2 $43,470 0 $0 14 $160,419
Aggregated Statistics For Year 2002(Based on 8 full and 12 partial tracts) A) FHA, FSA/RHS & VA B) Conventional C) Refinancings D) Home Improvement Loans E) Loans on Dwellings For 5+ Families F) Non-occupant Loans on Number Average Value Number Average Value Number Average Value Number Average Value Number Average Value Number Average Value
LOANS ORIGINATED 187 $144,025 591 $118,017 856 $117,779 31 $29,383 12 $598,816 208 $112,901 APPLICATIONS APPROVED, NOT ACCEPTED 26 $135,609 127 $121,781 213 $116,654 15 $32,433 0 $0 72 $115,481 APPLICATIONS DENIED 25 $154,991 315 $111,473 718 $121,261 92 $32,658 3 $175,920 98 $124,178 APPLICATIONS WITHDRAWN 65 $148,494 155 $96,655 407 $118,089 13 $35,741 0 $0 50 $97,958 FILES CLOSED FOR INCOMPLETENESS 11 $136,756 43 $128,340 173 $120,888 3 $22,617 0 $0 29 $114,083
Aggregated Statistics For Year 2001(Based on 8 full and 12 partial tracts) A) FHA, FSA/RHS & VA B) Conventional C) Refinancings D) Home Improvement Loans E) Loans on Dwellings For 5+ Families F) Non-occupant Loans on Number Average Value Number Average Value Number Average Value Number Average Value Number Average Value Number Average Value
LOANS ORIGINATED 246 $129,750 375 $102,545 694 $109,900 46 $16,024 5 $258,492 150 $96,691 APPLICATIONS APPROVED, NOT ACCEPTED 37 $128,497 57 $111,335 140 $106,361 12 $39,428 0 $0 27 $98,397 APPLICATIONS DENIED 73 $142,084 167 $110,676 781 $105,954 123 $23,030 2 $155,500 121 $105,255 APPLICATIONS WITHDRAWN 64 $138,593 73 $99,153 414 $114,347 37 $35,157 1 $305,540 48 $108,938 FILES CLOSED FOR INCOMPLETENESS 5 $159,286 21 $107,419 108 $116,275 4 $21,250 2 $795,000 9 $105,020
Aggregated Statistics For Year 2000(Based on 8 full and 12 partial tracts) A) FHA, FSA/RHS & VA B) Conventional C) Refinancings D) Home Improvement Loans E) Loans on Dwellings For 5+ Families F) Non-occupant Loans on Number Average Value Number Average Value Number Average Value Number Average Value Number Average Value Number Average Value
LOANS ORIGINATED 354 $129,993 279 $92,085 351 $97,342 38 $27,790 5 $216,178 124 $85,891 APPLICATIONS APPROVED, NOT ACCEPTED 45 $130,933 44 $108,070 97 $98,344 34 $25,952 0 $0 20 $108,432 APPLICATIONS DENIED 47 $128,386 173 $99,473 573 $93,926 135 $19,399 6 $201,532 96 $95,234 APPLICATIONS WITHDRAWN 50 $127,595 63 $86,130 222 $94,551 20 $26,306 2 $133,040 40 $108,822 FILES CLOSED FOR INCOMPLETENESS 9 $144,129 21 $108,503 147 $111,571 5 $12,578 0 $0 33 $113,230
Aggregated Statistics For Year 1999(Based on 5 full and 9 partial tracts) A) FHA, FSA/RHS & VA B) Conventional C) Refinancings D) Home Improvement Loans E) Loans on Dwellings For 5+ Families F) Non-occupant Loans on Number Average Value Number Average Value Number Average Value Number Average Value Number Average Value Number Average Value
LOANS ORIGINATED 216 $124,497 132 $95,618 409 $97,704 66 $16,447 9 $187,832 113 $89,323 APPLICATIONS APPROVED, NOT ACCEPTED 21 $122,186 18 $120,227 123 $91,995 30 $21,673 1 $63,800 20 $93,726 APPLICATIONS DENIED 48 $137,111 78 $98,457 396 $92,379 92 $18,158 5 $160,924 75 $94,468 APPLICATIONS WITHDRAWN 31 $127,150 46 $98,861 186 $92,128 5 $56,078 3 $172,223 31 $91,724 FILES CLOSED FOR INCOMPLETENESS 15 $123,328 15 $100,609 126 $91,559 1 $15,000 0 $0 18 $102,220
Private Mortgage Insurance Companies Aggregated Statistics For Year 2009(Based on 4 full and 14 partial tracts) A) Conventional B) Refinancings Number Average Value Number Average Value
LOANS ORIGINATED 18 $132,029 1 $139,230 APPLICATIONS APPROVED, NOT ACCEPTED 21 $237,674 3 $300,187 APPLICATIONS DENIED 3 $93,280 0 $0 APPLICATIONS WITHDRAWN 3 $136,607 0 $0 FILES CLOSED FOR INCOMPLETENESS 0 $0 0 $0
Aggregated Statistics For Year 2008(Based on 7 full and 16 partial tracts) A) Conventional B) Refinancings C) Non-occupant Loans on Number Average Value Number Average Value Number Average Value
LOANS ORIGINATED 99 $308,442 21 $342,385 4 $214,855 APPLICATIONS APPROVED, NOT ACCEPTED 121 $356,830 63 $378,450 7 $380,306 APPLICATIONS DENIED 17 $277,831 14 $340,801 7 $301,834 APPLICATIONS WITHDRAWN 10 $324,674 4 $415,492 1 $182,520 FILES CLOSED FOR INCOMPLETENESS 5 $378,600 5 $376,758 3 $341,503
Aggregated Statistics For Year 2007(Based on 7 full and 16 partial tracts) A) Conventional B) Refinancings C) Non-occupant Loans on Number Average Value Number Average Value Number Average Value
LOANS ORIGINATED 61 $387,143 61 $391,405 10 $397,401 APPLICATIONS APPROVED, NOT ACCEPTED 15 $379,055 33 $369,697 1 $242,710 APPLICATIONS DENIED 17 $375,123 4 $419,968 4 $371,095 APPLICATIONS WITHDRAWN 6 $377,093 12 $406,336 5 $380,312 FILES CLOSED FOR INCOMPLETENESS 0 $0 1 $276,890 0 $0
Aggregated Statistics For Year 2006(Based on 7 full and 16 partial tracts) A) Conventional B) Refinancings C) Non-occupant Loans on Number Average Value Number Average Value Number Average Value
LOANS ORIGINATED 20 $381,146 34 $362,604 0 $0 APPLICATIONS APPROVED, NOT ACCEPTED 10 $346,719 10 $344,453 0 $0 APPLICATIONS DENIED 9 $346,226 14 $374,614 2 $349,945 APPLICATIONS WITHDRAWN 1 $558,090 5 $304,658 0 $0 FILES CLOSED FOR INCOMPLETENESS 0 $0 0 $0 0 $0
Aggregated Statistics For Year 2005(Based on 7 full and 16 partial tracts) A) Conventional B) Refinancings C) Non-occupant Loans on Number Average Value Number Average Value Number Average Value
LOANS ORIGINATED 43 $285,067 25 $276,487 5 $288,168 APPLICATIONS APPROVED, NOT ACCEPTED 20 $267,872 13 $260,134 4 $234,615 APPLICATIONS DENIED 1 $369,150 1 $338,720 1 $184,570 APPLICATIONS WITHDRAWN 6 $323,988 1 $327,120 0 $0 FILES CLOSED FOR INCOMPLETENESS 1 $287,680 0 $0 0 $0
Aggregated Statistics For Year 2004(Based on 8 full and 16 partial tracts) A) Conventional B) Refinancings C) Non-occupant Loans on Number Average Value Number Average Value Number Average Value
LOANS ORIGINATED 159 $214,879 31 $181,586 20 $155,952 APPLICATIONS APPROVED, NOT ACCEPTED 48 $190,132 15 $172,202 6 $180,757 APPLICATIONS DENIED 3 $140,247 1 $125,090 1 $60,710 APPLICATIONS WITHDRAWN 6 $201,770 1 $94,890 1 $275,000 FILES CLOSED FOR INCOMPLETENESS 3 $180,000 2 $169,360 2 $169,360
Aggregated Statistics For Year 2003(Based on 8 full and 16 partial tracts) A) Conventional B) Refinancings C) Non-occupant Loans on Number Average Value Number Average Value Number Average Value
LOANS ORIGINATED 340 $169,739 77 $155,918 13 $152,441 APPLICATIONS APPROVED, NOT ACCEPTED 47 $150,843 35 $145,193 2 $86,145 APPLICATIONS DENIED 8 $184,672 9 $156,027 2 $228,000 APPLICATIONS WITHDRAWN 5 $171,568 13 $148,612 2 $171,935 FILES CLOSED FOR INCOMPLETENESS 0 $0 0 $0 0 $0
Aggregated Statistics For Year 2002(Based on 8 full and 12 partial tracts) A) Conventional B) Refinancings C) Non-occupant Loans on Number Average Value Number Average Value Number Average Value
LOANS ORIGINATED 276 $146,419 49 $137,682 12 $113,199 APPLICATIONS APPROVED, NOT ACCEPTED 55 $135,230 39 $133,014 7 $129,561 APPLICATIONS DENIED 7 $148,087 8 $142,710 0 $0 APPLICATIONS WITHDRAWN 15 $137,166 9 $139,676 0 $0 FILES CLOSED FOR INCOMPLETENESS 2 $120,555 1 $115,370 0 $0
Aggregated Statistics For Year 2001(Based on 8 full and 12 partial tracts) A) Conventional B) Refinancings C) Non-occupant Loans on Number Average Value Number Average Value Number Average Value
LOANS ORIGINATED 187 $126,180 49 $131,802 4 $136,305 APPLICATIONS APPROVED, NOT ACCEPTED 38 $131,272 11 $128,749 1 $114,300 APPLICATIONS DENIED 8 $136,432 3 $107,823 3 $133,153 APPLICATIONS WITHDRAWN 7 $123,333 2 $118,000 0 $0 FILES CLOSED FOR INCOMPLETENESS 1 $113,660 0 $0 0 $0
Aggregated Statistics For Year 2000(Based on 8 full and 12 partial tracts) A) Conventional B) Refinancings C) Non-occupant Loans on Number Average Value Number Average Value Number Average Value
LOANS ORIGINATED 101 $114,809 54 $114,434 24 $108,424 APPLICATIONS APPROVED, NOT ACCEPTED 11 $107,609 7 $137,746 2 $91,260 APPLICATIONS DENIED 10 $120,044 3 $151,313 2 $77,000 APPLICATIONS WITHDRAWN 4 $96,632 0 $0 0 $0 FILES CLOSED FOR INCOMPLETENESS 0 $0 0 $0 0 $0
Aggregated Statistics For Year 1999(Based on 4 full and 9 partial tracts) A) Conventional B) Refinancings C) Non-occupant Loans on Number Average Value Number Average Value Number Average Value
LOANS ORIGINATED 33 $114,299 33 $115,605 1 $107,000 APPLICATIONS APPROVED, NOT ACCEPTED 4 $113,640 8 $127,258 0 $0 APPLICATIONS DENIED 4 $107,368 3 $142,130 0 $0 APPLICATIONS WITHDRAWN 3 $133,733 1 $177,000 1 $177,000 FILES CLOSED FOR INCOMPLETENESS 0 $0 1 $122,360 0 $0
2005 - 2018 National Fire Incident Reporting System (NFIRS) incidents See full 2006 National Fire Incident Reporting System statistics for zip code 90002, California
Most common first names in zip code 90002 among deceased individuals Name Count Lived (average)
Willie 178 71.7 years James 177 68.4 years John 167 72.7 years Mary 148 74.9 years Robert 117 66.6 years William 111 75.0 years George 82 72.3 years Henry 77 71.4 years Charles 66 66.1 years Annie 64 77.8 years
Most common last names in zip code 90002 among deceased individuals Last name Count Lived (average)
Johnson 191 71.9 years Williams 182 69.0 years Jones 126 71.8 years Smith 123 70.4 years Brown 98 66.1 years Thomas 88 71.5 years Jackson 87 72.0 years Harris 79 70.2 years Davis 76 71.5 years Taylor 72 71.0 years
Businesses in zip code 90002
Name Count Name Count
AutoZone 1 Payless 1 Burger King 1 Popeyes 1 CVS 1 RadioShack 1 Kroger 1 Subway 2 McDonald's 1 T-Mobile 1

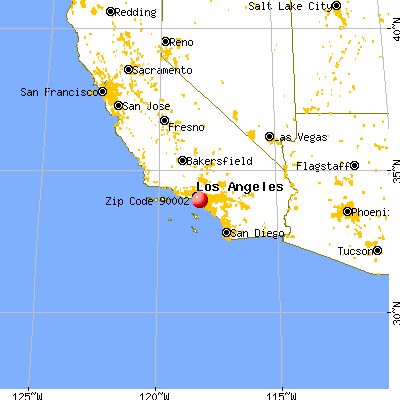


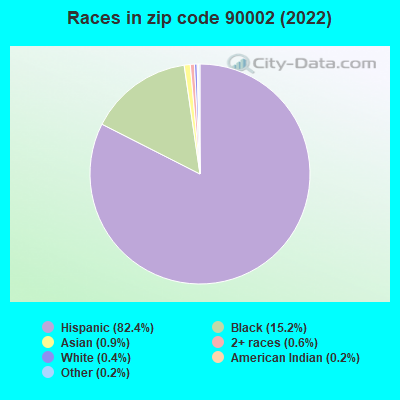


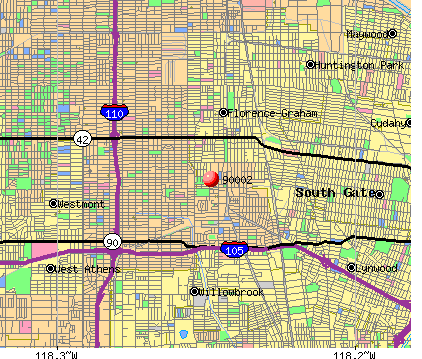 Nearest zip codes: 90059, 90001, 90003, 90222, 90061, 90255.
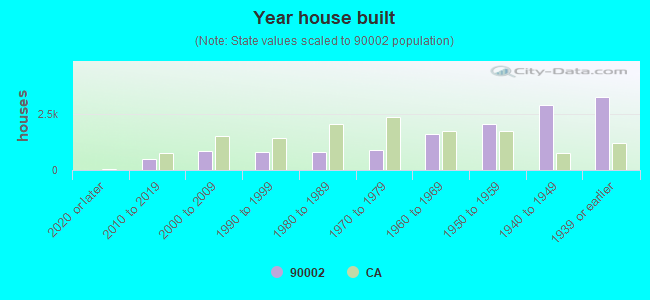

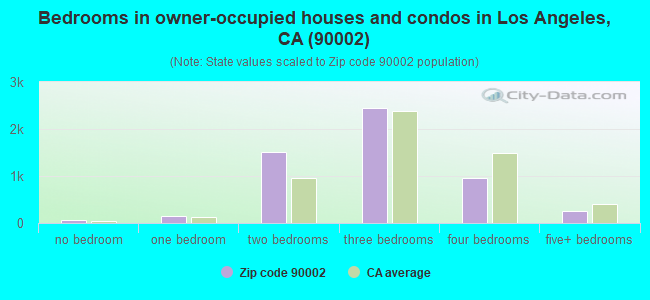
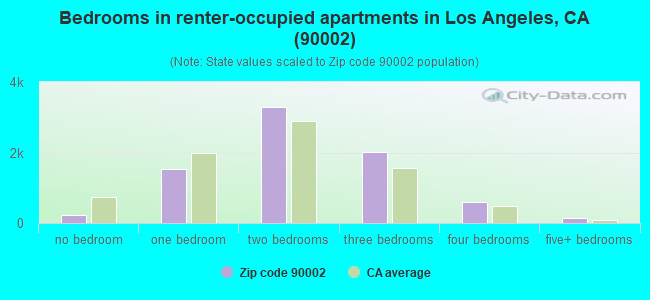
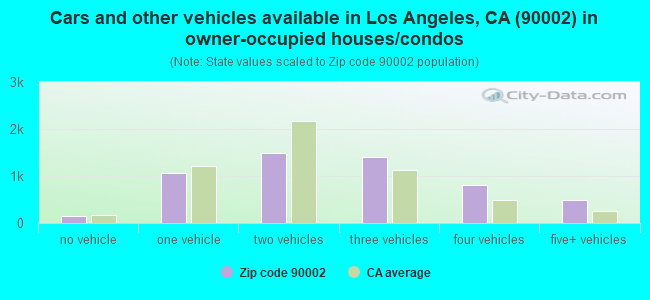
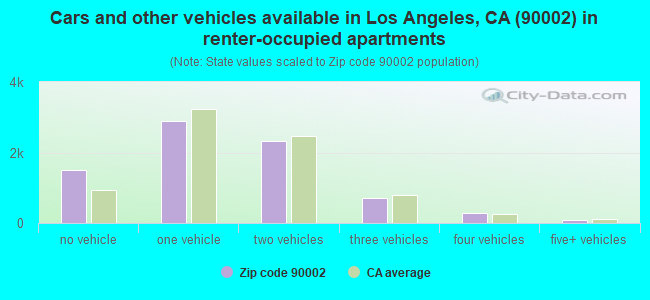


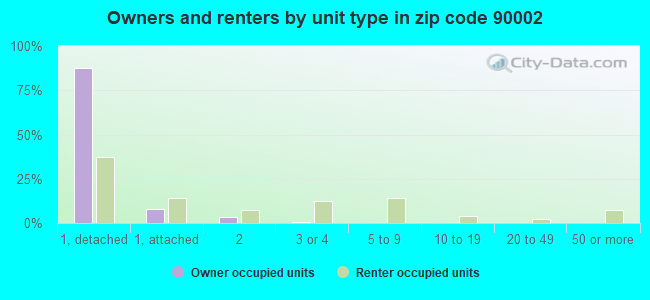
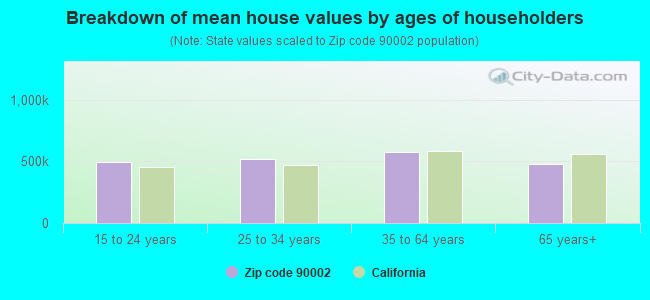


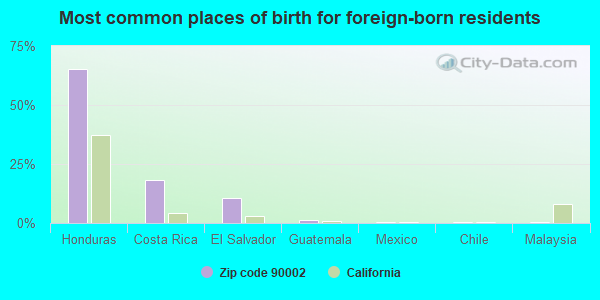
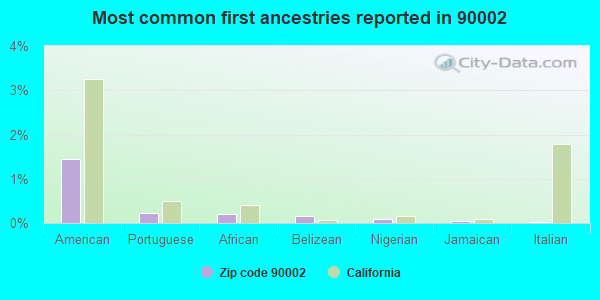
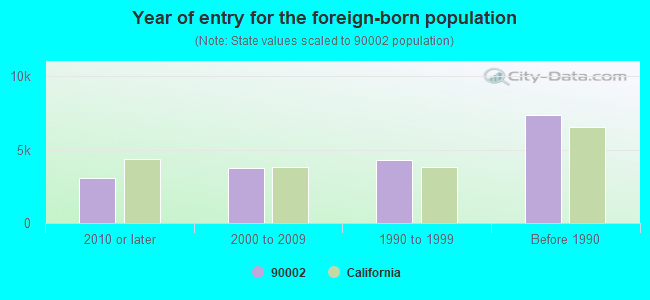
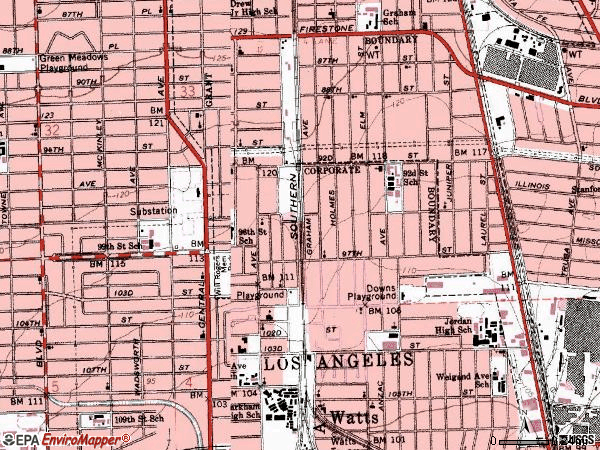


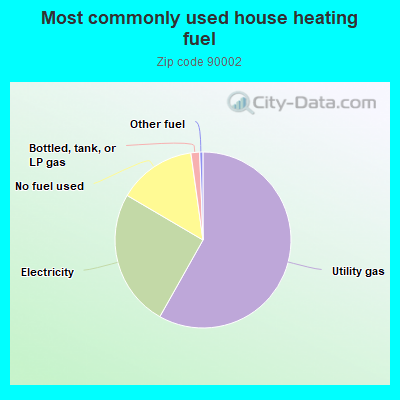
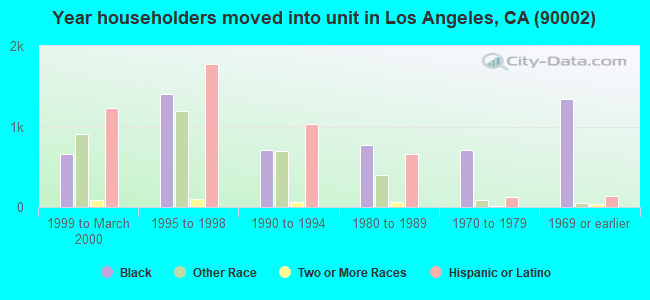
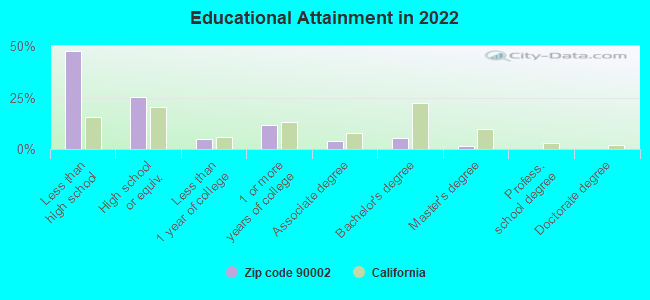
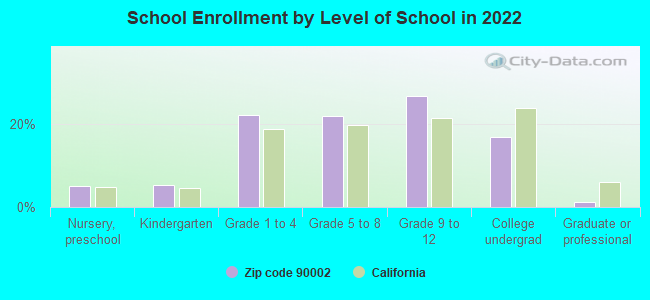
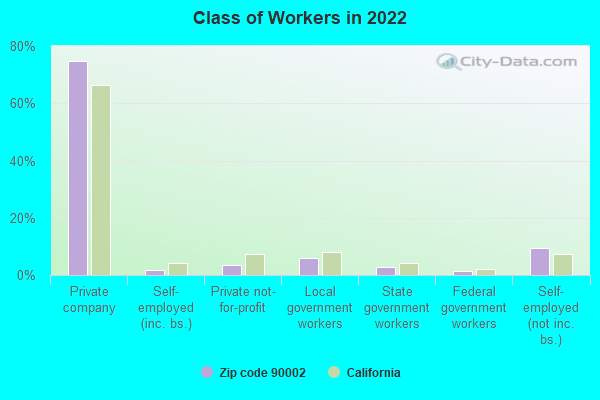
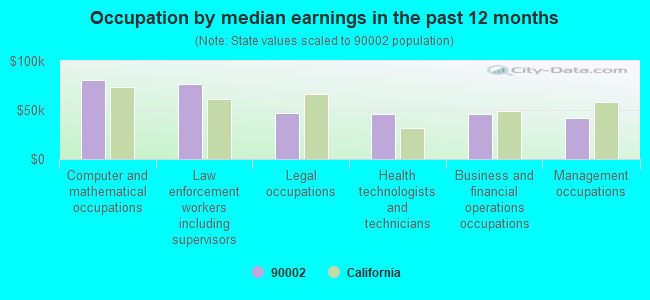
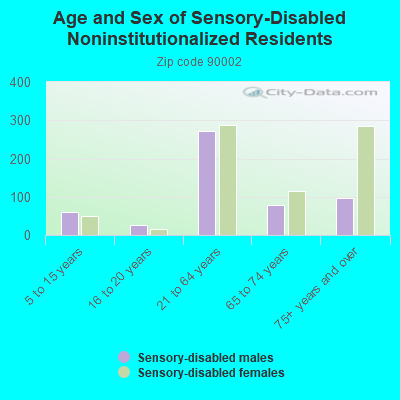
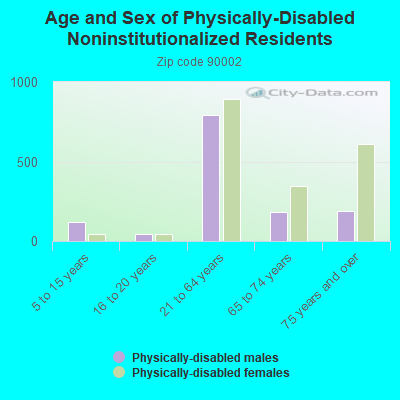
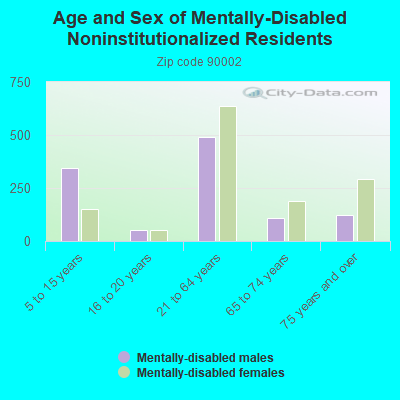
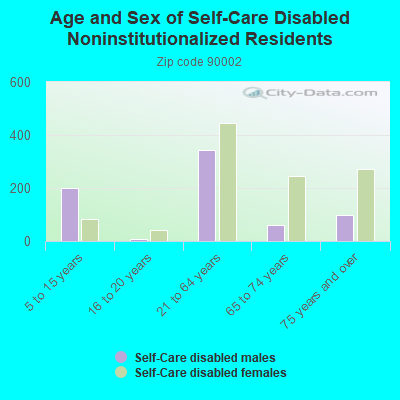
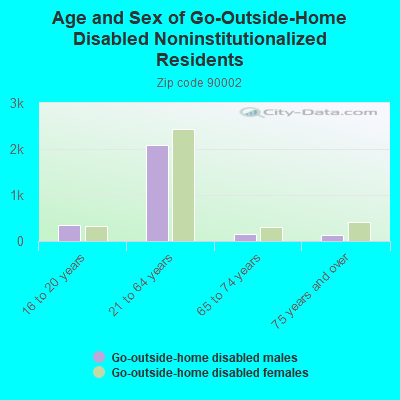
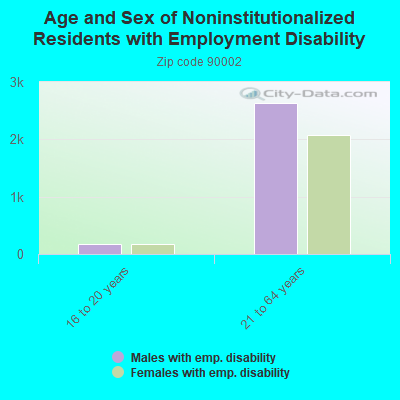
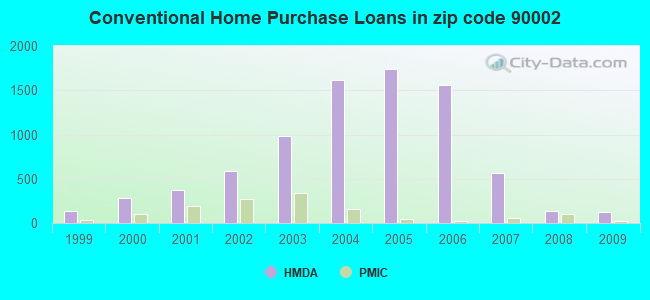
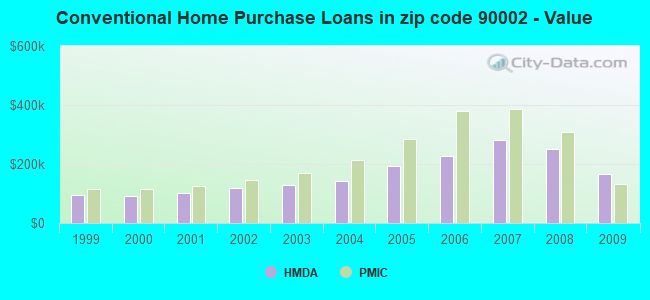
 According to the data from the years 2005 - 2018 the average number of fires per year is 160. The highest number of fire incidents - 276 took place in 2005, and the least - 84 in 2013. The data has a decreasing trend.
 When looking into fire subcategories, the most incidents belonged to: Structure Fires (44.3%), and Outside Fires (27.6%).