Estimated zip code population in 2022: 74,401 Zip code population in 2010: 66,266 Zip code population in 2000: 58,187
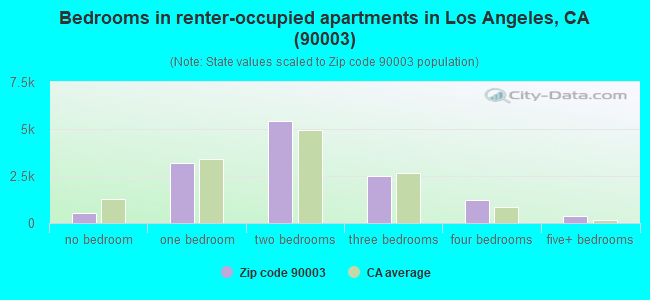
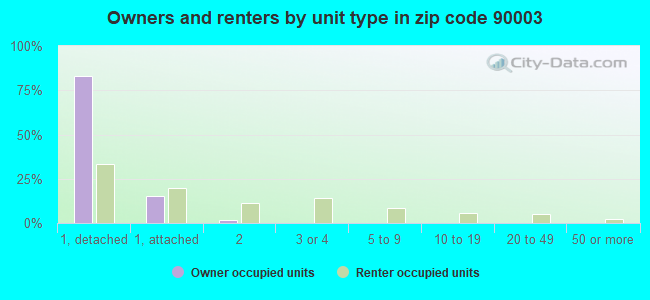
Houses and condos: 18,965 Renter-occupied apartments: 13,260
% of renters here:
73%
State:
44%
March 2022 cost of living index in zip code 90003: 136.3 (high, U.S. average is 100)
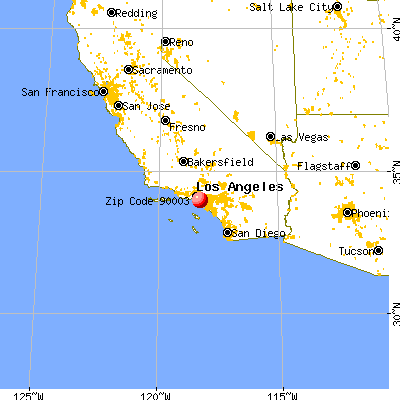
Land area: 3.6 sq. mi. Water area: 0.0 sq. mi.
Population density: 20,951 people per square mile
(very high).
OSM Map
General Map
Google Map
MSN Map
OSM Map
General Map
Google Map
MSN Map
OSM Map
General Map
Google Map
MSN Map
OSM Map
General Map
Google Map
MSN Map
Please wait while loading the map...
Real estate property taxes paid for housing units in 2022:
This zip code:
0.5% ($2,894)
California:
0.7% ($4,831)
Median real estate property taxes paid for housing units with mortgages in 2022: $3,158 (0.6%) Median real estate property taxes paid for housing units with no mortgage in 2022: $2,365 (0.5%)
Averages for the 2020 tax year for zip code 90003, filed in 2021:
Average Adjusted Gross Income (AGI) in 2020: $30,684 (Individual Income Tax Returns)
Here:
$30,684
State:
$95,910
Salary/wage: $30,366 (reported on 81.4% of returns)
Here:
$30,366
State:
$77,331
(% of AGI for various income ranges: 1203.2% for AGIs below $25k, 3946.6% for AGIs $25k-50k, 7598.7% for AGIs $50k-75k, 11290.1% for AGIs $75k-100k, 17392.7% for AGIs $100k-200k)
Taxable interest for individuals: $239 (reported on 11.4% of returns)
This zip code:
$239
California:
$2,294
(% of AGI for various income ranges: 1.0% for AGIs below $25k, 2.2% for AGIs $25k-50k, 6.7% for AGIs $50k-75k, 21.6% for AGIs $75k-100k, 33.9% for AGIs $100k-200k)
Ordinary dividends: $328 (reported on 1.4% of returns)
Here:
$328
State:
$10,949
(% of AGI for various income ranges: 0.2% for AGIs below $25k, 0.3% for AGIs $25k-50k, 1.4% for AGIs $50k-75k, 4.6% for AGIs $75k-100k, 7.9% for AGIs $100k-200k)
Net capital gain/loss in AGI: +$6,840 (reported on 2.3% of returns)
Here:
+$6,840
State:
+$49,306
(% of AGI for various income ranges: 4.5% for AGIs $50k-75k, 35.9% for AGIs $75k-100k, 1407.0% for AGIs $100k-200k)
Profit/loss from business: +$7,502 (reported on 23.9% of returns)
Here:
+$7,502
State:
+$15,671
(% of AGI for various income ranges: 328.7% for AGIs below $25k, 152.8% for AGIs $25k-50k, 230.4% for AGIs $50k-75k, 233.7% for AGIs $75k-100k, 563.3% for AGIs $100k-200k)
Taxable individual retirement arrangement distribution: $7,107 (reported on 0.5% of returns)
90003:
$7,107
California:
$23,505
(% of AGI for various income ranges: 1.9% for AGIs below $25k, 3.4% for AGIs $25k-50k, 8.6% for AGIs $50k-75k, 56.6% for AGIs $75k-100k)
Total itemized deductions: $24,966 (reported on 4.4% of returns)
Here:
$24,966
State:
$39,517
(% of AGI for various income ranges: 26.1% for AGIs below $25k, 122.3% for AGIs $25k-50k, 412.5% for AGIs $50k-75k, 824.7% for AGIs $75k-100k, 1790.6% for AGIs $100k-200k)
Charity contributions: $5,151 (reported on 3.2% of returns)
Here:
$5,151
State:
$12,598
(% of AGI for various income ranges: 1.9% for AGIs below $25k, 16.3% for AGIs $25k-50k, 60.3% for AGIs $50k-75k, 130.0% for AGIs $75k-100k, 383.3% for AGIs $100k-200k)
Taxes paid: $6,944 (reported on 4.4% of returns)
90003:
$6,944
State:
$8,807
(% of AGI for various income ranges: 6.3% for AGIs below $25k, 32.4% for AGIs $25k-50k, 119.0% for AGIs $50k-75k, 256.6% for AGIs $75k-100k, 483.3% for AGIs $100k-200k)
Earned income credit: $2,648 (reported on 32.8% of returns)
Here:
$2,648
State:
$2,074
(% of AGI for various income ranges: 179.3% for AGIs below $25k, 99.9% for AGIs $25k-50k, 1.5% for AGIs $50k-75k)
Percentage of individuals using paid preparers for their 2020 taxes: 88.6%
Here:
89%
State:
92%
(% for various income ranges: 85.8% for AGIs below $25k, 90.8% for AGIs $25k-50k, 91.8% for AGIs $50k-75k, 90.3% for AGIs $75k-100k, 92.7% for AGIs $100k-200k, 100.0% for AGIs over 200k)
Averages for the 2012 tax year for zip code 90003, filed in 2013:
Average Adjusted Gross Income (AGI) in 2012: $23,433 (Individual Income Tax Returns)
Here:
$23,433
State:
$72,726
Salary/wage: $24,098 (reported on 82.3% of returns)
Here:
$24,098
State:
$59,079
(% of AGI for various income ranges: 75.8% for AGIs below $25k, 91.8% for AGIs $25k-50k, 91.2% for AGIs $50k-75k, 86.7% for AGIs $75k-100k, 72.6% for AGIs $100k-200k)
Taxable interest for individuals: $210 (reported on 10.1% of returns)
This zip code:
$210
California:
$2,146
(% of AGI for various income ranges: 0.1% for AGIs $50k-75k, 0.2% for AGIs $75k-100k)
Ordinary dividends: $504 (reported on 0.9% of returns)
Here:
$504
State:
$9,308
(% of AGI for various income ranges: )
Net capital gain/loss in AGI: +$112 (reported on 0.6% of returns)
Here:
+$112
State:
+$30,460
(% of AGI for various income ranges: )
Profit/loss from business: +$9,339 (reported on 24.2% of returns)
Here:
+$9,339
State:
+$17,064
(% of AGI for various income ranges: 20.5% for AGIs below $25k, 3.4% for AGIs $25k-50k, 1.3% for AGIs $50k-75k, 2.3% for AGIs $75k-100k)
Taxable individual retirement arrangement distribution: $10,606 (reported on 0.7% of returns)
90003:
$10,606
California:
$19,557
(% of AGI for various income ranges: 0.1% for AGIs below $25k, 0.3% for AGIs $25k-50k, 0.9% for AGIs $50k-75k)
Total itemized deductions: $17,632 (40% of AGI, reported on 13.4% of returns)
Here:
$17,632
State:
$34,004
Here:
39.7% of AGI
State:
22.7% of AGI
(% of AGI for various income ranges: 4.3% for AGIs below $25k, 11.4% for AGIs $25k-50k, 17.5% for AGIs $50k-75k, 19.5% for AGIs $75k-100k, 17.9% for AGIs $100k-200k)
Charity contributions: $2,576 (reported on 9.1% of returns)
Here:
$2,576
State:
$4,659
(% of AGI for various income ranges: 0.2% for AGIs below $25k, 1.0% for AGIs $25k-50k, 2.0% for AGIs $50k-75k, 2.9% for AGIs $75k-100k, 2.2% for AGIs $100k-200k)
Taxes paid: $4,062 (reported on 13.3% of returns)
90003:
$4,062
State:
$14,448
(% of AGI for various income ranges: 0.8% for AGIs below $25k, 2.3% for AGIs $25k-50k, 4.4% for AGIs $50k-75k, 5.3% for AGIs $75k-100k, 5.9% for AGIs $100k-200k)
Earned income credit: $3,018 (reported on 44.7% of returns)
Here:
$3,018
State:
$2,286
(% of AGI for various income ranges: 12.5% for AGIs below $25k, 2.2% for AGIs $25k-50k)
Percentage of individuals using paid preparers for their 2012 taxes: 76.9%
Here:
77%
State:
64%
(% for various income ranges: 75.5% for AGIs below $25k, 80.1% for AGIs $25k-50k, 79.1% for AGIs $50k-75k, 72.7% for AGIs $75k-100k, 71.4% for AGIs $100k-200k)
Averages for the 2004 tax year for zip code 90003, filed in 2005:
Average Adjusted Gross Income (AGI) in 2004: $21,366 (Individual Income Tax Returns)
Here:
$21,366
State:
$58,600
Salary/wage: $21,481 (reported on 87.5% of returns)
Here:
$21,481
State:
$49,455
(% of AGI for various income ranges: 77.5% for AGIs below $10k, 86.8% for AGIs $10k-25k, 93.2% for AGIs $25k-50k, 92.0% for AGIs $50k-75k, 87.7% for AGIs $75k-100k, 37.5% for AGIs over 100k)
Taxable interest for individuals: $369 (reported on 14.2% of returns)
This zip code:
$369
California:
$2,365
(% of AGI for various income ranges: 0.5% for AGIs below $10k, 0.2% for AGIs $10k-25k, 0.1% for AGIs $25k-50k, 0.2% for AGIs $50k-75k, 0.6% for AGIs $75k-100k, 2.2% for AGIs over 100k)
Taxable dividends: $472 (reported on 1.3% of returns)
Here:
$472
State:
$4,746
(% of AGI for various income ranges: 0.1% for AGIs below $10k, 0.0% for AGIs $10k-25k, 0.0% for AGIs $25k-50k, 0.0% for AGIs $50k-75k, 0.0% for AGIs $75k-100k, 0.2% for AGIs over 100k)
Net capital gain/loss: +$14,219 (reported on 1.1% of returns)
Here:
+$14,219
State:
+$23,418
(% of AGI for various income ranges: -0.1% for AGIs below $10k, 0.0% for AGIs $10k-25k, 0.1% for AGIs $25k-50k, 1.0% for AGIs $50k-75k, 3.8% for AGIs $75k-100k, 15.3% for AGIs over 100k)
Profit/loss from business: +$8,037 (reported on 17.0% of returns)
Here:
+$8,037
State:
+$16,826
(% of AGI for various income ranges: 25.1% for AGIs below $10k, 9.9% for AGIs $10k-25k, 2.7% for AGIs $25k-50k, 0.9% for AGIs $50k-75k, -0.4% for AGIs $75k-100k, 1.9% for AGIs over 100k)
IRA payment deduction: $1,528 (reported on 0.6% of returns)
90003:
$1,528
California:
$3,192
Total itemized deductions: $17,151 (45% of AGI, reported on 17.5% of returns)
Here:
$17,151
State:
$28,113
Here:
45.0% of AGI
State:
25.3% of AGI
(% of AGI for various income ranges: 5.3% for AGIs below $10k, 8.9% for AGIs $10k-25k, 17.2% for AGIs $25k-50k, 19.3% for AGIs $50k-75k, 21.1% for AGIs $75k-100k, 24.8% for AGIs over 100k)
Charity contributions deductions: $2,284 (6% of AGI, reported on 13.5% of returns)
Here:
$2,284
State:
$3,923
Here:
5.6% of AGI
State:
3.3% of AGI
(% of AGI for various income ranges: 0.2% for AGIs below $10k, 0.6% for AGIs $10k-25k, 1.8% for AGIs $25k-50k, 3.0% for AGIs $50k-75k, 3.7% for AGIs $75k-100k, 2.1% for AGIs over 100k)
Total tax: $1,824 (reported on 48.0% of returns)
90003:
$1,824
State:
$10,761
(% of AGI for various income ranges: 4.4% for AGIs below $10k, 2.7% for AGIs $10k-25k, 3.5% for AGIs $25k-50k, 6.1% for AGIs $50k-75k, 8.4% for AGIs $75k-100k, 16.0% for AGIs over 100k)
Earned income credit: $2,264 (reported on 48.0% of returns)
Here:
$2,264
State:
$1,763
Percentage of individuals using paid preparers for their 2004 taxes: 80.6%
Here:
81%
State:
66%
(% for various income ranges: 77.4% for AGIs below $10k, 82.2% for AGIs $10k-25k, 81.2% for AGIs $25k-50k, 78.5% for AGIs $50k-75k, 76.1% for AGIs $75k-100k, 73.4% for AGIs over 100k)
Likely homosexual households (counted as self-reported same-sex unmarried-partner households)
Lesbian couples: 0.1% of all households
Gay men: 0.2% of all households
Household received Food Stamps/SNAP in the past 12 months: 6,926 Household did not receive Food Stamps/SNAP in the past 12 months: 12,305
Women who had a birth in the past 12 months: 1,029 (534 now married, 498 unmarried) Women who did not have a birth in the past 12 months: 18,788 (6,068 now married, 12,776 unmarried)
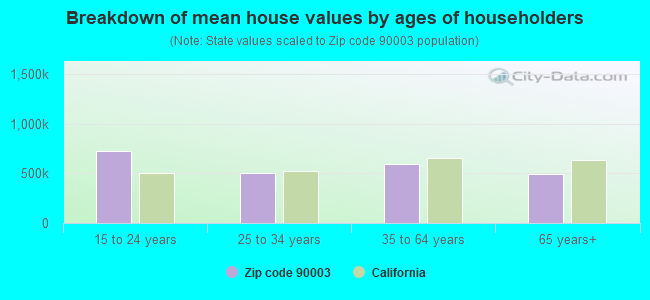
Housing units in zip code 90003 with a mortgage: 3,678 (111 second mortgage, 10 home equity loan, 69 both second mortgage and home equity loan) Houses without a mortgage: 10
Median monthly owner costs for units with a mortgage: $2,130 Median monthly owner costs for units without a mortgage: $606
Residents with income below the poverty level in 2022:
This zip code:
27.1%
Whole state:
12.2%
Residents with income below 50% of the poverty level in 2022:
This zip code:
15.4%
Whole state:
6.2%
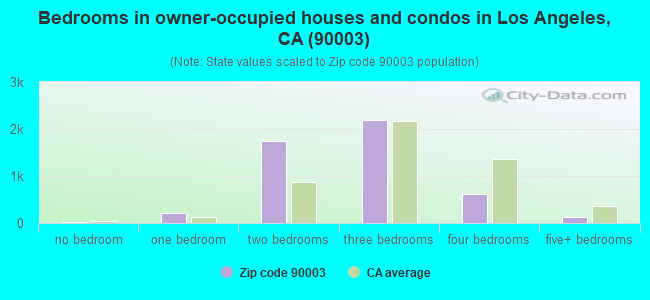
Median number of rooms in houses and condos:
Here:
5.2
State:
6.0
Median number of rooms in apartments:
Here:
4.4
State:
3.9
Notable locations in this zip code not listed on our city pages
Notable locations in zip code 90003: Ascot Branch Los Angeles Public Library (A), Seventyseventh Street Community Police Station (B), City of Los Angeles Fire Department Station 33 (C). Display/hide their locations on the map
Churches in zip code 90003 include: Saint Columbkille Catholic Church (A), Baptist Indian Bible Center (B), Grace Church (C), Greater Cornerstone Baptist Church (D), Hamilton Methodist Church (E), Hope Community Church (F), Saint Stephen Baptist Church (G), Bright Star Baptist Church (H), Faith Lutheran Church (I). Display/hide their locations on the map
7,314 married couples with children.
8,707 single-parent households (2,899 men, 5,808 women).
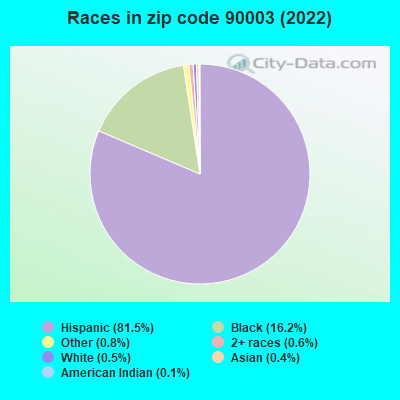
22.7% of residents of 90003 zip code speak English at home.
76.6% of residents speak Spanish at home (44% very well, 23% well, 21% not well, 12% not at all).
0.3% of residents speak other Indo-European language at home (49% very well, 51% well).
0.2% of residents speak Asian or Pacific Island language at home (45% very well, 37% well, 13% not well, 5% not at all).
0.1% of residents speak other language at home (26% very well, 74% well).
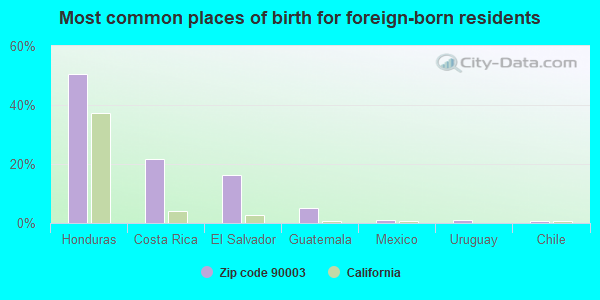
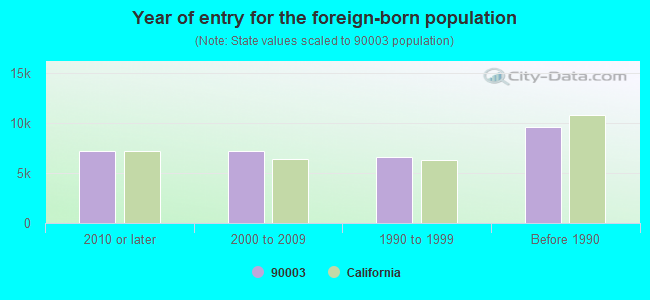
Foreign born population: 29,679 (39.9%) (25.9% of them are naturalized citizens)
Major facilities with environmental interests located in this zip code:
LAUSD SOUTH PARK ELEM SCHOOL (8510 TOWNE AVE in LOS ANGELES, CA)
STATE MASTER (California - Hazardous Waste Tracking) - HAZARDOU WASTE PROGRAM Large Quantity Generators, more that 1000 kg of hazardous waste/month (Resource Conservation and Recovery Act (tracking hazardous waste)) Alternative names: SOUTH PARK ELEMENTARY
EQUILON ENTERPRISES (9915 S BROADWAY in LOS ANGELES, CA) . Federal Facility
STATE MASTER (California - Hazardous Waste Tracking) - HAZARDOU WASTE PROGRAM Large Quantity Generators, more that 1000 kg of hazardous waste/month (Resource Conservation and Recovery Act (tracking hazardous waste)) Organizations: SHELL OIL PRODUCTS US (CONTACT/OPERATOR)
, EQUILON ENTERPRISES LLC DBA SHELL OIL PR (CONTACT/OWNER)
Alternative names: TEXACO SVC STA
JOHN BOYD DESIGNS INCORPORATED (8730 CROCKER STREET in LOS ANGELES, CA)
AIR MAJOR (AIRS/AFS) STATE MASTER (California - Hazardous Waste Tracking) - HAZARDOU WASTE PROGRAM CRITERIA AND HAZARDOUS AIR POLLUTANT INVENTORY (Inventory of air pollution sources) Small Quantity Generators, between 100 kg and 1000 kg of hazardous waste/month (Resource Conservation and Recovery Act (tracking hazardous waste)) TRI REPORTER (Tracking of toxic chemicals releasing facilities) Business SIC classification: WOOD HOUSEHOLD FURNITURE, EXCEPT UPHOLSTERED; WOOD OFFICE FURNITURE Business NAICS classification: NONUPHOLSTERED WOOD HOUSEHOLD FURNITURE MANUFACTURING. Alternative names: SALEM HOUSE
LA COUNTY H HUMPHREY COMPREHENS (5850 SOUTH MAIN STREET in LOS ANGELES, CA)
STATE MASTER (California - Hazardous Waste Tracking) - HAZARDOU WASTE PROGRAM CRITERIA AND HAZARDOUS AIR POLLUTANT INVENTORY (Inventory of air pollution sources) Small Quantity Generators, between 100 kg and 1000 kg of hazardous waste/month (Resource Conservation and Recovery Act (tracking hazardous waste)) - notification Business SIC classification: OFFICES AND CLINICS OF DOCTORS OF MEDICINE Business NAICS classification: OFFICES OF PHYSICIANS, MENTAL HEALTH SPECIALISTS. Organizations: LOS ANGELES COUNTY (CONTACT/OWNER)
Alternative names: DEPT OF HEALTH SRVCS H H HUMPHREY CHC, H H HUMPHREY COMP HEALTH CTR, LA CO., H. HUMPHREY COMPREHENS
G N E CLEANERS (255 E CENTURY BLVD in LOS ANGELES, CA)
STATE MASTER (California - Hazardous Waste Tracking) - HAZARDOU WASTE PROGRAM Small Quantity Generators, between 100 kg and 1000 kg of hazardous waste/month (Resource Conservation and Recovery Act (tracking hazardous waste)) - notification Organizations: GAYLORD WILLIAMS (CONTACT/OWNER)
Alternative names: G&E CLEANERS & LAUNDRY
LAUSD FREMONT HIGH SCHOOL (7676 S SAN PEDRO in LOS ANGELES, CA)
STATE MASTER (California - Hazardous Waste Tracking) - HAZARDOU WASTE PROGRAM Small Quantity Generators, between 100 kg and 1000 kg of hazardous waste/month (Resource Conservation and Recovery Act (tracking hazardous waste)) - notification Alternative names: FREMONT (JOHN C.) SENIOR HIGH, LAUSD/ FREMONT HS
LA USD 66TH STREET ELEM (405 E 67TH ST in LOS ANGELES, CA)
STATE MASTER (California - Hazardous Waste Tracking) - HAZARDOU WASTE PROGRAM Small Quantity Generators, between 100 kg and 1000 kg of hazardous waste/month (Resource Conservation and Recovery Act (tracking hazardous waste)) - notification Alternative names: LAUSD/SIXTY-SIX ST ELEM
LOGO PRINT WORKS (160 W SLAUSON AVE in LOS ANGELES, CA)
STATE MASTER (California - Hazardous Waste Tracking) - HAZARDOU WASTE PROGRAM Small Quantity Generators, between 100 kg and 1000 kg of hazardous waste/month (Resource Conservation and Recovery Act (tracking hazardous waste)) Business NAICS classification: COMMERCIAL SCREEN PRINTING. Organizations: FELECIANO JUAREZ (CONTACT/OPERATOR)
Alternative names: LOGO PRINTWORKS
A D D INTERIOR SYSTEMS INC (6500 AVALON BLVD in LOS ANGELES, CA)
STATE MASTER (California - Hazardous Waste Tracking) - HAZARDOU WASTE PROGRAM Small Quantity Generators, between 100 kg and 1000 kg of hazardous waste/month (Resource Conservation and Recovery Act (tracking hazardous waste)) - notification Organizations: WILLIAM LEE (CONTACT/OWNER)
Alternative names: KI-ADD SPECIALIZED SUPPORT TECH INC
MONICA CLEANERS (6221 1/2 S FIGUEROA ST in LOS ANGELES, CA)
STATE MASTER (California - Hazardous Waste Tracking) - HAZARDOU WASTE PROGRAM Small Quantity Generators, between 100 kg and 1000 kg of hazardous waste/month (Resource Conservation and Recovery Act (tracking hazardous waste)) - notification Alternative names: MONICAS CLEANERS
HOPE (JOHN) CONTINUATION (7840 TOWNE AVE. in LOS ANGELES, CA)
(National Center for Education Statistics) - STATE ID-1931971 Organizations: LOS ANGELES UNIFIED (SCHOOL DISTRICT)
NINETY-THIRD STREET ELEMENTARY (330 E. 93RD ST. in LOS ANGELES, CA)
(National Center for Education Statistics) - STATE ID-6018386 Organizations: LOS ANGELES UNIFIED (SCHOOL DISTRICT)
CHEVRON STATION 202033 (428 W FLORENCE AVE in LOS ANGELES, CA)
Small Quantity Generators, between 100 kg and 1000 kg of hazardous waste/month (Resource Conservation and Recovery Act (tracking hazardous waste)) - notification HAZARDOUS WASTE BIENNIAL REPORTER (Resource Conservation and Recovery Act (tracking hazardous waste)) Large Quantity Generators, more that 1000 kg of hazardous waste/month (Resource Conservation and Recovery Act (tracking hazardous waste)) Organizations: CHEVRON PRODUCTS CO (CONTACT/OWNER)
Alternative names: CHEVRON 202033, CHEVRON STATION NO 202033
Housing units lacking complete plumbing facilities: 1.4% Housing units lacking complete kitchen facilities: 3.0%
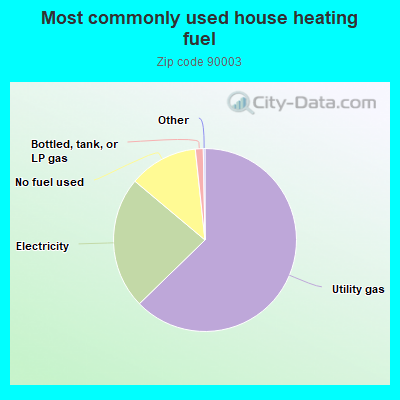
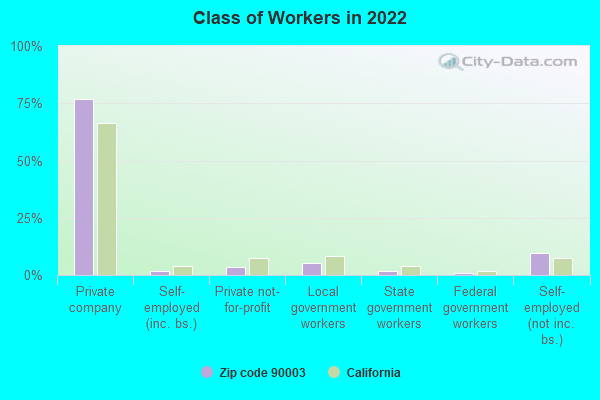
64.7%Utility gas
20.9%Electricity
13.4%No fuel used
0.8%Bottled, tank, or LP gas
Population in 1990: 53,938. Population change in the 1990s: +4,249 (+7.9%).
Place of birth for U.S.-born residents:
This state: 40,107
Northeast: 556
Midwest: 615
South: 2,500
West: 334
57% of the 90003 zip code residents lived in the same house 5 years ago. Out of people who lived in different houses, 94% lived in this county. Out of people who lived in different counties, 50% lived in California.
96% of the 90003 zip code residents lived in the same house 1 year ago. Out of people who lived in different houses, 88% moved from this county. Out of people who lived in different houses, 4% moved from different county within same state. Out of people who lived in different houses, 9% moved from different state. Out of people who lived in different houses, 4% moved from abroad.
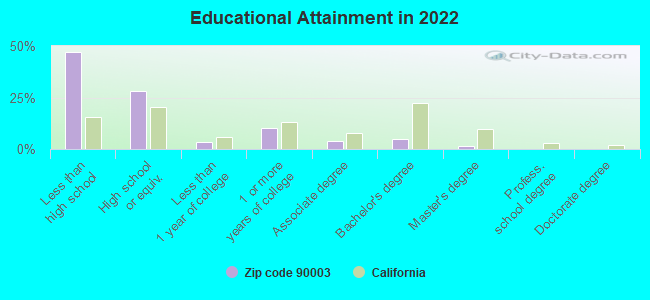
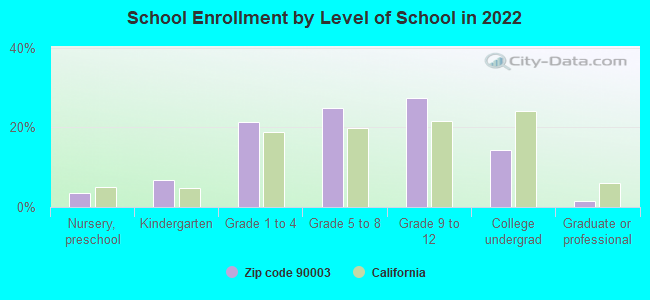
Private vs. public school enrollment:
Students in private schools in grades 1 to 8 (elementary and middle school): 516
Here:
5.1%
California:
10.5%
Students in private schools in grades 9 to 12 (high school): 219
Here:
3.7%
California:
8.5%
Students in private undergraduate colleges: 372
Here:
11.9%
California:
15.9%
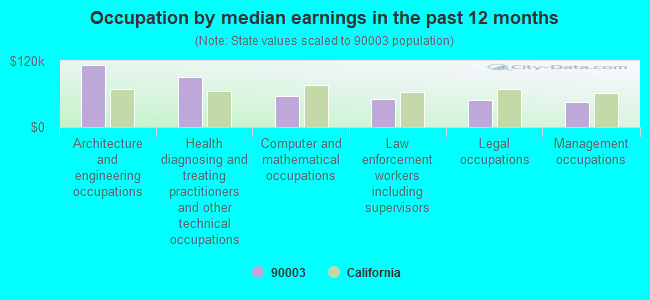
Occupation by median earnings in the past 12 months ($)
112,503Architecture and engineering occupations
91,002Health diagnosing and treating practitioners and other technical occupations
57,008Computer and mathematical occupations
51,435Law enforcement workers including supervisors
49,191Legal occupations
45,893Management occupations
Companies with federal contracts located in this zip code:
NASSEEM INC (430 E 107TH ST in LOS ANGELES, CA; small business) : $109,204 in 12 contractsfrom 2004 to 2005
Contracts for Torque Converters and Speed Changers, Fuses, Arresters, Absorbers, and Protectors, Water Purification Equipment, Valves, Powered, and moreby Defense Logistics Agency Signed by year:2000: $0; 2001: $0; 2002: $0; 2003: $0; 2004: $84,852; 2005: $24,352; 2006: $0.
Biggest contracts:
$16,500 with Defense Logistics Agency for Torque Converters and Speed Changers. Signed on 2004-12-07. Completion date: 2005-01-06.
$13,130 with Defense Logistics Agency for Fuses, Arresters, Absorbers, and Protectors. Signed on 2004-10-08. Completion date: 2005-06-06.
$13,130, same as above.Signed on 2004-10-08. Completion date: 2005-06-06.
$11,499 with Defense Logistics Agency for Water Purification Equipment. Signed on 2004-12-03. Completion date: 2005-01-19.
CHRISTIAN CANDY CO (8001 S MAIN ST in LOS ANGELES, CA; small business) : $22,377 in 6 contractsfrom 2004 to 2006
Contracts for Food Items For Resale by Defense Commissary Agency Signed by year:2000: $0; 2001: $0; 2002: $0; 2003: $0; 2004: $5,960; 2005: $11,042; 2006: $5,375.
Biggest contracts:
$5,960 with Defense Commissary Agency for Food Items For Resale. Signed on 2004-10-01. Completion date: 2005-02-28.
$5,375, same as above.Signed on 2006-01-01. Completion date: 2006-03-31.
$4,493, same as above.Signed on 2005-04-01. Completion date: 2005-08-31.
$4,097, same as above.Signed on 2005-10-01. Completion date: 2005-12-31.
Top industries in this zip code by the number of employees in 2005:
2005 - 2018 National Fire Incident Reporting System (NFIRS) incidents
According to the data from the years 2005 - 2018 the average number of fires per year is 299. The highest number of fire incidents - 355 took place in 2007, and the least - 215 in 2016. The data has a decreasing trend.
When looking into fire subcategories, the most incidents belonged to: Structure Fires (36.3%), and Outside Fires (31.5%).
Fire incident types reported to NFIRS in Zip Code 90003


 Nearest zip codes: 90044, 90001, 90002, 90047, 90037, 90061.
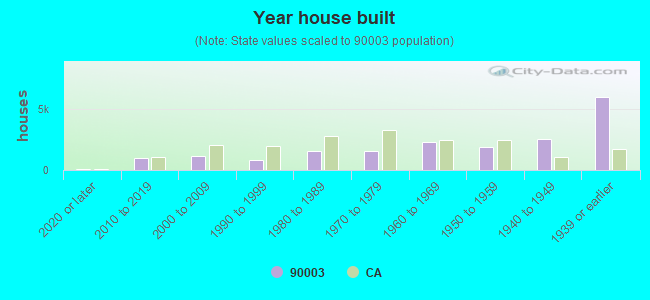


 According to the data from the years 2005 - 2018 the average number of fires per year is 299. The highest number of fire incidents - 355 took place in 2007, and the least - 215 in 2016. The data has a decreasing trend.
 When looking into fire subcategories, the most incidents belonged to: Structure Fires (36.3%), and Outside Fires (31.5%).