Estimated zip code population in 2022: 98,168 Zip code population in 2010: 89,779 Zip code population in 2000: 87,366
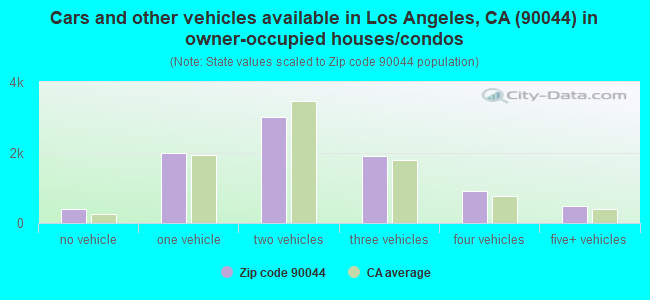
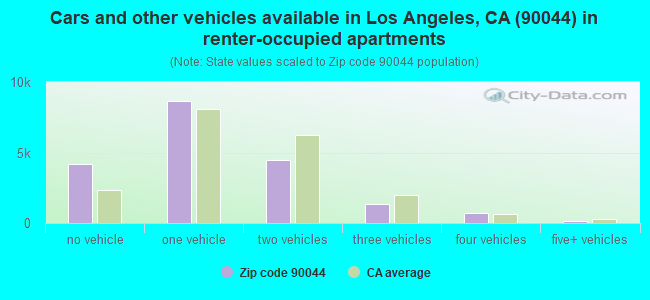
Houses and condos: 29,436 Renter-occupied apartments: 19,547
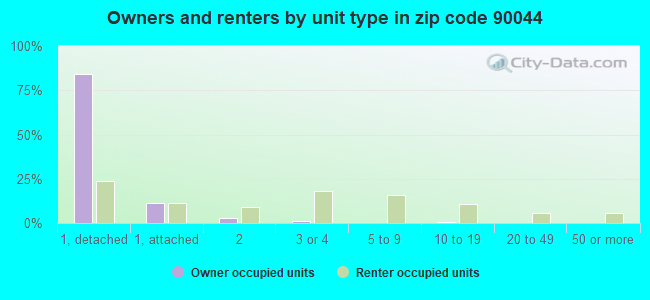
% of renters here:
69%
State:
44%
March 2022 cost of living index in zip code 90044: 139.3 (high, U.S. average is 100)
Land area: 5.1 sq. mi. Water area: 0.0 sq. mi.
Population density: 19,112 people per square mile
(very high).
OSM Map
General Map
Google Map
MSN Map
OSM Map
General Map
Google Map
MSN Map
OSM Map
General Map
Google Map
MSN Map
OSM Map
General Map
Google Map
MSN Map
Please wait while loading the map...
Real estate property taxes paid for housing units in 2022:
This zip code:
0.6% ($3,338)
California:
0.7% ($4,831)
Median real estate property taxes paid for housing units with mortgages in 2022: $3,639 (0.6%) Median real estate property taxes paid for housing units with no mortgage in 2022: $2,553 (0.5%)
Averages for the 2020 tax year for zip code 90044, filed in 2021:
Average Adjusted Gross Income (AGI) in 2020: $33,359 (Individual Income Tax Returns)
Here:
$33,359
State:
$95,910
Salary/wage: $33,028 (reported on 80.9% of returns)
Here:
$33,028
State:
$77,331
(% of AGI for various income ranges: 1213.5% for AGIs below $25k, 4004.5% for AGIs $25k-50k, 7589.7% for AGIs $50k-75k, 11329.3% for AGIs $75k-100k, 18037.7% for AGIs $100k-200k)
Taxable interest for individuals: $193 (reported on 14.0% of returns)
This zip code:
$193
California:
$2,294
(% of AGI for various income ranges: 1.7% for AGIs below $25k, 2.6% for AGIs $25k-50k, 7.2% for AGIs $50k-75k, 12.9% for AGIs $75k-100k, 29.9% for AGIs $100k-200k)
Ordinary dividends: $643 (reported on 2.2% of returns)
Here:
$643
State:
$10,949
(% of AGI for various income ranges: 0.7% for AGIs below $25k, 1.0% for AGIs $25k-50k, 4.5% for AGIs $50k-75k, 9.1% for AGIs $75k-100k, 17.4% for AGIs $100k-200k)
Net capital gain/loss in AGI: +$2,842 (reported on 3.0% of returns)
Here:
+$2,842
State:
+$49,306
(% of AGI for various income ranges: 6.5% for AGIs $50k-75k, 42.3% for AGIs $75k-100k, 207.2% for AGIs $100k-200k)
Profit/loss from business: +$6,039 (reported on 24.3% of returns)
Here:
+$6,039
State:
+$15,671
(% of AGI for various income ranges: 273.5% for AGIs below $25k, 111.2% for AGIs $25k-50k, 180.8% for AGIs $50k-75k, 256.6% for AGIs $75k-100k, 345.5% for AGIs $100k-200k)
Taxable individual retirement arrangement distribution: $10,934 (reported on 1.1% of returns)
90044:
$10,934
California:
$23,505
(% of AGI for various income ranges: 5.6% for AGIs below $25k, 9.5% for AGIs $25k-50k, 32.8% for AGIs $50k-75k, 77.7% for AGIs $75k-100k, 160.3% for AGIs $100k-200k)
Total itemized deductions: $26,161 (reported on 6.9% of returns)
Here:
$26,161
State:
$39,517
(% of AGI for various income ranges: 33.7% for AGIs below $25k, 159.5% for AGIs $25k-50k, 602.5% for AGIs $50k-75k, 1293.7% for AGIs $75k-100k, 2340.3% for AGIs $100k-200k)
Charity contributions: $5,815 (reported on 5.5% of returns)
Here:
$5,815
State:
$12,598
(% of AGI for various income ranges: 3.5% for AGIs below $25k, 21.9% for AGIs $25k-50k, 101.7% for AGIs $50k-75k, 230.3% for AGIs $75k-100k, 508.4% for AGIs $100k-200k)
Taxes paid: $7,121 (reported on 6.9% of returns)
90044:
$7,121
State:
$8,807
(% of AGI for various income ranges: 7.2% for AGIs below $25k, 39.7% for AGIs $25k-50k, 158.7% for AGIs $50k-75k, 375.4% for AGIs $75k-100k, 716.4% for AGIs $100k-200k)
Earned income credit: $2,539 (reported on 31.5% of returns)
Here:
$2,539
State:
$2,074
(% of AGI for various income ranges: 170.6% for AGIs below $25k, 99.9% for AGIs $25k-50k, 1.3% for AGIs $50k-75k)
Percentage of individuals using paid preparers for their 2020 taxes: 88.9%
Here:
89%
State:
92%
(% for various income ranges: 87.1% for AGIs below $25k, 90.3% for AGIs $25k-50k, 91.1% for AGIs $50k-75k, 90.2% for AGIs $75k-100k, 91.4% for AGIs $100k-200k, 85.7% for AGIs over 200k)
Averages for the 2012 tax year for zip code 90044, filed in 2013:
Average Adjusted Gross Income (AGI) in 2012: $25,693 (Individual Income Tax Returns)
Here:
$25,693
State:
$72,726
Salary/wage: $25,803 (reported on 81.9% of returns)
Here:
$25,803
State:
$59,079
(% of AGI for various income ranges: 75.2% for AGIs below $25k, 89.5% for AGIs $25k-50k, 86.6% for AGIs $50k-75k, 79.5% for AGIs $75k-100k, 71.6% for AGIs $100k-200k)
Taxable interest for individuals: $177 (reported on 12.1% of returns)
This zip code:
$177
California:
$2,146
(% of AGI for various income ranges: 0.1% for AGIs $75k-100k, 0.1% for AGIs $100k-200k)
Ordinary dividends: $870 (reported on 1.6% of returns)
Here:
$870
State:
$9,308
(% of AGI for various income ranges: 0.1% for AGIs $75k-100k, 0.1% for AGIs $100k-200k)
Net capital gain/loss in AGI: +$365 (reported on 1.1% of returns)
Here:
+$365
State:
+$30,460
(% of AGI for various income ranges: 0.2% for AGIs $50k-75k)
Profit/loss from business: +$8,560 (reported on 23.2% of returns)
Here:
+$8,560
State:
+$17,064
(% of AGI for various income ranges: 19.0% for AGIs below $25k, 2.8% for AGIs $25k-50k, 1.0% for AGIs $50k-75k, 1.2% for AGIs $75k-100k, 0.9% for AGIs $100k-200k)
Taxable individual retirement arrangement distribution: $11,104 (reported on 1.4% of returns)
90044:
$11,104
California:
$19,557
(% of AGI for various income ranges: 0.3% for AGIs below $25k, 0.4% for AGIs $25k-50k, 0.9% for AGIs $50k-75k, 0.9% for AGIs $75k-100k, 2.1% for AGIs $100k-200k)
Total itemized deductions: $19,210 (38% of AGI, reported on 17.2% of returns)
Here:
$19,210
State:
$34,004
Here:
38.3% of AGI
State:
22.7% of AGI
(% of AGI for various income ranges: 5.3% for AGIs below $25k, 12.6% for AGIs $25k-50k, 20.4% for AGIs $50k-75k, 21.4% for AGIs $75k-100k, 23.5% for AGIs $100k-200k)
Charity contributions: $3,267 (reported on 13.1% of returns)
Here:
$3,267
State:
$4,659
(% of AGI for various income ranges: 0.4% for AGIs below $25k, 1.5% for AGIs $25k-50k, 2.9% for AGIs $50k-75k, 3.3% for AGIs $75k-100k, 3.7% for AGIs $100k-200k)
Taxes paid: $4,547 (reported on 17.1% of returns)
90044:
$4,547
State:
$14,448
(% of AGI for various income ranges: 1.2% for AGIs below $25k, 2.6% for AGIs $25k-50k, 4.9% for AGIs $50k-75k, 5.8% for AGIs $75k-100k, 7.1% for AGIs $100k-200k)
Earned income credit: $2,906 (reported on 43.3% of returns)
Here:
$2,906
State:
$2,286
(% of AGI for various income ranges: 12.5% for AGIs below $25k, 2.0% for AGIs $25k-50k)
Percentage of individuals using paid preparers for their 2012 taxes: 74.7%
Here:
75%
State:
64%
(% for various income ranges: 73.9% for AGIs below $25k, 76.6% for AGIs $25k-50k, 74.6% for AGIs $50k-75k, 72.8% for AGIs $75k-100k, 76.2% for AGIs $100k-200k)
Averages for the 2004 tax year for zip code 90044, filed in 2005:
Average Adjusted Gross Income (AGI) in 2004: $23,452 (Individual Income Tax Returns)
Here:
$23,452
State:
$58,600
Salary/wage: $23,330 (reported on 86.5% of returns)
Here:
$23,330
State:
$49,455
(% of AGI for various income ranges: 78.1% for AGIs below $10k, 84.8% for AGIs $10k-25k, 91.3% for AGIs $25k-50k, 88.0% for AGIs $50k-75k, 81.7% for AGIs $75k-100k, 59.0% for AGIs over 100k)
Taxable interest for individuals: $390 (reported on 16.8% of returns)
This zip code:
$390
California:
$2,365
(% of AGI for various income ranges: 0.5% for AGIs below $10k, 0.2% for AGIs $10k-25k, 0.3% for AGIs $25k-50k, 0.4% for AGIs $50k-75k, 0.3% for AGIs $75k-100k, 0.6% for AGIs over 100k)
Taxable dividends: $531 (reported on 2.6% of returns)
Here:
$531
State:
$4,746
(% of AGI for various income ranges: 0.1% for AGIs below $10k, 0.0% for AGIs $10k-25k, 0.0% for AGIs $25k-50k, 0.1% for AGIs $50k-75k, 0.1% for AGIs $75k-100k, 0.2% for AGIs over 100k)
Net capital gain/loss: +$12,482 (reported on 1.9% of returns)
Here:
+$12,482
State:
+$23,418
(% of AGI for various income ranges: -0.1% for AGIs below $10k, 0.0% for AGIs $10k-25k, 0.0% for AGIs $25k-50k, 0.9% for AGIs $50k-75k, 1.5% for AGIs $75k-100k, 16.4% for AGIs over 100k)
Profit/loss from business: +$6,724 (reported on 17.1% of returns)
Here:
+$6,724
State:
+$16,826
(% of AGI for various income ranges: 22.8% for AGIs below $10k, 9.3% for AGIs $10k-25k, 1.7% for AGIs $25k-50k, 1.0% for AGIs $50k-75k, 0.3% for AGIs $75k-100k, 0.2% for AGIs over 100k)
IRA payment deduction: $1,590 (reported on 0.8% of returns)
90044:
$1,590
California:
$3,192
(% of AGI for various income ranges: 0.0% for AGIs below $10k, 0.0% for AGIs $10k-25k, 0.1% for AGIs $25k-50k, 0.1% for AGIs $50k-75k)
Total itemized deductions: $18,932 (44% of AGI, reported on 21.5% of returns)
Here:
$18,932
State:
$28,113
Here:
43.7% of AGI
State:
25.3% of AGI
(% of AGI for various income ranges: 6.8% for AGIs below $10k, 10.9% for AGIs $10k-25k, 19.1% for AGIs $25k-50k, 24.2% for AGIs $50k-75k, 25.8% for AGIs $75k-100k, 25.0% for AGIs over 100k)
Charity contributions deductions: $3,116 (7% of AGI, reported on 17.8% of returns)
Here:
$3,116
State:
$3,923
Here:
6.7% of AGI
State:
3.3% of AGI
(% of AGI for various income ranges: 0.3% for AGIs below $10k, 0.8% for AGIs $10k-25k, 2.5% for AGIs $25k-50k, 4.2% for AGIs $50k-75k, 4.9% for AGIs $75k-100k, 4.4% for AGIs over 100k)
Total tax: $2,120 (reported on 52.3% of returns)
90044:
$2,120
State:
$10,761
(% of AGI for various income ranges: 4.6% for AGIs below $10k, 2.8% for AGIs $10k-25k, 3.9% for AGIs $25k-50k, 6.9% for AGIs $50k-75k, 9.2% for AGIs $75k-100k, 12.3% for AGIs over 100k)
Earned income credit: $2,203 (reported on 45.4% of returns)
Here:
$2,203
State:
$1,763
Percentage of individuals using paid preparers for their 2004 taxes: 78.0%
Here:
78%
State:
66%
(% for various income ranges: 73.9% for AGIs below $10k, 80.4% for AGIs $10k-25k, 78.0% for AGIs $25k-50k, 76.6% for AGIs $50k-75k, 77.3% for AGIs $75k-100k, 78.9% for AGIs over 100k)
Likely homosexual households (counted as self-reported same-sex unmarried-partner households)
Lesbian couples: 0.1% of all households
Gay men: 0.1% of all households
Household received Food Stamps/SNAP in the past 12 months: 9,979 Household did not receive Food Stamps/SNAP in the past 12 months: 19,606
Women who had a birth in the past 12 months: 1,421 (639 now married, 789 unmarried) Women who did not have a birth in the past 12 months: 25,139 (7,161 now married, 18,094 unmarried)
Housing units in zip code 90044 with a mortgage: 6,431 (408 second mortgage, 23 home equity loan, 311 both second mortgage and home equity loan) Houses without a mortgage: 56
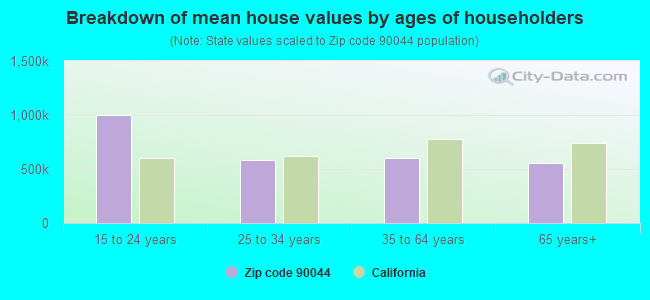
Median monthly owner costs for units with a mortgage: $2,399 Median monthly owner costs for units without a mortgage: $633
Residents with income below the poverty level in 2022:
This zip code:
26.8%
Whole state:
12.2%
Residents with income below 50% of the poverty level in 2022:
This zip code:
16.3%
Whole state:
6.2%
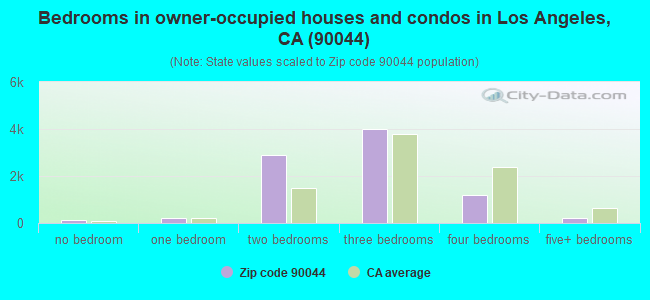
Median number of rooms in houses and condos:
Here:
5.5
State:
6.0
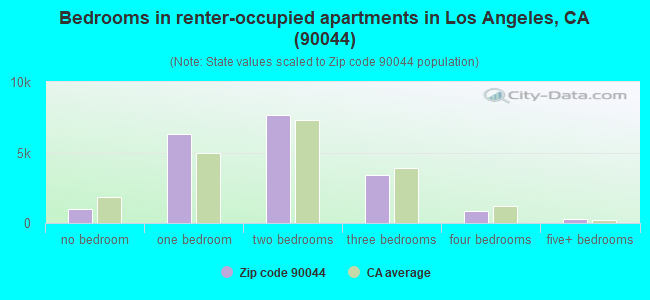
Median number of rooms in apartments:
Here:
4.2
State:
3.9
Notable locations in this zip code not listed on our city pages
Notable locations in zip code 90044: Electrical Sub-Station Number 41 (A), Woodcrest Branch County of Los Angeles Public Library (B), Mark Twain Branch Los Angeles Public Library (C), John Muir Branch Los Angeles Public Library (D), Sunnyside Baptist Youth Center (E), City of Los Angeles Fire Department Station 57 (F). Display/hide their locations on the map
Churches in zip code 90044 include: Greater New Jericho Baptist Church (A), Normandie Avenue Seventh Day Adventist Church (B), Blessed And Highly Favored Church (C), Athens Baptist Church (D), Antioch Christian Church (E), Bethany Apostolic Church (F), Bethel Methodist Church (G), Faithful Central Missionary Baptist Church (H), Florence Avenue United Presbyterian Church (I). Display/hide their locations on the map
9,595 married couples with children.
11,685 single-parent households (2,889 men, 8,796 women).
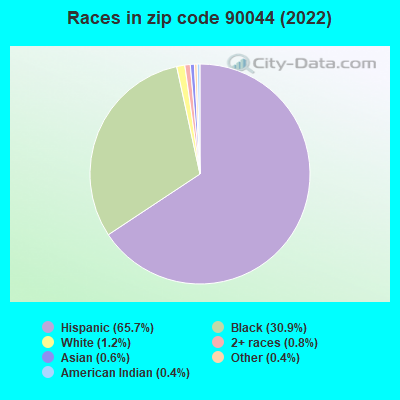
37.3% of residents of 90044 zip code speak English at home.
61.0% of residents speak Spanish at home (42% very well, 27% well, 21% not well, 11% not at all).
0.5% of residents speak other Indo-European language at home (75% very well, 16% well, 5% not well, 3% not at all).
0.8% of residents speak Asian or Pacific Island language at home (52% very well, 30% well, 17% not well, 1% not at all).
0.3% of residents speak other language at home (71% very well, 29% well).
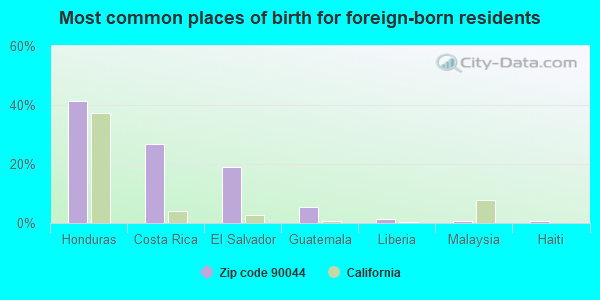
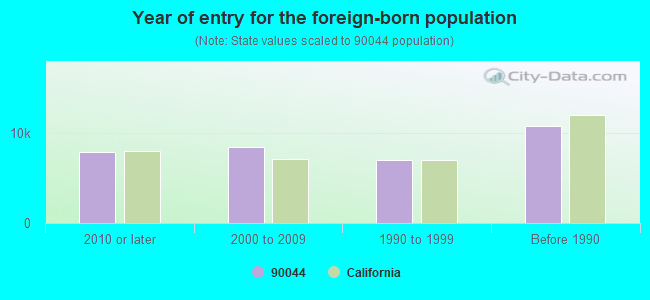
Foreign born population: 33,029 (33.6%) (30.2% of them are naturalized citizens)
Major facilities with environmental interests located in this zip code:
LA USD 68TH ST ELEM (612 W 68TH ST in LOS ANGELES, CA)
STATE MASTER (California - Hazardous Waste Tracking) - HAZARDOU WASTE PROGRAM COMPLIANCE ACTIVITY (Tracking inspections of insecticide, fungicide, and rodenticide, and toxic substances) Large Quantity Generators, more that 1000 kg of hazardous waste/month (Resource Conservation and Recovery Act (tracking hazardous waste)) Organizations: LAUSD (CONTACT/OPERATOR)
Alternative names: 68TH STREET ELEMENTARY HIGH SCHOOL, LAUSD/SIXTY-EIGHTH ST ELEM, SIXTY-EIGHTH STREET ELEMENTARY
FREMONT NEW PRIMARY CENTER NO 2 (8621 S BARING CROSS ST in LOS ANGELES, CA)
STATE MASTER (California - Hazardous Waste Tracking) - HAZARDOU WASTE PROGRAM Large Quantity Generators, more that 1000 kg of hazardous waste/month (Resource Conservation and Recovery Act (tracking hazardous waste)) - notification Organizations: L A UNIFIED SCHOOL DISTRICT (CONTACT/OWNER)
LAUSD MANCHESTER ELEM SCHOOL (661 W 87TH ST in LOS ANGELES, CA)
STATE MASTER (California - Hazardous Waste Tracking) - HAZARDOU WASTE PROGRAM COMPLIANCE ACTIVITY (Tracking inspections of insecticide, fungicide, and rodenticide, and toxic substances) Small Quantity Generators, between 100 kg and 1000 kg of hazardous waste/month (Resource Conservation and Recovery Act (tracking hazardous waste)) - notification Alternative names: MANCHESTER AVENUE ELEMENTARY, MANCHESTER ELEMENTARY SCHOOL
ALTERNATOR ELECTRIC SHOP (7021 S VERMONT AVE in LOS ANGELES, CA)
STATE MASTER (California - Hazardous Waste Tracking) - HAZARDOU WASTE PROGRAM Small Quantity Generators, between 100 kg and 1000 kg of hazardous waste/month (Resource Conservation and Recovery Act (tracking hazardous waste)) Business NAICS classification: OTHER AUTOMOTIVE MECHANICAL AND ELECTRICAL REPAIR AND MAINTENANCE. Organizations: ELIZABETH PATINWILA (CONTACT/OPERATOR)
, ELIZABETH PATTINWILA (CONTACT/OWNER)
LA SOUTH MAINTENANCE YARD (8602 DENVER in LOS ANGELES, CA)
STATE MASTER (California - Hazardous Waste Tracking) - HAZARDOU WASTE PROGRAM Small Quantity Generators, between 100 kg and 1000 kg of hazardous waste/month (Resource Conservation and Recovery Act (tracking hazardous waste)) - notification Organizations: CITY OF LOS ANGELES (CONTACT/OWNER)
LAUSD MUIR JUNIOR HIGH SCHOOL (5929 S VERMONT AVE in LOS ANGELES, CA)
STATE MASTER (California - Hazardous Waste Tracking) - HAZARDOU WASTE PROGRAM Small Quantity Generators, between 100 kg and 1000 kg of hazardous waste/month (Resource Conservation and Recovery Act (tracking hazardous waste)) - notification
LOS ANGELES USD BUDLONG ELEM SCHOOL (5940 S BUDLONG AVE in LOS ANGELES, CA)
STATE MASTER (California - Hazardous Waste Tracking) - HAZARDOU WASTE PROGRAM Small Quantity Generators, between 100 kg and 1000 kg of hazardous waste/month (Resource Conservation and Recovery Act (tracking hazardous waste)) - notification Organizations: LOS ANGELES UNIFIED SCHOOL DISTRICT (CONTACT/OWNER)
Alternative names: BUDLONG AVENUE ELEMENTARY, LAUSD/ BUDLONG AVE ELEM
EL SALVADOR DEL MUNDO (8301 S VERMONT AVE in LOS ANGELES, CA)
STATE MASTER (California - Hazardous Waste Tracking) - HAZARDOU WASTE PROGRAM Small Quantity Generators, between 100 kg and 1000 kg of hazardous waste/month (Resource Conservation and Recovery Act (tracking hazardous waste)) - notification Organizations: CLINICA SALVADOR DEL MUNDO (CONTACT/OWNER)
ICI DULUX PAINTS (8332 S VERMONT AVE in LOS ANGELES, CA)
STATE MASTER (California - Hazardous Waste Tracking) - HAZARDOU WASTE PROGRAM Small Quantity Generators, between 100 kg and 1000 kg of hazardous waste/month (Resource Conservation and Recovery Act (tracking hazardous waste)) - notification Organizations: THE GLIDDEN CO (CONTACT/OWNER)
FIGUEROA STREET ELEMENTARY (510 W. 111TH ST. in LOS ANGELES, CA)
(National Center for Education Statistics) - STATE ID-6017073 Organizations: LOS ANGELES UNIFIED (SCHOOL DISTRICT)
HARTE (BRET) PREPATORY INTERMEDIATE (9301 S. HOOVER ST. in LOS ANGELES, CA)
(National Center for Education Statistics) - STATE ID-6058044 Organizations: LOS ANGELES UNIFIED (SCHOOL DISTRICT)
LOS ANGELES ACADEMY MIDDLE (644 EAST 56TH ST. in LOS ANGELES, CA)
(National Center for Education Statistics) - STATE ID-6115794 Organizations: LOS ANGELES UNIFIED (SCHOOL DISTRICT)
MILLER (LOREN) ELEMENTARY (830 W. 77TH ST. in LOS ANGELES, CA)
(National Center for Education Statistics) - STATE ID-6066278 Organizations: LOS ANGELES UNIFIED (SCHOOL DISTRICT)
Housing units lacking complete plumbing facilities: 1.3% Housing units lacking complete kitchen facilities: 3.2%
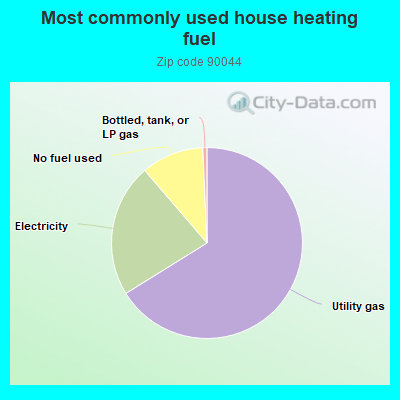
65.7%Utility gas
22.4%Electricity
10.5%No fuel used
0.7%Bottled, tank, or LP gas
Population in 1990: 83,958. Population change in the 1990s: +3,408 (+4.1%).
Place of birth for U.S.-born residents:
This state: 56,673
Northeast: 661
Midwest: 1,092
South: 5,306
West: 820
55% of the 90044 zip code residents lived in the same house 5 years ago. Out of people who lived in different houses, 93% lived in this county. Out of people who lived in different counties, 50% lived in California.
96% of the 90044 zip code residents lived in the same house 1 year ago. Out of people who lived in different houses, 88% moved from this county. Out of people who lived in different houses, 7% moved from different county within same state. Out of people who lived in different houses, 6% moved from different state. Out of people who lived in different houses, 5% moved from abroad.
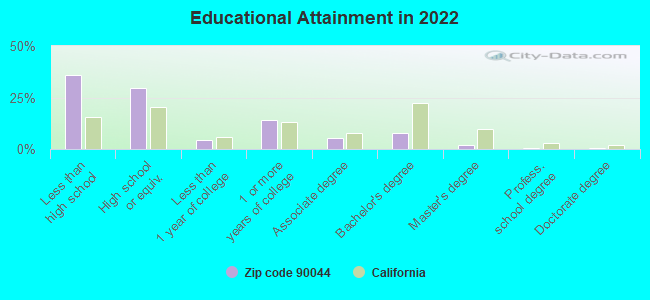
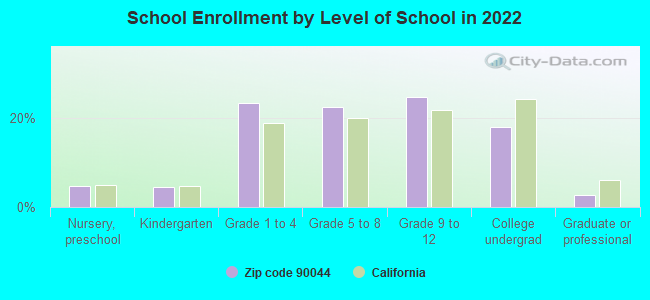
Private vs. public school enrollment:
Students in private schools in grades 1 to 8 (elementary and middle school): 1,006
Here:
7.8%
California:
10.5%
Students in private schools in grades 9 to 12 (high school): 358
Here:
5.1%
California:
8.5%
Students in private undergraduate colleges: 769
Here:
15.2%
California:
15.9%
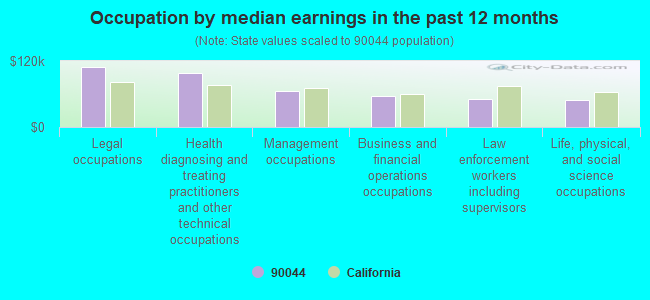
Occupation by median earnings in the past 12 months ($)
109,346Legal occupations
97,538Health diagnosing and treating practitioners and other technical occupations
64,697Management occupations
56,793Business and financial operations occupations
51,208Law enforcement workers including supervisors
49,028Life, physical, and social science occupations
Companies with federal contracts located in this zip code:
LUMAS AIR INC (8114 S VERMONT AVE in LOS ANGELES, CA; small business) : $1,400,654 in 21 contractsfrom 2001 to 2005
Contracts for Construction of Structures and Facilities -- Other Non-Building Facilities, Maintenance, Repair or Alteration of Real Property -- Hospitals and Infirmaries, Other Housekeeping Services, Maintenance, Repair and Rebuilding of Equipment -- Refrigeration, Air Conditioning, and Air Circulating Equipment, and moreby Navy, Department of Veterans Affairs, Air Force Signed by year:2000: $0; 2001: $805,466; 2002: $251,571; 2003: $141,191; 2004: $202,743; 2005: -$317; 2006: $0.
Biggest contracts:
$499,350 with Navy for Construction of Structures and Facilities -- Other Non-Building Facilities. Signed on 2003-05-19. Completion date: 2004-06-02.
$350,000 with Department of Veterans Affairs for Maintenance, Repair or Alteration of Real Property -- Hospitals and Infirmaries. Signed on 2001-09-15. Completion date: 2002-08-15.
$221,006 with Air Force for Other Housekeeping Services. Signed on 2001-09-30. Completion date: 2002-07-31.
$216,029 with Department of Veterans Affairs for Maintenance, Repair and Rebuilding of Equipment -- Refrigeration, Air Conditioning, and Air Circulating Equipment. Signed on 2004-06-25. Completion date: 2006-01-01.
BOBBY J MORGAN (714 WEST 95 STREET in LOS ANGELES, CA; small business) : $11,880 in 4 contractsin 2004
$3,300 with Army for Custodial Janitorial Services. Taking place in PA. Signed on 2004-11-08. Completion date: 2004-09-30.
$3,000, same as above.Signed on 2004-11-08. Completion date: 2004-09-30.
$2,880, same as above.Signed on 2004-11-05. Completion date: 2004-09-30.
$2,700, same as above.Signed on 2004-11-08. Completion date: 2004-09-30.
Top industries in this zip code by the number of employees in 2005:
2005 - 2018 National Fire Incident Reporting System (NFIRS) incidents
Based on the data from the years 2005 - 2018 the average number of fire incidents per year is 242. The highest number of fire incidents - 328 took place in 2007, and the least - 181 in 2012. The data has a growing trend.
When looking into fire subcategories, the most reports belonged to: Structure Fires (35.2%), and Outside Fires (33.0%).
Fire incident types reported to NFIRS in Zip Code 90044


 Nearest zip codes: 90047, 90003, 90061, 90305, 90303, 90002.
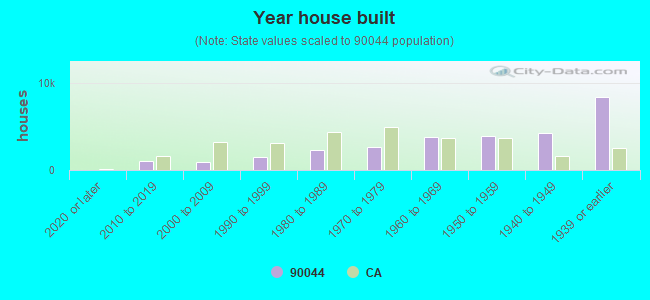


 Based on the data from the years 2005 - 2018 the average number of fire incidents per year is 242. The highest number of fire incidents - 328 took place in 2007, and the least - 181 in 2012. The data has a growing trend.
 When looking into fire subcategories, the most reports belonged to: Structure Fires (35.2%), and Outside Fires (33.0%).