Estimated zip code population in 2022: 51,766
Zip code population in 2010: 48,606
Zip code population in 2000: 47,105
Houses and condos: 18,241
Renter-occupied apartments: 8,013
% of renters here:
46%State:
44%
March 2022 cost of living index in zip code 90047: 135.6
(high, U.S. average is 100)
Land area: 4.7
sq. mi.
Water area: 0.0
sq. mi.
Population density: 10,943 people per square mile (high).
OSM Map
General Map
Google Map
MSN Map
OSM Map
General Map
Google Map
MSN Map
OSM Map
General Map
Google Map
MSN Map
OSM Map
General Map
Google Map
MSN Map
Please wait while loading the map...
Real estate property taxes paid for housing units in 2022:
This zip code:
0.6% ($3,771)California:
0.7% ($4,831)
Median real estate property taxes paid for housing units with mortgages in 2022: $4,201 (0.6%)
Median real estate property taxes paid for housing units with no mortgage in 2022: $2,337 (0.4%)
Profiles of local businesses
Business Search - 14 Million verified businesses
Males: 24,166 Females: 27,601
For population 25 years and over in 90047:
High school or higher: 79.5%Bachelor's degree or higher: 19.0%Graduate or professional degree: 6.4%Unemployed: 7.2%Mean travel time to work (commute): 33.5 minutes
For population 15 years and over in 90047:
Never married: 48.1%Now married: 32.6%Separated: 2.1%Widowed: 7.5%Divorced: 9.6%
Zip code 90047 compared to state average:
Black race population percentage significantly above state average. Length of stay since moving in significantly above state average. House age above state average. Percentage of population with a bachelor's degree or higher below state average. 25,978 50.2% Black 21,353 41.3% Hispanic or Latino 2,210 4.3% Two or more races 1,242 2.4% White 365 0.7% Native Hawaiian and Other 347 0.7% Some other race 248 0.5% Asian 19 0.04% American Indian
Data:
Median household income ($)
Median household income (% change since 2000)
Household income diversity
Ratio of average income to average house value (%)
Ratio of average income to average rent
Median household income ($) - White
Median household income ($) - Black or African American
Median household income ($) - Asian
Median household income ($) - Hispanic or Latino
Median household income ($) - American Indian and Alaska Native
Median household income ($) - Multirace
Median household income ($) - Other Race
Median household income for houses/condos with a mortgage ($)
Median household income for apartments without a mortgage ($)
Races - White alone (%)
Races - White alone (% change since 2000)
Races - Black alone (%)
Races - Black alone (% change since 2000)
Races - American Indian alone (%)
Races - American Indian alone (% change since 2000)
Races - Asian alone (%)
Races - Asian alone (% change since 2000)
Races - Hispanic (%)
Races - Hispanic (% change since 2000)
Races - Native Hawaiian and Other Pacific Islander alone (%)
Races - Native Hawaiian and Other Pacific Islander alone (% change since 2000)
Races - Two or more races (%)
Races - Two or more races (% change since 2000)
Races - Other race alone (%)
Races - Other race alone (% change since 2000)
Racial diversity
Unemployment (%)
Unemployment (% change since 2000)
Unemployment (%) - White
Unemployment (%) - Black or African American
Unemployment (%) - Asian
Unemployment (%) - Hispanic or Latino
Unemployment (%) - American Indian and Alaska Native
Unemployment (%) - Multirace
Unemployment (%) - Other Race
Population density (people per square mile)
Population - Males (%)
Population - Females (%)
Population - Males (%) - White
Population - Males (%) - Black or African American
Population - Males (%) - Asian
Population - Males (%) - Hispanic or Latino
Population - Males (%) - American Indian and Alaska Native
Population - Males (%) - Multirace
Population - Males (%) - Other Race
Population - Females (%) - White
Population - Females (%) - Black or African American
Population - Females (%) - Asian
Population - Females (%) - Hispanic or Latino
Population - Females (%) - American Indian and Alaska Native
Population - Females (%) - Multirace
Population - Females (%) - Other Race
Coronavirus confirmed cases (Apr 27, 2024)
Deaths caused by coronavirus (Apr 27, 2024)
Coronavirus confirmed cases (per 100k population) (Apr 27, 2024)
Deaths caused by coronavirus (per 100k population) (Apr 27, 2024)
Daily increase in number of cases (Apr 27, 2024)
Weekly increase in number of cases (Apr 27, 2024)
Cases doubled (in days) (Apr 27, 2024)
Hospitalized patients (Apr 18, 2022)
Negative test results (Apr 18, 2022)
Total test results (Apr 18, 2022)
COVID Vaccine doses distributed (per 100k population) (Sep 19, 2023)
COVID Vaccine doses administered (per 100k population) (Sep 19, 2023)
COVID Vaccine doses distributed (Sep 19, 2023)
COVID Vaccine doses administered (Sep 19, 2023)
Likely homosexual households (%)
Likely homosexual households (% change since 2000)
Likely homosexual households - Lesbian couples (%)
Likely homosexual households - Lesbian couples (% change since 2000)
Likely homosexual households - Gay men (%)
Likely homosexual households - Gay men (% change since 2000)
Cost of living index
Median gross rent ($)
Median contract rent ($)
Median monthly housing costs ($)
Median house or condo value ($)
Median house or condo value ($ change since 2000)
Mean house or condo value by units in structure - 1, detached ($)
Mean house or condo value by units in structure - 1, attached ($)
Mean house or condo value by units in structure - 2 ($)
Mean house or condo value by units in structure by units in structure - 3 or 4 ($)
Mean house or condo value by units in structure - 5 or more ($)
Mean house or condo value by units in structure - Boat, RV, van, etc. ($)
Mean house or condo value by units in structure - Mobile home ($)
Median house or condo value ($) - White
Median house or condo value ($) - Black or African American
Median house or condo value ($) - Asian
Median house or condo value ($) - Hispanic or Latino
Median house or condo value ($) - American Indian and Alaska Native
Median house or condo value ($) - Multirace
Median house or condo value ($) - Other Race
Median resident age
Resident age diversity
Median resident age - Males
Median resident age - Females
Median resident age - White
Median resident age - Black or African American
Median resident age - Asian
Median resident age - Hispanic or Latino
Median resident age - American Indian and Alaska Native
Median resident age - Multirace
Median resident age - Other Race
Median resident age - Males - White
Median resident age - Males - Black or African American
Median resident age - Males - Asian
Median resident age - Males - Hispanic or Latino
Median resident age - Males - American Indian and Alaska Native
Median resident age - Males - Multirace
Median resident age - Males - Other Race
Median resident age - Females - White
Median resident age - Females - Black or African American
Median resident age - Females - Asian
Median resident age - Females - Hispanic or Latino
Median resident age - Females - American Indian and Alaska Native
Median resident age - Females - Multirace
Median resident age - Females - Other Race
Commute - mean travel time to work (minutes)
Travel time to work - Less than 5 minutes (%)
Travel time to work - Less than 5 minutes (% change since 2000)
Travel time to work - 5 to 9 minutes (%)
Travel time to work - 5 to 9 minutes (% change since 2000)
Travel time to work - 10 to 19 minutes (%)
Travel time to work - 10 to 19 minutes (% change since 2000)
Travel time to work - 20 to 29 minutes (%)
Travel time to work - 20 to 29 minutes (% change since 2000)
Travel time to work - 30 to 39 minutes (%)
Travel time to work - 30 to 39 minutes (% change since 2000)
Travel time to work - 40 to 59 minutes (%)
Travel time to work - 40 to 59 minutes (% change since 2000)
Travel time to work - 60 to 89 minutes (%)
Travel time to work - 60 to 89 minutes (% change since 2000)
Travel time to work - 90 or more minutes (%)
Travel time to work - 90 or more minutes (% change since 2000)
Marital status - Never married (%)
Marital status - Now married (%)
Marital status - Separated (%)
Marital status - Widowed (%)
Marital status - Divorced (%)
Median family income ($)
Median family income (% change since 2000)
Median non-family income ($)
Median non-family income (% change since 2000)
Median per capita income ($)
Median per capita income (% change since 2000)
Median family income ($) - White
Median family income ($) - Black or African American
Median family income ($) - Asian
Median family income ($) - Hispanic or Latino
Median family income ($) - American Indian and Alaska Native
Median family income ($) - Multirace
Median family income ($) - Other Race
Median year house/condo built
Median year apartment built
Year house built - Built 2005 or later (%)
Year house built - Built 2000 to 2004 (%)
Year house built - Built 1990 to 1999 (%)
Year house built - Built 1980 to 1989 (%)
Year house built - Built 1970 to 1979 (%)
Year house built - Built 1960 to 1969 (%)
Year house built - Built 1950 to 1959 (%)
Year house built - Built 1940 to 1949 (%)
Year house built - Built 1939 or earlier (%)
Average household size
Household density (households per square mile)
Average household size - White
Average household size - Black or African American
Average household size - Asian
Average household size - Hispanic or Latino
Average household size - American Indian and Alaska Native
Average household size - Multirace
Average household size - Other Race
Occupied housing units (%)
Vacant housing units (%)
Owner occupied housing units (%)
Renter occupied housing units (%)
Vacancy status - For rent (%)
Vacancy status - For sale only (%)
Vacancy status - Rented or sold, not occupied (%)
Vacancy status - For seasonal, recreational, or occasional use (%)
Vacancy status - For migrant workers (%)
Vacancy status - Other vacant (%)
Residents with income below the poverty level (%)
Residents with income below 50% of the poverty level (%)
Children below poverty level (%)
Poor families by family type - Married-couple family (%)
Poor families by family type - Male, no wife present (%)
Poor families by family type - Female, no husband present (%)
Poverty status for native-born residents (%)
Poverty status for foreign-born residents (%)
Poverty among high school graduates not in families (%)
Poverty among people who did not graduate high school not in families (%)
Residents with income below the poverty level (%) - White
Residents with income below the poverty level (%) - Black or African American
Residents with income below the poverty level (%) - Asian
Residents with income below the poverty level (%) - Hispanic or Latino
Residents with income below the poverty level (%) - American Indian and Alaska Native
Residents with income below the poverty level (%) - Multirace
Residents with income below the poverty level (%) - Other Race
Air pollution - Air Quality Index (AQI)
Air pollution - CO
Air pollution - NO2
Air pollution - SO2
Air pollution - Ozone
Air pollution - PM10
Air pollution - PM25
Air pollution - Pb
Crime - Murders per 100,000 population
Crime - Rapes per 100,000 population
Crime - Robberies per 100,000 population
Crime - Assaults per 100,000 population
Crime - Burglaries per 100,000 population
Crime - Thefts per 100,000 population
Crime - Auto thefts per 100,000 population
Crime - Arson per 100,000 population
Crime - City-data.com crime index
Crime - Violent crime index
Crime - Property crime index
Crime - Murders per 100,000 population (5 year average)
Crime - Rapes per 100,000 population (5 year average)
Crime - Robberies per 100,000 population (5 year average)
Crime - Assaults per 100,000 population (5 year average)
Crime - Burglaries per 100,000 population (5 year average)
Crime - Thefts per 100,000 population (5 year average)
Crime - Auto thefts per 100,000 population (5 year average)
Crime - Arson per 100,000 population (5 year average)
Crime - City-data.com crime index (5 year average)
Crime - Violent crime index (5 year average)
Crime - Property crime index (5 year average)
1996 Presidential Elections Results (%) - Democratic Party (Clinton)
1996 Presidential Elections Results (%) - Republican Party (Dole)
1996 Presidential Elections Results (%) - Other
2000 Presidential Elections Results (%) - Democratic Party (Gore)
2000 Presidential Elections Results (%) - Republican Party (Bush)
2000 Presidential Elections Results (%) - Other
2004 Presidential Elections Results (%) - Democratic Party (Kerry)
2004 Presidential Elections Results (%) - Republican Party (Bush)
2004 Presidential Elections Results (%) - Other
2008 Presidential Elections Results (%) - Democratic Party (Obama)
2008 Presidential Elections Results (%) - Republican Party (McCain)
2008 Presidential Elections Results (%) - Other
2012 Presidential Elections Results (%) - Democratic Party (Obama)
2012 Presidential Elections Results (%) - Republican Party (Romney)
2012 Presidential Elections Results (%) - Other
2016 Presidential Elections Results (%) - Democratic Party (Clinton)
2016 Presidential Elections Results (%) - Republican Party (Trump)
2016 Presidential Elections Results (%) - Other
2020 Presidential Elections Results (%) - Democratic Party (Biden)
2020 Presidential Elections Results (%) - Republican Party (Trump)
2020 Presidential Elections Results (%) - Other
Ancestries Reported - Arab (%)
Ancestries Reported - Czech (%)
Ancestries Reported - Danish (%)
Ancestries Reported - Dutch (%)
Ancestries Reported - English (%)
Ancestries Reported - French (%)
Ancestries Reported - French Canadian (%)
Ancestries Reported - German (%)
Ancestries Reported - Greek (%)
Ancestries Reported - Hungarian (%)
Ancestries Reported - Irish (%)
Ancestries Reported - Italian (%)
Ancestries Reported - Lithuanian (%)
Ancestries Reported - Norwegian (%)
Ancestries Reported - Polish (%)
Ancestries Reported - Portuguese (%)
Ancestries Reported - Russian (%)
Ancestries Reported - Scotch-Irish (%)
Ancestries Reported - Scottish (%)
Ancestries Reported - Slovak (%)
Ancestries Reported - Subsaharan African (%)
Ancestries Reported - Swedish (%)
Ancestries Reported - Swiss (%)
Ancestries Reported - Ukrainian (%)
Ancestries Reported - United States (%)
Ancestries Reported - Welsh (%)
Ancestries Reported - West Indian (%)
Ancestries Reported - Other (%)
Educational Attainment - No schooling completed (%)
Educational Attainment - Less than high school (%)
Educational Attainment - High school or equivalent (%)
Educational Attainment - Less than 1 year of college (%)
Educational Attainment - 1 or more years of college (%)
Educational Attainment - Associate degree (%)
Educational Attainment - Bachelor's degree (%)
Educational Attainment - Master's degree (%)
Educational Attainment - Professional school degree (%)
Educational Attainment - Doctorate degree (%)
School Enrollment - Nursery, preschool (%)
School Enrollment - Kindergarten (%)
School Enrollment - Grade 1 to 4 (%)
School Enrollment - Grade 5 to 8 (%)
School Enrollment - Grade 9 to 12 (%)
School Enrollment - College undergrad (%)
School Enrollment - Graduate or professional (%)
School Enrollment - Not enrolled in school (%)
School enrollment - Public schools (%)
School enrollment - Private schools (%)
School enrollment - Not enrolled (%)
Median number of rooms in houses and condos
Median number of rooms in apartments
Housing units lacking complete plumbing facilities (%)
Housing units lacking complete kitchen facilities (%)
Density of houses
Urban houses (%)
Rural houses (%)
Households with people 60 years and over (%)
Households with people 65 years and over (%)
Households with people 75 years and over (%)
Households with one or more nonrelatives (%)
Households with no nonrelatives (%)
Population in households (%)
Family households (%)
Nonfamily households (%)
Population in families (%)
Family households with own children (%)
Median number of bedrooms in owner occupied houses
Mean number of bedrooms in owner occupied houses
Median number of bedrooms in renter occupied houses
Mean number of bedrooms in renter occupied houses
Median number of vehichles in owner occupied houses
Mean number of vehichles in owner occupied houses
Median number of vehichles in renter occupied houses
Mean number of vehichles in renter occupied houses
Mortgage status - with mortgage (%)
Mortgage status - with second mortgage (%)
Mortgage status - with home equity loan (%)
Mortgage status - with both second mortgage and home equity loan (%)
Mortgage status - without a mortgage (%)
Average family size
Average family size - White
Average family size - Black or African American
Average family size - Asian
Average family size - Hispanic or Latino
Average family size - American Indian and Alaska Native
Average family size - Multirace
Average family size - Other Race
Geographical mobility - Same house 1 year ago (%)
Geographical mobility - Moved within same county (%)
Geographical mobility - Moved from different county within same state (%)
Geographical mobility - Moved from different state (%)
Geographical mobility - Moved from abroad (%)
Place of birth - Born in state of residence (%)
Place of birth - Born in other state (%)
Place of birth - Native, outside of US (%)
Place of birth - Foreign born (%)
Housing units in structures - 1, detached (%)
Housing units in structures - 1, attached (%)
Housing units in structures - 2 (%)
Housing units in structures - 3 or 4 (%)
Housing units in structures - 5 to 9 (%)
Housing units in structures - 10 to 19 (%)
Housing units in structures - 20 to 49 (%)
Housing units in structures - 50 or more (%)
Housing units in structures - Mobile home (%)
Housing units in structures - Boat, RV, van, etc. (%)
House/condo owner moved in on average (years ago)
Renter moved in on average (years ago)
Year householder moved into unit - Moved in 1999 to March 2000 (%)
Year householder moved into unit - Moved in 1995 to 1998 (%)
Year householder moved into unit - Moved in 1990 to 1994 (%)
Year householder moved into unit - Moved in 1980 to 1989 (%)
Year householder moved into unit - Moved in 1970 to 1979 (%)
Year householder moved into unit - Moved in 1969 or earlier (%)
Means of transportation to work - Drove car alone (%)
Means of transportation to work - Carpooled (%)
Means of transportation to work - Public transportation (%)
Means of transportation to work - Bus or trolley bus (%)
Means of transportation to work - Streetcar or trolley car (%)
Means of transportation to work - Subway or elevated (%)
Means of transportation to work - Railroad (%)
Means of transportation to work - Ferryboat (%)
Means of transportation to work - Taxicab (%)
Means of transportation to work - Motorcycle (%)
Means of transportation to work - Bicycle (%)
Means of transportation to work - Walked (%)
Means of transportation to work - Other means (%)
Working at home (%)
Industry diversity
Most Common Industries - Agriculture, forestry, fishing and hunting, and mining (%)
Most Common Industries - Agriculture, forestry, fishing and hunting (%)
Most Common Industries - Mining, quarrying, and oil and gas extraction (%)
Most Common Industries - Construction (%)
Most Common Industries - Manufacturing (%)
Most Common Industries - Wholesale trade (%)
Most Common Industries - Retail trade (%)
Most Common Industries - Transportation and warehousing, and utilities (%)
Most Common Industries - Transportation and warehousing (%)
Most Common Industries - Utilities (%)
Most Common Industries - Information (%)
Most Common Industries - Finance and insurance, and real estate and rental and leasing (%)
Most Common Industries - Finance and insurance (%)
Most Common Industries - Real estate and rental and leasing (%)
Most Common Industries - Professional, scientific, and management, and administrative and waste management services (%)
Most Common Industries - Professional, scientific, and technical services (%)
Most Common Industries - Management of companies and enterprises (%)
Most Common Industries - Administrative and support and waste management services (%)
Most Common Industries - Educational services, and health care and social assistance (%)
Most Common Industries - Educational services (%)
Most Common Industries - Health care and social assistance (%)
Most Common Industries - Arts, entertainment, and recreation, and accommodation and food services (%)
Most Common Industries - Arts, entertainment, and recreation (%)
Most Common Industries - Accommodation and food services (%)
Most Common Industries - Other services, except public administration (%)
Most Common Industries - Public administration (%)
Occupation diversity
Most Common Occupations - Management, business, science, and arts occupations (%)
Most Common Occupations - Management, business, and financial occupations (%)
Most Common Occupations - Management occupations (%)
Most Common Occupations - Business and financial operations occupations (%)
Most Common Occupations - Computer, engineering, and science occupations (%)
Most Common Occupations - Computer and mathematical occupations (%)
Most Common Occupations - Architecture and engineering occupations (%)
Most Common Occupations - Life, physical, and social science occupations (%)
Most Common Occupations - Education, legal, community service, arts, and media occupations (%)
Most Common Occupations - Community and social service occupations (%)
Most Common Occupations - Legal occupations (%)
Most Common Occupations - Education, training, and library occupations (%)
Most Common Occupations - Arts, design, entertainment, sports, and media occupations (%)
Most Common Occupations - Healthcare practitioners and technical occupations (%)
Most Common Occupations - Health diagnosing and treating practitioners and other technical occupations (%)
Most Common Occupations - Health technologists and technicians (%)
Most Common Occupations - Service occupations (%)
Most Common Occupations - Healthcare support occupations (%)
Most Common Occupations - Protective service occupations (%)
Most Common Occupations - Fire fighting and prevention, and other protective service workers including supervisors (%)
Most Common Occupations - Law enforcement workers including supervisors (%)
Most Common Occupations - Food preparation and serving related occupations (%)
Most Common Occupations - Building and grounds cleaning and maintenance occupations (%)
Most Common Occupations - Personal care and service occupations (%)
Most Common Occupations - Sales and office occupations (%)
Most Common Occupations - Sales and related occupations (%)
Most Common Occupations - Office and administrative support occupations (%)
Most Common Occupations - Natural resources, construction, and maintenance occupations (%)
Most Common Occupations - Farming, fishing, and forestry occupations (%)
Most Common Occupations - Construction and extraction occupations (%)
Most Common Occupations - Installation, maintenance, and repair occupations (%)
Most Common Occupations - Production, transportation, and material moving occupations (%)
Most Common Occupations - Production occupations (%)
Most Common Occupations - Transportation occupations (%)
Most Common Occupations - Material moving occupations (%)
People in Group quarters - Institutionalized population (%)
People in Group quarters - Correctional institutions (%)
People in Group quarters - Federal prisons and detention centers (%)
People in Group quarters - Halfway houses (%)
People in Group quarters - Local jails and other confinement facilities (including police lockups) (%)
People in Group quarters - Military disciplinary barracks (%)
People in Group quarters - State prisons (%)
People in Group quarters - Other types of correctional institutions (%)
People in Group quarters - Nursing homes (%)
People in Group quarters - Hospitals/wards, hospices, and schools for the handicapped (%)
People in Group quarters - Hospitals/wards and hospices for chronically ill (%)
People in Group quarters - Hospices or homes for chronically ill (%)
People in Group quarters - Military hospitals or wards for chronically ill (%)
People in Group quarters - Other hospitals or wards for chronically ill (%)
People in Group quarters - Hospitals or wards for drug/alcohol abuse (%)
People in Group quarters - Mental (Psychiatric) hospitals or wards (%)
People in Group quarters - Schools, hospitals, or wards for the mentally retarded (%)
People in Group quarters - Schools, hospitals, or wards for the physically handicapped (%)
People in Group quarters - Institutions for the deaf (%)
People in Group quarters - Institutions for the blind (%)
People in Group quarters - Orthopedic wards and institutions for the physically handicapped (%)
People in Group quarters - Wards in general hospitals for patients who have no usual home elsewhere (%)
People in Group quarters - Wards in military hospitals for patients who have no usual home elsewhere (%)
People in Group quarters - Juvenile institutions (%)
People in Group quarters - Long-term care (%)
People in Group quarters - Homes for abused, dependent, and neglected children (%)
People in Group quarters - Residential treatment centers for emotionally disturbed children (%)
People in Group quarters - Training schools for juvenile delinquents (%)
People in Group quarters - Short-term care, detention or diagnostic centers for delinquent children (%)
People in Group quarters - Type of juvenile institution unknown (%)
People in Group quarters - Noninstitutionalized population (%)
People in Group quarters - College dormitories (includes college quarters off campus) (%)
People in Group quarters - Military quarters (%)
People in Group quarters - On base (%)
People in Group quarters - Barracks, unaccompanied personnel housing (UPH), (Enlisted/Officer), ;and similar group living quarters for military personnel (%)
People in Group quarters - Transient quarters for temporary residents (%)
People in Group quarters - Military ships (%)
People in Group quarters - Group homes (%)
People in Group quarters - Homes or halfway houses for drug/alcohol abuse (%)
People in Group quarters - Homes for the mentally ill (%)
People in Group quarters - Homes for the mentally retarded (%)
People in Group quarters - Homes for the physically handicapped (%)
People in Group quarters - Other group homes (%)
People in Group quarters - Religious group quarters (%)
People in Group quarters - Dormitories (%)
People in Group quarters - Agriculture workers' dormitories on farms (%)
People in Group quarters - Job Corps and vocational training facilities (%)
People in Group quarters - Other workers' dormitories (%)
People in Group quarters - Crews of maritime vessels (%)
People in Group quarters - Other nonhousehold living situations (%)
People in Group quarters - Other noninstitutional group quarters (%)
Residents speaking English at home (%)
Residents speaking English at home - Born in the United States (%)
Residents speaking English at home - Native, born elsewhere (%)
Residents speaking English at home - Foreign born (%)
Residents speaking Spanish at home (%)
Residents speaking Spanish at home - Born in the United States (%)
Residents speaking Spanish at home - Native, born elsewhere (%)
Residents speaking Spanish at home - Foreign born (%)
Residents speaking other language at home (%)
Residents speaking other language at home - Born in the United States (%)
Residents speaking other language at home - Native, born elsewhere (%)
Residents speaking other language at home - Foreign born (%)
Class of Workers - Employee of private company (%)
Class of Workers - Self-employed in own incorporated business (%)
Class of Workers - Private not-for-profit wage and salary workers (%)
Class of Workers - Local government workers (%)
Class of Workers - State government workers (%)
Class of Workers - Federal government workers (%)
Class of Workers - Self-employed workers in own not incorporated business and Unpaid family workers (%)
House heating fuel used in houses and condos - Utility gas (%)
House heating fuel used in houses and condos - Bottled, tank, or LP gas (%)
House heating fuel used in houses and condos - Electricity (%)
House heating fuel used in houses and condos - Fuel oil, kerosene, etc. (%)
House heating fuel used in houses and condos - Coal or coke (%)
House heating fuel used in houses and condos - Wood (%)
House heating fuel used in houses and condos - Solar energy (%)
House heating fuel used in houses and condos - Other fuel (%)
House heating fuel used in houses and condos - No fuel used (%)
House heating fuel used in apartments - Utility gas (%)
House heating fuel used in apartments - Bottled, tank, or LP gas (%)
House heating fuel used in apartments - Electricity (%)
House heating fuel used in apartments - Fuel oil, kerosene, etc. (%)
House heating fuel used in apartments - Coal or coke (%)
House heating fuel used in apartments - Wood (%)
House heating fuel used in apartments - Solar energy (%)
House heating fuel used in apartments - Other fuel (%)
House heating fuel used in apartments - No fuel used (%)
Armed forces status - In Armed Forces (%)
Armed forces status - Civilian (%)
Armed forces status - Civilian - Veteran (%)
Armed forces status - Civilian - Nonveteran (%)
Fatal accidents locations in years 2005-2021
Fatal accidents locations in 2005
Fatal accidents locations in 2006
Fatal accidents locations in 2007
Fatal accidents locations in 2008
Fatal accidents locations in 2009
Fatal accidents locations in 2010
Fatal accidents locations in 2011
Fatal accidents locations in 2012
Fatal accidents locations in 2013
Fatal accidents locations in 2014
Fatal accidents locations in 2015
Fatal accidents locations in 2016
Fatal accidents locations in 2017
Fatal accidents locations in 2018
Fatal accidents locations in 2019
Fatal accidents locations in 2020
Fatal accidents locations in 2021
Alcohol use - People drinking some alcohol every month (%)
Alcohol use - People not drinking at all (%)
Alcohol use - Average days/month drinking alcohol
Alcohol use - Average drinks/week
Alcohol use - Average days/year people drink much
Audiometry - Average condition of hearing (%)
Audiometry - People that can hear a whisper from across a quiet room (%)
Audiometry - People that can hear normal voice from across a quiet room (%)
Audiometry - Ears ringing, roaring, buzzing (%)
Audiometry - Had a job exposure to loud noise (%)
Audiometry - Had off-work exposure to loud noise (%)
Blood Pressure & Cholesterol - Has high blood pressure (%)
Blood Pressure & Cholesterol - Checking blood pressure at home (%)
Blood Pressure & Cholesterol - Frequently checking blood cholesterol (%)
Blood Pressure & Cholesterol - Has high cholesterol level (%)
Consumer Behavior - Money monthly spent on food at supermarket/grocery store
Consumer Behavior - Money monthly spent on food at other stores
Consumer Behavior - Money monthly spent on eating out
Consumer Behavior - Money monthly spent on carryout/delivered foods
Consumer Behavior - Income spent on food at supermarket/grocery store (%)
Consumer Behavior - Income spent on food at other stores (%)
Consumer Behavior - Income spent on eating out (%)
Consumer Behavior - Income spent on carryout/delivered foods (%)
Current Health Status - General health condition (%)
Current Health Status - Blood donors (%)
Current Health Status - Has blood ever tested for HIV virus (%)
Current Health Status - Left-handed people (%)
Dermatology - People using sunscreen (%)
Diabetes - Diabetics (%)
Diabetes - Had a blood test for high blood sugar (%)
Diabetes - People taking insulin (%)
Diet Behavior & Nutrition - Diet health (%)
Diet Behavior & Nutrition - Milk product consumption (# of products/month)
Diet Behavior & Nutrition - Meals not home prepared (#/week)
Diet Behavior & Nutrition - Meals from fast food or pizza place (#/week)
Diet Behavior & Nutrition - Ready-to-eat foods (#/month)
Diet Behavior & Nutrition - Frozen meals/pizza (#/month)
Drug Use - People that ever used marijuana or hashish (%)
Drug Use - Ever used hard drugs (%)
Drug Use - Ever used any form of cocaine (%)
Drug Use - Ever used heroin (%)
Drug Use - Ever used methamphetamine (%)
Health Insurance - People covered by health insurance (%)
Kidney Conditions-Urology - Avg. # of times urinating at night
Medical Conditions - People with asthma (%)
Medical Conditions - People with anemia (%)
Medical Conditions - People with psoriasis (%)
Medical Conditions - People with overweight (%)
Medical Conditions - Elderly people having difficulties in thinking or remembering (%)
Medical Conditions - People who ever received blood transfusion (%)
Medical Conditions - People having trouble seeing even with glass/contacts (%)
Medical Conditions - People with arthritis (%)
Medical Conditions - People with gout (%)
Medical Conditions - People with congestive heart failure (%)
Medical Conditions - People with coronary heart disease (%)
Medical Conditions - People with angina pectoris (%)
Medical Conditions - People who ever had heart attack (%)
Medical Conditions - People who ever had stroke (%)
Medical Conditions - People with emphysema (%)
Medical Conditions - People with thyroid problem (%)
Medical Conditions - People with chronic bronchitis (%)
Medical Conditions - People with any liver condition (%)
Medical Conditions - People who ever had cancer or malignancy (%)
Mental Health - People who have little interest in doing things (%)
Mental Health - People feeling down, depressed, or hopeless (%)
Mental Health - People who have trouble sleeping or sleeping too much (%)
Mental Health - People feeling tired or having little energy (%)
Mental Health - People with poor appetite or overeating (%)
Mental Health - People feeling bad about themself (%)
Mental Health - People who have trouble concentrating on things (%)
Mental Health - People moving or speaking slowly or too fast (%)
Mental Health - People having thoughts they would be better off dead (%)
Oral Health - Average years since last visit a dentist
Oral Health - People embarrassed because of mouth (%)
Oral Health - People with gum disease (%)
Oral Health - General health of teeth and gums (%)
Oral Health - Average days a week using dental floss/device
Oral Health - Average days a week using mouthwash for dental problem
Oral Health - Average number of teeth
Pesticide Use - Households using pesticides to control insects (%)
Pesticide Use - Households using pesticides to kill weeds (%)
Physical Activity - People doing vigorous-intensity work activities (%)
Physical Activity - People doing moderate-intensity work activities (%)
Physical Activity - People walking or bicycling (%)
Physical Activity - People doing vigorous-intensity recreational activities (%)
Physical Activity - People doing moderate-intensity recreational activities (%)
Physical Activity - Average hours a day doing sedentary activities
Physical Activity - Average hours a day watching TV or videos
Physical Activity - Average hours a day using computer
Physical Functioning - People having limitations keeping them from working (%)
Physical Functioning - People limited in amount of work they can do (%)
Physical Functioning - People that need special equipment to walk (%)
Physical Functioning - People experiencing confusion/memory problems (%)
Physical Functioning - People requiring special healthcare equipment (%)
Prescription Medications - Average number of prescription medicines taking
Preventive Aspirin Use - Adults 40+ taking low-dose aspirin (%)
Reproductive Health - Vaginal deliveries (%)
Reproductive Health - Cesarean deliveries (%)
Reproductive Health - Deliveries resulted in a live birth (%)
Reproductive Health - Pregnancies resulted in a delivery (%)
Reproductive Health - Women breastfeeding newborns (%)
Reproductive Health - Women that had a hysterectomy (%)
Reproductive Health - Women that had both ovaries removed (%)
Reproductive Health - Women that have ever taken birth control pills (%)
Reproductive Health - Women taking birth control pills (%)
Reproductive Health - Women that have ever used Depo-Provera or injectables (%)
Reproductive Health - Women that have ever used female hormones (%)
Sexual Behavior - People 18+ that ever had sex (vaginal, anal, or oral) (%)
Sexual Behavior - Males 18+ that ever had vaginal sex with a woman (%)
Sexual Behavior - Males 18+ that ever performed oral sex on a woman (%)
Sexual Behavior - Males 18+ that ever had anal sex with a woman (%)
Sexual Behavior - Males 18+ that ever had any sex with a man (%)
Sexual Behavior - Females 18+ that ever had vaginal sex with a man (%)
Sexual Behavior - Females 18+ that ever performed oral sex on a man (%)
Sexual Behavior - Females 18+ that ever had anal sex with a man (%)
Sexual Behavior - Females 18+ that ever had any kind of sex with a woman (%)
Sexual Behavior - Average age people first had sex
Sexual Behavior - Average number of female sex partners in lifetime (males 18+)
Sexual Behavior - Average number of female vaginal sex partners in lifetime (males 18+)
Sexual Behavior - Average age people first performed oral sex on a woman (18+)
Sexual Behavior - Average number of woman performed oral sex on in lifetime (18+)
Sexual Behavior - Average number of male sex partners in lifetime (males 18+)
Sexual Behavior - Average number of male anal sex partners in lifetime (males 18+)
Sexual Behavior - Average age people first performed oral sex on a man (18+)
Sexual Behavior - Average number of male oral sex partners in lifetime (18+)
Sexual Behavior - People using protection when performing oral sex (%)
Sexual Behavior - Average number of times people have vaginal or anal sex a year
Sexual Behavior - People having sex without condom (%)
Sexual Behavior - Average number of male sex partners in lifetime (females 18+)
Sexual Behavior - Average number of male vaginal sex partners in lifetime (females 18+)
Sexual Behavior - Average number of female sex partners in lifetime (females 18+)
Sexual Behavior - Circumcised males 18+ (%)
Sleep Disorders - Average hours sleeping at night
Sleep Disorders - People that has trouble sleeping (%)
Smoking-Cigarette Use - People smoking cigarettes (%)
Taste & Smell - People 40+ having problems with smell (%)
Taste & Smell - People 40+ having problems with taste (%)
Taste & Smell - People 40+ that ever had wisdom teeth removed (%)
Taste & Smell - People 40+ that ever had tonsils teeth removed (%)
Taste & Smell - People 40+ that ever had a loss of consciousness because of a head injury (%)
Taste & Smell - People 40+ that ever had a broken nose or other serious injury to face or skull (%)
Taste & Smell - People 40+ that ever had two or more sinus infections (%)
Weight - Average height (inches)
Weight - Average weight (pounds)
Weight - Average BMI
Weight - People that are obese (%)
Weight - People that ever were obese (%)
Weight - People trying to lose weight (%)
100%
urban population.
Estimated median house/condo value in 2022: $664,757
90047:
$664,757California:
$715,900
Median resident age: This zip code:
38.0 yearsCalifornia median age:
37.9 years
Average household size: This zip code:
2.9 peopleCalifornia:
2.8 people
Averages for the 2020 tax year for zip code 90047, filed in 2021:
Average Adjusted Gross Income (AGI) in 2020: $45,475 (Individual Income Tax Returns) Here:
$45,475State:
$95,910
Salary/wage: $43,970 (reported on 79.3% of returns )Here:
$43,970State:
$77,331
(% of AGI for various income ranges: 1158.5% for AGIs below $25k , 3945.5% for AGIs $25k-50k , 7778.5% for AGIs $50k-75k , 10947.0% for AGIs $75k-100k , 20612.2% for AGIs $100k-200k , 60775.6% for AGIs over 200k ) Taxable interest for individuals: $287 (reported on 24.0% of returns )This zip code:
$287California:
$2,294
(% of AGI for various income ranges: 4.2% for AGIs below $25k , 6.4% for AGIs $25k-50k , 11.7% for AGIs $50k-75k , 17.1% for AGIs $75k-100k , 40.4% for AGIs $100k-200k , 235.6% for AGIs over 200k ) Ordinary dividends: $1,138 (reported on 5.2% of returns )(% of AGI for various income ranges: 2.0% for AGIs below $25k , 2.8% for AGIs $25k-50k , 8.6% for AGIs $50k-75k , 17.2% for AGIs $75k-100k , 29.8% for AGIs $100k-200k , 556.7% for AGIs over 200k ) Net capital gain/loss in AGI: +$6,192 (reported on 5.7% of returns )Here:
+$6,192State:
+$49,306
(% of AGI for various income ranges: 22.1% for AGIs $50k-75k , 40.3% for AGIs $75k-100k , 172.5% for AGIs $100k-200k , 6932.2% for AGIs over 200k ) Profit/loss from business: +$3,438 (reported on 22.7% of returns )Here:
+$3,438State:
+$15,671
(% of AGI for various income ranges: 163.2% for AGIs below $25k , 32.2% for AGIs $25k-50k , 72.6% for AGIs $50k-75k , 155.8% for AGIs $75k-100k , 176.3% for AGIs $100k-200k , 1784.4% for AGIs over 200k ) Taxable individual retirement arrangement distribution: $15,058 (reported on 2.8% of returns )90047:
$15,058California:
$23,505
(% of AGI for various income ranges: 16.5% for AGIs below $25k , 27.5% for AGIs $25k-50k , 82.7% for AGIs $50k-75k , 141.3% for AGIs $75k-100k , 284.7% for AGIs $100k-200k , 1553.3% for AGIs over 200k ) Total itemized deductions: $27,618 (reported on 16.1% of returns )Here:
$27,618State:
$39,517
(% of AGI for various income ranges: 88.4% for AGIs below $25k , 290.9% for AGIs $25k-50k , 1002.5% for AGIs $50k-75k , 1891.2% for AGIs $75k-100k , 3450.8% for AGIs $100k-200k , 9041.1% for AGIs over 200k ) Charity contributions: $6,316 (reported on 13.8% of returns )(% of AGI for various income ranges: 8.0% for AGIs below $25k , 49.7% for AGIs $25k-50k , 183.0% for AGIs $50k-75k , 369.5% for AGIs $75k-100k , 734.0% for AGIs $100k-200k , 2564.4% for AGIs over 200k ) Taxes paid: $7,547 (reported on 16.1% of returns )(% of AGI for various income ranges: 18.8% for AGIs below $25k , 66.1% for AGIs $25k-50k , 270.7% for AGIs $50k-75k , 552.4% for AGIs $75k-100k , 1049.5% for AGIs $100k-200k , 2107.8% for AGIs over 200k ) Earned income credit: $2,314 (reported on 23.6% of returns )(% of AGI for various income ranges: 141.3% for AGIs below $25k , 80.3% for AGIs $25k-50k , 0.4% for AGIs $50k-75k ) Percentage of individuals using paid preparers for their 2020 taxes: 90.0%(% for various income ranges: 88.7% for AGIs below $25k , 90.8% for AGIs $25k-50k , 90.5% for AGIs $50k-75k , 89.7% for AGIs $75k-100k , 91.7% for AGIs $100k-200k , 92.9% for AGIs over 200k )
Averages for the 2012 tax year for zip code 90047, filed in 2013:
Average Adjusted Gross Income (AGI) in 2012: $34,514 (Individual Income Tax Returns) Here:
$34,514State:
$72,726
Salary/wage: $33,958 (reported on 79.7% of returns )Here:
$33,958State:
$59,079
(% of AGI for various income ranges: 70.8% for AGIs below $25k , 83.5% for AGIs $25k-50k , 81.5% for AGIs $50k-75k , 78.3% for AGIs $75k-100k , 77.8% for AGIs $100k-200k , 48.9% for AGIs over 200k ) Taxable interest for individuals: $274 (reported on 21.7% of returns )This zip code:
$274California:
$2,146
(% of AGI for various income ranges: 0.2% for AGIs below $25k , 0.1% for AGIs $25k-50k , 0.2% for AGIs $50k-75k , 0.2% for AGIs $75k-100k , 0.1% for AGIs $100k-200k , 0.8% for AGIs over 200k ) Ordinary dividends: $1,052 (reported on 4.1% of returns )(% of AGI for various income ranges: 0.1% for AGIs below $25k , 0.2% for AGIs $75k-100k , 0.2% for AGIs $100k-200k , 0.5% for AGIs over 200k ) Net capital gain/loss in AGI: +$2,944 (reported on 3.0% of returns )Here:
+$2,944State:
+$30,460
(% of AGI for various income ranges: 0.3% for AGIs $100k-200k , 12.5% for AGIs over 200k ) Profit/loss from business: +$6,011 (reported on 20.0% of returns )Here:
+$6,011State:
+$17,064
(% of AGI for various income ranges: 15.3% for AGIs below $25k , 1.3% for AGIs $25k-50k , 0.4% for AGIs $50k-75k , 0.1% for AGIs $75k-100k , 0.5% for AGIs $100k-200k ) Taxable individual retirement arrangement distribution: $13,008 (reported on 3.8% of returns )90047:
$13,008California:
$19,557
(% of AGI for various income ranges: 1.0% for AGIs below $25k , 1.1% for AGIs $25k-50k , 1.2% for AGIs $50k-75k , 2.1% for AGIs $75k-100k , 2.8% for AGIs $100k-200k ) Total itemized deductions: $21,173 (36% of AGI, reported on 32.2% of returns )Here:
$21,173State:
$34,004
Here:
35.7% of AGIState:
22.7% of AGI
(% of AGI for various income ranges: 9.9% for AGIs below $25k , 18.4% for AGIs $25k-50k , 24.4% for AGIs $50k-75k , 25.1% for AGIs $75k-100k , 23.5% for AGIs $100k-200k , 18.5% for AGIs over 200k ) Charity contributions: $3,951 (reported on 27.3% of returns )(% of AGI for various income ranges: 1.1% for AGIs below $25k , 2.7% for AGIs $25k-50k , 3.9% for AGIs $50k-75k , 4.3% for AGIs $75k-100k , 4.4% for AGIs $100k-200k , 2.7% for AGIs over 200k ) Taxes paid: $5,327 (reported on 32.1% of returns )90047:
$5,327State:
$14,448
(% of AGI for various income ranges: 2.1% for AGIs below $25k , 3.9% for AGIs $25k-50k , 6.0% for AGIs $50k-75k , 7.0% for AGIs $75k-100k , 7.3% for AGIs $100k-200k , 7.5% for AGIs over 200k ) Earned income credit: $2,626 (reported on 33.0% of returns )(% of AGI for various income ranges: 11.0% for AGIs below $25k , 1.4% for AGIs $25k-50k ) Percentage of individuals using paid preparers for their 2012 taxes: 69.9%(% for various income ranges: 67.9% for AGIs below $25k , 71.0% for AGIs $25k-50k , 72.6% for AGIs $50k-75k , 73.3% for AGIs $75k-100k , 73.1% for AGIs $100k-200k , 80.0% for AGIs over 200k )
Averages for the 2004 tax year for zip code 90047, filed in 2005:
Average Adjusted Gross Income (AGI) in 2004: $31,168 (Individual Income Tax Returns) Here:
$31,168State:
$58,600
Salary/wage: $30,465 (reported on 84.1% of returns )Here:
$30,465State:
$49,455
(% of AGI for various income ranges: 85.2% for AGIs below $10k , 78.7% for AGIs $10k-25k , 85.7% for AGIs $25k-50k , 84.7% for AGIs $50k-75k , 82.3% for AGIs $75k-100k , 69.1% for AGIs over 100k ) Taxable interest for individuals: $508 (reported on 29.0% of returns )This zip code:
$508California:
$2,365
(% of AGI for various income ranges: 1.4% for AGIs below $10k , 0.5% for AGIs $10k-25k , 0.4% for AGIs $25k-50k , 0.4% for AGIs $50k-75k , 0.5% for AGIs $75k-100k , 0.6% for AGIs over 100k ) Taxable dividends: $639 (reported on 6.7% of returns )(% of AGI for various income ranges: 0.4% for AGIs below $10k , 0.1% for AGIs $10k-25k , 0.1% for AGIs $25k-50k , 0.1% for AGIs $50k-75k , 0.2% for AGIs $75k-100k , 0.4% for AGIs over 100k ) Net capital gain/loss: +$10,405 (reported on 4.4% of returns )Here:
+$10,405State:
+$23,418
(% of AGI for various income ranges: -0.1% for AGIs below $10k , -0.0% for AGIs $10k-25k , 0.2% for AGIs $25k-50k , 0.2% for AGIs $50k-75k , 0.6% for AGIs $75k-100k , 12.7% for AGIs over 100k ) Profit/loss from business: +$4,075 (reported on 15.3% of returns )Here:
+$4,075State:
+$16,826
(% of AGI for various income ranges: 17.2% for AGIs below $10k , 6.1% for AGIs $10k-25k , 1.0% for AGIs $25k-50k , 0.5% for AGIs $50k-75k , -0.2% for AGIs $75k-100k , 0.2% for AGIs over 100k ) IRA payment deduction: $2,004 (reported on 1.2% of returns )90047:
$2,004California:
$3,192
(% of AGI for various income ranges: 0.1% for AGIs below $10k , 0.1% for AGIs $10k-25k , 0.1% for AGIs $25k-50k , 0.1% for AGIs $50k-75k , 0.1% for AGIs $75k-100k ) Total itemized deductions: $19,665 (39% of AGI, reported on 37.5% of returns )Here:
$19,665State:
$28,113
Here:
39.1% of AGIState:
25.3% of AGI
(% of AGI for various income ranges: 15.8% for AGIs below $10k , 14.2% for AGIs $10k-25k , 23.5% for AGIs $25k-50k , 29.5% for AGIs $50k-75k , 29.2% for AGIs $75k-100k , 23.6% for AGIs over 100k ) Charity contributions deductions: $3,944 (8% of AGI, reported on 34.0% of returns )Here:
7.6% of AGIState:
3.3% of AGI
(% of AGI for various income ranges: 1.2% for AGIs below $10k , 2.0% for AGIs $10k-25k , 4.1% for AGIs $25k-50k , 5.5% for AGIs $50k-75k , 5.9% for AGIs $75k-100k , 5.2% for AGIs over 100k ) Total tax: $3,093 (reported on 62.9% of returns )90047:
$3,093State:
$10,761
(% of AGI for various income ranges: 4.1% for AGIs below $10k , 2.8% for AGIs $10k-25k , 4.7% for AGIs $25k-50k , 7.3% for AGIs $50k-75k , 8.7% for AGIs $75k-100k , 12.9% for AGIs over 100k ) Earned income credit: $2,010 (reported on 31.5% of returns )Percentage of individuals using paid preparers for their 2004 taxes: 75.1%(% for various income ranges: 69.3% for AGIs below $10k , 77.2% for AGIs $10k-25k , 75.8% for AGIs $25k-50k , 75.5% for AGIs $50k-75k , 76.7% for AGIs $75k-100k , 76.3% for AGIs over 100k )
Estimated median household income in 2022: This zip code:
$66,760California:
$91,551
Nearest zip codes: 90044 ,
90305 ,
90303 ,
90003 ,
90043 ,
90061 .
Westmont Zip Code Map
Percentage of family households: This zip code:
45.4%California:
46.8%
Percentage of households with unmarried partners: This zip code:
6.8%California:
48.1%
Likely homosexual households (counted as self-reported same-sex unmarried-partner households)
Lesbian couples: 0.1% of all households Gay men: 0.2% of all households
Household received Food Stamps/SNAP in the past 12 months: 4,718Household did not receive Food Stamps/SNAP in the past 12 months: 13,316
Women who had a birth in the past 12 months: 626 (281 now married , 348 unmarried) Women who did not have a birth in the past 12 months: 11,899 (3,054 now married , 8,914 unmarried)
Housing units in zip code 90047 with a mortgage: 6,991 (694
second mortgage , 36
home equity loan , 381
both second mortgage and home equity loan )
Houses without a mortgage: 57
Median monthly owner costs for units with a mortgage: $2,365
Median monthly owner costs for units without a mortgage: $617
Residents with income below the poverty level in 2022:
This zip code:
17.5%Whole state:
12.2%
Residents with income below 50% of the poverty level in 2022:
This zip code:
8.7%Whole state:
6.2%
Median number of rooms in houses and condos: Median number of rooms in apartments: Notable locations in this zip code not listed on our city pages
Click to draw/clear zip code borders Notable locations in zip code 90047: (A) , Chester Washington Golf Course (B) , Los Angeles County Fire Department Station 14 (C) . Display/hide their locations on the map
Churches in zip code 90047 include: (A) , Sanctuary of Yahweh (B) , Bethel Gospel Chapel (C) , First Samoan Church of Los Angeles (D) , Saint Frances Cabrini Church (E) , Calvary Memorial Missionary Baptist Church (F) , Greater Westside Missionary Church (G) , Faithful Walk Ministries (H) , Imperial Heights Community Church (I) . Display/hide their locations on the map
Parks in zip code 90047 include: (1) , Jesse Owens County Park (2) , Saint Andrews Recreation Center (3) . Display/hide their locations on the map
Year house built (houses)
74 2020 or later584 2010 to 2019525 2000 to 2009372 1990 to 1999810 1980 to 1989819 1970 to 19791,085 1960 to 19692,717 1950 to 19594,006 1940 to 19497,061 1939 or earlier
Zip code 90047 household income distribution in 2022 1,465 Less than $10,0001,093 $10,000 to $14,9991,021 $15,000 to $19,999712 $20,000 to $24,999564 $25,000 to $29,999594 $30,000 to $34,999462 $35,000 to $39,999759 $40,000 to $44,999486 $45,000 to $49,999901 $50,000 to $59,9991,599 $60,000 to $74,9992,478 $75,000 to $99,9991,378 $100,000 to $124,9991,033 $125,000 to $149,9991,593 $150,000 to $199,9991,413 $200,000 or moreEstimate of home value of owner-occupied houses/condos in 2022 in zip code 90047 25 Less than $10,00011 $25,000 to $29,99917 $40,000 to $49,99916 $50,000 to $59,99930 $60,000 to $69,99972 $70,000 to $79,99944 $80,000 to $89,99925 $100,000 to $124,99978 $150,000 to $174,99978 $200,000 to $249,99946 $250,000 to $299,999510 $300,000 to $399,9991,135 $400,000 to $499,9995,206 $500,000 to $749,9991,954 $750,000 to $999,99972 $1,000,000 to $1,499,99918 $1,500,000 to $1,999,99947 $2,000,000 or moreRent paid by renters in 2022 in zip code 90047 140 Less than $10074 $100 to $149256 $150 to $199253 $200 to $24969 $250 to $29998 $350 to $39994 $400 to $44974 $450 to $499240 $500 to $549131 $550 to $59975 $600 to $64936 $650 to $699319 $700 to $749124 $750 to $799639 $800 to $899435 $900 to $9991,012 $1,000 to $1,249951 $1,250 to $1,4991,845 $1,500 to $1,999413 $2,000 to $2,499291 $2,500 to $2,999145 $3,000 to $3,499349 No cash rent
Median gross rent in 2022: $1,482.
Median price asked for vacant for-sale houses and condos in 2022: $777,981.
Estimated median house (or condo) value in 2022 for: White Non-Hispanic householders: $644,900Black or African American householders: $668,209American Indian or Alaska Native householders: $602,597Asian householders: $661,303Some other race householders: $618,137Two or more races householders: $660,008Hispanic or Latino householders: $621,158Estimated median house or condo value in 2022: $664,757
90047:
$664,757California:
$715,900
Lower value quartile - upper value quartile: $551,394 - $791,693
Mean price in 2022: Detached houses: $1,324,769Here:
$1,324,769State:
$988,808
Townhouses or other attached units: $832,477Here:
$832,477State:
$838,546
In 2-unit structures: $1,127,961Here:
$1,127,961State:
$1,138,100
In 3-to-4-unit structures: $930,211Here:
$930,211State:
$824,253
In 5-or-more-unit structures: $784,826Here:
$784,826State:
$730,996
Mobile homes: $255,082Here:
$255,082State:
$184,506
Occupied boats, RVs, vans, etc.: $63,014Here:
$63,014State:
$204,957
Housing units in structures:
One, detached: 12,310One, attached: 1,544Two: 8623 or 4: 1,5675 to 9: 77410 to 19: 39920 to 49: 27450 or more: 402Mobile homes: 81Unemployment : 7.2%
Means of transportation to work in zip code 90047 69.8% 15,768 Drove a car alone9.4% 2,116 Carpooled3.5% 785 Bus or trolley bus0.0% 9 Streetcar or trolley car0.1% 22 Subway or elevated0.0% 8 Railroad0.9% 198 Taxi0.3% 79 Motorcycle0.3% 65 Bicycle0.4% 95 Walked1.6% 353 Other means12.3% 2,782 Worked at homeTravel time to work (commute) in zip code 90047 38 Less than 5 minutes395 5 to 9 minutes738 10 to 14 minutes1,882 15 to 19 minutes2,862 20 to 24 minutes900 25 to 29 minutes5,389 30 to 34 minutes638 35 to 39 minutes1,180 40 to 44 minutes2,476 45 to 59 minutes2,502 60 to 89 minutes536 90 or more minutes
Neighborhoods in zip code 90047: Percentage of zip code residents living and working in this county: 98.6%
Household type by relationship:
Households: 51,766
Male householders: 6,486 (1,375 living alone ), Female householders: 11,066 (3,447 living alone )5,290 spouses (5,188 opposite-sex spouses ), 1,221 unmarried partners , (1,201 opposite-sex unmarried partners ), 16,812 children (16,036 natural , 220 adopted , 555 stepchildren ), 3,561 grandchildren , 1,297 brothers or sisters , 1,786 parents , 13 foster children , 2,064 other relatives , 1,607 non-relatives In group quarters: 447 (-1 institutionalized population )
Size of family households: 4,085 2-persons , 2,967 3-persons , 2,122 4-persons , 1,425 5-persons , 529 6-persons , 784 7-or-more-persons
Size of nonfamily households: 4,840 1-person , 643 2-persons , 36 3-persons , 67 4-persons
3,773 married couples with children. single-parent households (1,152 men , 3,086 women ).
60.5% of residents of 90047 zip code speak English at home. of residents speak Spanish at home (62% very well, 16% well, 15% not well, 7% not at all ).of residents speak other Indo-European language at home (78% very well, 4% well, 18% not well ).of residents speak Asian or Pacific Island language at home (39% very well, 31% well, 21% not well, 9% not at all ).of residents speak other language at home (78% very well, 22% well ).
Foreign born population: 9,940 (19.2%)
(48.8%
of them are naturalized citizens )
This zip code:
19.2%Whole state:
26.7%
32% Honduras 30% Costa Rica 17% El Salvador 2% Haiti 2% Guatemala 2% Mexico 1% Grenada 2% American 1% Belizean 1% African 1% Jamaican 1% Nigerian 0% Iranian 0% British
Year of entry for the foreign-born population
1,518 2010 or later 1,624 2000 to 2009 2,452 1990 to 1999 4,577 Before 1990
Major facilities with environmental interests located in this zip code:
ADVANCE PAPERBOX COMPANY (6100 SOUTH GRAMERCY PLACE in LOS ANGELES, CA)
AIR MAJOR (AIRS/AFS) STATE MASTER (California - Hazardous Waste Tracking) - HAZARDOU WASTE PROGRAM CRITERIA AND HAZARDOUS AIR POLLUTANT INVENTORY (Inventory of air pollution sources) Small Quantity Generators, between 100 kg and 1000 kg of hazardous waste/month (Resource Conservation and Recovery Act (tracking hazardous waste)) Business SIC classification: FOLDING PAPERBOARD BOXES, INCLUDING SANITARYBusiness NAICS classification: CORRUGATED AND SOLID FIBER BOX MANUFACTURING.; FOLDING PAPERBOARD BOX MANUFACTURING.Alternative names: ADVANCE PAPER BOX COMPANY
LA S WEST DISTRICT ST MAINT YARD (5860 S WILTON PL in LOS ANGELES, CA)
SUPERFUND (Superfund database) STATE MASTER (California - Hazardous Waste Tracking) - HAZARDOU WASTE PROGRAM Small Quantity Generators, between 100 kg and 1000 kg of hazardous waste/month (Resource Conservation and Recovery Act (tracking hazardous waste)) - notification Organizations: CITY OF LOS ANGELES (CONTACT/OWNER)
Alternative names: DEPT. OF PUBLIC WORKS
JEFFS CLEANERS (2165 W FLORENCE in LOS ANGELES, CA)
STATE MASTER (California - Hazardous Waste Tracking) - HAZARDOU WASTE PROGRAM Small Quantity Generators, between 100 kg and 1000 kg of hazardous waste/month (Resource Conservation and Recovery Act (tracking hazardous waste)) - notification Organizations: CHON HOUG NOE (CONTACT/OWNER)
CALIFORNIA METAL PROCESSING CO (1530 - 1524 W SLAUSON AVE in LOS ANGELES, CA)
STATE MASTER (California - Hazardous Waste Tracking) - HAZARDOU WASTE PROGRAM Small Quantity Generators, between 100 kg and 1000 kg of hazardous waste/month (Resource Conservation and Recovery Act (tracking hazardous waste)) Business NAICS classification: ELECTROPLATING, PLATING, POLISHING, ANODIZING, AND COLORING.Alternative names: CALIFORNIA METAL PROC CO#
ELLINGTON (DUKE) HIGH (CONT.) (1541 W. 110TH ST. in LOS ANGELES, CA)
(National Center for Education Statistics) - STATE ID-1931955 Organizations: LOS ANGELES UNIFIED (SCHOOL DISTRICT)
LA SALLE AVENUE ELEMENTARY (8715 LA SALLE AVE. in LOS ANGELES, CA)
(National Center for Education Statistics) - STATE ID-6017750 Organizations: LOS ANGELES UNIFIED (SCHOOL DISTRICT)
MANHATTAN PLACE ELEMENTARY (1850 W. 96TH ST. in LOS ANGELES, CA)
(National Center for Education Statistics) - STATE ID-6018030 Organizations: LOS ANGELES UNIFIED (SCHOOL DISTRICT)
MANN (HORACE) JUNIOR HIGH (7001 S. ST. ANDREWS PLACE in LOS ANGELES, CA)
(National Center for Education Statistics) - STATE ID-6058119 Organizations: LOS ANGELES UNIFIED (SCHOOL DISTRICT)
MIDDLE COLLEGE HIGH (ALTERNATIVE) (1600 W. IMPERIAL HWY. in LOS ANGELES, CA)
(National Center for Education Statistics) - STATE ID-1995455 Organizations: LOS ANGELES UNIFIED (SCHOOL DISTRICT)
AM & ASSOCIATES (5957 S ST ANDREWS PL in LOS ANGELES, CA)
(Resource Conservation and Recovery Act (tracking hazardous waste)) Organizations: ALVIN C LANG AND MICHELLE LANG (CONTACT/OWNER)
HUGHES PAINT CO (5900 S WESTERN AVE in LOS ANGELES, CA)
(Resource Conservation and Recovery Act (tracking hazardous waste))
MARY GO ROUND CLEANERS (8550 WEST 3RD STREET in LOS ANGELES, CA)
Small Quantity Generators, between 100 kg and 1000 kg of hazardous waste/month (Resource Conservation and Recovery Act (tracking hazardous waste)) Small Quantity Generators, between 100 kg and 1000 kg of hazardous waste/month (Resource Conservation and Recovery Act (tracking hazardous waste)) Organizations: SUEHIRO LLOYD (CONTACT/OWNER)
Alternative names: MERRY GO ROUND
INTERSTATE BRANDS CORP #70 (6007 SOUTH SAINT ANDREWS PLACE in LOS ANGELES, CA)
AIR MINOR (AIRS/AFS) CRITERIA AND HAZARDOUS AIR POLLUTANT INVENTORY (Inventory of air pollution sources) Business SIC classification: BREAD AND OTHER BAKERY PRODUCTS, EXCEPT COOKIES AND CRACKERS
Housing units lacking complete plumbing facilities: 1.5%
Housing units lacking complete kitchen facilities: 2.8%
69.3% Utility gas 23.9% Electricity 4.7% No fuel used 1.0% Bottled, tank, or LP gas 0.6% Solar energy
Population in 1990: 47,975.
Place of birth for U.S.-born residents:
This state: 33,939Northeast: 762Midwest: 1,186South: 5,157West: 367
63% of the 90047 zip code residents lived in the same house 5 years ago.
Out of people who lived in different houses, 93% lived in this county.
Out of people who lived in different counties, 50% lived in California.
95% of the 90047 zip code residents lived in the same house 1 year ago.
Out of people who lived in different houses, 86% moved from this county.
Out of people who lived in different houses, 10% moved from different county within same state.
Out of people who lived in different houses, 4% moved from different state.
Out of people who lived in different houses, 4% moved from abroad.
Private vs. public school enrollment:
Students in private schools in grades 1 to 8 (elementary and middle school): 444
Here:
8.9%California:
10.5%
Students in private schools in grades 9 to 12 (high school): 114
Students in private undergraduate colleges: 563
Here:
18.4%California:
15.9%
Occupation by median earnings in the past 12 months ($)
102,232 Life, physical, and social science occupations 93,083 Management occupations 65,582 Computer and mathematical occupations 65,121 Law enforcement workers including supervisors 61,675 Health diagnosing and treating practitioners and other technical occupations 54,727 Health technologists and technicians
Companies with federal contracts located in this zip code:
OUT OF WOODS PUBLISHING INC (1425 W MANCHESTER AVE in LOS ANGELES, CA; small business)
$10,380 with Army for Books and Pamphlets. Signed on 2005-09-30. Completion date: 2005-10-12.
RESEARCH METAL INDUSTRIES, INC (6065 SOUTH WESTERN AVENUE in LOS ANGELES, CA; small business)
$2,493 with Army for Bushings, Rings, Shims, and Spacers. Signed on 2002-11-22. Completion date: 2003-04-25.
Top industries in this zip code by the number of employees in 2005:
Accommodation and Food Services: Limited-Service Restaurants (100-249 employees: 1 establishment, 50-99 employees: 1 establishment, 20-49 employees: 6 establishments, 10-19 employees: 3 establishments, 5-9 employees: 3 establishments, 1-4 employees: 4 establishments)Health Care and Social Assistance: Child Day Care Services (10-19: 3, 5-9: 7, 1-4: 17)Health Care and Social Assistance: Other Residential Care Facilities (20-49: 3, 10-19: 1, 5-9: 1, 1-4: 2)Other Services (except Public Administration): Religious Organizations (20-49: 1, 10-19: 2, 5-9: 3, 1-4: 14)
People in group quarters in 2010:
71 people in group homes intended for adults
58 people in emergency and transitional shelters (with sleeping facilities) for people experiencing homelessness
38 people in other noninstitutional facilities
27 people in residential treatment centers for adults
21 people in group homes for juveniles (non-correctional)
12 people in nursing facilities/skilled-nursing facilities
3 people in workers' group living quarters and job corps centers
People in group quarters in 2000:
62 people in homes or halfway houses for drug/alcohol abuse
16 people in other noninstitutional group quarters
6 people in homes for the mentally retarded
5 people in other group homes
4 people in homes for the mentally ill
Fatal accident statistics in 2014:
Fatal accident count: 5Vehicles involved in fatal accidents: 7Fatal accidents caused by drunken drivers: 2Fatalities: 5Persons involved in fatal accidents: 8Pedestrians involved in fatal accidents: 2
Fatal accident statistics in 2013:
Fatal accident count: 2Vehicles involved in fatal accidents: 4Fatal accidents caused by drunken drivers: 0Fatalities: 2Persons involved in fatal accidents: 5Pedestrians involved in fatal accidents: 1
Home Mortgage Disclosure Act Aggregated Statistics For Year 2009(Based on 14 full and 16 partial tracts) A) FHA, FSA/RHS & VA B) Conventional C) Refinancings D) Home Improvement Loans E) Loans on Dwellings For 5+ Families F) Non-occupant Loans on Number Average Value Number Average Value Number Average Value Number Average Value Number Average Value Number Average Value
LOANS ORIGINATED 590 $233,172 176 $175,700 614 $203,355 47 $147,452 8 $358,495 102 $174,785 APPLICATIONS APPROVED, NOT ACCEPTED 63 $241,361 44 $186,579 117 $232,511 12 $54,062 0 $0 28 $204,331 APPLICATIONS DENIED 167 $233,084 90 $187,608 653 $253,248 86 $125,414 3 $767,030 88 $212,594 APPLICATIONS WITHDRAWN 130 $224,095 61 $183,073 251 $220,127 22 $203,581 3 $796,117 49 $178,731 FILES CLOSED FOR INCOMPLETENESS 36 $230,587 5 $351,624 103 $242,955 16 $148,778 0 $0 8 $210,448
Aggregated Statistics For Year 2008(Based on 14 full and 16 partial tracts) A) FHA, FSA/RHS & VA B) Conventional C) Refinancings D) Home Improvement Loans E) Loans on Dwellings For 5+ Families F) Non-occupant Loans on G) Loans On Manufactured Number Average Value Number Average Value Number Average Value Number Average Value Number Average Value Number Average Value Number Average Value
LOANS ORIGINATED 154 $288,883 232 $247,182 929 $253,573 146 $150,896 25 $798,318 175 $242,894 0 $0 APPLICATIONS APPROVED, NOT ACCEPTED 29 $304,567 58 $297,008 277 $291,687 36 $68,321 1 $334,560 43 $217,630 4 $83,358 APPLICATIONS DENIED 58 $286,889 218 $290,755 1,217 $305,829 312 $127,895 13 $548,443 193 $276,995 4 $63,830 APPLICATIONS WITHDRAWN 32 $330,762 88 $264,756 378 $272,693 59 $198,083 3 $629,020 57 $264,714 0 $0 FILES CLOSED FOR INCOMPLETENESS 12 $345,998 37 $320,108 161 $303,964 10 $176,576 1 $381,720 27 $279,368 0 $0
Aggregated Statistics For Year 2007(Based on 14 full and 16 partial tracts) A) FHA, FSA/RHS & VA B) Conventional C) Refinancings D) Home Improvement Loans E) Loans on Dwellings For 5+ Families F) Non-occupant Loans on G) Loans On Manufactured Number Average Value Number Average Value Number Average Value Number Average Value Number Average Value Number Average Value Number Average Value
LOANS ORIGINATED 5 $389,000 839 $290,213 3,220 $301,104 545 $217,864 30 $670,706 522 $292,432 0 $0 APPLICATIONS APPROVED, NOT ACCEPTED 1 $63,600 336 $318,949 875 $307,700 94 $238,486 3 $516,637 127 $310,967 7 $50,504 APPLICATIONS DENIED 0 $0 924 $325,554 2,884 $338,973 516 $176,340 12 $431,183 367 $323,610 6 $33,657 APPLICATIONS WITHDRAWN 3 $276,543 306 $323,746 1,154 $322,653 135 $198,993 4 $482,852 138 $332,389 0 $0 FILES CLOSED FOR INCOMPLETENESS 0 $0 126 $320,440 436 $341,313 48 $203,929 0 $0 60 $319,681 0 $0
Aggregated Statistics For Year 2006(Based on 14 full and 16 partial tracts) A) FHA, FSA/RHS & VA B) Conventional C) Refinancings D) Home Improvement Loans E) Loans on Dwellings For 5+ Families F) Non-occupant Loans on G) Loans On Manufactured Number Average Value Number Average Value Number Average Value Number Average Value Number Average Value Number Average Value Number Average Value
LOANS ORIGINATED 2 $340,000 1,972 $256,157 4,771 $291,164 745 $209,427 52 $577,936 744 $288,384 9 $107,521 APPLICATIONS APPROVED, NOT ACCEPTED 0 $0 557 $258,857 1,010 $293,696 124 $173,448 1 $388,170 182 $276,158 2 $56,000 APPLICATIONS DENIED 0 $0 1,310 $278,314 2,784 $303,009 598 $179,367 7 $398,853 406 $317,132 9 $174,740 APPLICATIONS WITHDRAWN 0 $0 592 $269,705 1,936 $298,565 258 $207,449 1 $970,020 210 $296,388 4 $266,820 FILES CLOSED FOR INCOMPLETENESS 0 $0 154 $257,703 526 $285,163 45 $243,844 2 $304,530 64 $264,618 0 $0
Aggregated Statistics For Year 2005(Based on 14 full and 16 partial tracts) A) FHA, FSA/RHS & VA B) Conventional C) Refinancings D) Home Improvement Loans E) Loans on Dwellings For 5+ Families F) Non-occupant Loans on G) Loans On Manufactured Number Average Value Number Average Value Number Average Value Number Average Value Number Average Value Number Average Value Number Average Value
LOANS ORIGINATED 5 $280,540 2,192 $222,386 5,591 $247,920 757 $182,419 51 $716,648 820 $240,704 3 $260,517 APPLICATIONS APPROVED, NOT ACCEPTED 2 $464,880 524 $221,308 1,096 $248,562 106 $166,805 1 $312,810 218 $249,441 2 $55,000 APPLICATIONS DENIED 4 $218,290 1,022 $240,917 2,876 $255,811 536 $155,864 15 $439,762 422 $263,067 2 $110,265 APPLICATIONS WITHDRAWN 0 $0 641 $221,609 2,176 $247,843 340 $193,204 10 $1,058,075 262 $240,798 2 $274,215 FILES CLOSED FOR INCOMPLETENESS 0 $0 127 $239,434 844 $255,663 38 $146,856 1 $585,480 70 $262,451 0 $0
Aggregated Statistics For Year 2004(Based on 14 full and 16 partial tracts) A) FHA, FSA/RHS & VA B) Conventional C) Refinancings D) Home Improvement Loans E) Loans on Dwellings For 5+ Families F) Non-occupant Loans on G) Loans On Manufactured Number Average Value Number Average Value Number Average Value Number Average Value Number Average Value Number Average Value Number Average Value
LOANS ORIGINATED 31 $235,970 1,742 $179,501 5,553 $198,789 644 $151,236 47 $669,207 782 $194,652 0 $0 APPLICATIONS APPROVED, NOT ACCEPTED 8 $229,894 496 $190,919 1,227 $197,711 91 $125,317 1 $127,240 199 $210,157 0 $0 APPLICATIONS DENIED 7 $270,034 819 $184,016 2,725 $197,118 542 $110,812 6 $249,592 305 $197,147 3 $46,650 APPLICATIONS WITHDRAWN 15 $206,437 403 $189,376 2,085 $191,176 235 $108,677 5 $540,130 151 $192,713 1 $161,990 FILES CLOSED FOR INCOMPLETENESS 4 $187,725 67 $200,727 713 $197,455 45 $151,566 1 $350,180 51 $221,607 0 $0
Aggregated Statistics For Year 2003(Based on 14 full and 16 partial tracts) A) FHA, FSA/RHS & VA B) Conventional C) Refinancings D) Home Improvement Loans E) Loans on Dwellings For 5+ Families F) Non-occupant Loans on Number Average Value Number Average Value Number Average Value Number Average Value Number Average Value Number Average Value
LOANS ORIGINATED 139 $204,955 1,414 $152,474 5,831 $156,251 136 $55,508 49 $395,493 718 $152,831 APPLICATIONS APPROVED, NOT ACCEPTED 14 $154,019 374 $162,608 1,140 $157,716 61 $47,145 1 $230,010 215 $168,474 APPLICATIONS DENIED 38 $218,483 662 $156,859 2,883 $158,493 234 $42,231 11 $320,820 350 $157,314 APPLICATIONS WITHDRAWN 36 $209,696 279 $165,998 1,990 $160,485 72 $63,836 2 $319,000 169 $156,799 FILES CLOSED FOR INCOMPLETENESS 10 $195,205 68 $159,148 338 $159,786 18 $43,283 0 $0 46 $146,930
Aggregated Statistics For Year 2002(Based on 14 full and 16 partial tracts) A) FHA, FSA/RHS & VA B) Conventional C) Refinancings D) Home Improvement Loans E) Loans on Dwellings For 5+ Families F) Non-occupant Loans on Number Average Value Number Average Value Number Average Value Number Average Value Number Average Value Number Average Value
LOANS ORIGINATED 273 $173,504 1,044 $132,151 3,098 $139,963 138 $36,911 35 $355,912 382 $130,150 APPLICATIONS APPROVED, NOT ACCEPTED 52 $145,616 313 $135,904 722 $136,146 22 $18,734 3 $126,330 88 $137,292 APPLICATIONS DENIED 65 $172,747 532 $134,445 2,012 $136,625 236 $23,883 9 $287,628 183 $134,868 APPLICATIONS WITHDRAWN 53 $181,961 254 $132,554 1,500 $142,329 84 $49,432 1 $490,920 103 $142,280 FILES CLOSED FOR INCOMPLETENESS 8 $166,419 95 $133,397 408 $139,270 2 $159,325 3 $887,603 45 $126,899
Aggregated Statistics For Year 2001(Based on 14 full and 16 partial tracts) A) FHA, FSA/RHS & VA B) Conventional C) Refinancings D) Home Improvement Loans E) Loans on Dwellings For 5+ Families F) Non-occupant Loans on Number Average Value Number Average Value Number Average Value Number Average Value Number Average Value Number Average Value
LOANS ORIGINATED 373 $159,697 673 $117,468 2,314 $125,694 122 $26,877 21 $291,124 331 $124,273 APPLICATIONS APPROVED, NOT ACCEPTED 45 $174,410 172 $118,400 439 $129,465 27 $37,789 4 $181,000 57 $130,874 APPLICATIONS DENIED 111 $162,893 407 $129,568 2,081 $121,250 311 $23,248 9 $204,288 221 $125,534 APPLICATIONS WITHDRAWN 96 $153,856 199 $123,096 1,262 $132,049 138 $36,873 1 $290,320 90 $122,444 FILES CLOSED FOR INCOMPLETENESS 42 $164,833 47 $104,635 386 $130,237 10 $41,992 6 $526,867 24 $105,472
Aggregated Statistics For Year 2000(Based on 14 full and 16 partial tracts) A) FHA, FSA/RHS & VA B) Conventional C) Refinancings D) Home Improvement Loans E) Loans on Dwellings For 5+ Families F) Non-occupant Loans on Number Average Value Number Average Value Number Average Value Number Average Value Number Average Value Number Average Value
LOANS ORIGINATED 481 $148,871 641 $110,995 1,119 $109,060 141 $31,509 17 $223,640 201 $120,397 APPLICATIONS APPROVED, NOT ACCEPTED 54 $163,886 132 $122,004 308 $106,356 121 $29,746 0 $0 53 $101,935 APPLICATIONS DENIED 85 $157,252 336 $116,327 1,550 $101,169 297 $23,613 12 $192,573 150 $117,754 APPLICATIONS WITHDRAWN 90 $149,179 185 $108,067 673 $107,316 34 $46,510 9 $164,900 63 $117,123 FILES CLOSED FOR INCOMPLETENESS 19 $184,795 41 $109,492 356 $126,151 7 $30,179 0 $0 27 $129,820
Aggregated Statistics For Year 1999(Based on 5 full and 14 partial tracts) A) FHA, FSA/RHS & VA B) Conventional C) Refinancings D) Home Improvement Loans E) Loans on Dwellings For 5+ Families F) Non-occupant Loans on Number Average Value Number Average Value Number Average Value Number Average Value Number Average Value Number Average Value
LOANS ORIGINATED 246 $141,627 274 $106,216 860 $104,741 162 $16,832 10 $188,900 118 $107,956 APPLICATIONS APPROVED, NOT ACCEPTED 22 $136,790 67 $124,792 294 $104,658 57 $22,748 3 $126,290 39 $110,035 APPLICATIONS DENIED 53 $142,357 173 $122,227 860 $105,450 173 $22,585 5 $143,214 103 $118,934 APPLICATIONS WITHDRAWN 42 $143,316 107 $118,701 354 $109,378 21 $29,705 2 $182,600 41 $112,908 FILES CLOSED FOR INCOMPLETENESS 14 $152,356 17 $96,867 350 $108,936 5 $30,794 0 $0 25 $118,750
Private Mortgage Insurance Companies Aggregated Statistics For Year 2009(Based on 12 full and 14 partial tracts) A) Conventional B) Refinancings C) Non-occupant Loans on Number Average Value Number Average Value Number Average Value
LOANS ORIGINATED 44 $207,967 4 $228,175 0 $0 APPLICATIONS APPROVED, NOT ACCEPTED 26 $286,517 3 $342,310 1 $192,130 APPLICATIONS DENIED 15 $251,505 7 $266,954 0 $0 APPLICATIONS WITHDRAWN 10 $260,600 0 $0 0 $0 FILES CLOSED FOR INCOMPLETENESS 0 $0 3 $283,637 0 $0
Aggregated Statistics For Year 2008(Based on 14 full and 16 partial tracts) A) Conventional B) Refinancings C) Non-occupant Loans on Number Average Value Number Average Value Number Average Value
LOANS ORIGINATED 114 $326,711 54 $379,936 6 $366,160 APPLICATIONS APPROVED, NOT ACCEPTED 101 $376,467 70 $405,657 7 $436,049 APPLICATIONS DENIED 21 $306,524 29 $365,259 7 $400,687 APPLICATIONS WITHDRAWN 11 $301,905 12 $393,642 2 $409,015 FILES CLOSED FOR INCOMPLETENESS 2 $396,305 1 $262,840 1 $262,840
Aggregated Statistics For Year 2007(Based on 14 full and 16 partial tracts) A) Conventional B) Refinancings C) Non-occupant Loans on Number Average Value Number Average Value Number Average Value
LOANS ORIGINATED 90 $400,030 76 $424,693 18 $327,594 APPLICATIONS APPROVED, NOT ACCEPTED 15 $361,953 36 $442,023 5 $341,770 APPLICATIONS DENIED 10 $428,090 11 $394,977 4 $425,385 APPLICATIONS WITHDRAWN 6 $420,702 6 $476,323 1 $224,720 FILES CLOSED FOR INCOMPLETENESS 0 $0 0 $0 0 $0
Aggregated Statistics For Year 2006(Based on 14 full and 16 partial tracts) A) Conventional B) Refinancings C) Non-occupant Loans on Number Average Value Number Average Value Number Average Value
LOANS ORIGINATED 27 $390,324 33 $420,475 4 $310,460 APPLICATIONS APPROVED, NOT ACCEPTED 11 $441,785 16 $393,490 4 $469,875 APPLICATIONS DENIED 0 $0 5 $421,106 0 $0 APPLICATIONS WITHDRAWN 2 $503,800 10 $414,153 2 $503,800 FILES CLOSED FOR INCOMPLETENESS 0 $0 0 $0 0 $0
Aggregated Statistics For Year 2005(Based on 14 full and 16 partial tracts) A) Conventional B) Refinancings C) Non-occupant Loans on Number Average Value Number Average Value Number Average Value
LOANS ORIGINATED 45 $325,469 57 $329,791 5 $253,436 APPLICATIONS APPROVED, NOT ACCEPTED 22 $293,986 9 $302,699 3 $339,653 APPLICATIONS DENIED 4 $424,170 0 $0 2 $573,620 APPLICATIONS WITHDRAWN 8 $351,096 13 $332,305 0 $0 FILES CLOSED FOR INCOMPLETENESS 0 $0 2 $309,875 0 $0
Aggregated Statistics For Year 2004(Based on 14 full and 16 partial tracts) A) Conventional B) Refinancings C) Non-occupant Loans on Number Average Value Number Average Value Number Average Value
LOANS ORIGINATED 126 $251,189 81 $257,265 17 $240,715 APPLICATIONS APPROVED, NOT ACCEPTED 56 $249,604 63 $219,144 14 $243,693 APPLICATIONS DENIED 4 $294,428 1 $121,610 3 $192,537 APPLICATIONS WITHDRAWN 13 $234,999 7 $195,350 2 $171,930 FILES CLOSED FOR INCOMPLETENESS 6 $292,977 1 $105,730 0 $0
Aggregated Statistics For Year 2003(Based on 14 full and 16 partial tracts) A) Conventional B) Refinancings C) Non-occupant Loans on Number Average Value Number Average Value Number Average Value
LOANS ORIGINATED 263 $200,915 197 $186,416 29 $168,063 APPLICATIONS APPROVED, NOT ACCEPTED 46 $187,619 72 $185,032 4 $145,240 APPLICATIONS DENIED 14 $218,645 5 $195,850 2 $221,910 APPLICATIONS WITHDRAWN 16 $219,721 9 $196,528 3 $138,173 FILES CLOSED FOR INCOMPLETENESS 0 $0 0 $0 0 $0
Aggregated Statistics For Year 2002(Based on 14 full and 16 partial tracts) A) Conventional B) Refinancings C) Non-occupant Loans on Number Average Value Number Average Value Number Average Value
LOANS ORIGINATED 337 $169,938 204 $164,858 27 $166,171 APPLICATIONS APPROVED, NOT ACCEPTED 58 $165,704 99 $163,625 13 $168,558 APPLICATIONS DENIED 7 $155,836 12 $156,232 4 $133,472 APPLICATIONS WITHDRAWN 19 $153,658 16 $168,108 2 $122,000 FILES CLOSED FOR INCOMPLETENESS 1 $149,940 4 $227,822 0 $0
Aggregated Statistics For Year 2001(Based on 14 full and 16 partial tracts) A) Conventional B) Refinancings C) Non-occupant Loans on Number Average Value Number Average Value Number Average Value
LOANS ORIGINATED 268 $148,673 188 $152,492 22 $138,455 APPLICATIONS APPROVED, NOT ACCEPTED 47 $162,615 81 $149,029 6 $168,633 APPLICATIONS DENIED 20 $154,526 23 $153,960 7 $114,137 APPLICATIONS WITHDRAWN 7 $156,444 4 $203,670 0 $0 FILES CLOSED FOR INCOMPLETENESS 1 $68,820 3 $134,787 0 $0
Aggregated Statistics For Year 2000(Based on 14 full and 16 partial tracts) A) Conventional B) Refinancings C) Non-occupant Loans on Number Average Value Number Average Value Number Average Value
LOANS ORIGINATED 212 $135,390 163 $134,684 41 $117,898 APPLICATIONS APPROVED, NOT ACCEPTED 26 $134,940 31 $137,055 7 $119,574 APPLICATIONS DENIED 17 $129,279 10 $155,916 4 $92,870 APPLICATIONS WITHDRAWN 9 $141,414 5 $119,346 0 $0 FILES CLOSED FOR INCOMPLETENESS 3 $148,817 0 $0 0 $0
Aggregated Statistics For Year 1999(Based on 5 full and 14 partial tracts) A) Conventional B) Refinancings C) Non-occupant Loans on Number Average Value Number Average Value Number Average Value
LOANS ORIGINATED 70 $128,727 70 $132,585 9 $99,322 APPLICATIONS APPROVED, NOT ACCEPTED 13 $135,749 20 $127,738 2 $153,085 APPLICATIONS DENIED 5 $137,228 10 $135,604 2 $79,405 APPLICATIONS WITHDRAWN 1 $150,170 3 $125,093 0 $0 FILES CLOSED FOR INCOMPLETENESS 2 $86,065 2 $159,325 0 $0
2005 - 2018 National Fire Incident Reporting System (NFIRS) incidents See full 2006 National Fire Incident Reporting System statistics for zip code 90047, California
Most common first names in zip code 90047 among deceased individuals Name Count Lived (average)
James 287 69.8 years Mary 243 76.3 years John 206 72.6 years William 177 73.2 years Willie 167 72.9 years Robert 156 68.6 years George 142 72.8 years Charles 132 69.0 years Frank 94 74.3 years Joseph 91 71.0 years
Most common last names in zip code 90047 among deceased individuals Last name Count Lived (average)
Williams 233 71.7 years Johnson 206 73.2 years Jones 189 71.7 years Smith 177 71.4 years Jackson 123 74.1 years Brown 120 70.3 years Taylor 92 71.7 years Davis 89 69.9 years Harris 84 69.8 years Thomas 69 69.1 years
Businesses in zip code 90047
Name Count Name Count
AutoZone 1 Little Caesars Pizza 2 Baskin-Robbins 1 McDonald's 1 Burger King 2 Nike 5 Carl\s Jr. 1 Penske 1 Church's Chicken 2 Pizza Hut 1 Domino's Pizza 1 RadioShack 1 FedEx 1 Sprint Nextel 1 GameStop 1 Starbucks 1 H&R Block 2 Subway 1 Home Depot 1 T-Mobile 1 IHOP 1 Taco Bell 2 Jamba Juice 1 Walgreens 1 Kroger 3

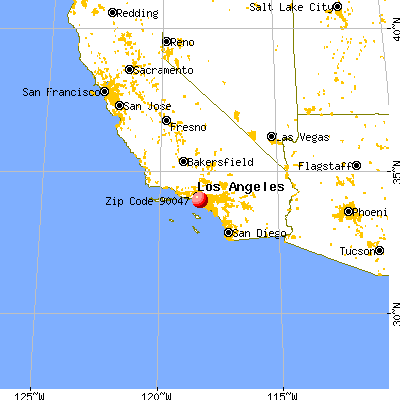


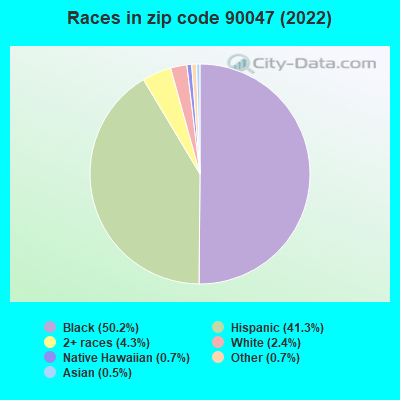


 Nearest zip codes: 90044, 90305, 90303, 90003, 90043, 90061.
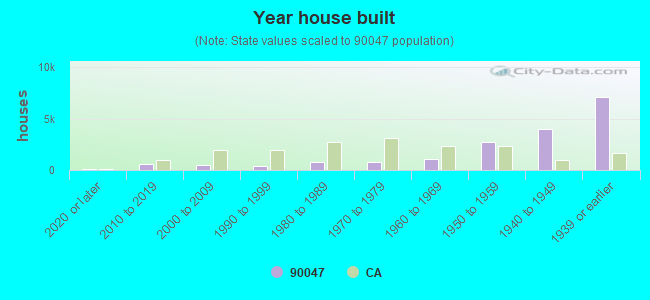

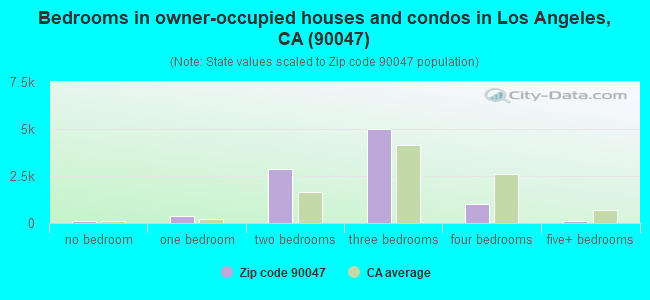
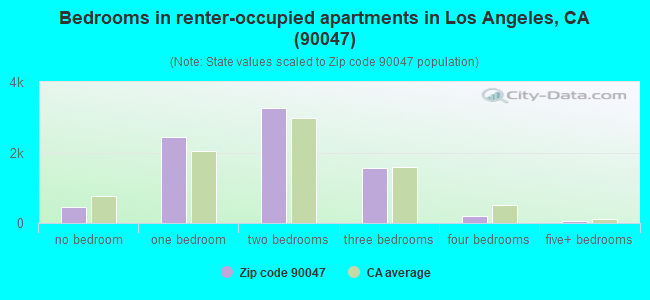
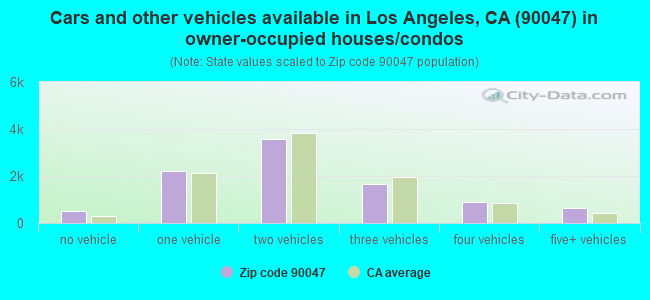
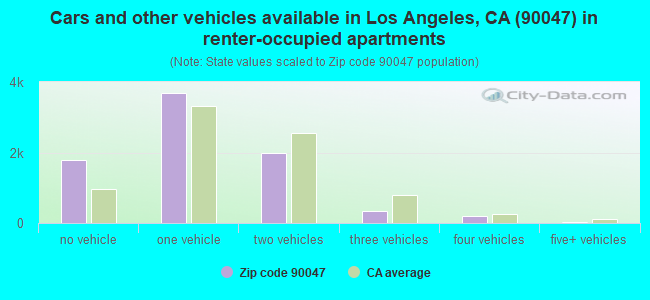


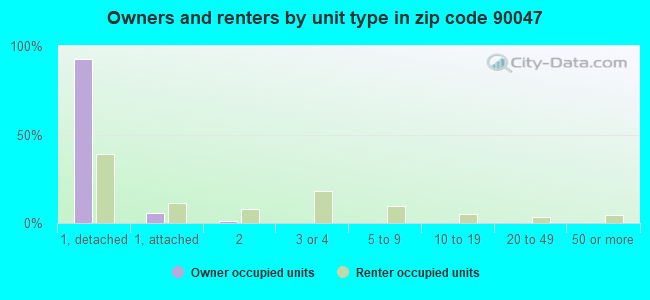
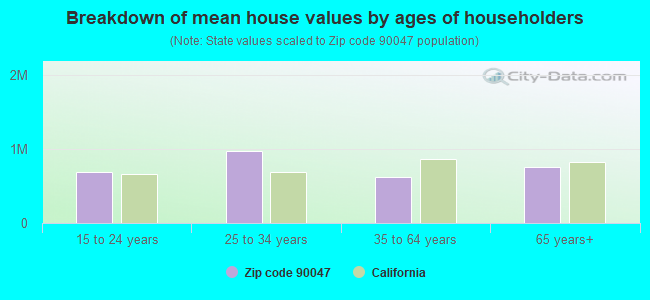


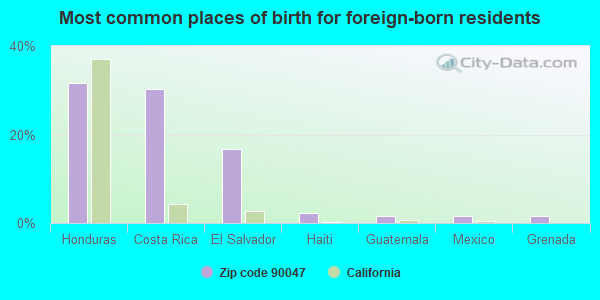
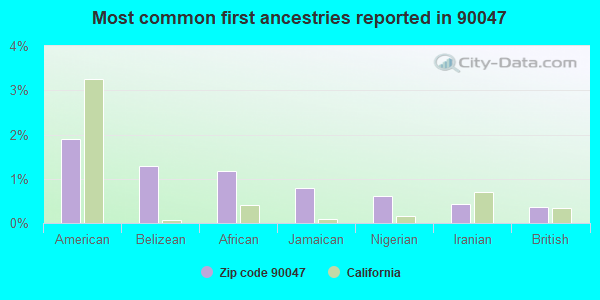
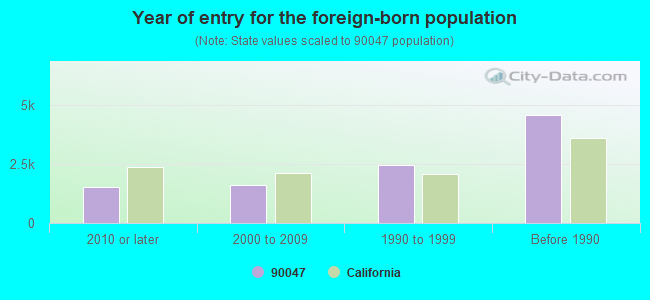

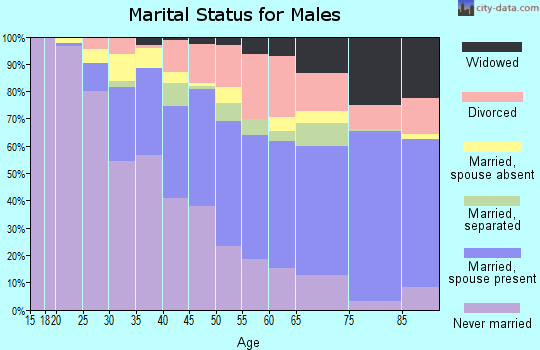
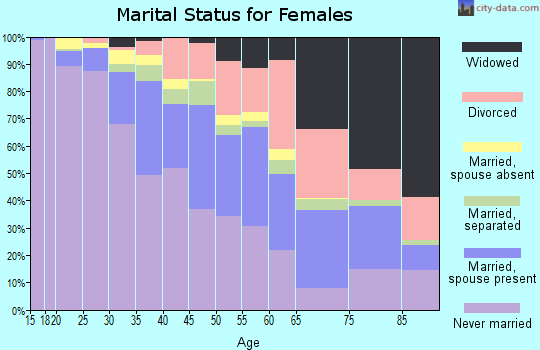
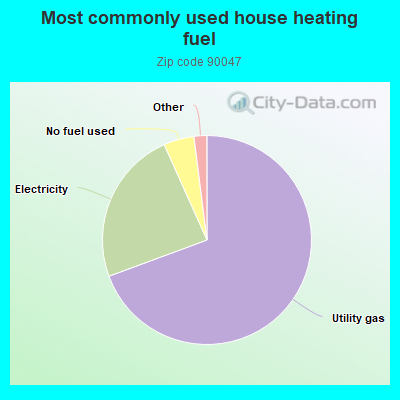
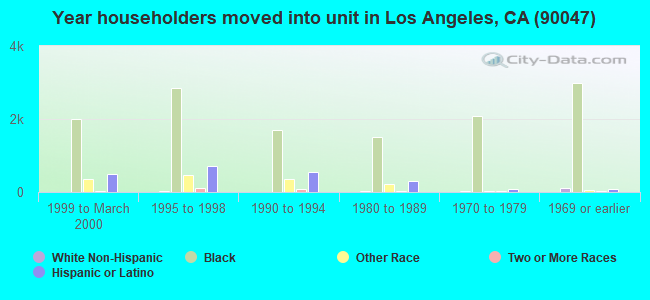
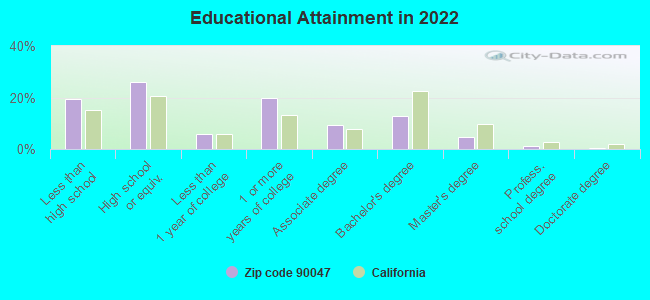
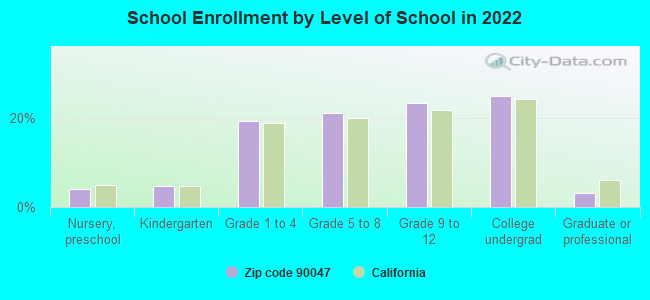
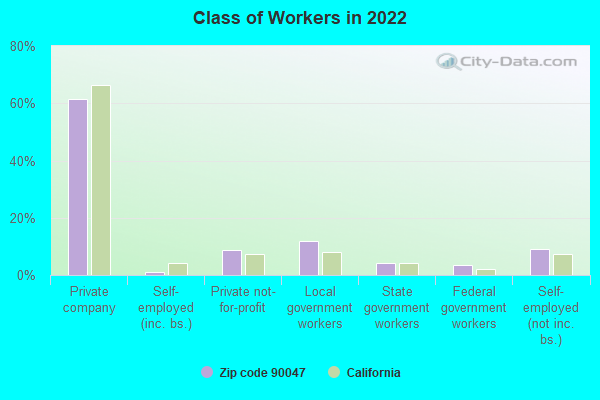
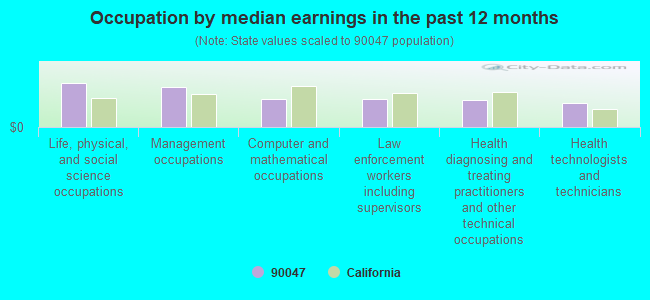
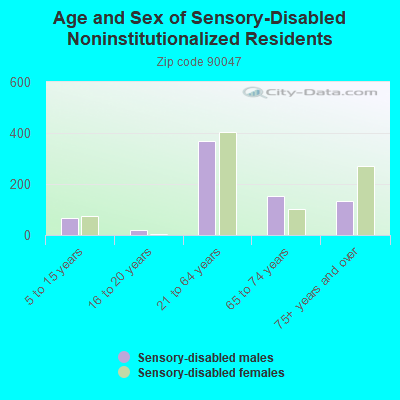
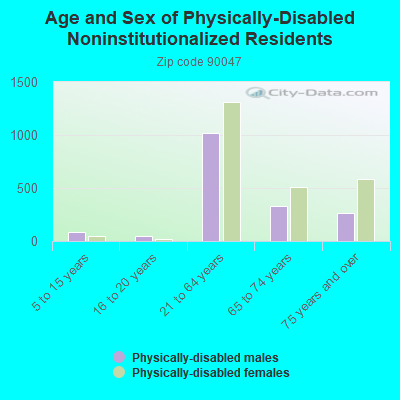
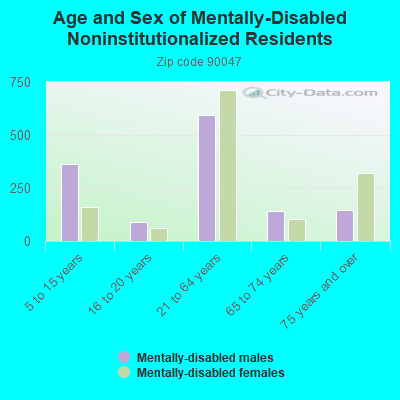
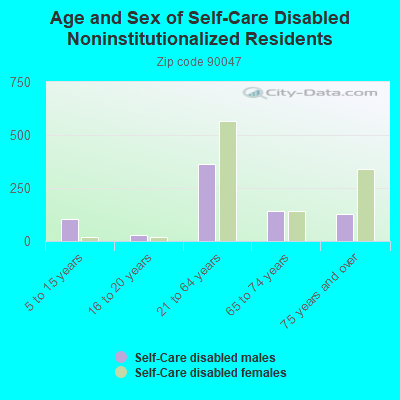
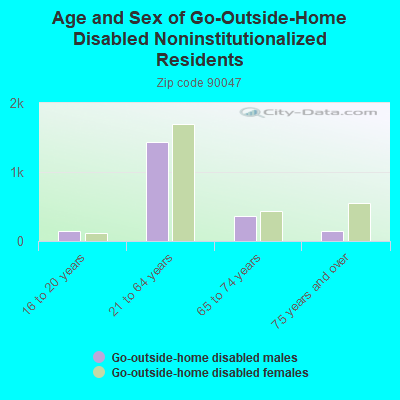
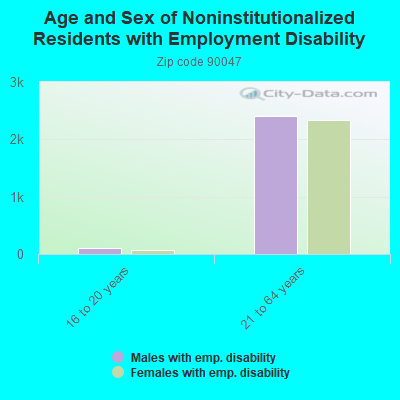
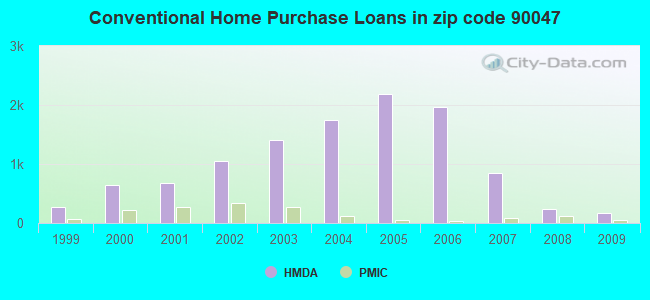
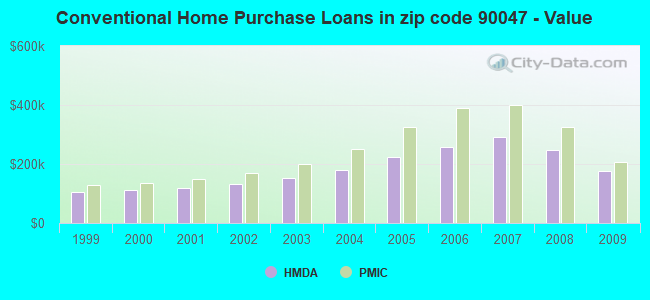
 Based on the data from the years 2005 - 2018 the average number of fire incidents per year is 138. The highest number of fire incidents - 213 took place in 2018, and the least - 98 in 2012. The data has a growing trend.
 When looking into fire subcategories, the most reports belonged to: Structure Fires (43.8%), and Mobile Property/Vehicle Fires (29.0%).