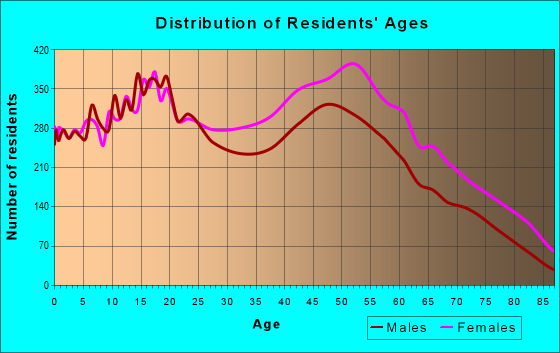
Estimated zip code population in 2022: 44,091 Zip code population in 2010: 44,789 Zip code population in 2000: 44,761
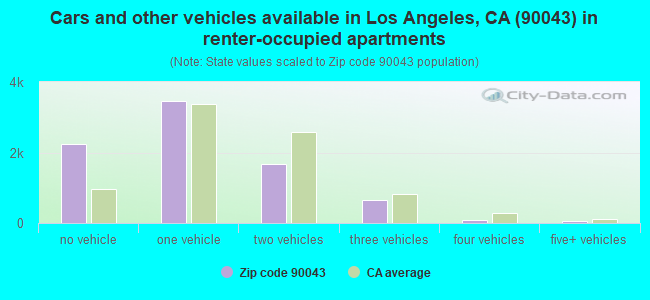
Houses and condos: 18,875 Renter-occupied apartments: 8,143
% of renters here:
47%
State:
44%
March 2022 cost of living index in zip code 90043: 141.6 (very high, U.S. average is 100)
Land area: 4.1 sq. mi. Water area: 0.0 sq. mi.
Population density: 10,667 people per square mile
(high).
OSM Map
General Map
Google Map
MSN Map
OSM Map
General Map
Google Map
MSN Map
OSM Map
General Map
Google Map
MSN Map
OSM Map
General Map
Google Map
MSN Map
Please wait while loading the map...
Real estate property taxes paid for housing units in 2022:
This zip code:
0.5% ($4,422)
California:
0.7% ($4,831)
Median real estate property taxes paid for housing units with mortgages in 2022: $5,292 (0.6%) Median real estate property taxes paid for housing units with no mortgage in 2022: $3,102 (0.4%)
Averages for the 2020 tax year for zip code 90043, filed in 2021:
Average Adjusted Gross Income (AGI) in 2020: $58,868 (Individual Income Tax Returns)
Here:
$58,868
State:
$95,910
Salary/wage: $55,035 (reported on 78.0% of returns)
Here:
$55,035
State:
$77,331
(% of AGI for various income ranges: 1181.5% for AGIs below $25k, 3985.3% for AGIs $25k-50k, 7531.1% for AGIs $50k-75k, 11312.9% for AGIs $75k-100k, 19812.3% for AGIs $100k-200k, 83748.2% for AGIs over 200k)
Taxable interest for individuals: $528 (reported on 27.3% of returns)
This zip code:
$528
California:
$2,294
(% of AGI for various income ranges: 5.0% for AGIs below $25k, 7.7% for AGIs $25k-50k, 20.1% for AGIs $50k-75k, 34.5% for AGIs $75k-100k, 78.8% for AGIs $100k-200k, 347.1% for AGIs over 200k)
Ordinary dividends: $2,300 (reported on 9.6% of returns)
Here:
$2,300
State:
$10,949
(% of AGI for various income ranges: 4.8% for AGIs below $25k, 6.3% for AGIs $25k-50k, 21.6% for AGIs $50k-75k, 30.8% for AGIs $75k-100k, 149.3% for AGIs $100k-200k, 693.2% for AGIs over 200k)
Net capital gain/loss in AGI: +$16,991 (reported on 9.8% of returns)
Here:
+$16,991
State:
+$49,306
(% of AGI for various income ranges: 0.4% for AGIs below $25k, 4.3% for AGIs $25k-50k, 23.3% for AGIs $50k-75k, 133.6% for AGIs $75k-100k, 328.2% for AGIs $100k-200k, 11248.6% for AGIs over 200k)
Profit/loss from business: +$5,889 (reported on 24.6% of returns)
Here:
+$5,889
State:
+$15,671
(% of AGI for various income ranges: 172.0% for AGIs below $25k, 82.9% for AGIs $25k-50k, 130.1% for AGIs $50k-75k, 254.1% for AGIs $75k-100k, 466.0% for AGIs $100k-200k, 3226.4% for AGIs over 200k)
Taxable individual retirement arrangement distribution: $17,636 (reported on 4.0% of returns)
90043:
$17,636
California:
$23,505
(% of AGI for various income ranges: 17.9% for AGIs below $25k, 35.6% for AGIs $25k-50k, 116.4% for AGIs $50k-75k, 229.2% for AGIs $75k-100k, 466.6% for AGIs $100k-200k, 1232.9% for AGIs over 200k)
Self-employed (Keogh) retirement plans: $23,683 (reported on 0.3% of returns)
90043:
$23,683
California:
$30,163
(% of AGI for various income ranges: 40.4% for AGIs $75k-100k, 361.8% for AGIs over 200k)
Total itemized deductions: $30,914 (reported on 19.1% of returns)
Here:
$30,914
State:
$39,517
(% of AGI for various income ranges: 111.7% for AGIs below $25k, 296.4% for AGIs $25k-50k, 952.8% for AGIs $50k-75k, 1984.6% for AGIs $75k-100k, 3900.2% for AGIs $100k-200k, 10418.9% for AGIs over 200k)
Charity contributions: $6,768 (reported on 16.4% of returns)
Here:
$6,768
State:
$12,598
(% of AGI for various income ranges: 10.0% for AGIs below $25k, 51.9% for AGIs $25k-50k, 161.1% for AGIs $50k-75k, 359.4% for AGIs $75k-100k, 734.6% for AGIs $100k-200k, 2391.4% for AGIs over 200k)
Taxes paid: $8,112 (reported on 19.1% of returns)
90043:
$8,112
State:
$8,807
(% of AGI for various income ranges: 23.5% for AGIs below $25k, 68.0% for AGIs $25k-50k, 247.4% for AGIs $50k-75k, 579.3% for AGIs $75k-100k, 1113.3% for AGIs $100k-200k, 2424.3% for AGIs over 200k)
Earned income credit: $2,190 (reported on 21.2% of returns)
Here:
$2,190
State:
$2,074
(% of AGI for various income ranges: 131.4% for AGIs below $25k, 76.7% for AGIs $25k-50k)
Percentage of individuals using paid preparers for their 2020 taxes: 89.9%
Here:
90%
State:
92%
(% for various income ranges: 88.3% for AGIs below $25k, 90.7% for AGIs $25k-50k, 90.0% for AGIs $50k-75k, 90.4% for AGIs $75k-100k, 91.1% for AGIs $100k-200k, 92.6% for AGIs over 200k)
Averages for the 2012 tax year for zip code 90043, filed in 2013:
Average Adjusted Gross Income (AGI) in 2012: $42,039 (Individual Income Tax Returns)
Here:
$42,039
State:
$72,726
Salary/wage: $39,999 (reported on 79.4% of returns)
Here:
$39,999
State:
$59,079
(% of AGI for various income ranges: 70.7% for AGIs below $25k, 82.9% for AGIs $25k-50k, 79.0% for AGIs $50k-75k, 73.5% for AGIs $75k-100k, 74.2% for AGIs $100k-200k, 64.5% for AGIs over 200k)
Taxable interest for individuals: $480 (reported on 24.3% of returns)
This zip code:
$480
California:
$2,146
(% of AGI for various income ranges: 0.3% for AGIs below $25k, 0.2% for AGIs $25k-50k, 0.3% for AGIs $50k-75k, 0.3% for AGIs $75k-100k, 0.2% for AGIs $100k-200k, 0.5% for AGIs over 200k)
Ordinary dividends: $1,486 (reported on 7.4% of returns)
Here:
$1,486
State:
$9,308
(% of AGI for various income ranges: 0.2% for AGIs below $25k, 0.1% for AGIs $25k-50k, 0.2% for AGIs $50k-75k, 0.3% for AGIs $75k-100k, 0.3% for AGIs $100k-200k, 0.6% for AGIs over 200k)
Net capital gain/loss in AGI: +$5,035 (reported on 5.6% of returns)
Here:
+$5,035
State:
+$30,460
(% of AGI for various income ranges: 0.6% for AGIs $100k-200k, 5.9% for AGIs over 200k)
Profit/loss from business: +$6,987 (reported on 21.2% of returns)
Here:
+$6,987
State:
+$17,064
(% of AGI for various income ranges: 15.5% for AGIs below $25k, 1.8% for AGIs $25k-50k, 1.2% for AGIs $50k-75k, 1.6% for AGIs $75k-100k, 1.0% for AGIs $100k-200k, 2.2% for AGIs over 200k)
Taxable individual retirement arrangement distribution: $14,824 (reported on 4.8% of returns)
90043:
$14,824
California:
$19,557
(% of AGI for various income ranges: 1.0% for AGIs below $25k, 1.3% for AGIs $25k-50k, 1.4% for AGIs $50k-75k, 1.8% for AGIs $75k-100k, 2.6% for AGIs $100k-200k, 2.2% for AGIs over 200k)
Self-employment retirement plans: $20,325 (reported on 0.2% of returns)
90043:
$20,325
California:
$24,530
Total itemized deductions: $24,935 (33% of AGI, reported on 34.7% of returns)
Here:
$24,935
State:
$34,004
Here:
32.8% of AGI
State:
22.7% of AGI
(% of AGI for various income ranges: 10.4% for AGIs below $25k, 18.0% for AGIs $25k-50k, 23.9% for AGIs $50k-75k, 24.7% for AGIs $75k-100k, 24.8% for AGIs $100k-200k, 20.5% for AGIs over 200k)
Charity contributions: $4,231 (reported on 29.4% of returns)
Here:
$4,231
State:
$4,659
(% of AGI for various income ranges: 1.1% for AGIs below $25k, 2.3% for AGIs $25k-50k, 3.7% for AGIs $50k-75k, 3.6% for AGIs $75k-100k, 3.7% for AGIs $100k-200k, 3.1% for AGIs over 200k)
Taxes paid: $6,965 (reported on 34.7% of returns)
90043:
$6,965
State:
$14,448
(% of AGI for various income ranges: 2.1% for AGIs below $25k, 3.6% for AGIs $25k-50k, 5.9% for AGIs $50k-75k, 7.1% for AGIs $75k-100k, 8.2% for AGIs $100k-200k, 8.8% for AGIs over 200k)
Earned income credit: $2,523 (reported on 28.6% of returns)
Here:
$2,523
State:
$2,286
(% of AGI for various income ranges: 10.0% for AGIs below $25k, 1.1% for AGIs $25k-50k)
Percentage of individuals using paid preparers for their 2012 taxes: 69.0%
Here:
69%
State:
64%
(% for various income ranges: 66.7% for AGIs below $25k, 69.3% for AGIs $25k-50k, 70.9% for AGIs $50k-75k, 72.4% for AGIs $75k-100k, 75.7% for AGIs $100k-200k, 75.0% for AGIs over 200k)
Averages for the 2004 tax year for zip code 90043, filed in 2005:
Average Adjusted Gross Income (AGI) in 2004: $36,774 (Individual Income Tax Returns)
Here:
$36,774
State:
$58,600
Salary/wage: $35,423 (reported on 82.3% of returns)
Here:
$35,423
State:
$49,455
(% of AGI for various income ranges: 101.5% for AGIs below $10k, 77.2% for AGIs $10k-25k, 84.4% for AGIs $25k-50k, 81.2% for AGIs $50k-75k, 78.5% for AGIs $75k-100k, 71.5% for AGIs over 100k)
Taxable interest for individuals: $774 (reported on 32.8% of returns)
This zip code:
$774
California:
$2,365
(% of AGI for various income ranges: 3.1% for AGIs below $10k, 0.6% for AGIs $10k-25k, 0.6% for AGIs $25k-50k, 0.7% for AGIs $50k-75k, 0.6% for AGIs $75k-100k, 0.7% for AGIs over 100k)
Taxable dividends: $1,475 (reported on 9.8% of returns)
Here:
$1,475
State:
$4,746
(% of AGI for various income ranges: 0.7% for AGIs below $10k, 0.2% for AGIs $10k-25k, 0.2% for AGIs $25k-50k, 0.2% for AGIs $50k-75k, 0.4% for AGIs $75k-100k, 0.9% for AGIs over 100k)
Net capital gain/loss: +$10,323 (reported on 7.1% of returns)
Here:
+$10,323
State:
+$23,418
(% of AGI for various income ranges: 0.5% for AGIs below $10k, 0.1% for AGIs $10k-25k, 0.0% for AGIs $25k-50k, 0.6% for AGIs $50k-75k, 0.8% for AGIs $75k-100k, 7.3% for AGIs over 100k)
Profit/loss from business: +$5,819 (reported on 18.5% of returns)
Here:
+$5,819
State:
+$16,826
(% of AGI for various income ranges: 18.9% for AGIs below $10k, 8.6% for AGIs $10k-25k, 1.7% for AGIs $25k-50k, 1.1% for AGIs $50k-75k, 0.9% for AGIs $75k-100k, 2.3% for AGIs over 100k)
IRA payment deduction: $2,021 (reported on 1.3% of returns)
90043:
$2,021
California:
$3,192
(% of AGI for various income ranges: 0.0% for AGIs below $10k, 0.1% for AGIs $10k-25k, 0.1% for AGIs $25k-50k, 0.1% for AGIs $50k-75k, 0.1% for AGIs $75k-100k, 0.0% for AGIs over 100k)
Self-employed pension: $12,766 (reported on 0.3% of returns)
Here:
$12,766
California:
$17,688
Total itemized deductions: $22,631 (36% of AGI, reported on 39.4% of returns)
Here:
$22,631
State:
$28,113
Here:
36.1% of AGI
State:
25.3% of AGI
(% of AGI for various income ranges: 23.1% for AGIs below $10k, 13.7% for AGIs $10k-25k, 23.0% for AGIs $25k-50k, 30.0% for AGIs $50k-75k, 30.1% for AGIs $75k-100k, 24.1% for AGIs over 100k)
Charity contributions deductions: $4,150 (6% of AGI, reported on 36.0% of returns)
Here:
$4,150
State:
$3,923
Here:
6.4% of AGI
State:
3.3% of AGI
(% of AGI for various income ranges: 1.5% for AGIs below $10k, 1.7% for AGIs $10k-25k, 3.8% for AGIs $25k-50k, 5.2% for AGIs $50k-75k, 5.3% for AGIs $75k-100k, 4.4% for AGIs over 100k)
Total tax: $4,565 (reported on 66.8% of returns)
90043:
$4,565
State:
$10,761
(% of AGI for various income ranges: 4.9% for AGIs below $10k, 3.4% for AGIs $10k-25k, 5.2% for AGIs $25k-50k, 7.8% for AGIs $50k-75k, 9.4% for AGIs $75k-100k, 14.8% for AGIs over 100k)
Earned income credit: $2,002 (reported on 28.4% of returns)
Here:
$2,002
State:
$1,763
Percentage of individuals using paid preparers for their 2004 taxes: 75.1%
Here:
75%
State:
66%
(% for various income ranges: 70.0% for AGIs below $10k, 77.3% for AGIs $10k-25k, 74.7% for AGIs $25k-50k, 77.1% for AGIs $50k-75k, 77.3% for AGIs $75k-100k, 75.4% for AGIs over 100k)
Likely homosexual households (counted as self-reported same-sex unmarried-partner households)
Lesbian couples: 0.3% of all households
Gay men: 0.4% of all households
Household received Food Stamps/SNAP in the past 12 months: 3,876 Household did not receive Food Stamps/SNAP in the past 12 months: 13,909
Women who had a birth in the past 12 months: 302 (227 now married, 75 unmarried) Women who did not have a birth in the past 12 months: 9,960 (3,513 now married, 6,464 unmarried)
Housing units in zip code 90043 with a mortgage: 7,053 (655 second mortgage, 48 home equity loan, 487 both second mortgage and home equity loan) Houses without a mortgage: 45
Median monthly owner costs for units with a mortgage: $2,843 Median monthly owner costs for units without a mortgage: $743
Residents with income below the poverty level in 2022:
This zip code:
16.9%
Whole state:
12.2%
Residents with income below 50% of the poverty level in 2022:
This zip code:
7.2%
Whole state:
6.2%
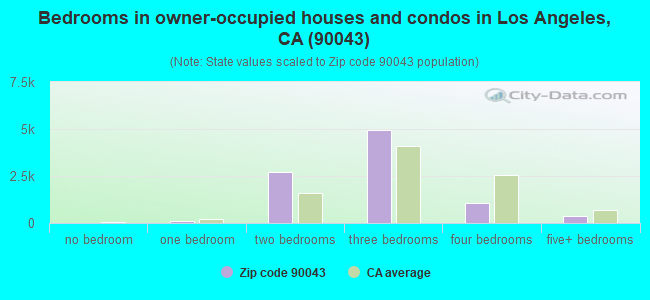
Median number of rooms in houses and condos:
Here:
6.0
State:
6.0
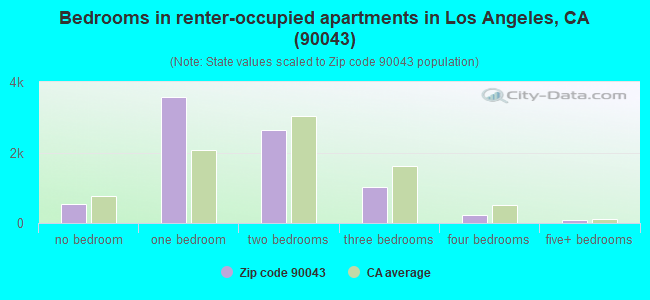
Median number of rooms in apartments:
Here:
3.7
State:
3.9
Notable locations in this zip code not listed on our city pages
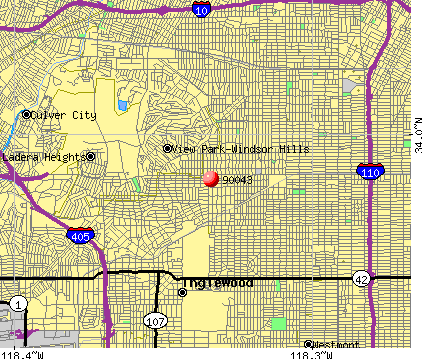
Notable locations in zip code 90043: Transformer Station Number 18 (A), View Park Branch County of Los Angeles Public Library (B), Hyde Park Branch Los Angeles Public Library (C), Angeles Mesa Branch Los Angeles Public Library (D), Fairview Masonic Temple (E), West Coast Ambulance Service (F), MedExpress Ambulance Service (G), Los Angeles County Fire Department Station 38 (H). Display/hide their locations on the map
Churches in zip code 90043 include: Angeles Mesa Presbyterian Church (A), Thirtieth Church of Christ Scientist (B), View Park Church of Christ (C), Saint Anselm Roman Catholic Church (D), Ascension Lutheran Church (E), First Church of God (F), Florence Heights United Methodist Church (G), Grace United Methodist Church (H), Hyde Park Church of God (I). Display/hide their locations on the map
4,574 married couples with children.
2,469 single-parent households (664 men, 1,805 women).
69.6% of residents of 90043 zip code speak English at home.
25.6% of residents speak Spanish at home (66% very well, 14% well, 15% not well, 4% not at all).
1.3% of residents speak other Indo-European language at home (94% very well, 4% well, 2% not well).
1.3% of residents speak Asian or Pacific Island language at home (57% very well, 32% well, 12% not well).
2.2% of residents speak other language at home (88% very well, 11% well, 1% not well).
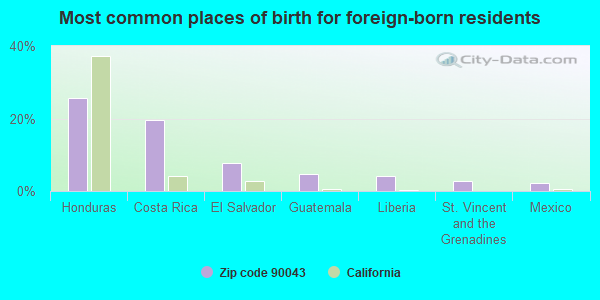
Foreign born population: 8,126 (18.4%) (53.7% of them are naturalized citizens)
This zip code:
18.4%
Whole state:
26.7%
26%Honduras
20%Costa Rica
8%El Salvador
5%Guatemala
4%Liberia
3%St. Vincent and the Grenadines
2%Mexico
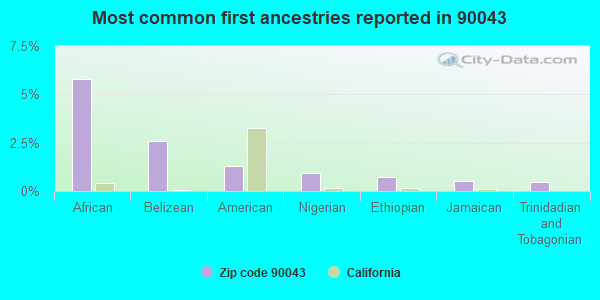
6%African
3%Belizean
1%American
1%Nigerian
1%Ethiopian
1%Jamaican
0%Trinidadian and Tobagonian
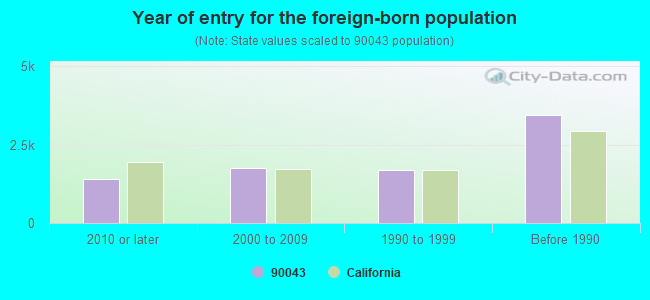
Year of entry for the foreign-born population
1,4092010 or later
1,7612000 to 2009
1,6881990 to 1999
3,442Before 1990
Major facilities with environmental interests located in this zip code:
L.A.C.M.T.A. (2300 W 54TH ST in LOS ANGELES, CA) . Federal Facility
STATE MASTER (California - Hazardous Waste Tracking) - HAZARDOU WASTE PROGRAM CRITERIA AND HAZARDOUS AIR POLLUTANT INVENTORY (Inventory of air pollution sources) Large Quantity Generators, more that 1000 kg of hazardous waste/month (Resource Conservation and Recovery Act (tracking hazardous waste)) Business SIC classification: TRUCK AND BUS BODIES; INTERCITY AND RURAL BUS TRANSPORTATION Business NAICS classification: MOTOR VEHICLE BODY MANUFACTURING. Alternative names: LA CO., METROPOLITAN TRANS AUT, SCRTD
LAUSD-MAINTENANCE & OPERATIONS DIST G (6620 11TH AVE in LOS ANGELES, CA)
STATE MASTER (California - Hazardous Waste Tracking) - HAZARDOU WASTE PROGRAM HAZARDOUS WASTE BIENNIAL REPORTER (Resource Conservation and Recovery Act (tracking hazardous waste)) Large Quantity Generators, more that 1000 kg of hazardous waste/month (Resource Conservation and Recovery Act (tracking hazardous waste)) Alternative names: LAUSD/MAINTENANCE AREA DISTRICT G, MAINTENANCE AND OPERATIONS DIST 1
ANGELES MESA ELEMENTARY SCHOOL (2611 W 52ND ST in LOS ANGELES, CA)
(Geographic Names Information System) (National Center for Education Statistics) - STATE ID-6015804 Organizations: LOS ANGELES UNIFIED (SCHOOL DISTRICT)
L AND J CLEANERS (1601 W MANCHESTER in LOS ANGELES, CA)
STATE MASTER (California - Hazardous Waste Tracking) - HAZARDOU WASTE PROGRAM Small Quantity Generators, between 100 kg and 1000 kg of hazardous waste/month (Resource Conservation and Recovery Act (tracking hazardous waste)) - notification Organizations: ALFRED HOWELL (CONTACT/OWNER)
FIFTY-FOURTH STREET ELEMENTARY (5501 S. EILEEN AVE. in LOS ANGELES, CA)
(National Center for Education Statistics) - STATE ID-6017040 Organizations: LOS ANGELES UNIFIED (SCHOOL DISTRICT)
HYDE PARK BLVD. ELEMENTARY (3140 HYDE PARK BLVD. in LOS ANGELES, CA)
(National Center for Education Statistics) - STATE ID-6017677 Organizations: LOS ANGELES UNIFIED (SCHOOL DISTRICT)
CHEVRON NO 91992 (3404 W FLORENCE AVE in LOS ANGELES, CA)
HAZARDOUS WASTE BIENNIAL REPORTER (Resource Conservation and Recovery Act (tracking hazardous waste)) Large Quantity Generators, more that 1000 kg of hazardous waste/month (Resource Conservation and Recovery Act (tracking hazardous waste)) Organizations: CHEVRON PRODUCTS CO (CONTACT/OWNER)
A BARNARD TRUCKING SERVICE (4263 W 62ND ST in LOS ANGELES, CA)
TRANSPORTER (Resource Conservation and Recovery Act (tracking hazardous waste))
GRIFFEN CLEANERS (3811 W SLAUSON AVE in LOS ANGELES, CA)
Small Quantity Generators, between 100 kg and 1000 kg of hazardous waste/month (Resource Conservation and Recovery Act (tracking hazardous waste)) - notification Organizations: ANDREW GRIFFEN (CONTACT/OWNER)
LA HYDE PARK LIBRARY (6527 CRENSHAW BLVD in LOS ANGELES, CA)
Small Quantity Generators, between 100 kg and 1000 kg of hazardous waste/month (Resource Conservation and Recovery Act (tracking hazardous waste)) - notification Organizations: CITY OF LOS ANGELES (CONTACT/OWNER)
LA SENIOR CITIZENS SERVICE CENTER (5133 S CRENSHAW BLVD in LOS ANGELES, CA)
Small Quantity Generators, between 100 kg and 1000 kg of hazardous waste/month (Resource Conservation and Recovery Act (tracking hazardous waste)) - notification Organizations: CITY OF LOS ANGELES (CONTACT/OWNER)
CENTRAL NEWS WAVE PUBLICATIONS (2621 W 54TH ST in LOS ANGELES, CA)
Small Quantity Generators, between 100 kg and 1000 kg of hazardous waste/month (Resource Conservation and Recovery Act (tracking hazardous waste)) - notification Organizations: CHARLES Z WILSON (CONTACT/OWNER)
7 ELEVEN STORE 20545 (4343 W SLAUSON in LOS ANGELES, CA)
Small Quantity Generators, between 100 kg and 1000 kg of hazardous waste/month (Resource Conservation and Recovery Act (tracking hazardous waste)) - notification Organizations: THE SOUTHLAND CORP (CONTACT/OWNER)
Housing units lacking complete plumbing facilities: 0.6% Housing units lacking complete kitchen facilities: 3.1%
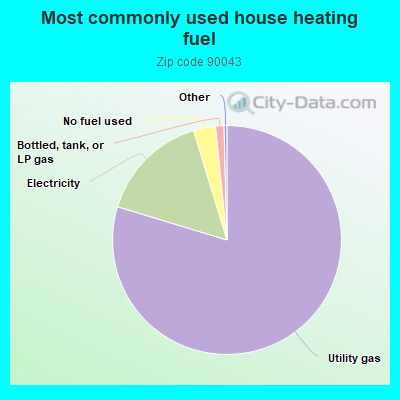
79.7%Utility gas
15.6%Electricity
3.1%No fuel used
1.2%Bottled, tank, or LP gas
Population in 1990: 45,397.
Place of birth for U.S.-born residents:
This state: 25,785
Northeast: 1,152
Midwest: 1,656
South: 6,195
West: 762
62% of the 90043 zip code residents lived in the same house 5 years ago. Out of people who lived in different houses, 89% lived in this county. Out of people who lived in different counties, 50% lived in California.
94% of the 90043 zip code residents lived in the same house 1 year ago. Out of people who lived in different houses, 78% moved from this county. Out of people who lived in different houses, 7% moved from different county within same state. Out of people who lived in different houses, 8% moved from different state. Out of people who lived in different houses, 10% moved from abroad.
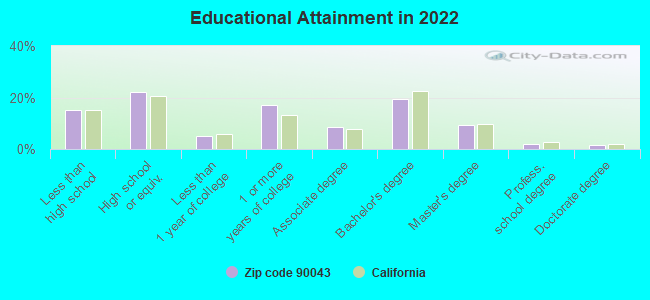
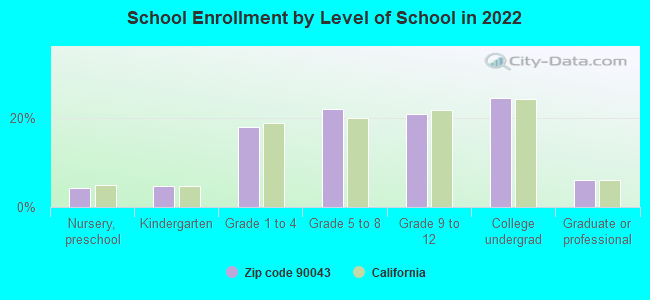
Private vs. public school enrollment:
Students in private schools in grades 1 to 8 (elementary and middle school): 691
Here:
16.5%
California:
10.5%
Students in private schools in grades 9 to 12 (high school): 183
Here:
8.4%
California:
8.5%
Students in private undergraduate colleges: 440
Here:
17.1%
California:
15.9%
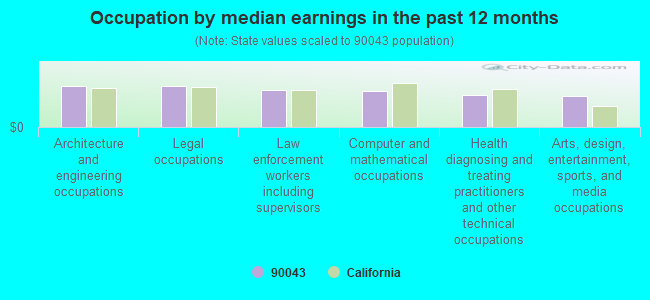
Occupation by median earnings in the past 12 months ($)
111,846Architecture and engineering occupations
110,450Legal occupations
100,839Law enforcement workers including supervisors
98,343Computer and mathematical occupations
86,650Health diagnosing and treating practitioners and other technical occupations
84,060Arts, design, entertainment, sports, and media occupations
Companies with federal contracts located in this zip code:
JONES LIFT TRUCKS INC (3007W 76THST in LOS ANGELES, CA; small business) : $370,955 in 16 contractsfrom 2003 to 2006
Contracts for Maintenance, Repair and Rebuilding of Equipment -- Materials Handling Equipment by Defense Commissary Agency, Department of Defense Signed by year:2000: $0; 2001: $0; 2002: $0; 2003: $87,834; 2004: $110,324; 2005: $165,797; 2006: $7,000.
Biggest contracts:
$103,886 with Defense Commissary Agency for Maintenance, Repair and Rebuilding of Equipment -- Materials Handling Equipment. Signed on 2005-05-19. Completion date: 2005-07-31.
$89,154, same as above.Signed on 2004-08-01. Completion date: 2005-07-31.
$87,834 with Department of Defense for Maintenance, Repair and Rebuilding of Equipment -- Materials Handling Equipment. Signed on 2003-07-28. Completion date: 2003-10-01.
$27,061 with Defense Commissary Agency for Maintenance, Repair and Rebuilding of Equipment -- Materials Handling Equipment. Signed on 2005-12-09. Completion date: 2005-07-31.
FOAM MATRIX, INC (3519 W 71ST ST in LOS ANGELES, CA; small business)
$97,274 with Air Force for Other Defense -- Management and Support (R&D). Signed on 2000-05-19. Completion date: 2001-03-12.
DEAL, SARAH (4444 W 63RD ST in LOS ANGELES, CA)
$5,035 with Air Force for Recreational Services. Taking place in DC. Signed on 2005-05-05. Completion date: 2004-10-08.
Top industries in this zip code by the number of employees in 2005:
2005 - 2018 National Fire Incident Reporting System (NFIRS) incidents
Based on the data from the years 2005 - 2018 the average number of fire incidents per year is 117. The highest number of fire incidents - 197 took place in 2006, and the least - 71 in 2012. The data has a dropping trend.
When looking into fire subcategories, the most reports belonged to: Structure Fires (48.0%), and Mobile Property/Vehicle Fires (26.3%).
Fire incident types reported to NFIRS in Zip Code 90043
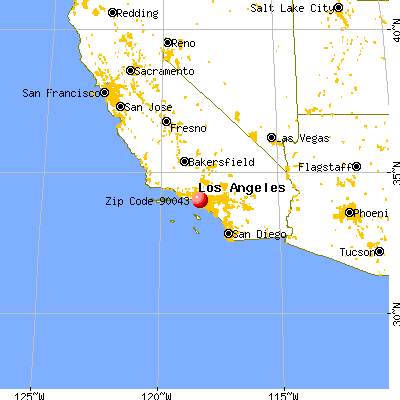


 Nearest zip codes: 90302, 90008, 90305, 90062, 90056, 90301.
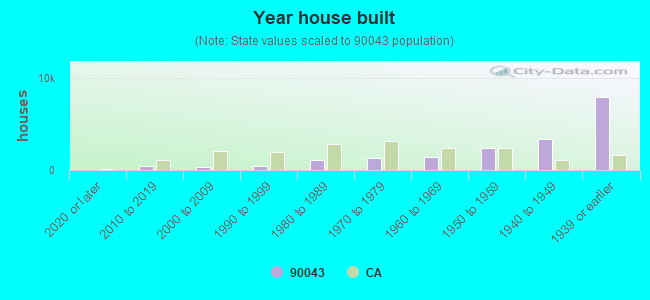


 . Federal Facility
 Based on the data from the years 2005 - 2018 the average number of fire incidents per year is 117. The highest number of fire incidents - 197 took place in 2006, and the least - 71 in 2012. The data has a dropping trend.
 When looking into fire subcategories, the most reports belonged to: Structure Fires (48.0%), and Mobile Property/Vehicle Fires (26.3%).