Estimated zip code population in 2022: 37,030 Zip code population in 2010: 36,568 Zip code population in 2000: 37,507
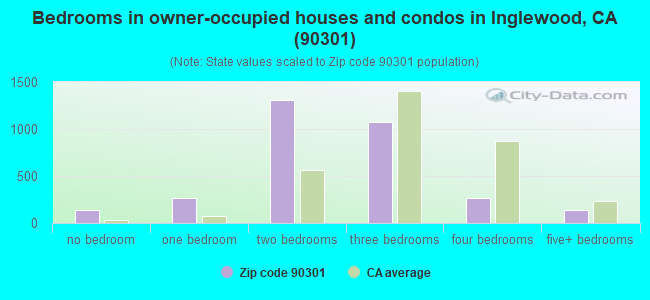
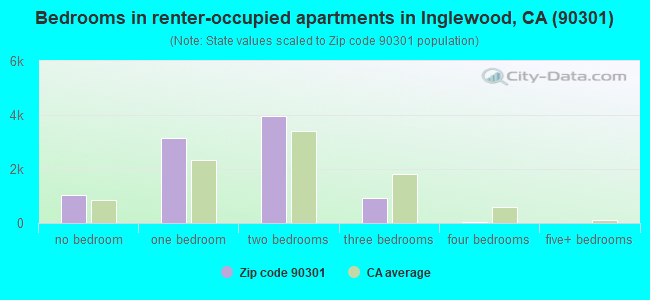
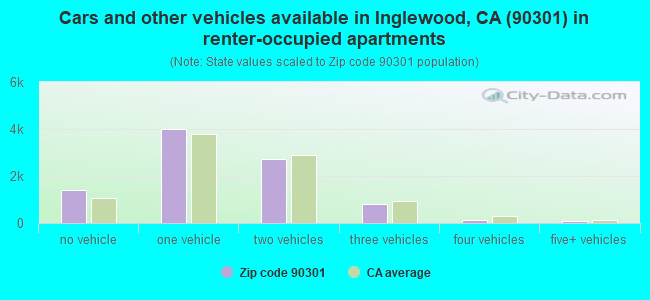
Houses and condos: 13,038 Renter-occupied apartments: 9,136
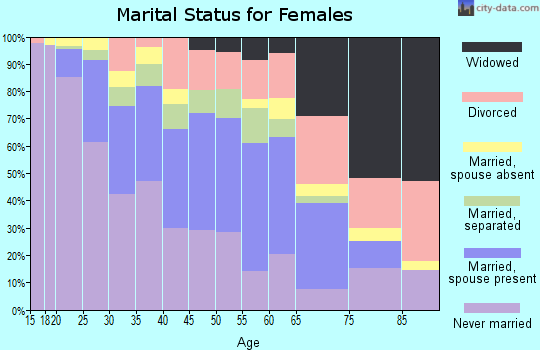
% of renters here:
74%
State:
44%
March 2022 cost of living index in zip code 90301: 138.0 (high, U.S. average is 100)
Land area: 2.5 sq. mi. Water area: 0.0 sq. mi.
Population density: 14,946 people per square mile
(very high).
OSM Map
General Map
Google Map
MSN Map
OSM Map
General Map
Google Map
MSN Map
OSM Map
General Map
Google Map
MSN Map
OSM Map
General Map
Google Map
MSN Map
Please wait while loading the map...
Real estate property taxes paid for housing units in 2022:
This zip code:
0.6% ($4,342)
California:
0.7% ($4,831)
Median real estate property taxes paid for housing units with mortgages in 2022: $4,583 (0.7%) Median real estate property taxes paid for housing units with no mortgage in 2022: $4,161 (0.6%)
Averages for the 2020 tax year for zip code 90301, filed in 2021:
Average Adjusted Gross Income (AGI) in 2020: $41,459 (Individual Income Tax Returns)
Here:
$41,459
State:
$95,910
Salary/wage: $39,400 (reported on 82.6% of returns)
Here:
$39,400
State:
$77,331
(% of AGI for various income ranges: 1250.3% for AGIs below $25k, 4097.2% for AGIs $25k-50k, 8087.8% for AGIs $50k-75k, 11798.1% for AGIs $75k-100k, 21141.4% for AGIs $100k-200k, 72532.5% for AGIs over 200k)
Taxable interest for individuals: $465 (reported on 16.2% of returns)
This zip code:
$465
California:
$2,294
(% of AGI for various income ranges: 3.9% for AGIs below $25k, 5.3% for AGIs $25k-50k, 9.1% for AGIs $50k-75k, 13.3% for AGIs $75k-100k, 40.7% for AGIs $100k-200k, 1267.5% for AGIs over 200k)
Ordinary dividends: $1,183 (reported on 4.7% of returns)
Here:
$1,183
State:
$10,949
(% of AGI for various income ranges: 2.5% for AGIs below $25k, 2.6% for AGIs $25k-50k, 5.3% for AGIs $50k-75k, 9.4% for AGIs $75k-100k, 72.3% for AGIs $100k-200k, 707.5% for AGIs over 200k)
Net capital gain/loss in AGI: +$3,488 (reported on 6.2% of returns)
Here:
+$3,488
State:
+$49,306
(% of AGI for various income ranges: 15.9% for AGIs $50k-75k, 29.6% for AGIs $75k-100k, 339.3% for AGIs $100k-200k, 4747.5% for AGIs over 200k)
Profit/loss from business: +$6,547 (reported on 22.4% of returns)
Here:
+$6,547
State:
+$15,671
(% of AGI for various income ranges: 226.8% for AGIs below $25k, 133.4% for AGIs $25k-50k, 161.6% for AGIs $50k-75k, 322.0% for AGIs $75k-100k, 680.2% for AGIs $100k-200k, 5325.0% for AGIs over 200k)
Taxable individual retirement arrangement distribution: $11,615 (reported on 1.9% of returns)
90301:
$11,615
California:
$23,505
(% of AGI for various income ranges: 10.2% for AGIs below $25k, 19.0% for AGIs $25k-50k, 40.5% for AGIs $50k-75k, 117.4% for AGIs $75k-100k, 261.4% for AGIs $100k-200k)
Total itemized deductions: $26,653 (reported on 7.0% of returns)
Here:
$26,653
State:
$39,517
(% of AGI for various income ranges: 32.8% for AGIs below $25k, 158.0% for AGIs $25k-50k, 391.7% for AGIs $50k-75k, 828.3% for AGIs $75k-100k, 1895.2% for AGIs $100k-200k, 9545.0% for AGIs over 200k)
Charity contributions: $6,204 (reported on 5.9% of returns)
Here:
$6,204
State:
$12,598
(% of AGI for various income ranges: 2.9% for AGIs below $25k, 27.8% for AGIs $25k-50k, 79.4% for AGIs $50k-75k, 157.9% for AGIs $75k-100k, 385.5% for AGIs $100k-200k, 2352.5% for AGIs over 200k)
Taxes paid: $7,368 (reported on 6.9% of returns)
90301:
$7,368
State:
$8,807
(% of AGI for various income ranges: 9.2% for AGIs below $25k, 39.1% for AGIs $25k-50k, 103.4% for AGIs $50k-75k, 259.1% for AGIs $75k-100k, 593.4% for AGIs $100k-200k, 1840.0% for AGIs over 200k)
Earned income credit: $2,141 (reported on 22.3% of returns)
Here:
$2,141
State:
$2,074
(% of AGI for various income ranges: 116.2% for AGIs below $25k, 76.5% for AGIs $25k-50k, 1.2% for AGIs $50k-75k)
Percentage of individuals using paid preparers for their 2020 taxes: 91.1%
Here:
91%
State:
92%
(% for various income ranges: 89.3% for AGIs below $25k, 92.3% for AGIs $25k-50k, 91.7% for AGIs $50k-75k, 93.1% for AGIs $75k-100k, 92.0% for AGIs $100k-200k, 92.9% for AGIs over 200k)
Averages for the 2012 tax year for zip code 90301, filed in 2013:
Average Adjusted Gross Income (AGI) in 2012: $31,352 (Individual Income Tax Returns)
Here:
$31,352
State:
$72,726
Salary/wage: $31,370 (reported on 83.5% of returns)
Here:
$31,370
State:
$59,079
(% of AGI for various income ranges: 73.9% for AGIs below $25k, 90.8% for AGIs $25k-50k, 89.4% for AGIs $50k-75k, 84.2% for AGIs $75k-100k, 78.9% for AGIs $100k-200k, 29.1% for AGIs over 200k)
Taxable interest for individuals: $331 (reported on 14.5% of returns)
This zip code:
$331
California:
$2,146
(% of AGI for various income ranges: 0.1% for AGIs below $25k, 0.1% for AGIs $25k-50k, 0.2% for AGIs $50k-75k, 0.1% for AGIs $75k-100k, 0.3% for AGIs $100k-200k)
Ordinary dividends: $1,380 (reported on 2.8% of returns)
Here:
$1,380
State:
$9,308
(% of AGI for various income ranges: 0.1% for AGIs below $25k, 0.2% for AGIs $50k-75k, 0.1% for AGIs $75k-100k, 0.3% for AGIs $100k-200k)
Net capital gain/loss in AGI: +$845 (reported on 2.7% of returns)
Here:
+$845
State:
+$30,460
(% of AGI for various income ranges: 1.0% for AGIs $100k-200k)
Profit/loss from business: +$8,383 (reported on 21.2% of returns)
Here:
+$8,383
State:
+$17,064
(% of AGI for various income ranges: 17.7% for AGIs below $25k, 2.9% for AGIs $25k-50k, 1.7% for AGIs $50k-75k, 1.3% for AGIs $75k-100k, 2.7% for AGIs $100k-200k)
Taxable individual retirement arrangement distribution: $11,619 (reported on 2.3% of returns)
90301:
$11,619
California:
$19,557
(% of AGI for various income ranges: 0.8% for AGIs below $25k, 0.5% for AGIs $25k-50k, 0.8% for AGIs $50k-75k, 1.3% for AGIs $75k-100k, 2.5% for AGIs $100k-200k)
Total itemized deductions: $19,331 (33% of AGI, reported on 20.5% of returns)
Here:
$19,331
State:
$34,004
Here:
33.1% of AGI
State:
22.7% of AGI
(% of AGI for various income ranges: 5.7% for AGIs below $25k, 10.9% for AGIs $25k-50k, 15.8% for AGIs $50k-75k, 22.5% for AGIs $75k-100k, 19.0% for AGIs $100k-200k, 11.7% for AGIs over 200k)
Charity contributions: $3,141 (reported on 16.6% of returns)
Here:
$3,141
State:
$4,659
(% of AGI for various income ranges: 0.5% for AGIs below $25k, 1.5% for AGIs $25k-50k, 2.3% for AGIs $50k-75k, 2.7% for AGIs $75k-100k, 3.1% for AGIs $100k-200k)
Taxes paid: $4,893 (reported on 20.4% of returns)
90301:
$4,893
State:
$14,448
(% of AGI for various income ranges: 1.0% for AGIs below $25k, 2.2% for AGIs $25k-50k, 4.0% for AGIs $50k-75k, 5.7% for AGIs $75k-100k, 6.6% for AGIs $100k-200k, 7.2% for AGIs over 200k)
Earned income credit: $2,434 (reported on 33.5% of returns)
Here:
$2,434
State:
$2,286
(% of AGI for various income ranges: 9.4% for AGIs below $25k, 1.5% for AGIs $25k-50k)
Percentage of individuals using paid preparers for their 2012 taxes: 74.1%
Here:
74%
State:
64%
(% for various income ranges: 74.0% for AGIs below $25k, 74.8% for AGIs $25k-50k, 73.1% for AGIs $50k-75k, 71.4% for AGIs $75k-100k, 77.1% for AGIs $100k-200k, 66.7% for AGIs over 200k)
Averages for the 2004 tax year for zip code 90301, filed in 2005:
Average Adjusted Gross Income (AGI) in 2004: $28,481 (Individual Income Tax Returns)
Here:
$28,481
State:
$58,600
Salary/wage: $28,320 (reported on 88.1% of returns)
Here:
$28,320
State:
$49,455
(% of AGI for various income ranges: 78.5% for AGIs below $10k, 85.6% for AGIs $10k-25k, 93.6% for AGIs $25k-50k, 92.0% for AGIs $50k-75k, 87.3% for AGIs $75k-100k, 57.8% for AGIs over 100k)
Taxable interest for individuals: $572 (reported on 21.3% of returns)
This zip code:
$572
California:
$2,365
(% of AGI for various income ranges: 0.9% for AGIs below $10k, 0.4% for AGIs $10k-25k, 0.2% for AGIs $25k-50k, 0.5% for AGIs $50k-75k, 0.7% for AGIs $75k-100k, 0.9% for AGIs over 100k)
Taxable dividends: $1,247 (reported on 4.4% of returns)
Here:
$1,247
State:
$4,746
(% of AGI for various income ranges: 0.2% for AGIs below $10k, 0.1% for AGIs $10k-25k, 0.1% for AGIs $25k-50k, 0.2% for AGIs $50k-75k, 0.3% for AGIs $75k-100k, 0.7% for AGIs over 100k)
Net capital gain/loss: +$9,166 (reported on 3.2% of returns)
Here:
+$9,166
State:
+$23,418
(% of AGI for various income ranges: -0.0% for AGIs below $10k, 0.1% for AGIs $10k-25k, -0.1% for AGIs $25k-50k, 0.5% for AGIs $50k-75k, 1.1% for AGIs $75k-100k, 10.3% for AGIs over 100k)
Profit/loss from business: +$7,435 (reported on 16.8% of returns)
Here:
+$7,435
State:
+$16,826
(% of AGI for various income ranges: 23.0% for AGIs below $10k, 8.9% for AGIs $10k-25k, 2.3% for AGIs $25k-50k, 0.6% for AGIs $50k-75k, 2.2% for AGIs $75k-100k, 5.1% for AGIs over 100k)
IRA payment deduction: $1,896 (reported on 1.2% of returns)
90301:
$1,896
California:
$3,192
(% of AGI for various income ranges: 0.1% for AGIs $10k-25k, 0.1% for AGIs $25k-50k, 0.1% for AGIs $50k-75k, 0.1% for AGIs $75k-100k)
Total itemized deductions: $17,524 (34% of AGI, reported on 23.9% of returns)
Here:
$17,524
State:
$28,113
Here:
34.5% of AGI
State:
25.3% of AGI
(% of AGI for various income ranges: 6.6% for AGIs below $10k, 7.2% for AGIs $10k-25k, 14.1% for AGIs $25k-50k, 21.3% for AGIs $50k-75k, 22.5% for AGIs $75k-100k, 19.2% for AGIs over 100k)
Charity contributions deductions: $2,977 (6% of AGI, reported on 21.1% of returns)
Here:
$2,977
State:
$3,923
Here:
5.6% of AGI
State:
3.3% of AGI
(% of AGI for various income ranges: 0.3% for AGIs below $10k, 0.8% for AGIs $10k-25k, 2.3% for AGIs $25k-50k, 3.4% for AGIs $50k-75k, 3.7% for AGIs $75k-100k, 2.6% for AGIs over 100k)
Total tax: $2,825 (reported on 64.3% of returns)
90301:
$2,825
State:
$10,761
(% of AGI for various income ranges: 4.4% for AGIs below $10k, 3.5% for AGIs $10k-25k, 4.9% for AGIs $25k-50k, 7.4% for AGIs $50k-75k, 10.1% for AGIs $75k-100k, 16.8% for AGIs over 100k)
Earned income credit: $1,910 (reported on 32.0% of returns)
Here:
$1,910
State:
$1,763
Percentage of individuals using paid preparers for their 2004 taxes: 78.6%
Here:
79%
State:
66%
(% for various income ranges: 74.3% for AGIs below $10k, 81.3% for AGIs $10k-25k, 78.4% for AGIs $25k-50k, 77.2% for AGIs $50k-75k, 79.9% for AGIs $75k-100k, 78.4% for AGIs over 100k)
Likely homosexual households (counted as self-reported same-sex unmarried-partner households)
Lesbian couples: 0.4% of all households
Gay men: 0.3% of all households
Household received Food Stamps/SNAP in the past 12 months: 2,683 Household did not receive Food Stamps/SNAP in the past 12 months: 9,908
Women who had a birth in the past 12 months: 585 (315 now married, 272 unmarried) Women who did not have a birth in the past 12 months: 8,436 (2,876 now married, 5,579 unmarried)
Housing units in zip code 90301 with a mortgage: 2,158 (204 second mortgage, 28 home equity loan, 113 both second mortgage and home equity loan) Houses without a mortgage: 57
Median monthly owner costs for units with a mortgage: $2,387 Median monthly owner costs for units without a mortgage: $673
Residents with income below the poverty level in 2022:
This zip code:
18.5%
Whole state:
12.2%
Residents with income below 50% of the poverty level in 2022:
This zip code:
10.8%
Whole state:
6.2%
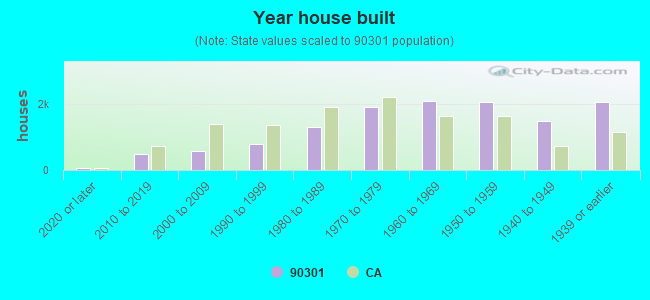
Median number of rooms in houses and condos:
Here:
5.0
State:
6.0
Median number of rooms in apartments:
Here:
3.7
State:
3.9
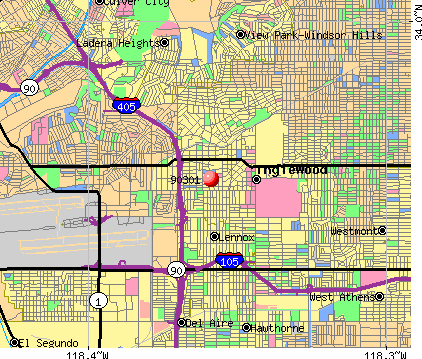
Notable locations in this zip code not listed on our city pages
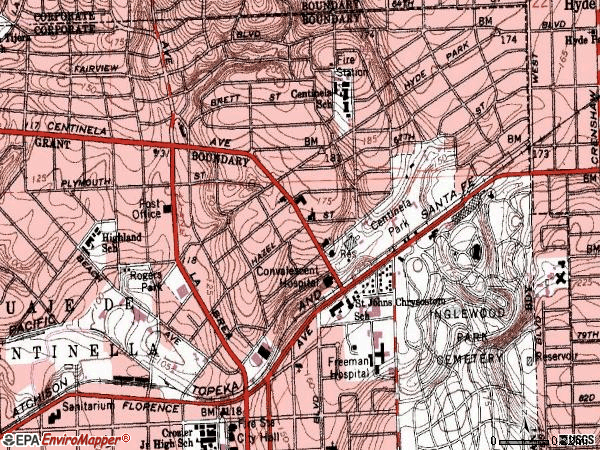
Notable locations in zip code 90301: City of Inglewood Public Library (A), Inglewood City Hall (B), Inglewood Womans Club (C), Inglewood Police Station (D), Inglewood County Building (E), APT Ambulance Company (F), Inglewood Paramedics (G), Los Angeles County Fire Department Station 171 (H). Display/hide their locations on the map
Churches in zip code 90301 include: First Foursquare Church (A), Greater New Bethel Baptist Church (B), Inglewood Friends Church (C), Church of Christ (D), Church of the Holy Faith (E), Church of the Nazarene (F), First Baptist Church (G), First Christian Church (H), First Church of Christ Scientist (I). Display/hide their locations on the map
Parks in zip code 90301 include: Simmons Playground (1), Sentinel Field (2), Ashwood Park (3), Queen Park (4), Siminski Park (5). Display/hide their locations on the map
3,409 married couples with children.
2,794 single-parent households (964 men, 1,830 women).
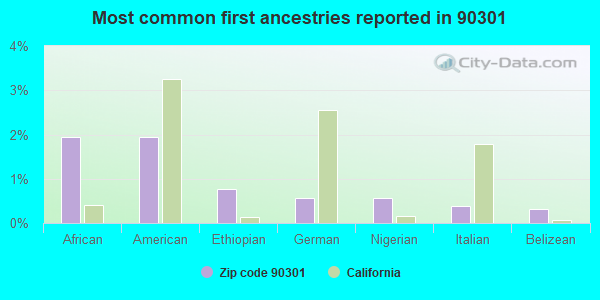
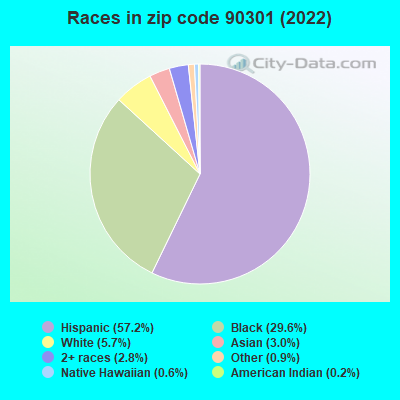
41.6% of residents of 90301 zip code speak English at home.
50.8% of residents speak Spanish at home (58% very well, 20% well, 16% not well, 6% not at all).
2.4% of residents speak other Indo-European language at home (63% very well, 32% well, 1% not well, 3% not at all).
2.2% of residents speak Asian or Pacific Island language at home (75% very well, 16% well, 8% not well, 1% not at all).
2.9% of residents speak other language at home (60% very well, 20% well, 17% not well, 2% not at all).
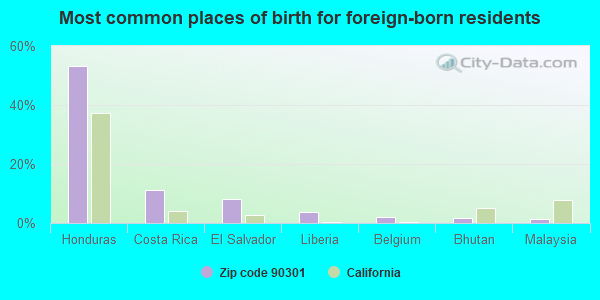
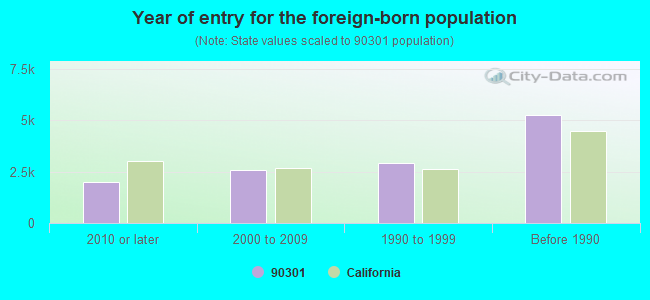
Foreign born population: 12,522 (33.8%) (47.7% of them are naturalized citizens)
Major facilities with environmental interests located in this zip code:
INGLEWOOD HIGH SCHOOL (231 S GREVILLEA AVE in INGLEWOOD, CA)
STATE MASTER (California - Hazardous Waste Tracking) - HAZARDOU WASTE PROGRAM (National Center for Education Statistics) - STATE ID-1934231 Small Quantity Generators, between 100 kg and 1000 kg of hazardous waste/month (Resource Conservation and Recovery Act (tracking hazardous waste)) - notification Organizations: INGLEWOOD UNIFIFED SCHOOL DISTRICT (CONTACT/OWNER)
, INGLEWOOD UNIFIED (SCHOOL DISTRICT)
H F COORS CHINA COMPANY (8729 AVIATION BLVD. in INGLEWOOD, CA)
STATE MASTER (California - Hazardous Waste Tracking) - HAZARDOU WASTE PROGRAM CRITERIA AND HAZARDOUS AIR POLLUTANT INVENTORY (Inventory of air pollution sources) HAZARDOUS WASTE BIENNIAL REPORTER (Resource Conservation and Recovery Act (tracking hazardous waste)) Large Quantity Generators, more that 1000 kg of hazardous waste/month (Resource Conservation and Recovery Act (tracking hazardous waste)) TRI REPORTER (Tracking of toxic chemicals releasing facilities) Business SIC classification: VITREOUS CHINA TABLE AND KITCHEN ARTICLES Business NAICS classification: VITREOUS CHINA, FINE EARTHENWARE, AND OTHER POTTERY PRODUCT MANUFACTURING.; CERAMIC WALL AND FLOOR TILE MANUFACTURING. Alternative names: COORS H F CHINA CO
CHEVRON NO 93829 (303 W MANCHESTER BLVD in INGLEWOOD, CA)
STATE MASTER (California - Hazardous Waste Tracking) - HAZARDOU WASTE PROGRAM Large Quantity Generators, more that 1000 kg of hazardous waste/month (Resource Conservation and Recovery Act (tracking hazardous waste)) Organizations: CHEVRON PRODUCTS CO. (CONTACT/OPERATOR)
Alternative names: CHEVRON #93829
INGLEWOOD CITY OF (222 W BEACH ST in INGLEWOOD, CA)
AIR MAJOR (AIRS/AFS) STATE MASTER (California - Hazardous Waste Tracking) - HAZARDOU WASTE PROGRAM CRITERIA AND HAZARDOUS AIR POLLUTANT INVENTORY (Inventory of air pollution sources) Small Quantity Generators, between 100 kg and 1000 kg of hazardous waste/month (Resource Conservation and Recovery Act (tracking hazardous waste)) - notification Business SIC classification: GENERAL GOVERNMENT Organizations: LAVERN HANSEN (CONTACT/OWNER)
Alternative names: CITY OF INGLEWOOD, PUBLIC WORKS
CHURCHILL DOWNS CALIF CO, HOLLYWOOD PARK (1050 S PRAIRIE AVE in INGLEWOOD, CA)
AIR MAJOR (AIRS/AFS) AIR MINOR (AIRS/AFS) COMPLIANCE ACTIVITY (Tracking inspections of insecticide, fungicide, and rodenticide, and toxic substances) CRITERIA AND HAZARDOUS AIR POLLUTANT INVENTORY (Inventory of air pollution sources) National Pollutant Discharge Elimination System NON-MAJOR (Tracking pollutant discharge elimination systems) - permit Business SIC classification: DRYCLEANING PLANTS, EXCEPT RUG CLEANING; RACING, INCLUDING TRACK OPERATION Organizations: MR DONALD M ROBBINS (CONTACT/OWNER)
Alternative names: HOLLYWOOD PARK OPERATING CO
1 DAY PAINT & BODY CENTERS INCORPORATED (10920 S HAWTHORNE BLVD in INGLEWOOD, CA)
STATE MASTER (California - Hazardous Waste Tracking) - HAZARDOU WASTE PROGRAM CRITERIA AND HAZARDOUS AIR POLLUTANT INVENTORY (Inventory of air pollution sources) Small Quantity Generators, between 100 kg and 1000 kg of hazardous waste/month (Resource Conservation and Recovery Act (tracking hazardous waste)) Business SIC classification: TOP, BODY, AND UPHOLSTERY REPAIR SHOPS AND PAINT SHOPS Business NAICS classification: AUTOMOTIVE BODY, PAINT, AND INTERIOR REPAIR AND MAINTENANCE.
FAMILY CLEANERS (113 E MANCHESTER in INGLEWOOD, CA) . Federal Facility
STATE MASTER (California - Hazardous Waste Tracking) - HAZARDOU WASTE PROGRAM Small Quantity Generators, between 100 kg and 1000 kg of hazardous waste/month (Resource Conservation and Recovery Act (tracking hazardous waste)) - notification Organizations: FARIBORS NOURIAN (CONTACT/OWNER)
Alternative names: CONCORD CLEANERS
EQUILON ENTERPRISES (1135 W MANCHESTER/FLORENCE in INGLEWOOD, CA) . Federal Facility
STATE MASTER (California - Hazardous Waste Tracking) - HAZARDOU WASTE PROGRAM Small Quantity Generators, between 100 kg and 1000 kg of hazardous waste/month (Resource Conservation and Recovery Act (tracking hazardous waste)) - notification Organizations: EQUILON ENTERPRISES L L C (CONTACT/OWNER)
Alternative names: SHELL OIL CO
EQUILON ENTERPRISES (804 W MANCHESTER in INGLEWOOD, CA) . Federal Facility
STATE MASTER (California - Hazardous Waste Tracking) - HAZARDOU WASTE PROGRAM Small Quantity Generators, between 100 kg and 1000 kg of hazardous waste/month (Resource Conservation and Recovery Act (tracking hazardous waste)) - notification Organizations: EQUILON ENTERPRISES L L C (CONTACT/OWNER)
Alternative names: SHELL OIL CO
HI TECH CLEANERS (911 S PRAIRISE in INGLEWOOD, CA)
STATE MASTER (California - Hazardous Waste Tracking) - HAZARDOU WASTE PROGRAM Small Quantity Generators, between 100 kg and 1000 kg of hazardous waste/month (Resource Conservation and Recovery Act (tracking hazardous waste)) - notification
CHROMEPLATE CO (1127 W HILLCREST BLVD in INGLEWOOD, CA)
STATE MASTER (California - Hazardous Waste Tracking) - HAZARDOU WASTE PROGRAM Small Quantity Generators, between 100 kg and 1000 kg of hazardous waste/month (Resource Conservation and Recovery Act (tracking hazardous waste)) Business NAICS classification: ELECTROPLATING, PLATING, POLISHING, ANODIZING, AND COLORING. Alternative names: CHROMPLATE
MICROPLATE CO INC (1013 W HILLCREST BLVD in INGLEWOOD, CA) . Federal Facility
STATE MASTER (California - Hazardous Waste Tracking) - HAZARDOU WASTE PROGRAM Small Quantity Generators, between 100 kg and 1000 kg of hazardous waste/month (Resource Conservation and Recovery Act (tracking hazardous waste)) Business NAICS classification: ELECTROPLATING, PLATING, POLISHING, ANODIZING, AND COLORING.
CALIFORNIA AIRCRAFT TOOL CO (821 W OLIVE ST in INGLEWOOD, CA)
STATE MASTER (California - Hazardous Waste Tracking) - HAZARDOU WASTE PROGRAM Small Quantity Generators, between 100 kg and 1000 kg of hazardous waste/month (Resource Conservation and Recovery Act (tracking hazardous waste)) - notification Organizations: ROBERT W HAY MARY PETERSON (CONTACT/OWNER)
Housing units lacking complete plumbing facilities: 1.5% Housing units lacking complete kitchen facilities: 3.3%
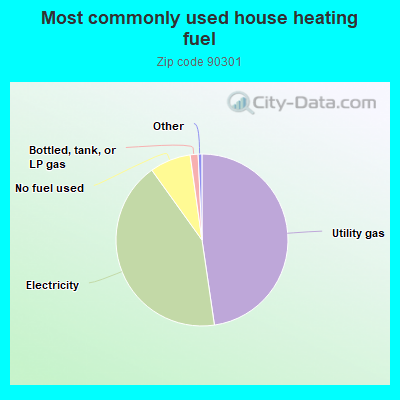
47.7%Utility gas
42.4%Electricity
7.7%No fuel used
1.5%Bottled, tank, or LP gas
Population in 1990: 36,481. Population change in the 1990s: +1,026 (+2.8%).
Place of birth for U.S.-born residents:
This state: 19,686
Northeast: 1,145
Midwest: 965
South: 1,911
West: 444
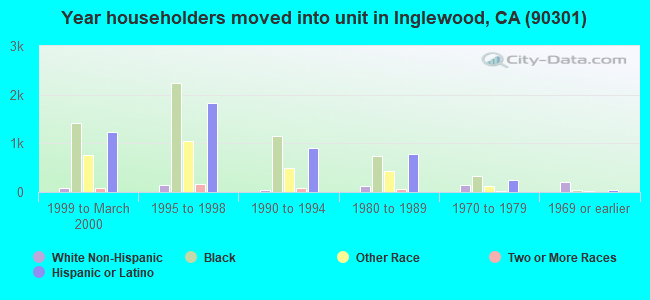
52% of the 90301 zip code residents lived in the same house 5 years ago. Out of people who lived in different houses, 92% lived in this county. Out of people who lived in different counties, 50% lived in California.
91% of the 90301 zip code residents lived in the same house 1 year ago. Out of people who lived in different houses, 78% moved from this county. Out of people who lived in different houses, 7% moved from different county within same state. Out of people who lived in different houses, 10% moved from different state. Out of people who lived in different houses, 4% moved from abroad.
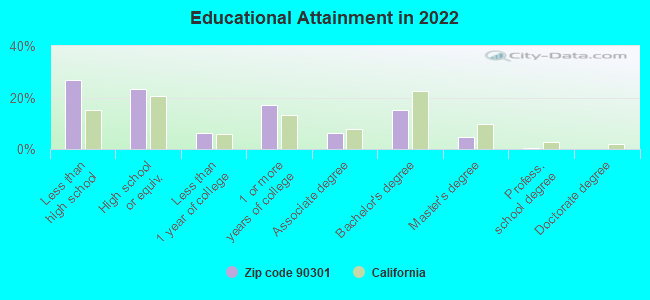
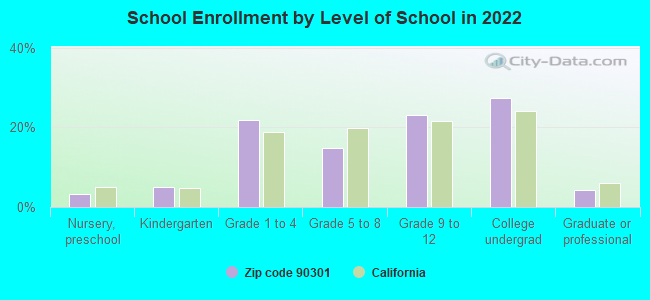
Private vs. public school enrollment:
Students in private schools in grades 1 to 8 (elementary and middle school): 233
Here:
7.8%
California:
10.5%
Students in private schools in grades 9 to 12 (high school): 161
Here:
8.5%
California:
8.5%
Students in private undergraduate colleges: 347
Here:
15.4%
California:
15.9%
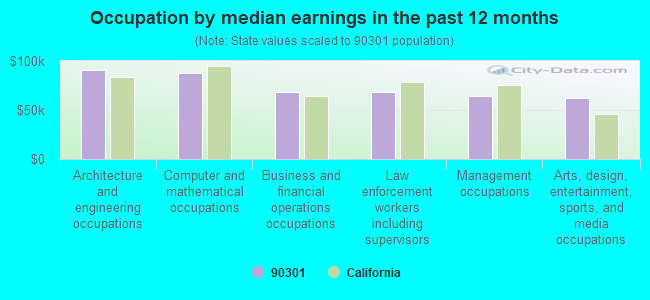
Occupation by median earnings in the past 12 months ($)
91,187Architecture and engineering occupations
87,425Computer and mathematical occupations
68,539Business and financial operations occupations
68,003Law enforcement workers including supervisors
64,748Management occupations
62,058Arts, design, entertainment, sports, and media occupations
Companies with federal contracts located in this zip code (INGLEWOOD, CA):
EMPOWER RF SYSTEMS (316 W FLORENCE AVE; small business) : $3,927,257 in 46 contractsfrom 2000 to 2006
Contracts for Miscellaneous Communication Equipment, Amplifiers, Defense Missile and Space Systems -- Basic Research (R&D), Radio and Television Communication Equipment, Except Airborne, and moreby Navy, Army, NASA, Air Force, and others Signed by year:2000: $887,700; 2001: $115,550; 2002: $166,000; 2003: $282,456; 2004: $463,300; 2005: $900,438; 2006: $1,111,813.
Biggest contracts:
$858,700 with Navy for Miscellaneous Communication Equipment. Signed on 2000-09-06. Completion date: 2001-07-07.
$845,000 with Navy for Amplifiers. Signed on 2006-05-17. Completion date: 2006-11-15.
$288,600 with Navy for Amplifiers. Taking place in SC. Signed on 2005-09-28. Completion date: 2005-12-31.
$225,000 with Navy for Defense Missile and Space Systems -- Basic Research (R&D). Signed on 2003-12-18. Completion date: 2004-03-10.
INTERNATIONAL SOLAR ELECTRIC T (8635 AVIATIONS BLVD #E; small business) : $2,654,712 in 11 contractsfrom 2001 to 2005
Contracts for Defense Missile and Space Systems -- Basic Research (R&D), Defense Aircraft -- Basic Research (R&D), Defense Missile and Space Systems -- Management and Support (R&D) by Missile Defense Agency, Air Force Signed by year:2000: $0; 2001: $214,002; 2002: $99,399; 2003: $375,000; 2004: $971,930; 2005: $994,381; 2006: $0.
Biggest contracts:
$746,640 with Missile Defense Agency for Defense Missile and Space Systems -- Basic Research (R&D). Signed on 2005-07-06. Completion date: 2007-06-30.
$600,000 with Air Force for Defense Aircraft -- Basic Research (R&D). Signed on 2004-02-04. Completion date: 2007-08-13.
$375,000, same as above.Signed on 2003-05-13. Completion date: 2005-08-12.
$247,741 with Air Force for Defense Missile and Space Systems -- Basic Research (R&D). Signed on 2005-10-13. Completion date: 2007-08-13.
CAPRICE ENGINEERING COMPANY IN (509 HINDRY AVE; small business) : $548,961 in 19 contractsfrom 1999 to 2005
Contracts for Bushings, Rings, Shims, and Spacers, Airframe Structural Components, Aircraft Landing Gear Components, Engine Fuel System Components, Aircraft and Missile Prime Movers, and moreby Defense Logistics Agency Signed by year:2000: $343,897; 2001: $127,334; 2002: $0; 2003: $0; 2004: $16,510; 2005: $28,590; 2006: $0.
Biggest contracts:
$72,100 with Defense Logistics Agency for Bushings, Rings, Shims, and Spacers. Signed on 2000-03-27. Completion date: 2000-09-23.
$59,677 with Defense Logistics Agency for Airframe Structural Components. Signed on 2000-11-22. Completion date: 2001-07-20.
$46,990 with Defense Logistics Agency for Aircraft Landing Gear Components. Signed on 2001-07-15. Completion date: 2002-03-12.
$44,104 with Defense Logistics Agency for Engine Fuel System Components, Aircraft and Missile Prime Movers. Signed on 2001-08-24. Completion date: 2002-04-21.
PROAUDIO AMERICA (420 HINDRY AVE # D; small business) : $60,548 in 9 contractsfrom 2004 to 2006
Contracts for ADPE System Configuration, Intercommunication and Public Address Systems, Except Airborne, Electrical Hardware and Supplies, ADP Central Processing Unit (CPU, Computer), Digital, and moreby Army, Air Force Signed by year:2000: $0; 2001: $0; 2002: $0; 2003: $0; 2004: $36,722; 2005: $23,826; 2006: $0.
Biggest contracts:
$28,578 with Army for ADPE System Configuration. Signed on 2004-09-30. Completion date: 2004-10-15.
$13,390 with Air Force for Intercommunication and Public Address Systems, Except Airborne. Signed on 2005-06-24. Completion date: 2005-07-24.
$8,144 with Army for Electrical Hardware and Supplies. Signed on 2004-05-21. Completion date: 2004-06-18.
$6,494 with Army for ADP Central Processing Unit (CPU, Computer), Digital. Signed on 2006-01-12. Completion date: 2006-02-10.
ZEPHYR MANUFACTURING CO , INC (201 HINDRY AVENUE; small business) : $26,739 in 151 contractsfrom 2002 to 2006
Contracts for Drill Bits, Counterbores, and Counter-sinks; Hand and Machine, Hand Tools, Nonedged, Nonpowered, Hand Tools, Power Driven by Army, Federal Supply Service Signed by year:2000: $0; 2001: $0; 2002: $1,000; 2003: $905; 2004: $3,253; 2005: $13,825; 2006: $7,756.
Biggest contracts:
$3,065 with Army for Drill Bits, Counterbores, and Counter-sinks; Hand and Machine. Signed on 2005-03-11. Completion date: 2005-06-03.
$2,554, same as above.Signed on 2005-12-27. Completion date: 2006-03-28.
$1,500 with Federal Supply Service for Hand Tools, Nonedged, Nonpowered. Signed on 2005-03-14. Completion date: 2005-06-15.
$1,425, same as above.Signed on 2005-06-14. Completion date: 2005-09-15.
J S A ENTERPRISES, INC (523 HINDRY AVE; small business)
$21,745 with Department of Defense for Maintenance, Repair and Rebuilding of Equipment -- Refrigeration, Air Conditioning, and Air Circulating Equipment. Signed on 2004-10-01. Completion date: 2005-09-30.
GEONET, INC (9111 S LA CIENEGA BLVD STE; small business)
$5,262 with Army for ADP Software, Equipment, and Telecommunications Training. Signed on 2003-09-23. Completion date: 2003-10-03.
ECORPS (419 HINDRY AVE UNIT C; small business)
$2,736 with Army for Miscellaneous Items. Taking place in MD. Signed on 2005-09-14. Completion date: 2005-09-30.
CORLAND CO (327 S ISIS AVENUE; small business) : $755 in 2 contractsin 2004
$596 with Army for Coil, Flat, Leaf, and Wire Springs. Signed on 2004-07-22. Completion date: 2004-10-14.
$159, same as above.Signed on 2004-07-22. Completion date: 2004-10-18.
Top industries in this zip code by the number of employees in 2005:
Administrative and Support and Waste Management and Remediation Services: Office Administrative Services (over 1000 employees: 1 establishment, 5-9 employees: 2 establishments, 1-4 employees: 4 establishments)


 Nearest zip codes: 90304, 90302, 90305, 90303, 90056, 90043.