Estimated zip code population in 2022: 25,511 Zip code population in 2010: 28,210 Zip code population in 2000: 28,679
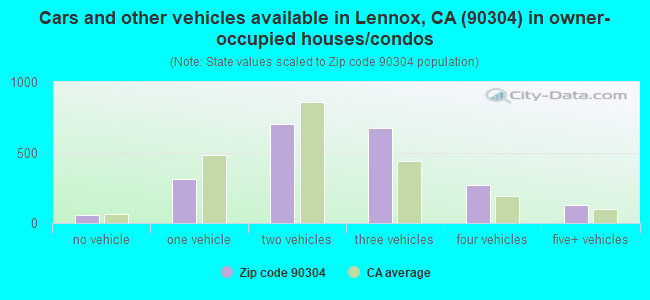
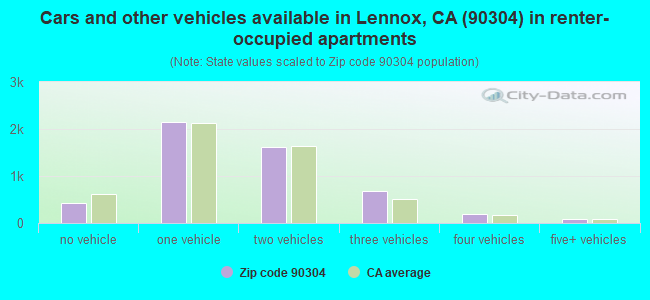
Houses and condos: 7,656 Renter-occupied apartments: 5,132
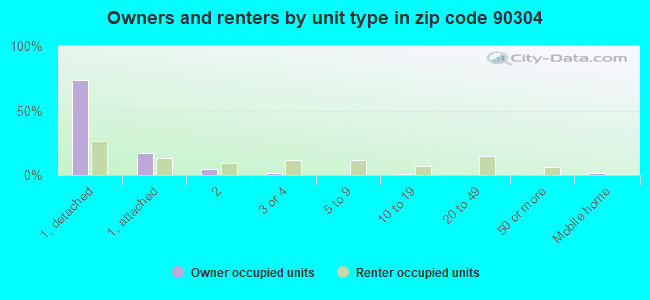
% of renters here:
70%
State:
44%
March 2022 cost of living index in zip code 90304: 140.0 (high, U.S. average is 100)
Land area: 1.6 sq. mi. Water area: 0.0 sq. mi.
Population density: 16,284 people per square mile
(very high).
OSM Map
General Map
Google Map
MSN Map
OSM Map
General Map
Google Map
MSN Map
OSM Map
General Map
Google Map
MSN Map
OSM Map
General Map
Google Map
MSN Map
Please wait while loading the map...
Real estate property taxes paid for housing units in 2022:
This zip code:
0.6% ($4,749)
California:
0.7% ($4,831)
Median real estate property taxes paid for housing units with mortgages in 2022: $4,956 (0.7%) Median real estate property taxes paid for housing units with no mortgage in 2022: $4,192 (0.6%)
Business Search- 14 Million verified businesses
Males: 13,312
(52.2%)
Females: 12,198
(47.8%)
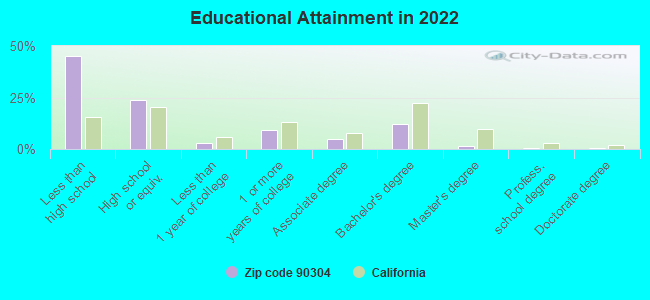
For population 25 years and over in 90304:
High school or higher: 54.4%
Bachelor's degree or higher: 14.2%
Graduate or professional degree: 2.3%
Unemployed: 4.9%
Mean travel time to work (commute): 27.5 minutes
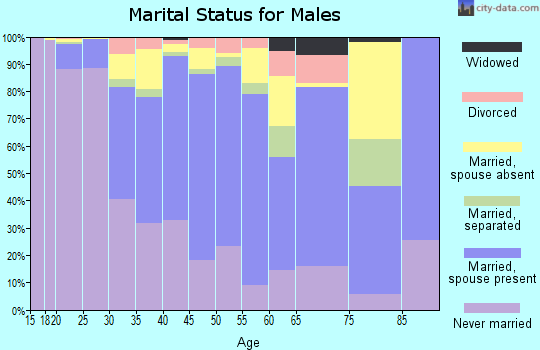
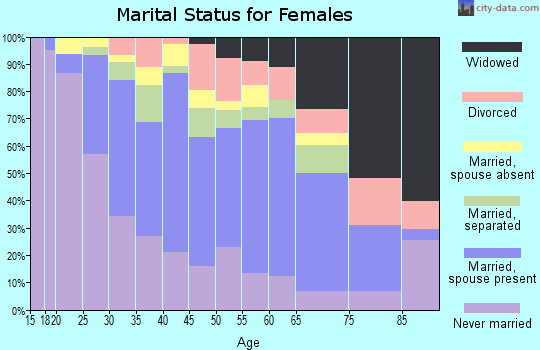
For population 15 years and over in 90304:
Never married: 44.1%
Now married: 44.3%
Separated: 2.4%
Widowed: 3.2%
Divorced: 6.0%
Zip code 90304 compared to state average:
Median household income below state average.
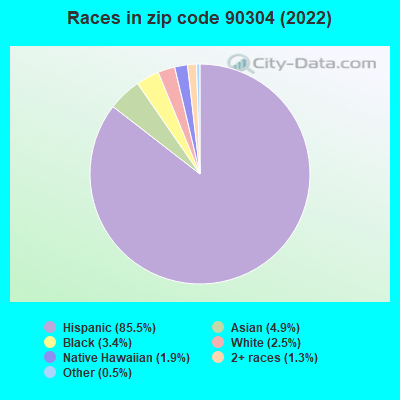
Hispanic race population percentage above state average.
Foreign-born population percentage above state average.
Renting percentage above state average.
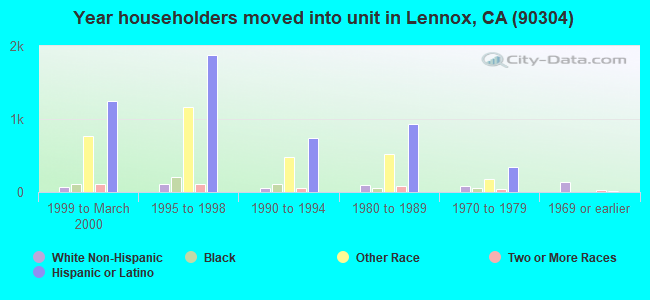
Length of stay since moving in significantly above state average.
Number of rooms per house below state average.
Percentage of population with a bachelor's degree or higher significantly below state average.
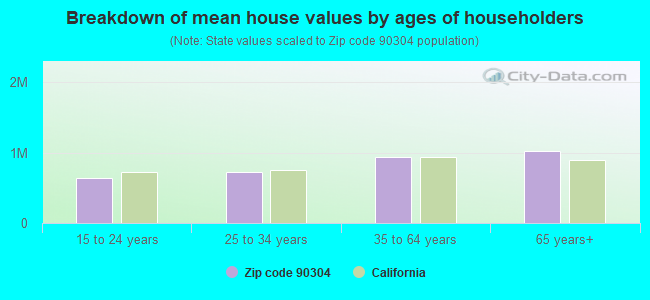
Estimated median house/condo value in 2022: $740,983
90304:
$740,983
California:
$715,900
According to our research of California and other state lists, there were 32 registered sex offenders living in 90304 zip code as of April 27, 2024. The ratio of all residents to sex offenders in zip code 90304 is 856 to 1. The ratio of registered sex offenders to all residents in this zip code is near the state average.
Median resident age:
This zip code:
34.1 years
California median age:
37.9 years
Average household size:
This zip code:
3.5 people
California:
2.8 people
Averages for the 2020 tax year for zip code 90304, filed in 2021:
Average Adjusted Gross Income (AGI) in 2020: $38,560 (Individual Income Tax Returns)
Here:
$38,560
State:
$95,910
Salary/wage: $36,405 (reported on 84.2% of returns)
Here:
$36,405
State:
$77,331
(% of AGI for various income ranges: 1286.2% for AGIs below $25k, 3962.4% for AGIs $25k-50k, 7603.1% for AGIs $50k-75k, 12178.8% for AGIs $75k-100k, 20290.7% for AGIs $100k-200k, 87365.0% for AGIs over 200k)
Taxable interest for individuals: $342 (reported on 14.9% of returns)
This zip code:
$342
California:
$2,294
(% of AGI for various income ranges: 2.8% for AGIs below $25k, 4.4% for AGIs $25k-50k, 8.2% for AGIs $50k-75k, 20.0% for AGIs $75k-100k, 37.1% for AGIs $100k-200k, 605.0% for AGIs over 200k)
Ordinary dividends: $1,813 (reported on 3.8% of returns)
Here:
$1,813
State:
$10,949
(% of AGI for various income ranges: 2.8% for AGIs below $25k, 2.0% for AGIs $25k-50k, 16.7% for AGIs $50k-75k, 20.2% for AGIs $75k-100k, 46.1% for AGIs $100k-200k, 1530.0% for AGIs over 200k)
Net capital gain/loss in AGI: +$4,435 (reported on 4.9% of returns)
Here:
+$4,435
State:
+$49,306
(% of AGI for various income ranges: 0.8% for AGIs $25k-50k, 10.1% for AGIs $50k-75k, 38.5% for AGIs $75k-100k, 505.0% for AGIs $100k-200k, 4865.0% for AGIs over 200k)
Profit/loss from business: +$7,915 (reported on 20.5% of returns)
Here:
+$7,915
State:
+$15,671
(% of AGI for various income ranges: 325.8% for AGIs below $25k, 158.0% for AGIs $25k-50k, 194.1% for AGIs $50k-75k, 242.2% for AGIs $75k-100k, 464.3% for AGIs $100k-200k)
Taxable individual retirement arrangement distribution: $14,288 (reported on 1.4% of returns)
90304:
$14,288
California:
$23,505
(% of AGI for various income ranges: 8.2% for AGIs below $25k, 10.8% for AGIs $25k-50k, 70.5% for AGIs $50k-75k, 379.3% for AGIs $100k-200k)
Total itemized deductions: $27,168 (reported on 5.3% of returns)
Here:
$27,168
State:
$39,517
(% of AGI for various income ranges: 31.3% for AGIs below $25k, 112.0% for AGIs $25k-50k, 331.7% for AGIs $50k-75k, 801.0% for AGIs $75k-100k, 1566.8% for AGIs $100k-200k, 8760.0% for AGIs over 200k)
Charity contributions: $4,273 (reported on 4.2% of returns)
Here:
$4,273
State:
$12,598
(% of AGI for various income ranges: 1.7% for AGIs below $25k, 16.0% for AGIs $25k-50k, 36.1% for AGIs $50k-75k, 92.7% for AGIs $75k-100k, 221.1% for AGIs $100k-200k, 1265.0% for AGIs over 200k)
Taxes paid: $7,677 (reported on 5.3% of returns)
90304:
$7,677
State:
$8,807
(% of AGI for various income ranges: 7.0% for AGIs below $25k, 28.7% for AGIs $25k-50k, 103.5% for AGIs $50k-75k, 239.0% for AGIs $75k-100k, 457.9% for AGIs $100k-200k, 2275.0% for AGIs over 200k)
Earned income credit: $2,315 (reported on 23.9% of returns)
Here:
$2,315
State:
$2,074
(% of AGI for various income ranges: 131.2% for AGIs below $25k, 79.0% for AGIs $25k-50k, 0.9% for AGIs $50k-75k)
Percentage of individuals using paid preparers for their 2020 taxes: 91.6%
Here:
92%
State:
92%
(% for various income ranges: 88.8% for AGIs below $25k, 93.0% for AGIs $25k-50k, 94.2% for AGIs $50k-75k, 94.0% for AGIs $75k-100k, 94.2% for AGIs $100k-200k, 100.0% for AGIs over 200k)
Averages for the 2012 tax year for zip code 90304, filed in 2013:
Average Adjusted Gross Income (AGI) in 2012: $27,589 (Individual Income Tax Returns)
Here:
$27,589
State:
$72,726
Salary/wage: $27,868 (reported on 85.2% of returns)
Here:
$27,868
State:
$59,079
(% of AGI for various income ranges: 78.0% for AGIs below $25k, 92.5% for AGIs $25k-50k, 91.6% for AGIs $50k-75k, 88.8% for AGIs $75k-100k, 70.8% for AGIs $100k-200k)
Taxable interest for individuals: $408 (reported on 13.5% of returns)
This zip code:
$408
California:
$2,146
(% of AGI for various income ranges: 0.1% for AGIs below $25k, 0.1% for AGIs $25k-50k, 0.1% for AGIs $50k-75k, 0.1% for AGIs $75k-100k, 1.1% for AGIs $100k-200k)
Ordinary dividends: $1,588 (reported on 2.2% of returns)
Here:
$1,588
State:
$9,308
(% of AGI for various income ranges: 0.1% for AGIs below $25k, 0.2% for AGIs $50k-75k, 0.1% for AGIs $75k-100k, 0.5% for AGIs $100k-200k)
Net capital gain/loss in AGI: +$763 (reported on 1.7% of returns)
Here:
+$763
State:
+$30,460
(% of AGI for various income ranges: 0.6% for AGIs $100k-200k)
Profit/loss from business: +$9,684 (reported on 20.6% of returns)
Here:
+$9,684
State:
+$17,064
(% of AGI for various income ranges: 18.0% for AGIs below $25k, 4.0% for AGIs $25k-50k, 2.0% for AGIs $50k-75k, 1.4% for AGIs $75k-100k, 0.1% for AGIs $100k-200k)
Taxable individual retirement arrangement distribution: $8,247 (reported on 1.5% of returns)
90304:
$8,247
California:
$19,557
(% of AGI for various income ranges: 0.4% for AGIs below $25k, 0.3% for AGIs $25k-50k, 0.8% for AGIs $50k-75k, 1.1% for AGIs $75k-100k)
Total itemized deductions: $19,356 (35% of AGI, reported on 14.6% of returns)
Here:
$19,356
State:
$34,004
Here:
34.6% of AGI
State:
22.7% of AGI
(% of AGI for various income ranges: 4.0% for AGIs below $25k, 9.0% for AGIs $25k-50k, 15.7% for AGIs $50k-75k, 19.8% for AGIs $75k-100k, 17.8% for AGIs $100k-200k)
Charity contributions: $2,137 (reported on 11.0% of returns)
Here:
$2,137
State:
$4,659
(% of AGI for various income ranges: 0.2% for AGIs below $25k, 0.7% for AGIs $25k-50k, 1.4% for AGIs $50k-75k, 1.7% for AGIs $75k-100k, 1.5% for AGIs $100k-200k)
Taxes paid: $5,187 (reported on 14.6% of returns)
90304:
$5,187
State:
$14,448
(% of AGI for various income ranges: 0.8% for AGIs below $25k, 2.0% for AGIs $25k-50k, 4.1% for AGIs $50k-75k, 6.0% for AGIs $75k-100k, 7.3% for AGIs $100k-200k)
Earned income credit: $2,683 (reported on 35.2% of returns)
Here:
$2,683
State:
$2,286
(% of AGI for various income ranges: 9.2% for AGIs below $25k, 2.0% for AGIs $25k-50k)
Percentage of individuals using paid preparers for their 2012 taxes: 81.7%
Here:
82%
State:
64%
(% for various income ranges: 80.4% for AGIs below $25k, 84.0% for AGIs $25k-50k, 83.1% for AGIs $50k-75k, 82.1% for AGIs $75k-100k, 76.5% for AGIs $100k-200k)
Averages for the 2004 tax year for zip code 90304, filed in 2005:
Average Adjusted Gross Income (AGI) in 2004: $24,722 (Individual Income Tax Returns)
Here:
$24,722
State:
$58,600
Salary/wage: $25,095 (reported on 88.9% of returns)
Here:
$25,095
State:
$49,455
(% of AGI for various income ranges: 83.5% for AGIs below $10k, 87.5% for AGIs $10k-25k, 95.4% for AGIs $25k-50k, 91.3% for AGIs $50k-75k, 89.2% for AGIs $75k-100k, 69.3% for AGIs over 100k)
Taxable interest for individuals: $426 (reported on 19.8% of returns)
This zip code:
$426
California:
$2,365
(% of AGI for various income ranges: 0.9% for AGIs below $10k, 0.3% for AGIs $10k-25k, 0.2% for AGIs $25k-50k, 0.6% for AGIs $50k-75k, 0.4% for AGIs $75k-100k, 0.7% for AGIs over 100k)
Taxable dividends: $1,050 (reported on 2.9% of returns)
Here:
$1,050
State:
$4,746
(% of AGI for various income ranges: 0.3% for AGIs below $10k, 0.1% for AGIs $10k-25k, 0.1% for AGIs $25k-50k, 0.2% for AGIs $50k-75k, 0.1% for AGIs $75k-100k, 0.3% for AGIs over 100k)
Net capital gain/loss: +$5,583 (reported on 2.4% of returns)
Here:
+$5,583
State:
+$23,418
(% of AGI for various income ranges: -0.3% for AGIs below $10k, -0.0% for AGIs $10k-25k, -0.1% for AGIs $25k-50k, -0.1% for AGIs $50k-75k, 2.9% for AGIs $75k-100k, 8.5% for AGIs over 100k)
Profit/loss from business: +$8,267 (reported on 16.1% of returns)
Here:
+$8,267
State:
+$16,826
(% of AGI for various income ranges: 27.0% for AGIs below $10k, 9.6% for AGIs $10k-25k, 2.6% for AGIs $25k-50k, 2.4% for AGIs $50k-75k, 1.3% for AGIs $75k-100k, -0.9% for AGIs over 100k)
IRA payment deduction: $2,221 (reported on 0.8% of returns)
90304:
$2,221
California:
$3,192
Total itemized deductions: $16,476 (37% of AGI, reported on 17.6% of returns)
Here:
$16,476
State:
$28,113
Here:
36.7% of AGI
State:
25.3% of AGI
(% of AGI for various income ranges: 6.4% for AGIs below $10k, 6.2% for AGIs $10k-25k, 12.2% for AGIs $25k-50k, 17.2% for AGIs $50k-75k, 21.1% for AGIs $75k-100k, 19.5% for AGIs over 100k)
Charity contributions deductions: $1,856 (4% of AGI, reported on 14.2% of returns)
Here:
$1,856
State:
$3,923
Here:
3.9% of AGI
State:
3.3% of AGI
(% of AGI for various income ranges: 0.3% for AGIs below $10k, 0.4% for AGIs $10k-25k, 1.1% for AGIs $25k-50k, 1.8% for AGIs $50k-75k, 1.8% for AGIs $75k-100k, 2.2% for AGIs over 100k)
Total tax: $2,128 (reported on 55.7% of returns)
90304:
$2,128
State:
$10,761
(% of AGI for various income ranges: 4.7% for AGIs below $10k, 3.1% for AGIs $10k-25k, 3.8% for AGIs $25k-50k, 6.4% for AGIs $50k-75k, 8.4% for AGIs $75k-100k, 14.4% for AGIs over 100k)
Earned income credit: $2,083 (reported on 38.0% of returns)
Here:
$2,083
State:
$1,763
Percentage of individuals using paid preparers for their 2004 taxes: 84.0%
Here:
84%
State:
66%
(% for various income ranges: 80.1% for AGIs below $10k, 85.8% for AGIs $10k-25k, 83.8% for AGIs $25k-50k, 85.1% for AGIs $50k-75k, 82.1% for AGIs $75k-100k, 81.4% for AGIs over 100k)
Likely homosexual households (counted as self-reported same-sex unmarried-partner households)
Lesbian couples: 0.2% of all households
Gay men: 0.0% of all households
Household received Food Stamps/SNAP in the past 12 months: 1,771 Household did not receive Food Stamps/SNAP in the past 12 months: 5,708
Women who had a birth in the past 12 months: 443 (260 now married, 184 unmarried) Women who did not have a birth in the past 12 months: 5,933 (1,951 now married, 3,998 unmarried)
Housing units in zip code 90304 with a mortgage: 1,479 (80 second mortgage, 22 home equity loan, 29 both second mortgage and home equity loan) Houses without a mortgage: 28
Median monthly owner costs for units with a mortgage: $2,388 Median monthly owner costs for units without a mortgage: $725
Residents with income below the poverty level in 2022:
This zip code:
18.1%
Whole state:
12.2%
Residents with income below 50% of the poverty level in 2022:
This zip code:
9.0%
Whole state:
6.2%
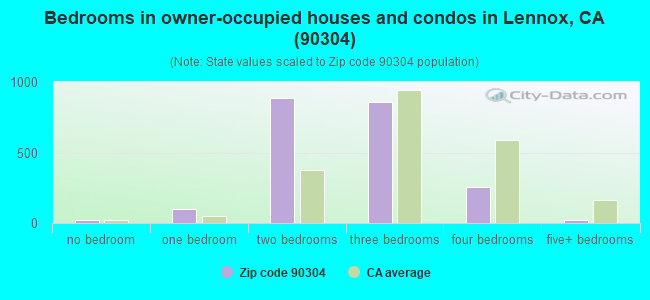
Median number of rooms in houses and condos:
Here:
5.1
State:
6.0
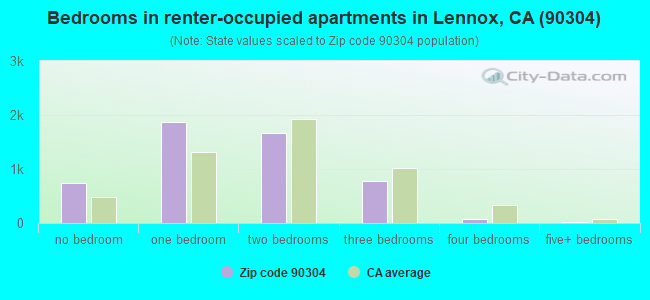
Median number of rooms in apartments:
Here:
3.5
State:
3.9
Notable locations in this zip code not listed on our city pages
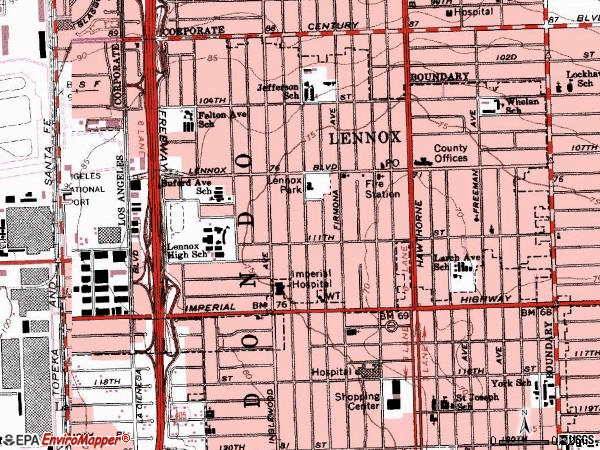
Notable locations in zip code 90304: Lennox Branch County of Los Angeles Public Library (A), Lennox Sheriffs Station (B), Los Angeles County Fire Department Station 18 (C). Display/hide their locations on the map
Churches in zip code 90304 include: Lennox Bethany Baptist CHurch (A), Iglesia Nuevas de Gozo (B), Lennox United Methodist Church (C). Display/hide their locations on the map
3,295 married couples with children.
1,944 single-parent households (590 men, 1,354 women).
14.5% of residents of 90304 zip code speak English at home.
79.3% of residents speak Spanish at home (51% very well, 19% well, 21% not well, 9% not at all).
2.1% of residents speak other Indo-European language at home (35% very well, 51% well, 7% not well, 8% not at all).
4.2% of residents speak Asian or Pacific Island language at home (60% very well, 26% well, 14% not well).
Foreign born population: 12,004 (47.1%) (41.9% of them are naturalized citizens)
This zip code:
47.1%
Whole state:
26.7%
67%Honduras
9%El Salvador
6%Costa Rica
3%Guatemala
3%Bhutan
2%Malaysia
2%Micronesia
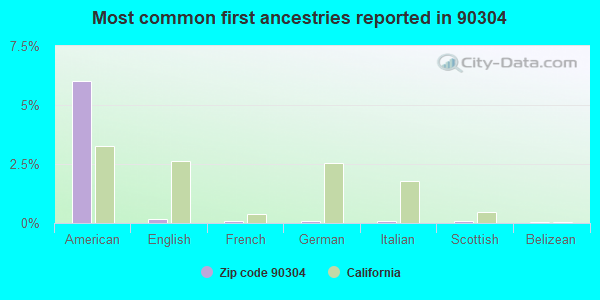
6%American
0%English
0%French
0%German
0%Italian
0%Scottish
0%Belizean
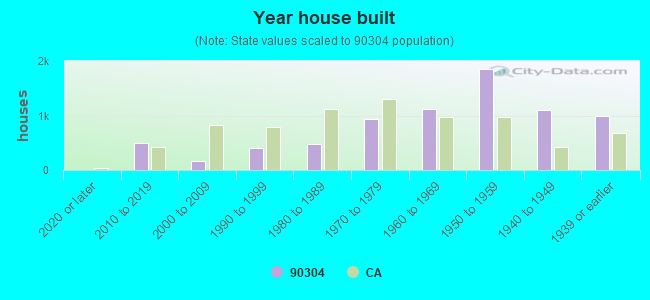
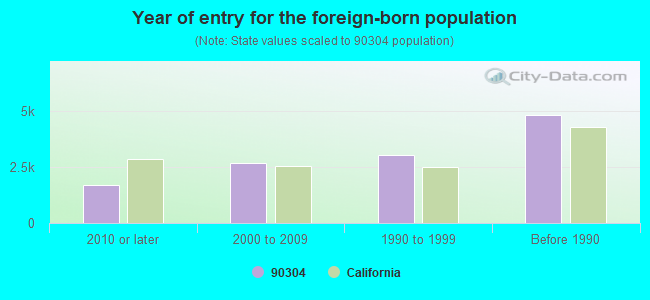
Year of entry for the foreign-born population
1,6832010 or later
2,6492000 to 2009
3,0101990 to 1999
4,801Before 1990
Facilities with environmental interests located in this zip code:
MINIS AUTO BODY (11016 LA CIENEGA BLVD in INGLEWOOD, CA)
STATE MASTER (California - Hazardous Waste Tracking) - HAZARDOU WASTE PROGRAM Small Quantity Generators, between 100 kg and 1000 kg of hazardous waste/month (Resource Conservation and Recovery Act (tracking hazardous waste)) - notification Organizations: PATTY WAGNIEYE (CONTACT/OWNER)
Alternative names: MINI'S AUTO BODY SHOP INC
CHEVRON STATION NO 206907 (4015 W CENTURY BLVD in INGLEWOOD, CA)
STATE MASTER (California - Hazardous Waste Tracking) - HAZARDOU WASTE PROGRAM Small Quantity Generators, between 100 kg and 1000 kg of hazardous waste/month (Resource Conservation and Recovery Act (tracking hazardous waste)) - notification Organizations: CHEVRON PRODUCTS CO (CONTACT/OWNER)
CHEVRON STATION NO 97240 (5156 W CENTURY BLVD in INGLEWOOD, CA)
STATE MASTER (California - Hazardous Waste Tracking) - HAZARDOU WASTE PROGRAM Small Quantity Generators, between 100 kg and 1000 kg of hazardous waste/month (Resource Conservation and Recovery Act (tracking hazardous waste)) - notification Organizations: CHEVRON PRODUCTS CO (CONTACT/OWNER)
FELTON ELEMENTARY (10417 FELTON AVE. in LENNOX, CA)
(National Center for Education Statistics) - STATE ID-6014955 Organizations: LENNOX ELEMENTARY (SCHOOL DISTRICT)
JEFFERSON ELEMENTARY (10322 CONDON AVE. in LENNOX, CA)
(National Center for Education Statistics) - STATE ID-6014963 Organizations: LENNOX ELEMENTARY (SCHOOL DISTRICT)
LENNOX MIDDLE (11033 BUFORD AVE. in LENNOX, CA)
(National Center for Education Statistics) - STATE ID-6106736 Organizations: LENNOX ELEMENTARY (SCHOOL DISTRICT)
MOFFETT ELEMENTARY (11050 LARCH AVE. in LENNOX, CA)
(National Center for Education Statistics) - STATE ID-6014971 Organizations: LENNOX ELEMENTARY (SCHOOL DISTRICT)
LENNOX SCHOOL DISTRICT (10319 FIRNONA AVENUE in LENNOX, CA)
COMPLIANCE ACTIVITY (Tracking inspections of insecticide, fungicide, and rodenticide, and toxic substances) Alternative names: LENNOX ELEMENTARY SD, LENOX SCHOOL DIST
HAWTHORNE TOWER MEDICAL LABORATORY (4649 W IMPERIAL HWY in INGLEWOOD, CA)
Small Quantity Generators, between 100 kg and 1000 kg of hazardous waste/month (Resource Conservation and Recovery Act (tracking hazardous waste)) Organizations: HAWTHORNE COMMUNITY MEDICAL GROUP INC (CONTACT/OWNER)
IMPERIAL UNOCAL (4410 W IMPERIAL HWY in INGLEWOOD, CA)
Small Quantity Generators, between 100 kg and 1000 kg of hazardous waste/month (Resource Conservation and Recovery Act (tracking hazardous waste)) - notification
MORNINGSIDE AUTO SVC (11133 HAWTHORNE BLVD in INGLEWOOD, CA)
Small Quantity Generators, between 100 kg and 1000 kg of hazardous waste/month (Resource Conservation and Recovery Act (tracking hazardous waste)) Organizations: MORNINGSIDE AUTO INC (CONTACT/OWNER)
HENRYS AUTO REPAIR (10101 S HAWTHORNE BLVD in INGLEWOOD, CA)
Small Quantity Generators, between 100 kg and 1000 kg of hazardous waste/month (Resource Conservation and Recovery Act (tracking hazardous waste)) - notification Organizations: WAGON CITY (CONTACT/OWNER)
Housing units lacking complete plumbing facilities: 1.1% Housing units lacking complete kitchen facilities: 4.9%
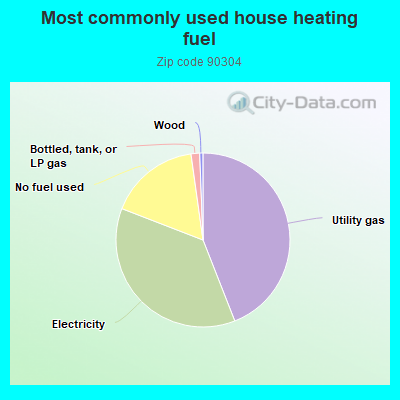
44.0%Utility gas
36.8%Electricity
16.9%No fuel used
1.6%Bottled, tank, or LP gas
0.6%Wood
Population in 1990: 28,216. Population change in the 1990s: +463 (+1.6%).
Place of birth for U.S.-born residents:
This state: 12,340
Northeast: 150
Midwest: 192
South: 385
West: 204
61% of the 90304 zip code residents lived in the same house 5 years ago. Out of people who lived in different houses, 93% lived in this county. Out of people who lived in different counties, 50% lived in California.
95% of the 90304 zip code residents lived in the same house 1 year ago. Out of people who lived in different houses, 81% moved from this county. Out of people who lived in different houses, 9% moved from different county within same state. Out of people who lived in different houses, 12% moved from different state.
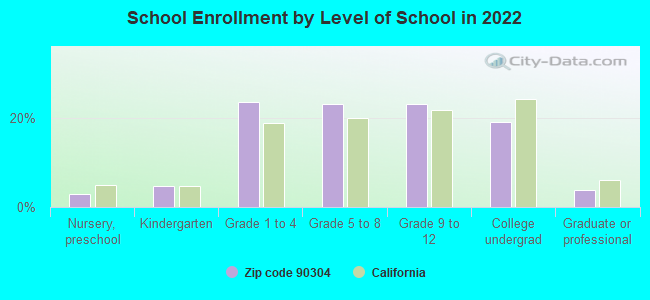
Private vs. public school enrollment:
Students in private schools in grades 1 to 8 (elementary and middle school): 210
Here:
7.0%
California:
10.5%
Students in private schools in grades 9 to 12 (high school): 44
Here:
3.0%
California:
8.5%
Students in private undergraduate colleges: 238
Here:
19.1%
California:
15.9%
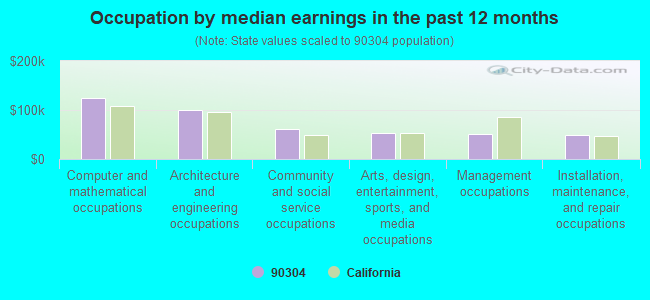
Occupation by median earnings in the past 12 months ($)
124,206Computer and mathematical occupations
99,783Architecture and engineering occupations
60,786Community and social service occupations
53,829Arts, design, entertainment, sports, and media occupations
51,056Management occupations
49,199Installation, maintenance, and repair occupations
Companies with federal contracts located in this zip code:
CUSTOMER SERVICE, INC (11222 SOUTH LA CIENEGA, SU in INGLEWOOD, CA; small business) : $13,790,744 in 90 contractsfrom 1999 to 2004
Contracts for Other Housekeeping Services, Custodial Janitorial Services, Miscellaneous Service and Trade Equipment by Department of Defense, Defense Commissary Agency, Army, Immigration and Naturalization Service, and others Signed by year:2000: $4,000,876; 2001: $5,117,738; 2002: $3,668,297; 2003: -$70,886; 2004: -$58,215; 2005: $0; 2006: $0.
Biggest contracts:
$1,165,723 with Department of Defense for Other Housekeeping Services. Signed on 2002-07-01. Completion date: 2001-11-30.
$879,762, same as above.Signed on 2001-02-28. Completion date: 2001-11-30.
$877,678, same as above.Signed on 2002-10-31. Completion date: 2003-03-31.
$731,575 with Department of Defense for Other Housekeeping Services. Taking place in AL. Signed on 2002-05-01. Completion date: 2003-04-30.
EDEL ENGINEERING DEVELOPMENT C (10524 S LA CIENEGA BLVD in INGLEWOOD, CA; small business) : $3,464,385 in 137 contractsfrom 1999 to 2006
Contracts for Aircraft Air Conditioning, Heating, and Pressurizing Equipment, Miscellaneous Electric Power and Distribution Equipment, Antennas, Waveguides, and Related Equipment, Electrical Hardware and Supplies, and moreby Defense Logistics Agency, Army, Navy, Air Force, and others Signed by year:2000: $312,285; 2001: $466,642; 2002: $474,410; 2003: $149,238; 2004: $573,139; 2005: $929,023; 2006: $467,005.
Biggest contracts:
$239,410 with Defense Logistics Agency for Aircraft Air Conditioning, Heating, and Pressurizing Equipment. Signed on 2005-02-23. Completion date: 2005-04-24.
$195,300 with Army for Miscellaneous Electric Power and Distribution Equipment. Signed on 2006-01-23. Completion date: 2006-09-22.
$86,868 with Defense Logistics Agency for Aircraft Air Conditioning, Heating, and Pressurizing Equipment. Signed on 1999-11-26. Completion date: 2000-02-17.
$86,868, same as above.Signed on 2000-02-14. Completion date: 2000-11-14.
ENGINEERED MAGNETICS, INC (10524 S LA CIENEGA BLVD in INGLEWOOD, CA; small business) : $1,362,107 in 52 contractsfrom 1999 to 2005
Contracts for Miscellaneous Communication Equipment, Electrical and Electronic assemblies, Boards, Cards, and Associated Hardware, Cable, Cord, and Wire Assemblies: Communications Equipment, Launchers, Guided Missile, and moreby Defense Logistics Agency, Air Force Signed by year:2000: $0; 2001: $262,117; 2002: $649,964; 2003: $0; 2004: $351,406; 2005: $42,470; 2006: $0.
Biggest contracts:
$215,160 with Defense Logistics Agency for Miscellaneous Communication Equipment. Signed on 2002-03-29. Completion date: 2002-09-15.
$99,433, same as above.Signed on 2001-06-05. Completion date: 2001-10-03.
$98,464 with Defense Logistics Agency for Electrical and Electronic assemblies, Boards, Cards, and Associated Hardware. Signed on 2002-05-30. Completion date: 2002-09-29.
$89,776, same as above.Signed on 2002-05-22. Completion date: 2002-09-21.
Top industries in this zip code by the number of employees in 2005:


 Nearest zip codes: 90301, 90250, 90303, 90305, 90302, 90260.