Estimated zip code population in 2022: 33,005 Zip code population in 2010: 34,924 Zip code population in 2000: 33,299
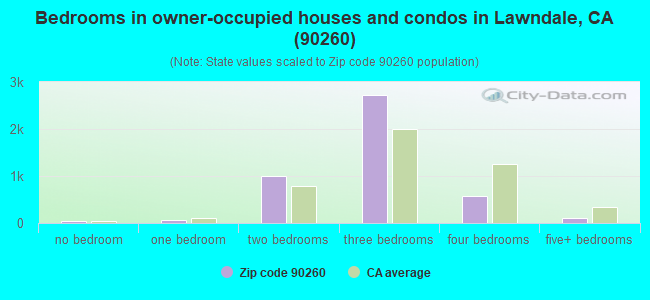
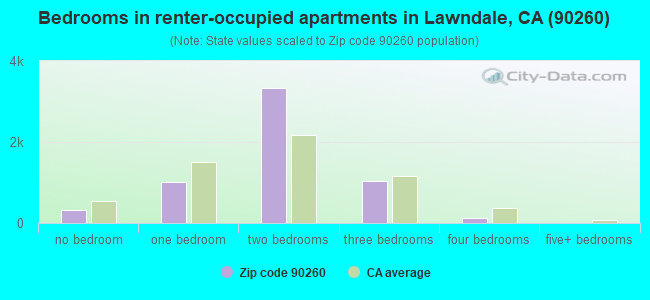
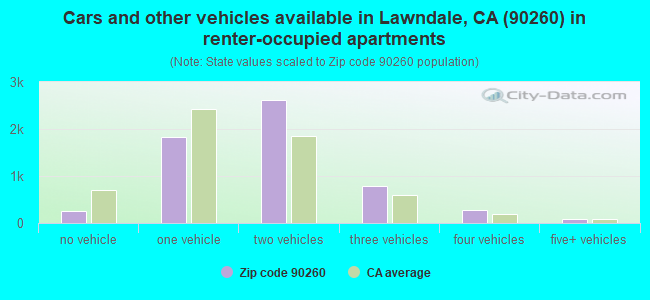
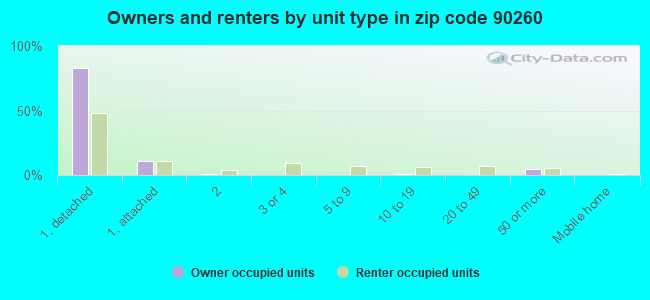
Houses and condos: 10,854 Renter-occupied apartments: 5,862
% of renters here:
56%
State:
44%
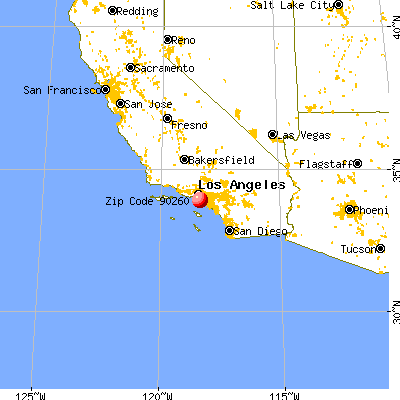
March 2022 cost of living index in zip code 90260: 135.6 (high, U.S. average is 100)
Land area: 2.7 sq. mi. Water area: 0.0 sq. mi.
Population density: 12,315 people per square mile
(very high).
OSM Map
General Map
Google Map
MSN Map
OSM Map
General Map
Google Map
MSN Map
OSM Map
General Map
Google Map
MSN Map
OSM Map
General Map
Google Map
MSN Map
Please wait while loading the map...
Real estate property taxes paid for housing units in 2022:
This zip code:
0.6% ($4,298)
California:
0.7% ($4,831)
Median real estate property taxes paid for housing units with mortgages in 2022: $4,613 (0.6%) Median real estate property taxes paid for housing units with no mortgage in 2022: $3,754 (0.5%)
Estimated median house/condo value in 2022: $747,172
90260:
$747,172
California:
$715,900
According to our research of California and other state lists, there were 35 registered sex offenders living in 90260 zip code as of April 26, 2024. The ratio of all residents to sex offenders in zip code 90260 is 1,031 to 1. The ratio of registered sex offenders to all residents in this zip code is lower than the state average.
Median resident age:
This zip code:
36.9 years
California median age:
37.9 years
Average household size:
This zip code:
3.1 people
California:
2.8 people
Averages for the 2020 tax year for zip code 90260, filed in 2021:
Average Adjusted Gross Income (AGI) in 2020: $49,385 (Individual Income Tax Returns)
Here:
$49,385
State:
$95,910
Salary/wage: $46,749 (reported on 81.7% of returns)
Here:
$46,749
State:
$77,331
(% of AGI for various income ranges: 1194.6% for AGIs below $25k, 3962.5% for AGIs $25k-50k, 7770.0% for AGIs $50k-75k, 11180.1% for AGIs $75k-100k, 19585.6% for AGIs $100k-200k, 71265.6% for AGIs over 200k)
Taxable interest for individuals: $559 (reported on 21.2% of returns)
This zip code:
$559
California:
$2,294
(% of AGI for various income ranges: 6.7% for AGIs below $25k, 10.0% for AGIs $25k-50k, 19.0% for AGIs $50k-75k, 36.8% for AGIs $75k-100k, 59.4% for AGIs $100k-200k, 270.0% for AGIs over 200k)
Ordinary dividends: $2,903 (reported on 8.6% of returns)
Here:
$2,903
State:
$10,949
(% of AGI for various income ranges: 5.6% for AGIs below $25k, 11.0% for AGIs $25k-50k, 29.5% for AGIs $50k-75k, 40.2% for AGIs $75k-100k, 116.6% for AGIs $100k-200k, 1936.7% for AGIs over 200k)
Net capital gain/loss in AGI: +$9,472 (reported on 9.9% of returns)
Here:
+$9,472
State:
+$49,306
(% of AGI for various income ranges: 6.5% for AGIs below $25k, 11.8% for AGIs $25k-50k, 30.4% for AGIs $50k-75k, 73.1% for AGIs $75k-100k, 379.5% for AGIs $100k-200k, 11825.6% for AGIs over 200k)
Profit/loss from business: +$7,149 (reported on 22.9% of returns)
Here:
+$7,149
State:
+$15,671
(% of AGI for various income ranges: 289.5% for AGIs below $25k, 194.1% for AGIs $25k-50k, 201.5% for AGIs $50k-75k, 262.6% for AGIs $75k-100k, 319.2% for AGIs $100k-200k, 900.0% for AGIs over 200k)
Taxable individual retirement arrangement distribution: $19,908 (reported on 3.1% of returns)
90260:
$19,908
California:
$23,505
(% of AGI for various income ranges: 22.3% for AGIs below $25k, 33.9% for AGIs $25k-50k, 79.1% for AGIs $50k-75k, 253.4% for AGIs $75k-100k, 373.6% for AGIs $100k-200k, 1964.4% for AGIs over 200k)
Total itemized deductions: $27,427 (reported on 9.5% of returns)
Here:
$27,427
State:
$39,517
(% of AGI for various income ranges: 51.0% for AGIs below $25k, 153.7% for AGIs $25k-50k, 439.0% for AGIs $50k-75k, 864.4% for AGIs $75k-100k, 1757.9% for AGIs $100k-200k, 7548.9% for AGIs over 200k)
Charity contributions: $5,005 (reported on 7.8% of returns)
Here:
$5,005
State:
$12,598
(% of AGI for various income ranges: 2.9% for AGIs below $25k, 19.8% for AGIs $25k-50k, 69.2% for AGIs $50k-75k, 109.5% for AGIs $75k-100k, 283.1% for AGIs $100k-200k, 1358.9% for AGIs over 200k)
Taxes paid: $8,432 (reported on 9.4% of returns)
90260:
$8,432
State:
$8,807
(% of AGI for various income ranges: 12.5% for AGIs below $25k, 45.9% for AGIs $25k-50k, 131.9% for AGIs $50k-75k, 282.9% for AGIs $75k-100k, 583.6% for AGIs $100k-200k, 1915.6% for AGIs over 200k)
Earned income credit: $2,018 (reported on 19.9% of returns)
Here:
$2,018
State:
$2,074
(% of AGI for various income ranges: 102.8% for AGIs below $25k, 73.6% for AGIs $25k-50k, 1.1% for AGIs $50k-75k)
Percentage of individuals using paid preparers for their 2020 taxes: 91.8%
Here:
92%
State:
92%
(% for various income ranges: 89.8% for AGIs below $25k, 93.0% for AGIs $25k-50k, 91.6% for AGIs $50k-75k, 92.9% for AGIs $75k-100k, 94.0% for AGIs $100k-200k, 96.8% for AGIs over 200k)
Averages for the 2012 tax year for zip code 90260, filed in 2013:
Average Adjusted Gross Income (AGI) in 2012: $38,567 (Individual Income Tax Returns)
Here:
$38,567
State:
$72,726
Salary/wage: $38,486 (reported on 84.4% of returns)
Here:
$38,486
State:
$59,079
(% of AGI for various income ranges: 74.0% for AGIs below $25k, 88.8% for AGIs $25k-50k, 88.2% for AGIs $50k-75k, 86.9% for AGIs $75k-100k, 84.9% for AGIs $100k-200k, 61.4% for AGIs over 200k)
Taxable interest for individuals: $554 (reported on 21.6% of returns)
This zip code:
$554
California:
$2,146
(% of AGI for various income ranges: 0.3% for AGIs below $25k, 0.2% for AGIs $25k-50k, 0.3% for AGIs $50k-75k, 0.3% for AGIs $75k-100k, 0.4% for AGIs $100k-200k, 0.5% for AGIs over 200k)
Ordinary dividends: $1,927 (reported on 6.9% of returns)
Here:
$1,927
State:
$9,308
(% of AGI for various income ranges: 0.3% for AGIs below $25k, 0.2% for AGIs $25k-50k, 0.3% for AGIs $50k-75k, 0.3% for AGIs $75k-100k, 0.6% for AGIs $100k-200k, 0.7% for AGIs over 200k)
Net capital gain/loss in AGI: +$348 (reported on 5.5% of returns)
Here:
+$348
State:
+$30,460
(% of AGI for various income ranges: 0.4% for AGIs $100k-200k, 0.5% for AGIs over 200k)
Profit/loss from business: +$9,442 (reported on 20.4% of returns)
Here:
+$9,442
State:
+$17,064
(% of AGI for various income ranges: 17.9% for AGIs below $25k, 3.9% for AGIs $25k-50k, 2.1% for AGIs $50k-75k, 1.1% for AGIs $75k-100k, 2.7% for AGIs $100k-200k)
Taxable individual retirement arrangement distribution: $14,772 (reported on 3.8% of returns)
90260:
$14,772
California:
$19,557
(% of AGI for various income ranges: 1.4% for AGIs below $25k, 1.0% for AGIs $25k-50k, 1.1% for AGIs $50k-75k, 1.7% for AGIs $75k-100k, 2.7% for AGIs $100k-200k)
Total itemized deductions: $21,490 (29% of AGI, reported on 24.9% of returns)
Here:
$21,490
State:
$34,004
Here:
29.2% of AGI
State:
22.7% of AGI
(% of AGI for various income ranges: 6.7% for AGIs below $25k, 10.4% for AGIs $25k-50k, 15.6% for AGIs $50k-75k, 18.1% for AGIs $75k-100k, 19.2% for AGIs $100k-200k, 16.4% for AGIs over 200k)
Charity contributions: $2,650 (reported on 19.9% of returns)
Here:
$2,650
State:
$4,659
(% of AGI for various income ranges: 0.4% for AGIs below $25k, 1.0% for AGIs $25k-50k, 1.7% for AGIs $50k-75k, 1.8% for AGIs $75k-100k, 2.0% for AGIs $100k-200k, 1.6% for AGIs over 200k)
Taxes paid: $6,487 (reported on 24.9% of returns)
90260:
$6,487
State:
$14,448
(% of AGI for various income ranges: 1.3% for AGIs below $25k, 2.2% for AGIs $25k-50k, 4.1% for AGIs $50k-75k, 5.8% for AGIs $75k-100k, 7.3% for AGIs $100k-200k, 8.3% for AGIs over 200k)
Earned income credit: $2,425 (reported on 27.2% of returns)
Here:
$2,425
State:
$2,286
(% of AGI for various income ranges: 8.3% for AGIs below $25k, 1.5% for AGIs $25k-50k)
Percentage of individuals using paid preparers for their 2012 taxes: 72.8%
Here:
73%
State:
64%
(% for various income ranges: 73.3% for AGIs below $25k, 74.1% for AGIs $25k-50k, 72.7% for AGIs $50k-75k, 68.9% for AGIs $75k-100k, 67.4% for AGIs $100k-200k, 75.0% for AGIs over 200k)
Averages for the 2004 tax year for zip code 90260, filed in 2005:
Average Adjusted Gross Income (AGI) in 2004: $33,808 (Individual Income Tax Returns)
Here:
$33,808
State:
$58,600
Salary/wage: $33,544 (reported on 87.5% of returns)
Here:
$33,544
State:
$49,455
(% of AGI for various income ranges: 105.2% for AGIs below $10k, 83.6% for AGIs $10k-25k, 91.6% for AGIs $25k-50k, 90.0% for AGIs $50k-75k, 89.1% for AGIs $75k-100k, 71.7% for AGIs over 100k)
Taxable interest for individuals: $721 (reported on 30.1% of returns)
This zip code:
$721
California:
$2,365
(% of AGI for various income ranges: 2.9% for AGIs below $10k, 0.6% for AGIs $10k-25k, 0.5% for AGIs $25k-50k, 0.6% for AGIs $50k-75k, 0.8% for AGIs $75k-100k, 0.8% for AGIs over 100k)
Taxable dividends: $1,194 (reported on 8.9% of returns)
Here:
$1,194
State:
$4,746
(% of AGI for various income ranges: 1.0% for AGIs below $10k, 0.2% for AGIs $10k-25k, 0.2% for AGIs $25k-50k, 0.1% for AGIs $50k-75k, 0.6% for AGIs $75k-100k, 0.5% for AGIs over 100k)
Net capital gain/loss: +$7,699 (reported on 8.2% of returns)
Here:
+$7,699
State:
+$23,418
(% of AGI for various income ranges: -1.3% for AGIs below $10k, -0.1% for AGIs $10k-25k, -0.0% for AGIs $25k-50k, 0.4% for AGIs $50k-75k, 0.6% for AGIs $75k-100k, 11.4% for AGIs over 100k)
Profit/loss from business: +$9,355 (reported on 17.3% of returns)
Here:
+$9,355
State:
+$16,826
(% of AGI for various income ranges: 33.6% for AGIs below $10k, 10.4% for AGIs $10k-25k, 3.3% for AGIs $25k-50k, 2.1% for AGIs $50k-75k, 2.6% for AGIs $75k-100k, 3.8% for AGIs over 100k)
IRA payment deduction: $2,921 (reported on 1.7% of returns)
90260:
$2,921
California:
$3,192
(% of AGI for various income ranges: 0.1% for AGIs $10k-25k, 0.2% for AGIs $25k-50k, 0.2% for AGIs $50k-75k, 0.2% for AGIs $75k-100k, 0.1% for AGIs over 100k)
Self-employed pension: $10,250 (reported on 0.3% of returns)
Here:
$10,250
California:
$17,688
Total itemized deductions: $19,303 (32% of AGI, reported on 29.0% of returns)
Here:
$19,303
State:
$28,113
Here:
32.5% of AGI
State:
25.3% of AGI
(% of AGI for various income ranges: 9.9% for AGIs below $10k, 8.5% for AGIs $10k-25k, 14.4% for AGIs $25k-50k, 19.9% for AGIs $50k-75k, 24.8% for AGIs $75k-100k, 18.9% for AGIs over 100k)
Charity contributions deductions: $2,529 (4% of AGI, reported on 25.0% of returns)
Here:
$2,529
State:
$3,923
Here:
4.0% of AGI
State:
3.3% of AGI
(% of AGI for various income ranges: 0.6% for AGIs below $10k, 0.6% for AGIs $10k-25k, 1.6% for AGIs $25k-50k, 2.5% for AGIs $50k-75k, 2.6% for AGIs $75k-100k, 2.4% for AGIs over 100k)
Total tax: $3,843 (reported on 69.2% of returns)
90260:
$3,843
State:
$10,761
(% of AGI for various income ranges: 6.7% for AGIs below $10k, 4.0% for AGIs $10k-25k, 5.4% for AGIs $25k-50k, 8.1% for AGIs $50k-75k, 9.9% for AGIs $75k-100k, 15.2% for AGIs over 100k)
Earned income credit: $1,866 (reported on 25.6% of returns)
Here:
$1,866
State:
$1,763
Percentage of individuals using paid preparers for their 2004 taxes: 73.4%
Here:
73%
State:
66%
(% for various income ranges: 67.8% for AGIs below $10k, 75.6% for AGIs $10k-25k, 75.5% for AGIs $25k-50k, 71.7% for AGIs $50k-75k, 71.0% for AGIs $75k-100k, 72.1% for AGIs over 100k)
Household received Food Stamps/SNAP in the past 12 months: 1,790 Household did not receive Food Stamps/SNAP in the past 12 months: 8,730
Women who had a birth in the past 12 months: 339 (196 now married, 143 unmarried) Women who did not have a birth in the past 12 months: 7,431 (3,226 now married, 4,194 unmarried)
Housing units in zip code 90260 with a mortgage: 3,103 (202 second mortgage, 150 both second mortgage and home equity loan) Houses without a mortgage: 28
Median monthly owner costs for units with a mortgage: $2,665 Median monthly owner costs for units without a mortgage: $545
Residents with income below the poverty level in 2022:
This zip code:
9.2%
Whole state:
12.2%
Residents with income below 50% of the poverty level in 2022:
This zip code:
4.3%
Whole state:
6.2%
Median number of rooms in houses and condos:
Here:
5.3
State:
6.0
Median number of rooms in apartments:
Here:
4.0
State:
3.9
Notable locations in this zip code not listed on our city pages
Notable locations in zip code 90260: Alondra Golf Course (A), Lawndale City Hall (B), Lawndale Branch County of Los Angeles Public Library (C), Lawndale Sheriff's Service Center (D), Los Angeles County Fire Department Station 21 (E). Display/hide their locations on the map
Churches in zip code 90260 include: Centinela Baptist Church (A), Foursquare Church of Lawndale (B), Iglesia La Resurrection (C), Kingdom Hall of Jehovahs Witnesses (D), Westside Korean Christian Church (E), The Wesleyan Church (F), Lawndale Church of Christ (G), First Congregational Church (H), First Baptist Church (I). Display/hide their locations on the map
Parks in zip code 90260 include: Alondra Park (1), Jane Addams Park (2), Rogers-Anderson Park (3), William Green Park (4). Display/hide their locations on the map
4,332 married couples with children.
1,751 single-parent households (810 men, 941 women).
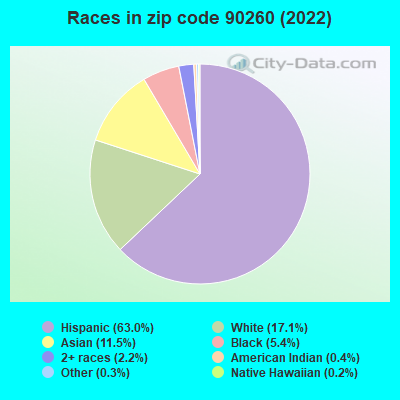
31.6% of residents of 90260 zip code speak English at home.
54.2% of residents speak Spanish at home (62% very well, 19% well, 14% not well, 4% not at all).
2.7% of residents speak other Indo-European language at home (61% very well, 27% well, 12% not well).
7.9% of residents speak Asian or Pacific Island language at home (46% very well, 28% well, 26% not well, 1% not at all).
3.5% of residents speak other language at home (77% very well, 17% well, 4% not well, 2% not at all).
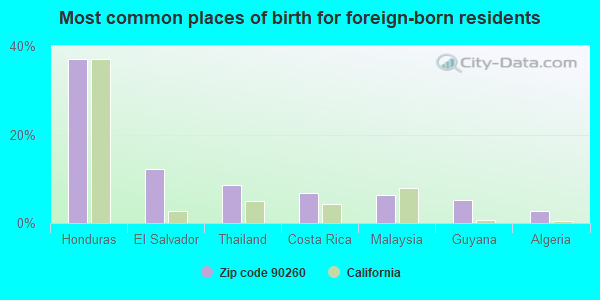
Foreign born population: 13,101 (39.7%) (54.9% of them are naturalized citizens)
This zip code:
39.7%
Whole state:
26.7%
37%Honduras
12%El Salvador
9%Thailand
7%Costa Rica
6%Malaysia
5%Guyana
3%Algeria
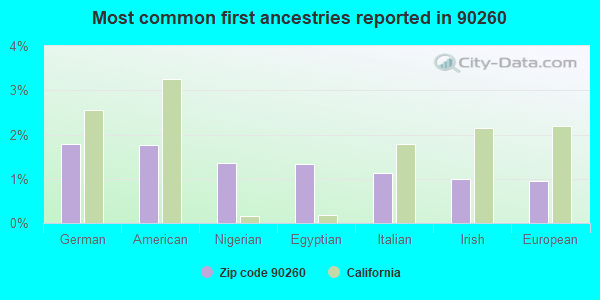
2%German
2%American
1%Nigerian
1%Egyptian
1%Italian
1%Irish
1%European
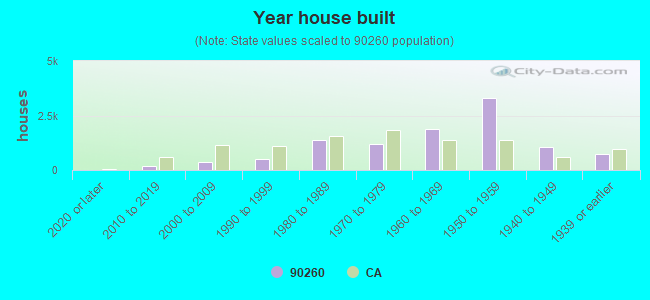
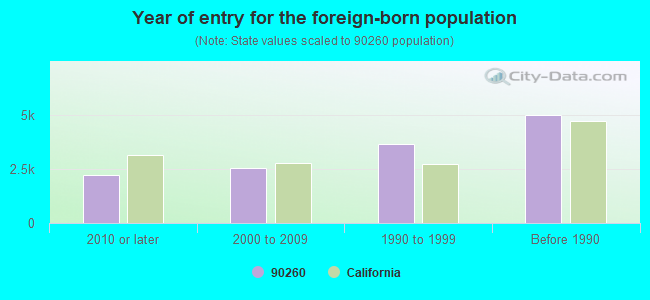
Year of entry for the foreign-born population
2,2252010 or later
2,5482000 to 2009
3,6241990 to 1999
4,979Before 1990
Major facilities with environmental interests located in this zip code:
GREEN (WILLIAM) ELEMENTARY (4520 W. 168TH ST. in LAWNDALE, CA)
(National Center for Education Statistics) - STATE ID-6014930 Large Quantity Generators, more that 1000 kg of hazardous waste/month (Resource Conservation and Recovery Act (tracking hazardous waste)) - notification Organizations: LAWNDALE ELEMENTARY SCHOOL (CONTACT/OWNER)
, LAWNDALE ELEMENTARY (SCHOOL DISTRICT)
Alternative names: GREEN ELEMENTARY SCHOOL
CENTINELA VALLEY UNION HIGH SD (14901 INGLEWOOD AVE in LAWNDALE, CA)
COMPLIANCE ACTIVITY (Tracking inspections of insecticide, fungicide, and rodenticide, and toxic substances) (National Center for Education Statistics) - STATE ID-1934926
ADVANCED AUTO BODY (4107 W COMPTON BLVD in LAWNDALE, CA)
STATE MASTER (California - Hazardous Waste Tracking) - HAZARDOU WASTE PROGRAM Small Quantity Generators, between 100 kg and 1000 kg of hazardous waste/month (Resource Conservation and Recovery Act (tracking hazardous waste)) Business NAICS classification: AUTOMOTIVE BODY, PAINT, AND INTERIOR REPAIR AND MAINTENANCE.
HANK AUTOMOTIVE (15706 CONDON AVE in LAWNDALE, CA)
STATE MASTER (California - Hazardous Waste Tracking) - HAZARDOU WASTE PROGRAM Small Quantity Generators, between 100 kg and 1000 kg of hazardous waste/month (Resource Conservation and Recovery Act (tracking hazardous waste)) - notification Organizations: HANK LUYK (CONTACT/OWNER)
ADDAMS (JANE) ELEMENTARY (4535 W. 153RD PL. in LAWNDALE, CA)
(National Center for Education Statistics) - STATE ID-6014864 Organizations: LAWNDALE ELEMENTARY (SCHOOL DISTRICT)
ANDERSON (WILLIAM) ELEMENTARY (4110 W. 154TH ST. in LAWNDALE, CA)
(National Center for Education Statistics) - STATE ID-6014831 Organizations: LAWNDALE ELEMENTARY (SCHOOL DISTRICT)
ENVIRONMENTAL CHARTER (4234 WEST 147TH ST. in LAWNDALE, CA)
(National Center for Education Statistics) - STATE ID-1996438 Organizations: LAWNDALE ELEMENTARY (SCHOOL DISTRICT)
LEUZINGER HIGH (4118 W. ROSECRANS AVE. in LAWNDALE, CA)
(National Center for Education Statistics) - STATE ID-1935048 Organizations: CENTINELA VALLEY UNION HIGH (SCHOOL DISTRICT)
LLOYDE (R. K.) HIGH (CONT.) (14901 INGLEWOOD AVE. in LAWNDALE, CA)
(National Center for Education Statistics) - STATE ID-1930239 Organizations: CENTINELA VALLEY UNION HIGH (SCHOOL DISTRICT)
MITCHELL (BILLY) ELEMENTARY (14429 CONDON AVE. in LAWNDALE, CA)
(National Center for Education Statistics) - STATE ID-6014856 Organizations: LAWNDALE ELEMENTARY (SCHOOL DISTRICT)
(Resource Conservation and Recovery Act (tracking hazardous waste)) TRI REPORTER (Tracking of toxic chemicals releasing facilities) Business SIC classification: SEMICONDUCTORS AND RELATED DEVICES Organizations: TRW INC (CONTACT/OWNER)
CAIN CLEANERS (15226 HAWTHORNE BLVD in LAWNDALE, CA)
(Resource Conservation and Recovery Act (tracking hazardous waste)) Organizations: NACK YOUNG PAIK (CONTACT/OWNER)
GLIDDEN CO DBA ICI PAINTS (16401 HAWTHORNE BLVD in LAWNDALE, CA)
Small Quantity Generators, between 100 kg and 1000 kg of hazardous waste/month (Resource Conservation and Recovery Act (tracking hazardous waste)) Organizations: REALTY INCOME CORPORATION (CONTACT/OWNER)
Housing units lacking complete plumbing facilities: 0.7% Housing units lacking complete kitchen facilities: 2.4%
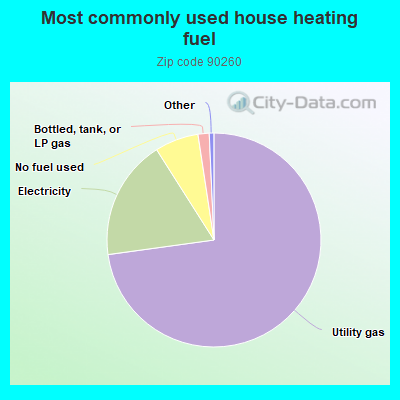
72.9%Utility gas
18.2%Electricity
6.6%No fuel used
1.7%Bottled, tank, or LP gas
Population in 1990: 29,576. Population change in the 1990s: +3,723 (+12.6%).
Place of birth for U.S.-born residents:
This state: 16,958
Northeast: 634
Midwest: 754
South: 632
West: 573
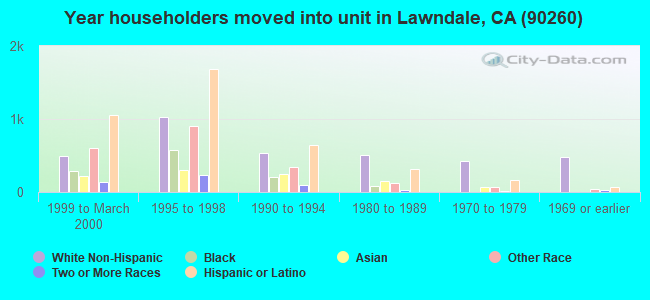
49% of the 90260 zip code residents lived in the same house 5 years ago. Out of people who lived in different houses, 90% lived in this county. Out of people who lived in different counties, 50% lived in California.
94% of the 90260 zip code residents lived in the same house 1 year ago. Out of people who lived in different houses, 82% moved from this county. Out of people who lived in different houses, 8% moved from different county within same state. Out of people who lived in different houses, 3% moved from different state. Out of people who lived in different houses, 8% moved from abroad.
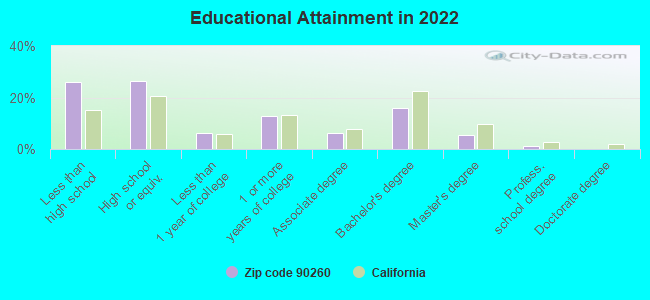
Private vs. public school enrollment:
Students in private schools in grades 1 to 8 (elementary and middle school): 278
Here:
9.7%
California:
10.5%
Students in private schools in grades 9 to 12 (high school): 114
Here:
5.0%
California:
8.5%
Students in private undergraduate colleges: 180
Here:
9.0%
California:
15.9%
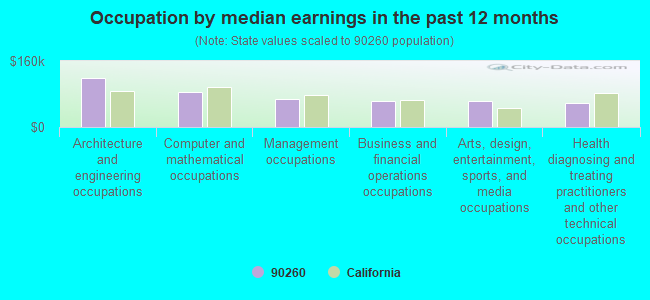
Occupation by median earnings in the past 12 months ($)
117,610Architecture and engineering occupations
84,454Computer and mathematical occupations
68,956Management occupations
64,088Business and financial operations occupations
62,970Arts, design, entertainment, sports, and media occupations
59,357Health diagnosing and treating practitioners and other technical occupations
Companies with federal contracts located in this zip code (LAWNDALE, CA):
DCS TESTING & EQUIPMENT, INC (4637 W 159TH STREET; small business) : $278,271 in 5 contractsfrom 2004 to 2005
Contracts for Maintenance, Repair and Rebuilding of Equipment -- Fire Control Equipment by Navy Signed by year:2000: $0; 2001: $0; 2002: $0; 2003: $0; 2004: $116,514; 2005: $161,757; 2006: $0.
Biggest contracts:
$161,757 with Navy for Maintenance, Repair and Rebuilding of Equipment -- Fire Control Equipment. Signed on 2005-07-08. Completion date: 2005-07-18.
$116,514, same as above.Signed on 2004-08-04. Completion date: 2005-07-18.
$116,514, same as above.Signed on 2004-07-16. Completion date: 2005-07-18.
$0, same as above.Signed on 2005-07-08. Completion date: 2005-07-18.
HERBRANDSON ENGINES INC (4909 WEST MARINE AVENUE; small business) : $67,900 in 2 contractsfrom 2000 to 2001
$33,950 with Navy for Miscellaneous Items. Signed on 2001-02-22. Completion date: 2001-04-08.
$33,950, same as above.Signed on 2000-09-07. Completion date: 2000-11-10.
RADII OFFICE, INC (15614 MANSEL AVE; small business) : $19,295 in 3 contractsin 2005
$15,789 with Navy for ADP Input/Output and Storage Devices. Signed on 2005-09-28. Completion date: 2005-10-31.
$3,400 with Navy for Miscellaneous Office Machines. Signed on 2005-03-18. Completion date: 2005-04-01.
$106, same as above.Signed on 2005-03-31. Completion date: 2005-04-01.
ADVANCED COMPUTERS AND TECHNOL (16129 HAWTHORNE BLVD STE A; small business)
$5,784 with Air Force for Other ADP and Telecommunications Services (includes data storage on tapes, compact disks, etc.). Signed on 2005-07-15. Completion date: 2005-07-22.
Top industries in this zip code by the number of employees in 2005:
Health Care and Social Assistance: Offices of Physicians (except Mental Health Specialists) (100-249 employees: 2 establishments, 50-99 employees: 1 establishment, 20-49 employees: 1 establishment, 10-19 employees: 1 establishment, 5-9 employees: 1 establishment, 1-4 employees: 10 establishments)


 Nearest zip codes: 90506, 90278, 90250, 90504, 90249, 90503.