Estimated zip code population in 2022: 32,691 Zip code population in 2010: 32,102 Zip code population in 2000: 31,664
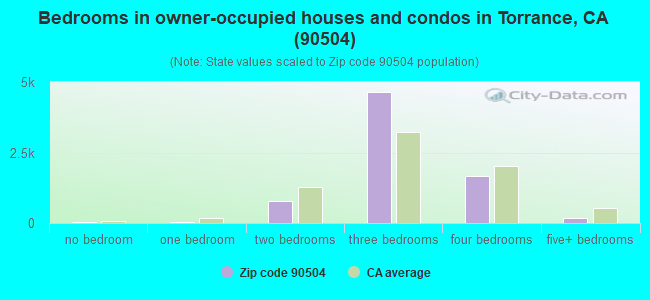
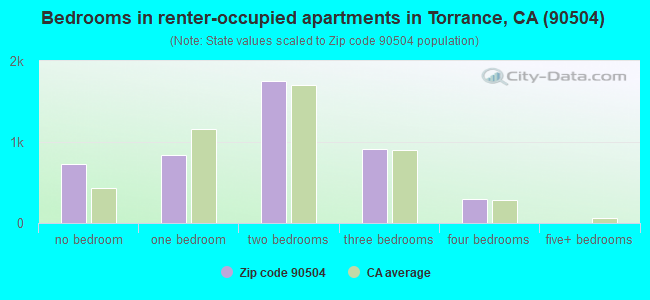
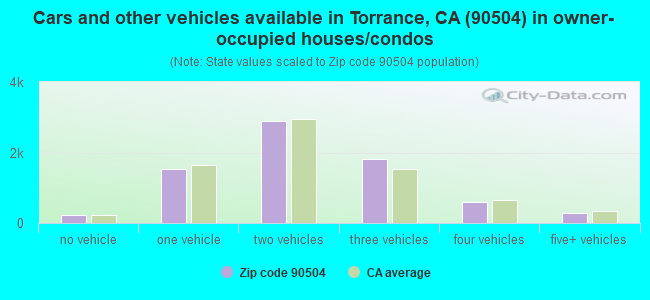
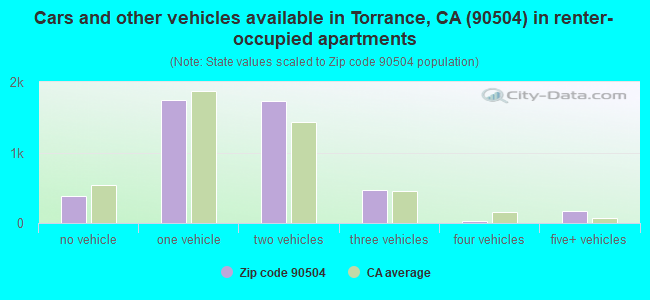
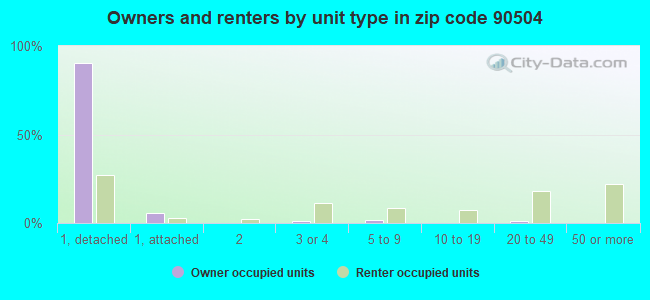
Houses and condos: 12,571 Renter-occupied apartments: 4,521
% of renters here:
38%
State:
44%
March 2022 cost of living index in zip code 90504: 136.3 (high, U.S. average is 100)
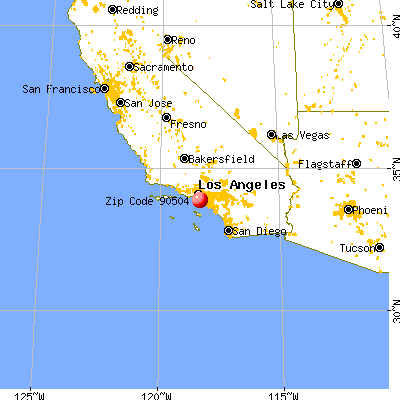
Land area: 4.5 sq. mi. Water area: 0.0 sq. mi.
Population density: 7,345 people per square mile
(high).
OSM Map
General Map
Google Map
MSN Map
OSM Map
General Map
Google Map
MSN Map
OSM Map
General Map
Google Map
MSN Map
OSM Map
General Map
Google Map
MSN Map
Please wait while loading the map...
Real estate property taxes paid for housing units in 2022:
This zip code:
0.6% ($5,206)
California:
0.7% ($4,831)
Median real estate property taxes paid for housing units with mortgages in 2022: $6,380 (0.7%) Median real estate property taxes paid for housing units with no mortgage in 2022: $3,345 (0.4%)
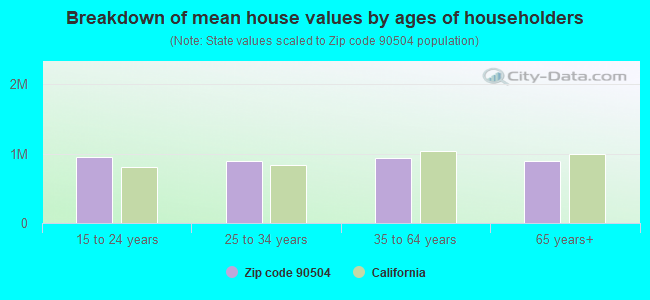
Estimated median house/condo value in 2022: $928,183
90504:
$928,183
California:
$715,900
According to our research of California and other state lists, there were 16 registered sex offenders living in 90504 zip code as of April 27, 2024. The ratio of all residents to sex offenders in zip code 90504 is 2,131 to 1. The ratio of registered sex offenders to all residents in this zip code is much lower than the state average.
Median resident age:
This zip code:
43.6 years
California median age:
37.9 years
Average household size:
This zip code:
2.7 people
California:
2.8 people
Averages for the 2020 tax year for zip code 90504, filed in 2021:
Average Adjusted Gross Income (AGI) in 2020: $78,168 (Individual Income Tax Returns)
Here:
$78,168
State:
$95,910
Salary/wage: $72,391 (reported on 77.9% of returns)
Here:
$72,391
State:
$77,331
(% of AGI for various income ranges: 1142.4% for AGIs below $25k, 3920.2% for AGIs $25k-50k, 7161.1% for AGIs $50k-75k, 10512.3% for AGIs $75k-100k, 20249.2% for AGIs $100k-200k, 65076.8% for AGIs over 200k)
Taxable interest for individuals: $1,326 (reported on 41.6% of returns)
This zip code:
$1,326
California:
$2,294
(% of AGI for various income ranges: 24.6% for AGIs below $25k, 37.1% for AGIs $25k-50k, 62.5% for AGIs $50k-75k, 81.6% for AGIs $75k-100k, 197.3% for AGIs $100k-200k, 637.6% for AGIs over 200k)
Ordinary dividends: $3,850 (reported on 24.8% of returns)
Here:
$3,850
State:
$10,949
(% of AGI for various income ranges: 31.0% for AGIs below $25k, 50.2% for AGIs $25k-50k, 97.9% for AGIs $50k-75k, 150.9% for AGIs $75k-100k, 266.8% for AGIs $100k-200k, 1658.6% for AGIs over 200k)
Net capital gain/loss in AGI: +$10,639 (reported on 23.4% of returns)
Here:
+$10,639
State:
+$49,306
(% of AGI for various income ranges: 39.4% for AGIs below $25k, 54.1% for AGIs $25k-50k, 115.0% for AGIs $50k-75k, 218.2% for AGIs $75k-100k, 487.0% for AGIs $100k-200k, 7183.0% for AGIs over 200k)
Profit/loss from business: +$9,193 (reported on 18.5% of returns)
Here:
+$9,193
State:
+$15,671
(% of AGI for various income ranges: 176.7% for AGIs below $25k, 188.3% for AGIs $25k-50k, 171.1% for AGIs $50k-75k, 222.2% for AGIs $75k-100k, 458.0% for AGIs $100k-200k, 1601.6% for AGIs over 200k)
Taxable individual retirement arrangement distribution: $25,865 (reported on 9.7% of returns)
90504:
$25,865
California:
$23,505
(% of AGI for various income ranges: 73.0% for AGIs below $25k, 137.0% for AGIs $25k-50k, 234.8% for AGIs $50k-75k, 521.1% for AGIs $75k-100k, 889.5% for AGIs $100k-200k, 3205.7% for AGIs over 200k)
Self-employed (Keogh) retirement plans: $13,186 (reported on 0.4% of returns)
90504:
$13,186
California:
$30,163
(% of AGI for various income ranges: 7.1% for AGIs $25k-50k, 11.9% for AGIs $100k-200k, 147.6% for AGIs over 200k)
Total itemized deductions: $31,505 (reported on 17.4% of returns)
Here:
$31,505
State:
$39,517
(% of AGI for various income ranges: 98.6% for AGIs below $25k, 233.9% for AGIs $25k-50k, 583.5% for AGIs $50k-75k, 991.8% for AGIs $75k-100k, 2278.6% for AGIs $100k-200k, 6465.7% for AGIs over 200k)
Charity contributions: $5,896 (reported on 14.5% of returns)
Here:
$5,896
State:
$12,598
(% of AGI for various income ranges: 4.7% for AGIs below $25k, 24.3% for AGIs $25k-50k, 64.0% for AGIs $50k-75k, 124.6% for AGIs $75k-100k, 355.3% for AGIs $100k-200k, 1356.8% for AGIs over 200k)
Taxes paid: $8,821 (reported on 17.4% of returns)
90504:
$8,821
State:
$8,807
(% of AGI for various income ranges: 19.1% for AGIs below $25k, 53.5% for AGIs $25k-50k, 152.0% for AGIs $50k-75k, 297.5% for AGIs $75k-100k, 701.5% for AGIs $100k-200k, 1640.5% for AGIs over 200k)
Earned income credit: $1,758 (reported on 10.5% of returns)
Here:
$1,758
State:
$2,074
(% of AGI for various income ranges: 65.2% for AGIs below $25k, 51.2% for AGIs $25k-50k, 0.7% for AGIs $50k-75k)
Percentage of individuals using paid preparers for their 2020 taxes: 91.9%
Here:
92%
State:
92%
(% for various income ranges: 90.0% for AGIs below $25k, 92.2% for AGIs $25k-50k, 92.8% for AGIs $50k-75k, 93.2% for AGIs $75k-100k, 92.5% for AGIs $100k-200k, 92.8% for AGIs over 200k)
Averages for the 2012 tax year for zip code 90504, filed in 2013:
Average Adjusted Gross Income (AGI) in 2012: $59,093 (Individual Income Tax Returns)
Here:
$59,093
State:
$72,726
Salary/wage: $56,324 (reported on 81.1% of returns)
Here:
$56,324
State:
$59,079
(% of AGI for various income ranges: 70.0% for AGIs below $25k, 77.3% for AGIs $25k-50k, 77.1% for AGIs $50k-75k, 77.1% for AGIs $75k-100k, 80.5% for AGIs $100k-200k, 72.1% for AGIs over 200k)
Taxable interest for individuals: $890 (reported on 41.4% of returns)
This zip code:
$890
California:
$2,146
(% of AGI for various income ranges: 1.1% for AGIs below $25k, 0.7% for AGIs $25k-50k, 0.6% for AGIs $50k-75k, 0.6% for AGIs $75k-100k, 0.5% for AGIs $100k-200k, 0.7% for AGIs over 200k)
Ordinary dividends: $2,711 (reported on 21.5% of returns)
Here:
$2,711
State:
$9,308
(% of AGI for various income ranges: 1.5% for AGIs below $25k, 0.9% for AGIs $25k-50k, 0.8% for AGIs $50k-75k, 0.8% for AGIs $75k-100k, 0.9% for AGIs $100k-200k, 1.4% for AGIs over 200k)
Net capital gain/loss in AGI: +$4,077 (reported on 16.5% of returns)
Here:
+$4,077
State:
+$30,460
(% of AGI for various income ranges: 0.1% for AGIs $25k-50k, 0.2% for AGIs $50k-75k, 0.3% for AGIs $75k-100k, 0.6% for AGIs $100k-200k, 7.3% for AGIs over 200k)
Profit/loss from business: +$12,178 (reported on 17.0% of returns)
Here:
+$12,178
State:
+$17,064
(% of AGI for various income ranges: 12.6% for AGIs below $25k, 5.8% for AGIs $25k-50k, 2.9% for AGIs $50k-75k, 2.5% for AGIs $75k-100k, 1.9% for AGIs $100k-200k, 2.6% for AGIs over 200k)
Taxable individual retirement arrangement distribution: $17,112 (reported on 10.6% of returns)
90504:
$17,112
California:
$19,557
(% of AGI for various income ranges: 4.1% for AGIs below $25k, 2.8% for AGIs $25k-50k, 3.0% for AGIs $50k-75k, 3.5% for AGIs $75k-100k, 3.1% for AGIs $100k-200k, 2.2% for AGIs over 200k)
Self-employment retirement plans: $13,343 (reported on 0.4% of returns)
90504:
$13,343
California:
$24,530
Total itemized deductions: $25,405 (25% of AGI, reported on 38.7% of returns)
Here:
$25,405
State:
$34,004
Here:
25.1% of AGI
State:
22.7% of AGI
(% of AGI for various income ranges: 10.9% for AGIs below $25k, 11.3% for AGIs $25k-50k, 15.8% for AGIs $50k-75k, 18.5% for AGIs $75k-100k, 19.5% for AGIs $100k-200k, 15.9% for AGIs over 200k)
Charity contributions: $3,024 (reported on 32.3% of returns)
Here:
$3,024
State:
$4,659
(% of AGI for various income ranges: 0.7% for AGIs below $25k, 1.0% for AGIs $25k-50k, 1.7% for AGIs $50k-75k, 1.6% for AGIs $75k-100k, 2.1% for AGIs $100k-200k, 1.7% for AGIs over 200k)
Taxes paid: $9,215 (reported on 38.6% of returns)
90504:
$9,215
State:
$14,448
(% of AGI for various income ranges: 2.0% for AGIs below $25k, 2.9% for AGIs $25k-50k, 4.4% for AGIs $50k-75k, 6.1% for AGIs $75k-100k, 7.7% for AGIs $100k-200k, 8.6% for AGIs over 200k)
Earned income credit: $1,996 (reported on 14.4% of returns)
Here:
$1,996
State:
$2,286
(% of AGI for various income ranges: 5.0% for AGIs below $25k, 0.9% for AGIs $25k-50k)
Percentage of individuals using paid preparers for their 2012 taxes: 65.1%
Here:
65%
State:
64%
(% for various income ranges: 63.5% for AGIs below $25k, 64.6% for AGIs $25k-50k, 64.8% for AGIs $50k-75k, 68.5% for AGIs $75k-100k, 67.0% for AGIs $100k-200k, 67.5% for AGIs over 200k)
Averages for the 2004 tax year for zip code 90504, filed in 2005:
Average Adjusted Gross Income (AGI) in 2004: $49,956 (Individual Income Tax Returns)
Here:
$49,956
State:
$58,600
Salary/wage: $48,751 (reported on 81.9% of returns)
Here:
$48,751
State:
$49,455
(% of AGI for various income ranges: 162.8% for AGIs below $10k, 70.2% for AGIs $10k-25k, 80.5% for AGIs $25k-50k, 80.6% for AGIs $50k-75k, 83.2% for AGIs $75k-100k, 77.6% for AGIs over 100k)
Taxable interest for individuals: $1,181 (reported on 55.1% of returns)
This zip code:
$1,181
California:
$2,365
(% of AGI for various income ranges: 9.0% for AGIs below $10k, 2.6% for AGIs $10k-25k, 1.3% for AGIs $25k-50k, 1.3% for AGIs $50k-75k, 1.0% for AGIs $75k-100k, 1.0% for AGIs over 100k)
Taxable dividends: $1,651 (reported on 25.8% of returns)
Here:
$1,651
State:
$4,746
(% of AGI for various income ranges: 5.5% for AGIs below $10k, 1.5% for AGIs $10k-25k, 0.7% for AGIs $25k-50k, 0.7% for AGIs $50k-75k, 0.7% for AGIs $75k-100k, 0.8% for AGIs over 100k)
Net capital gain/loss: +$6,361 (reported on 20.7% of returns)
Here:
+$6,361
State:
+$23,418
(% of AGI for various income ranges: 1.2% for AGIs below $10k, -0.5% for AGIs $10k-25k, 0.4% for AGIs $25k-50k, 0.5% for AGIs $50k-75k, 0.7% for AGIs $75k-100k, 6.5% for AGIs over 100k)
Profit/loss from business: +$11,597 (reported on 17.3% of returns)
Here:
+$11,597
State:
+$16,826
(% of AGI for various income ranges: 21.7% for AGIs below $10k, 9.9% for AGIs $10k-25k, 4.9% for AGIs $25k-50k, 2.6% for AGIs $50k-75k, 2.6% for AGIs $75k-100k, 3.5% for AGIs over 100k)
IRA payment deduction: $3,212 (reported on 3.5% of returns)
90504:
$3,212
California:
$3,192
(% of AGI for various income ranges: 0.5% for AGIs below $10k, 0.3% for AGIs $10k-25k, 0.4% for AGIs $25k-50k, 0.3% for AGIs $50k-75k, 0.2% for AGIs $75k-100k, 0.1% for AGIs over 100k)
Self-employed pension: $11,733 (reported on 0.8% of returns)
Here:
$11,733
California:
$17,688
(% of AGI for various income ranges: 0.1% for AGIs $25k-50k, 0.1% for AGIs $50k-75k, 0.2% for AGIs $75k-100k, 0.3% for AGIs over 100k)
Total itemized deductions: $21,585 (26% of AGI, reported on 42.1% of returns)
Here:
$21,585
State:
$28,113
Here:
26.3% of AGI
State:
25.3% of AGI
(% of AGI for various income ranges: 24.5% for AGIs below $10k, 11.5% for AGIs $10k-25k, 14.9% for AGIs $25k-50k, 19.7% for AGIs $50k-75k, 21.2% for AGIs $75k-100k, 18.7% for AGIs over 100k)
Charity contributions deductions: $2,765 (3% of AGI, reported on 37.4% of returns)
Here:
$2,765
State:
$3,923
Here:
3.3% of AGI
State:
3.3% of AGI
(% of AGI for various income ranges: 0.9% for AGIs below $10k, 1.0% for AGIs $10k-25k, 1.6% for AGIs $25k-50k, 2.1% for AGIs $50k-75k, 2.4% for AGIs $75k-100k, 2.3% for AGIs over 100k)
Total tax: $6,647 (reported on 80.7% of returns)
90504:
$6,647
State:
$10,761
(% of AGI for various income ranges: 7.2% for AGIs below $10k, 4.8% for AGIs $10k-25k, 7.2% for AGIs $25k-50k, 9.2% for AGIs $50k-75k, 10.0% for AGIs $75k-100k, 14.8% for AGIs over 100k)
Earned income credit: $1,539 (reported on 11.2% of returns)
Here:
$1,539
State:
$1,763
Percentage of individuals using paid preparers for their 2004 taxes: 66.0%
Here:
66%
State:
66%
(% for various income ranges: 57.0% for AGIs below $10k, 65.4% for AGIs $10k-25k, 66.5% for AGIs $25k-50k, 68.9% for AGIs $50k-75k, 70.2% for AGIs $75k-100k, 70.8% for AGIs over 100k)
Likely homosexual households (counted as self-reported same-sex unmarried-partner households)
Lesbian couples: 0.2% of all households
Gay men: 0.2% of all households
Household received Food Stamps/SNAP in the past 12 months: 647 Household did not receive Food Stamps/SNAP in the past 12 months: 11,027
Women who had a birth in the past 12 months: 243 (148 now married, 95 unmarried) Women who did not have a birth in the past 12 months: 7,050 (2,984 now married, 4,058 unmarried)
Housing units in zip code 90504 with a mortgage: 4,761 (561 second mortgage, 5 home equity loan, 454 both second mortgage and home equity loan) Houses without a mortgage: 62
Median monthly owner costs for units with a mortgage: $3,011 Median monthly owner costs for units without a mortgage: $647
Residents with income below the poverty level in 2022:
This zip code:
9.0%
Whole state:
12.2%
Residents with income below 50% of the poverty level in 2022:
This zip code:
4.2%
Whole state:
6.2%
Median number of rooms in houses and condos:
Here:
5.8
State:
6.0
Median number of rooms in apartments:
Here:
3.7
State:
3.9
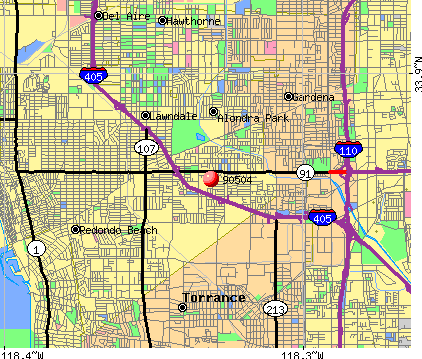
Notable locations in this zip code not listed on our city pages
Notable locations in zip code 90504: North Torrance Branch Torrance Public Library (A), Mobile Oil Refinery Fire Department (B), Torrance Fire Department Fire Station 3 (C). Display/hide their locations on the map
Parks in zip code 90504 include: Guenser Park (1), McMaster Park (2), Columbia Park (3), Descanso Park (4), La Carretera Park (5). Display/hide their locations on the map
In group quarters: 251 (-1 institutionalized population)
Size of family households: 2,739 2-persons, 2,558 3-persons, 1,705 4-persons, 892 5-persons, 267 6-persons, 108 7-or-more-persons
Size of nonfamily households: 2,659 1-person, 844 2-persons, 73 3-persons
4,887 married couples with children.
1,080 single-parent households (359 men, 721 women).
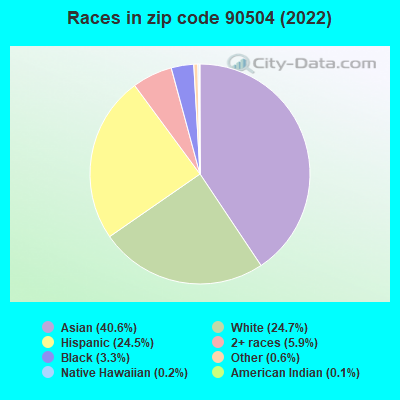
57.0% of residents of 90504 zip code speak English at home.
13.9% of residents speak Spanish at home (70% very well, 16% well, 12% not well, 2% not at all).
3.9% of residents speak other Indo-European language at home (63% very well, 21% well, 12% not well, 4% not at all).
22.1% of residents speak Asian or Pacific Island language at home (45% very well, 33% well, 17% not well, 5% not at all).
3.1% of residents speak other language at home (84% very well, 13% well, 3% not well).
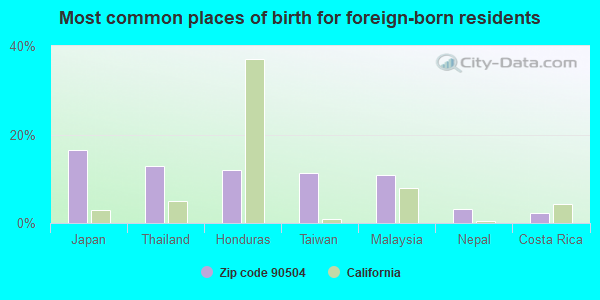
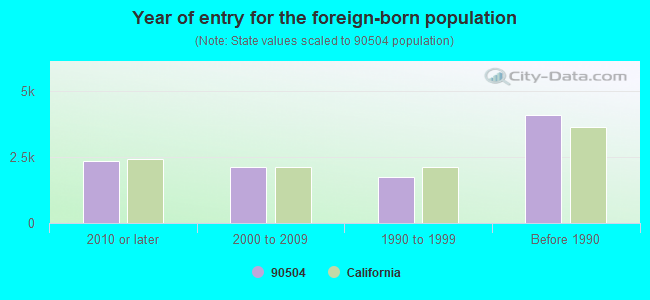
Foreign born population: 9,678 (29.6%) (66.7% of them are naturalized citizens)
Major facilities with environmental interests located in this zip code:
HONEYWELL INCORPORATED (2525 WEST 190TH STREET in TORRANCE, CA)
AIR MAJOR (AIRS/AFS) STATE MASTER (California - Hazardous Waste Tracking) - HAZARDOU WASTE PROGRAM COMPLIANCE ACTIVITY (Tracking inspections of insecticide, fungicide, and rodenticide, and toxic substances) CRITERIA AND HAZARDOUS AIR POLLUTANT INVENTORY (Inventory of air pollution sources) AIR MAJOR ("Best Available" air pollution technologies tracking) HAZARDOUS WASTE BIENNIAL REPORTER (Resource Conservation and Recovery Act (tracking hazardous waste)) Large Quantity Generators, more that 1000 kg of hazardous waste/month (Resource Conservation and Recovery Act (tracking hazardous waste)) - notification TRI REPORTER (Tracking of toxic chemicals releasing facilities) Business SIC and NAICS classification: AIRCRAFT PARTS AND AUXILIARY EQUIPMENT Alternative names: ALLIED SIGNAL AEROSPACE, ALLIED-SIGNAL AEROSPACE DIVISION, ALLIED-SIGNAL AEROSPACE DIVISION, ALLIEDSIGNAL AEROSPACE EQUIPMENT SYS., HONEYWELL INTERNATIONAL INC
HONEYWELL INTERNATIONAL INCORPORATED (20225 WESTERN AVENUE in TORRANCE, CA)
STATE MASTER (California - Hazardous Waste Tracking) - HAZARDOU WASTE PROGRAM CRITERIA AND HAZARDOUS AIR POLLUTANT INVENTORY (Inventory of air pollution sources) HAZARDOUS WASTE BIENNIAL REPORTER (Resource Conservation and Recovery Act (tracking hazardous waste)) Large Quantity Generators, more that 1000 kg of hazardous waste/month (Resource Conservation and Recovery Act (tracking hazardous waste)) - notification TRI REPORTER (Tracking of toxic chemicals releasing facilities) Business SIC classification: AIRCRAFT PARTS AND AUXILIARY EQUIPMENT Business NAICS classification: INSTRUMENT MANUFACTURING FOR MEASURING AND TESTING ELECTRICITY AND ELECTRICAL SIGNALS. Organizations: HONEYWELL INTERNATIONAL INC. (CONTACT/OPERATOR)
, MOOG, PROLOGIS, MAR VENTURES (CONTACT/OWNER)
Alternative names: ALLIED SIGNAL INCORPORATED AEROSPACE EQUIPMENT & SYSTEMS, HONEYWELL INC
EQUILON ENTERPRISES (18145 CRENSHAW in TORRANCE, CA) . Federal Facility
STATE MASTER (California - Hazardous Waste Tracking) - HAZARDOU WASTE PROGRAM Small Quantity Generators, between 100 kg and 1000 kg of hazardous waste/month (Resource Conservation and Recovery Act (tracking hazardous waste)) - notification Small Quantity Generators, between 100 kg and 1000 kg of hazardous waste/month (Resource Conservation and Recovery Act (tracking hazardous waste)) Organizations: EQUILON ENTERPRISES, LLC (CONTACT/OWNER)
, SHELL OIL COMPANY (CONTACT/OWNER)
Alternative names: SHELL OIL CO, SHELL STATION NO 204-7872-1309
CALTRANS TORRANCE SITE (18101 BAILEY DRIVE in TORRANCE, CA)
STATE MASTER (California - Hazardous Waste Tracking) - HAZARDOU WASTE PROGRAM Small Quantity Generators, between 100 kg and 1000 kg of hazardous waste/month (Resource Conservation and Recovery Act (tracking hazardous waste)) - notification Alternative names: CALTRANS DISTRICT 7
JIFFY LUBE #2219 (3209 WEST 190TH in TORRANCE, CA)
Small Quantity Generators, between 100 kg and 1000 kg of hazardous waste/month (Resource Conservation and Recovery Act (tracking hazardous waste)) - notification STATE MASTER (California - Used Oil Recycling System ) - USED OIL RECYCLING Organizations: QUAKER STATE MINIT-LUBE INC (CONTACT/OWNER)
Alternative names: MINIT LUBE NO 1298
CHEVRON STATION NO 95589 (3604 REDONDO BEACH BLVD in TORRANCE, CA)
STATE MASTER (California - Hazardous Waste Tracking) - HAZARDOU WASTE PROGRAM Small Quantity Generators, between 100 kg and 1000 kg of hazardous waste/month (Resource Conservation and Recovery Act (tracking hazardous waste)) - notification Organizations: CHEVRON PRODUCTS CO (CONTACT/OWNER)
EDISON ELEMENTARY (3800 182ND ST. in TORRANCE, CA)
(National Center for Education Statistics) - STATE ID-6023063 Organizations: TORRANCE UNIFIED (SCHOOL DISTRICT)
LINCOLN ELEMENTARY (2418 166TH ST. in TORRANCE, CA)
(National Center for Education Statistics) - STATE ID-6023147 Organizations: TORRANCE UNIFIED (SCHOOL DISTRICT)
MAGRUDER (PHILIP) MIDDLE (4100 185TH ST. in TORRANCE, CA)
(National Center for Education Statistics) - STATE ID-6023170 Organizations: TORRANCE UNIFIED (SCHOOL DISTRICT)
NORTH HIGH (3620 W. 182ND ST. in TORRANCE, CA)
(National Center for Education Statistics) - STATE ID-1936277 Organizations: TORRANCE UNIFIED (SCHOOL DISTRICT)
CARR (EVELYN) ELEMENTARY (3404 W. 168TH ST. in TORRANCE, CA)
(National Center for Education Statistics) - STATE ID-6023022 Organizations: TORRANCE UNIFIED (SCHOOL DISTRICT)
CASIMIR MIDDLE (17220 CASIMIR AVE. in TORRANCE, CA)
(National Center for Education Statistics) - STATE ID-6023030 Organizations: TORRANCE UNIFIED (SCHOOL DISTRICT)
EXXONMOBIL OIL CORP. (18200 CRENSHAW BLVD in TORRANCE, CA)
HAZARDOUS WASTE BIENNIAL REPORTER (Resource Conservation and Recovery Act (tracking hazardous waste)) Large Quantity Generators, more that 1000 kg of hazardous waste/month (Resource Conservation and Recovery Act (tracking hazardous waste)) Organizations: EXXONMOBIL OIL CORPORATION (CONTACT/OWNER)
Housing units lacking complete plumbing facilities: 0.8% Housing units lacking complete kitchen facilities: 3.0%
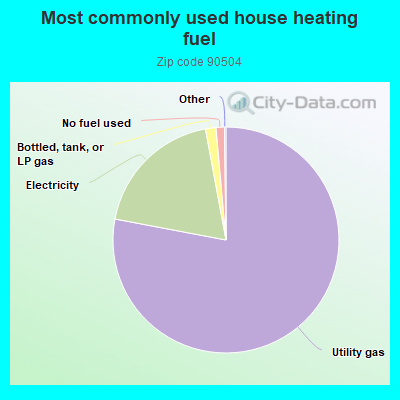
77.9%Utility gas
19.1%Electricity
1.5%Bottled, tank, or LP gas
1.2%No fuel used
Population in 1990: 30,245. Population change in the 1990s: +1,419 (+4.7%).
Place of birth for U.S.-born residents:
This state: 18,458
Northeast: 929
Midwest: 868
South: 902
West: 1,294
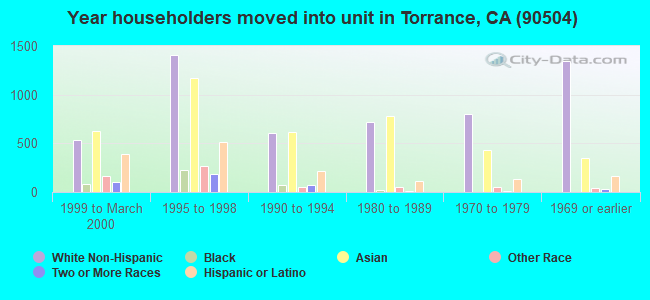
61% of the 90504 zip code residents lived in the same house 5 years ago. Out of people who lived in different houses, 90% lived in this county. Out of people who lived in different counties, 50% lived in California.
93% of the 90504 zip code residents lived in the same house 1 year ago. Out of people who lived in different houses, 86% moved from this county. Out of people who lived in different houses, 7% moved from different county within same state. Out of people who lived in different houses, 3% moved from different state. Out of people who lived in different houses, 3% moved from abroad.
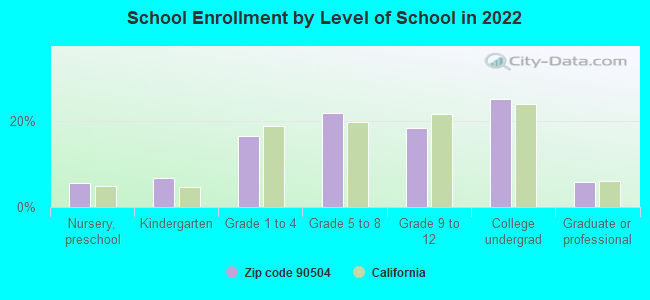
Private vs. public school enrollment:
Students in private schools in grades 1 to 8 (elementary and middle school): 258
Here:
8.9%
California:
10.5%
Students in private schools in grades 9 to 12 (high school): 133
Here:
9.6%
California:
8.5%
Students in private undergraduate colleges: 223
Here:
11.7%
California:
15.9%
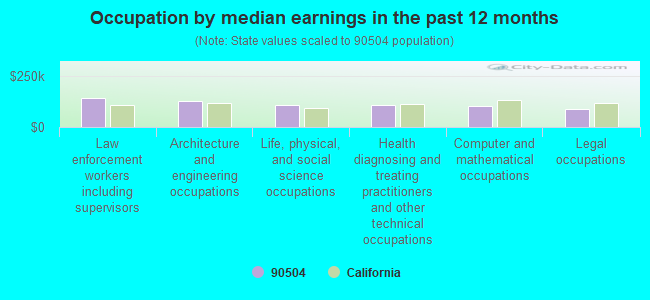
Occupation by median earnings in the past 12 months ($)
145,182Law enforcement workers including supervisors
129,435Architecture and engineering occupations
110,387Life, physical, and social science occupations
107,695Health diagnosing and treating practitioners and other technical occupations
104,204Computer and mathematical occupations
90,265Legal occupations
Companies with federal contracts located in this zip code:
HONEYWELL INTERNATIONAL INC (2525 W 190TH ST in TORRANCE, CA) : $775,411 in 3 contractsfrom 2000 to 2004
$680,515 with Army for Other Research and Development -- Basic Research (R&D). Signed on 2000-03-14. Completion date: 2000-12-31.
$80,000 with Army for Space and Water Heating Equipment. Signed on 2003-08-04. Completion date: 2003-08-30.
$14,896, same as above.Signed on 2004-04-27. Completion date: 2003-08-30.
CAMERON ENVIRONMENTAL, INC (4306 W 190TH ST in TORRANCE, CA; small business)
$13,500 with Navy for Torpedo Maintenance, Repair, and Checkout Specialized Equipment. Signed on 2005-09-26. Completion date: 2005-10-04.
Top industries in this zip code by the number of employees in 2005:
Administrative and Support and Waste Management and Remediation Services: Temporary Help Services (over 1000 employees: 1 establishment, 500-999 employees: 1 establishment, 100-249 employees: 5 establishments, 50-99 employees: 3 establishments, 1-4 employees: 1 establishment)
2005 - 2018 National Fire Incident Reporting System (NFIRS) incidents
According to the data from the years 2005 - 2018 the average number of fires per year is 30. The highest number of fire incidents - 69 took place in 2005, and the least - 0 in 2006. The data has a declining trend.
When looking into fire subcategories, the most reports belonged to: Outside Fires (46.7%), and Mobile Property/Vehicle Fires (26.3%).
Fire incident types reported to NFIRS in Zip Code 90504


 Nearest zip codes: 90506, 90260, 90503, 90249, 90501, 90278.
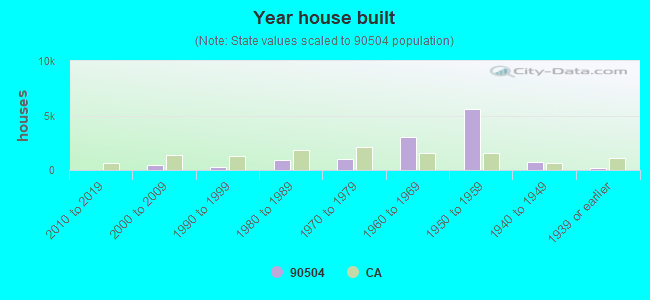


 According to the data from the years 2005 - 2018 the average number of fires per year is 30. The highest number of fire incidents - 69 took place in 2005, and the least - 0 in 2006. The data has a declining trend.
 When looking into fire subcategories, the most reports belonged to: Outside Fires (46.7%), and Mobile Property/Vehicle Fires (26.3%).