Estimated zip code population in 2022: 33,249
Zip code population in 2010: 32,821
Zip code population in 2000: 29,279
Houses and condos: 10,384
Renter-occupied apartments: 5,245
% of renters here:
53%State:
44%
March 2022 cost of living index in zip code 90062: 137.5
(high, U.S. average is 100)
Land area: 1.9
sq. mi.
Water area: 0.0
sq. mi.
Population density: 17,194 people per square mile (very high).
OSM Map
General Map
Google Map
MSN Map
OSM Map
General Map
Google Map
MSN Map
OSM Map
General Map
Google Map
MSN Map
OSM Map
General Map
Google Map
MSN Map
Please wait while loading the map...
Real estate property taxes paid for housing units in 2022:
This zip code:
0.5% ($3,616)California:
0.7% ($4,831)
Median real estate property taxes paid for housing units with mortgages in 2022: $4,360 (0.6%)
Median real estate property taxes paid for housing units with no mortgage in 2022: $2,283 (0.3%)
Profiles of local businesses
Business Search - 14 Million verified businesses
Males: 15,866 Females: 17,383
For population 25 years and over in 90062:
High school or higher: 65.3%Bachelor's degree or higher: 15.9%Graduate or professional degree: 4.4%Unemployed: 6.2%Mean travel time to work (commute): 36.2 minutes
For population 15 years and over in 90062:
Never married: 48.2%Now married: 37.1%Separated: 3.7%Widowed: 3.5%Divorced: 7.5%
Zip code 90062 compared to state average:
Black race population percentage significantly above state average. Length of stay since moving in significantly above state average. House age significantly above state average. Percentage of population with a bachelor's degree or higher significantly below state average. 21,376 64.3% Hispanic or Latino 8,739 26.3% Black 1,121 3.4% White 765 2.3% Asian 760 2.3% Two or more races 398 1.2% Some other race 52 0.2% Native Hawaiian and Other 34 0.1% American Indian
Data:
Median household income ($)
Median household income (% change since 2000)
Household income diversity
Ratio of average income to average house value (%)
Ratio of average income to average rent
Median household income ($) - White
Median household income ($) - Black or African American
Median household income ($) - Asian
Median household income ($) - Hispanic or Latino
Median household income ($) - American Indian and Alaska Native
Median household income ($) - Multirace
Median household income ($) - Other Race
Median household income for houses/condos with a mortgage ($)
Median household income for apartments without a mortgage ($)
Races - White alone (%)
Races - White alone (% change since 2000)
Races - Black alone (%)
Races - Black alone (% change since 2000)
Races - American Indian alone (%)
Races - American Indian alone (% change since 2000)
Races - Asian alone (%)
Races - Asian alone (% change since 2000)
Races - Hispanic (%)
Races - Hispanic (% change since 2000)
Races - Native Hawaiian and Other Pacific Islander alone (%)
Races - Native Hawaiian and Other Pacific Islander alone (% change since 2000)
Races - Two or more races (%)
Races - Two or more races (% change since 2000)
Races - Other race alone (%)
Races - Other race alone (% change since 2000)
Racial diversity
Unemployment (%)
Unemployment (% change since 2000)
Unemployment (%) - White
Unemployment (%) - Black or African American
Unemployment (%) - Asian
Unemployment (%) - Hispanic or Latino
Unemployment (%) - American Indian and Alaska Native
Unemployment (%) - Multirace
Unemployment (%) - Other Race
Population density (people per square mile)
Population - Males (%)
Population - Females (%)
Population - Males (%) - White
Population - Males (%) - Black or African American
Population - Males (%) - Asian
Population - Males (%) - Hispanic or Latino
Population - Males (%) - American Indian and Alaska Native
Population - Males (%) - Multirace
Population - Males (%) - Other Race
Population - Females (%) - White
Population - Females (%) - Black or African American
Population - Females (%) - Asian
Population - Females (%) - Hispanic or Latino
Population - Females (%) - American Indian and Alaska Native
Population - Females (%) - Multirace
Population - Females (%) - Other Race
Coronavirus confirmed cases (Apr 26, 2024)
Deaths caused by coronavirus (Apr 26, 2024)
Coronavirus confirmed cases (per 100k population) (Apr 26, 2024)
Deaths caused by coronavirus (per 100k population) (Apr 26, 2024)
Daily increase in number of cases (Apr 26, 2024)
Weekly increase in number of cases (Apr 26, 2024)
Cases doubled (in days) (Apr 26, 2024)
Hospitalized patients (Apr 18, 2022)
Negative test results (Apr 18, 2022)
Total test results (Apr 18, 2022)
COVID Vaccine doses distributed (per 100k population) (Sep 19, 2023)
COVID Vaccine doses administered (per 100k population) (Sep 19, 2023)
COVID Vaccine doses distributed (Sep 19, 2023)
COVID Vaccine doses administered (Sep 19, 2023)
Likely homosexual households (%)
Likely homosexual households (% change since 2000)
Likely homosexual households - Lesbian couples (%)
Likely homosexual households - Lesbian couples (% change since 2000)
Likely homosexual households - Gay men (%)
Likely homosexual households - Gay men (% change since 2000)
Cost of living index
Median gross rent ($)
Median contract rent ($)
Median monthly housing costs ($)
Median house or condo value ($)
Median house or condo value ($ change since 2000)
Mean house or condo value by units in structure - 1, detached ($)
Mean house or condo value by units in structure - 1, attached ($)
Mean house or condo value by units in structure - 2 ($)
Mean house or condo value by units in structure by units in structure - 3 or 4 ($)
Mean house or condo value by units in structure - 5 or more ($)
Mean house or condo value by units in structure - Boat, RV, van, etc. ($)
Mean house or condo value by units in structure - Mobile home ($)
Median house or condo value ($) - White
Median house or condo value ($) - Black or African American
Median house or condo value ($) - Asian
Median house or condo value ($) - Hispanic or Latino
Median house or condo value ($) - American Indian and Alaska Native
Median house or condo value ($) - Multirace
Median house or condo value ($) - Other Race
Median resident age
Resident age diversity
Median resident age - Males
Median resident age - Females
Median resident age - White
Median resident age - Black or African American
Median resident age - Asian
Median resident age - Hispanic or Latino
Median resident age - American Indian and Alaska Native
Median resident age - Multirace
Median resident age - Other Race
Median resident age - Males - White
Median resident age - Males - Black or African American
Median resident age - Males - Asian
Median resident age - Males - Hispanic or Latino
Median resident age - Males - American Indian and Alaska Native
Median resident age - Males - Multirace
Median resident age - Males - Other Race
Median resident age - Females - White
Median resident age - Females - Black or African American
Median resident age - Females - Asian
Median resident age - Females - Hispanic or Latino
Median resident age - Females - American Indian and Alaska Native
Median resident age - Females - Multirace
Median resident age - Females - Other Race
Commute - mean travel time to work (minutes)
Travel time to work - Less than 5 minutes (%)
Travel time to work - Less than 5 minutes (% change since 2000)
Travel time to work - 5 to 9 minutes (%)
Travel time to work - 5 to 9 minutes (% change since 2000)
Travel time to work - 10 to 19 minutes (%)
Travel time to work - 10 to 19 minutes (% change since 2000)
Travel time to work - 20 to 29 minutes (%)
Travel time to work - 20 to 29 minutes (% change since 2000)
Travel time to work - 30 to 39 minutes (%)
Travel time to work - 30 to 39 minutes (% change since 2000)
Travel time to work - 40 to 59 minutes (%)
Travel time to work - 40 to 59 minutes (% change since 2000)
Travel time to work - 60 to 89 minutes (%)
Travel time to work - 60 to 89 minutes (% change since 2000)
Travel time to work - 90 or more minutes (%)
Travel time to work - 90 or more minutes (% change since 2000)
Marital status - Never married (%)
Marital status - Now married (%)
Marital status - Separated (%)
Marital status - Widowed (%)
Marital status - Divorced (%)
Median family income ($)
Median family income (% change since 2000)
Median non-family income ($)
Median non-family income (% change since 2000)
Median per capita income ($)
Median per capita income (% change since 2000)
Median family income ($) - White
Median family income ($) - Black or African American
Median family income ($) - Asian
Median family income ($) - Hispanic or Latino
Median family income ($) - American Indian and Alaska Native
Median family income ($) - Multirace
Median family income ($) - Other Race
Median year house/condo built
Median year apartment built
Year house built - Built 2005 or later (%)
Year house built - Built 2000 to 2004 (%)
Year house built - Built 1990 to 1999 (%)
Year house built - Built 1980 to 1989 (%)
Year house built - Built 1970 to 1979 (%)
Year house built - Built 1960 to 1969 (%)
Year house built - Built 1950 to 1959 (%)
Year house built - Built 1940 to 1949 (%)
Year house built - Built 1939 or earlier (%)
Average household size
Household density (households per square mile)
Average household size - White
Average household size - Black or African American
Average household size - Asian
Average household size - Hispanic or Latino
Average household size - American Indian and Alaska Native
Average household size - Multirace
Average household size - Other Race
Occupied housing units (%)
Vacant housing units (%)
Owner occupied housing units (%)
Renter occupied housing units (%)
Vacancy status - For rent (%)
Vacancy status - For sale only (%)
Vacancy status - Rented or sold, not occupied (%)
Vacancy status - For seasonal, recreational, or occasional use (%)
Vacancy status - For migrant workers (%)
Vacancy status - Other vacant (%)
Residents with income below the poverty level (%)
Residents with income below 50% of the poverty level (%)
Children below poverty level (%)
Poor families by family type - Married-couple family (%)
Poor families by family type - Male, no wife present (%)
Poor families by family type - Female, no husband present (%)
Poverty status for native-born residents (%)
Poverty status for foreign-born residents (%)
Poverty among high school graduates not in families (%)
Poverty among people who did not graduate high school not in families (%)
Residents with income below the poverty level (%) - White
Residents with income below the poverty level (%) - Black or African American
Residents with income below the poverty level (%) - Asian
Residents with income below the poverty level (%) - Hispanic or Latino
Residents with income below the poverty level (%) - American Indian and Alaska Native
Residents with income below the poverty level (%) - Multirace
Residents with income below the poverty level (%) - Other Race
Air pollution - Air Quality Index (AQI)
Air pollution - CO
Air pollution - NO2
Air pollution - SO2
Air pollution - Ozone
Air pollution - PM10
Air pollution - PM25
Air pollution - Pb
Crime - Murders per 100,000 population
Crime - Rapes per 100,000 population
Crime - Robberies per 100,000 population
Crime - Assaults per 100,000 population
Crime - Burglaries per 100,000 population
Crime - Thefts per 100,000 population
Crime - Auto thefts per 100,000 population
Crime - Arson per 100,000 population
Crime - City-data.com crime index
Crime - Violent crime index
Crime - Property crime index
Crime - Murders per 100,000 population (5 year average)
Crime - Rapes per 100,000 population (5 year average)
Crime - Robberies per 100,000 population (5 year average)
Crime - Assaults per 100,000 population (5 year average)
Crime - Burglaries per 100,000 population (5 year average)
Crime - Thefts per 100,000 population (5 year average)
Crime - Auto thefts per 100,000 population (5 year average)
Crime - Arson per 100,000 population (5 year average)
Crime - City-data.com crime index (5 year average)
Crime - Violent crime index (5 year average)
Crime - Property crime index (5 year average)
1996 Presidential Elections Results (%) - Democratic Party (Clinton)
1996 Presidential Elections Results (%) - Republican Party (Dole)
1996 Presidential Elections Results (%) - Other
2000 Presidential Elections Results (%) - Democratic Party (Gore)
2000 Presidential Elections Results (%) - Republican Party (Bush)
2000 Presidential Elections Results (%) - Other
2004 Presidential Elections Results (%) - Democratic Party (Kerry)
2004 Presidential Elections Results (%) - Republican Party (Bush)
2004 Presidential Elections Results (%) - Other
2008 Presidential Elections Results (%) - Democratic Party (Obama)
2008 Presidential Elections Results (%) - Republican Party (McCain)
2008 Presidential Elections Results (%) - Other
2012 Presidential Elections Results (%) - Democratic Party (Obama)
2012 Presidential Elections Results (%) - Republican Party (Romney)
2012 Presidential Elections Results (%) - Other
2016 Presidential Elections Results (%) - Democratic Party (Clinton)
2016 Presidential Elections Results (%) - Republican Party (Trump)
2016 Presidential Elections Results (%) - Other
2020 Presidential Elections Results (%) - Democratic Party (Biden)
2020 Presidential Elections Results (%) - Republican Party (Trump)
2020 Presidential Elections Results (%) - Other
Ancestries Reported - Arab (%)
Ancestries Reported - Czech (%)
Ancestries Reported - Danish (%)
Ancestries Reported - Dutch (%)
Ancestries Reported - English (%)
Ancestries Reported - French (%)
Ancestries Reported - French Canadian (%)
Ancestries Reported - German (%)
Ancestries Reported - Greek (%)
Ancestries Reported - Hungarian (%)
Ancestries Reported - Irish (%)
Ancestries Reported - Italian (%)
Ancestries Reported - Lithuanian (%)
Ancestries Reported - Norwegian (%)
Ancestries Reported - Polish (%)
Ancestries Reported - Portuguese (%)
Ancestries Reported - Russian (%)
Ancestries Reported - Scotch-Irish (%)
Ancestries Reported - Scottish (%)
Ancestries Reported - Slovak (%)
Ancestries Reported - Subsaharan African (%)
Ancestries Reported - Swedish (%)
Ancestries Reported - Swiss (%)
Ancestries Reported - Ukrainian (%)
Ancestries Reported - United States (%)
Ancestries Reported - Welsh (%)
Ancestries Reported - West Indian (%)
Ancestries Reported - Other (%)
Educational Attainment - No schooling completed (%)
Educational Attainment - Less than high school (%)
Educational Attainment - High school or equivalent (%)
Educational Attainment - Less than 1 year of college (%)
Educational Attainment - 1 or more years of college (%)
Educational Attainment - Associate degree (%)
Educational Attainment - Bachelor's degree (%)
Educational Attainment - Master's degree (%)
Educational Attainment - Professional school degree (%)
Educational Attainment - Doctorate degree (%)
School Enrollment - Nursery, preschool (%)
School Enrollment - Kindergarten (%)
School Enrollment - Grade 1 to 4 (%)
School Enrollment - Grade 5 to 8 (%)
School Enrollment - Grade 9 to 12 (%)
School Enrollment - College undergrad (%)
School Enrollment - Graduate or professional (%)
School Enrollment - Not enrolled in school (%)
School enrollment - Public schools (%)
School enrollment - Private schools (%)
School enrollment - Not enrolled (%)
Median number of rooms in houses and condos
Median number of rooms in apartments
Housing units lacking complete plumbing facilities (%)
Housing units lacking complete kitchen facilities (%)
Density of houses
Urban houses (%)
Rural houses (%)
Households with people 60 years and over (%)
Households with people 65 years and over (%)
Households with people 75 years and over (%)
Households with one or more nonrelatives (%)
Households with no nonrelatives (%)
Population in households (%)
Family households (%)
Nonfamily households (%)
Population in families (%)
Family households with own children (%)
Median number of bedrooms in owner occupied houses
Mean number of bedrooms in owner occupied houses
Median number of bedrooms in renter occupied houses
Mean number of bedrooms in renter occupied houses
Median number of vehichles in owner occupied houses
Mean number of vehichles in owner occupied houses
Median number of vehichles in renter occupied houses
Mean number of vehichles in renter occupied houses
Mortgage status - with mortgage (%)
Mortgage status - with second mortgage (%)
Mortgage status - with home equity loan (%)
Mortgage status - with both second mortgage and home equity loan (%)
Mortgage status - without a mortgage (%)
Average family size
Average family size - White
Average family size - Black or African American
Average family size - Asian
Average family size - Hispanic or Latino
Average family size - American Indian and Alaska Native
Average family size - Multirace
Average family size - Other Race
Geographical mobility - Same house 1 year ago (%)
Geographical mobility - Moved within same county (%)
Geographical mobility - Moved from different county within same state (%)
Geographical mobility - Moved from different state (%)
Geographical mobility - Moved from abroad (%)
Place of birth - Born in state of residence (%)
Place of birth - Born in other state (%)
Place of birth - Native, outside of US (%)
Place of birth - Foreign born (%)
Housing units in structures - 1, detached (%)
Housing units in structures - 1, attached (%)
Housing units in structures - 2 (%)
Housing units in structures - 3 or 4 (%)
Housing units in structures - 5 to 9 (%)
Housing units in structures - 10 to 19 (%)
Housing units in structures - 20 to 49 (%)
Housing units in structures - 50 or more (%)
Housing units in structures - Mobile home (%)
Housing units in structures - Boat, RV, van, etc. (%)
House/condo owner moved in on average (years ago)
Renter moved in on average (years ago)
Year householder moved into unit - Moved in 1999 to March 2000 (%)
Year householder moved into unit - Moved in 1995 to 1998 (%)
Year householder moved into unit - Moved in 1990 to 1994 (%)
Year householder moved into unit - Moved in 1980 to 1989 (%)
Year householder moved into unit - Moved in 1970 to 1979 (%)
Year householder moved into unit - Moved in 1969 or earlier (%)
Means of transportation to work - Drove car alone (%)
Means of transportation to work - Carpooled (%)
Means of transportation to work - Public transportation (%)
Means of transportation to work - Bus or trolley bus (%)
Means of transportation to work - Streetcar or trolley car (%)
Means of transportation to work - Subway or elevated (%)
Means of transportation to work - Railroad (%)
Means of transportation to work - Ferryboat (%)
Means of transportation to work - Taxicab (%)
Means of transportation to work - Motorcycle (%)
Means of transportation to work - Bicycle (%)
Means of transportation to work - Walked (%)
Means of transportation to work - Other means (%)
Working at home (%)
Industry diversity
Most Common Industries - Agriculture, forestry, fishing and hunting, and mining (%)
Most Common Industries - Agriculture, forestry, fishing and hunting (%)
Most Common Industries - Mining, quarrying, and oil and gas extraction (%)
Most Common Industries - Construction (%)
Most Common Industries - Manufacturing (%)
Most Common Industries - Wholesale trade (%)
Most Common Industries - Retail trade (%)
Most Common Industries - Transportation and warehousing, and utilities (%)
Most Common Industries - Transportation and warehousing (%)
Most Common Industries - Utilities (%)
Most Common Industries - Information (%)
Most Common Industries - Finance and insurance, and real estate and rental and leasing (%)
Most Common Industries - Finance and insurance (%)
Most Common Industries - Real estate and rental and leasing (%)
Most Common Industries - Professional, scientific, and management, and administrative and waste management services (%)
Most Common Industries - Professional, scientific, and technical services (%)
Most Common Industries - Management of companies and enterprises (%)
Most Common Industries - Administrative and support and waste management services (%)
Most Common Industries - Educational services, and health care and social assistance (%)
Most Common Industries - Educational services (%)
Most Common Industries - Health care and social assistance (%)
Most Common Industries - Arts, entertainment, and recreation, and accommodation and food services (%)
Most Common Industries - Arts, entertainment, and recreation (%)
Most Common Industries - Accommodation and food services (%)
Most Common Industries - Other services, except public administration (%)
Most Common Industries - Public administration (%)
Occupation diversity
Most Common Occupations - Management, business, science, and arts occupations (%)
Most Common Occupations - Management, business, and financial occupations (%)
Most Common Occupations - Management occupations (%)
Most Common Occupations - Business and financial operations occupations (%)
Most Common Occupations - Computer, engineering, and science occupations (%)
Most Common Occupations - Computer and mathematical occupations (%)
Most Common Occupations - Architecture and engineering occupations (%)
Most Common Occupations - Life, physical, and social science occupations (%)
Most Common Occupations - Education, legal, community service, arts, and media occupations (%)
Most Common Occupations - Community and social service occupations (%)
Most Common Occupations - Legal occupations (%)
Most Common Occupations - Education, training, and library occupations (%)
Most Common Occupations - Arts, design, entertainment, sports, and media occupations (%)
Most Common Occupations - Healthcare practitioners and technical occupations (%)
Most Common Occupations - Health diagnosing and treating practitioners and other technical occupations (%)
Most Common Occupations - Health technologists and technicians (%)
Most Common Occupations - Service occupations (%)
Most Common Occupations - Healthcare support occupations (%)
Most Common Occupations - Protective service occupations (%)
Most Common Occupations - Fire fighting and prevention, and other protective service workers including supervisors (%)
Most Common Occupations - Law enforcement workers including supervisors (%)
Most Common Occupations - Food preparation and serving related occupations (%)
Most Common Occupations - Building and grounds cleaning and maintenance occupations (%)
Most Common Occupations - Personal care and service occupations (%)
Most Common Occupations - Sales and office occupations (%)
Most Common Occupations - Sales and related occupations (%)
Most Common Occupations - Office and administrative support occupations (%)
Most Common Occupations - Natural resources, construction, and maintenance occupations (%)
Most Common Occupations - Farming, fishing, and forestry occupations (%)
Most Common Occupations - Construction and extraction occupations (%)
Most Common Occupations - Installation, maintenance, and repair occupations (%)
Most Common Occupations - Production, transportation, and material moving occupations (%)
Most Common Occupations - Production occupations (%)
Most Common Occupations - Transportation occupations (%)
Most Common Occupations - Material moving occupations (%)
People in Group quarters - Institutionalized population (%)
People in Group quarters - Correctional institutions (%)
People in Group quarters - Federal prisons and detention centers (%)
People in Group quarters - Halfway houses (%)
People in Group quarters - Local jails and other confinement facilities (including police lockups) (%)
People in Group quarters - Military disciplinary barracks (%)
People in Group quarters - State prisons (%)
People in Group quarters - Other types of correctional institutions (%)
People in Group quarters - Nursing homes (%)
People in Group quarters - Hospitals/wards, hospices, and schools for the handicapped (%)
People in Group quarters - Hospitals/wards and hospices for chronically ill (%)
People in Group quarters - Hospices or homes for chronically ill (%)
People in Group quarters - Military hospitals or wards for chronically ill (%)
People in Group quarters - Other hospitals or wards for chronically ill (%)
People in Group quarters - Hospitals or wards for drug/alcohol abuse (%)
People in Group quarters - Mental (Psychiatric) hospitals or wards (%)
People in Group quarters - Schools, hospitals, or wards for the mentally retarded (%)
People in Group quarters - Schools, hospitals, or wards for the physically handicapped (%)
People in Group quarters - Institutions for the deaf (%)
People in Group quarters - Institutions for the blind (%)
People in Group quarters - Orthopedic wards and institutions for the physically handicapped (%)
People in Group quarters - Wards in general hospitals for patients who have no usual home elsewhere (%)
People in Group quarters - Wards in military hospitals for patients who have no usual home elsewhere (%)
People in Group quarters - Juvenile institutions (%)
People in Group quarters - Long-term care (%)
People in Group quarters - Homes for abused, dependent, and neglected children (%)
People in Group quarters - Residential treatment centers for emotionally disturbed children (%)
People in Group quarters - Training schools for juvenile delinquents (%)
People in Group quarters - Short-term care, detention or diagnostic centers for delinquent children (%)
People in Group quarters - Type of juvenile institution unknown (%)
People in Group quarters - Noninstitutionalized population (%)
People in Group quarters - College dormitories (includes college quarters off campus) (%)
People in Group quarters - Military quarters (%)
People in Group quarters - On base (%)
People in Group quarters - Barracks, unaccompanied personnel housing (UPH), (Enlisted/Officer), ;and similar group living quarters for military personnel (%)
People in Group quarters - Transient quarters for temporary residents (%)
People in Group quarters - Military ships (%)
People in Group quarters - Group homes (%)
People in Group quarters - Homes or halfway houses for drug/alcohol abuse (%)
People in Group quarters - Homes for the mentally ill (%)
People in Group quarters - Homes for the mentally retarded (%)
People in Group quarters - Homes for the physically handicapped (%)
People in Group quarters - Other group homes (%)
People in Group quarters - Religious group quarters (%)
People in Group quarters - Dormitories (%)
People in Group quarters - Agriculture workers' dormitories on farms (%)
People in Group quarters - Job Corps and vocational training facilities (%)
People in Group quarters - Other workers' dormitories (%)
People in Group quarters - Crews of maritime vessels (%)
People in Group quarters - Other nonhousehold living situations (%)
People in Group quarters - Other noninstitutional group quarters (%)
Residents speaking English at home (%)
Residents speaking English at home - Born in the United States (%)
Residents speaking English at home - Native, born elsewhere (%)
Residents speaking English at home - Foreign born (%)
Residents speaking Spanish at home (%)
Residents speaking Spanish at home - Born in the United States (%)
Residents speaking Spanish at home - Native, born elsewhere (%)
Residents speaking Spanish at home - Foreign born (%)
Residents speaking other language at home (%)
Residents speaking other language at home - Born in the United States (%)
Residents speaking other language at home - Native, born elsewhere (%)
Residents speaking other language at home - Foreign born (%)
Class of Workers - Employee of private company (%)
Class of Workers - Self-employed in own incorporated business (%)
Class of Workers - Private not-for-profit wage and salary workers (%)
Class of Workers - Local government workers (%)
Class of Workers - State government workers (%)
Class of Workers - Federal government workers (%)
Class of Workers - Self-employed workers in own not incorporated business and Unpaid family workers (%)
House heating fuel used in houses and condos - Utility gas (%)
House heating fuel used in houses and condos - Bottled, tank, or LP gas (%)
House heating fuel used in houses and condos - Electricity (%)
House heating fuel used in houses and condos - Fuel oil, kerosene, etc. (%)
House heating fuel used in houses and condos - Coal or coke (%)
House heating fuel used in houses and condos - Wood (%)
House heating fuel used in houses and condos - Solar energy (%)
House heating fuel used in houses and condos - Other fuel (%)
House heating fuel used in houses and condos - No fuel used (%)
House heating fuel used in apartments - Utility gas (%)
House heating fuel used in apartments - Bottled, tank, or LP gas (%)
House heating fuel used in apartments - Electricity (%)
House heating fuel used in apartments - Fuel oil, kerosene, etc. (%)
House heating fuel used in apartments - Coal or coke (%)
House heating fuel used in apartments - Wood (%)
House heating fuel used in apartments - Solar energy (%)
House heating fuel used in apartments - Other fuel (%)
House heating fuel used in apartments - No fuel used (%)
Armed forces status - In Armed Forces (%)
Armed forces status - Civilian (%)
Armed forces status - Civilian - Veteran (%)
Armed forces status - Civilian - Nonveteran (%)
Fatal accidents locations in years 2005-2021
Fatal accidents locations in 2005
Fatal accidents locations in 2006
Fatal accidents locations in 2007
Fatal accidents locations in 2008
Fatal accidents locations in 2009
Fatal accidents locations in 2010
Fatal accidents locations in 2011
Fatal accidents locations in 2012
Fatal accidents locations in 2013
Fatal accidents locations in 2014
Fatal accidents locations in 2015
Fatal accidents locations in 2016
Fatal accidents locations in 2017
Fatal accidents locations in 2018
Fatal accidents locations in 2019
Fatal accidents locations in 2020
Fatal accidents locations in 2021
Alcohol use - People drinking some alcohol every month (%)
Alcohol use - People not drinking at all (%)
Alcohol use - Average days/month drinking alcohol
Alcohol use - Average drinks/week
Alcohol use - Average days/year people drink much
Audiometry - Average condition of hearing (%)
Audiometry - People that can hear a whisper from across a quiet room (%)
Audiometry - People that can hear normal voice from across a quiet room (%)
Audiometry - Ears ringing, roaring, buzzing (%)
Audiometry - Had a job exposure to loud noise (%)
Audiometry - Had off-work exposure to loud noise (%)
Blood Pressure & Cholesterol - Has high blood pressure (%)
Blood Pressure & Cholesterol - Checking blood pressure at home (%)
Blood Pressure & Cholesterol - Frequently checking blood cholesterol (%)
Blood Pressure & Cholesterol - Has high cholesterol level (%)
Consumer Behavior - Money monthly spent on food at supermarket/grocery store
Consumer Behavior - Money monthly spent on food at other stores
Consumer Behavior - Money monthly spent on eating out
Consumer Behavior - Money monthly spent on carryout/delivered foods
Consumer Behavior - Income spent on food at supermarket/grocery store (%)
Consumer Behavior - Income spent on food at other stores (%)
Consumer Behavior - Income spent on eating out (%)
Consumer Behavior - Income spent on carryout/delivered foods (%)
Current Health Status - General health condition (%)
Current Health Status - Blood donors (%)
Current Health Status - Has blood ever tested for HIV virus (%)
Current Health Status - Left-handed people (%)
Dermatology - People using sunscreen (%)
Diabetes - Diabetics (%)
Diabetes - Had a blood test for high blood sugar (%)
Diabetes - People taking insulin (%)
Diet Behavior & Nutrition - Diet health (%)
Diet Behavior & Nutrition - Milk product consumption (# of products/month)
Diet Behavior & Nutrition - Meals not home prepared (#/week)
Diet Behavior & Nutrition - Meals from fast food or pizza place (#/week)
Diet Behavior & Nutrition - Ready-to-eat foods (#/month)
Diet Behavior & Nutrition - Frozen meals/pizza (#/month)
Drug Use - People that ever used marijuana or hashish (%)
Drug Use - Ever used hard drugs (%)
Drug Use - Ever used any form of cocaine (%)
Drug Use - Ever used heroin (%)
Drug Use - Ever used methamphetamine (%)
Health Insurance - People covered by health insurance (%)
Kidney Conditions-Urology - Avg. # of times urinating at night
Medical Conditions - People with asthma (%)
Medical Conditions - People with anemia (%)
Medical Conditions - People with psoriasis (%)
Medical Conditions - People with overweight (%)
Medical Conditions - Elderly people having difficulties in thinking or remembering (%)
Medical Conditions - People who ever received blood transfusion (%)
Medical Conditions - People having trouble seeing even with glass/contacts (%)
Medical Conditions - People with arthritis (%)
Medical Conditions - People with gout (%)
Medical Conditions - People with congestive heart failure (%)
Medical Conditions - People with coronary heart disease (%)
Medical Conditions - People with angina pectoris (%)
Medical Conditions - People who ever had heart attack (%)
Medical Conditions - People who ever had stroke (%)
Medical Conditions - People with emphysema (%)
Medical Conditions - People with thyroid problem (%)
Medical Conditions - People with chronic bronchitis (%)
Medical Conditions - People with any liver condition (%)
Medical Conditions - People who ever had cancer or malignancy (%)
Mental Health - People who have little interest in doing things (%)
Mental Health - People feeling down, depressed, or hopeless (%)
Mental Health - People who have trouble sleeping or sleeping too much (%)
Mental Health - People feeling tired or having little energy (%)
Mental Health - People with poor appetite or overeating (%)
Mental Health - People feeling bad about themself (%)
Mental Health - People who have trouble concentrating on things (%)
Mental Health - People moving or speaking slowly or too fast (%)
Mental Health - People having thoughts they would be better off dead (%)
Oral Health - Average years since last visit a dentist
Oral Health - People embarrassed because of mouth (%)
Oral Health - People with gum disease (%)
Oral Health - General health of teeth and gums (%)
Oral Health - Average days a week using dental floss/device
Oral Health - Average days a week using mouthwash for dental problem
Oral Health - Average number of teeth
Pesticide Use - Households using pesticides to control insects (%)
Pesticide Use - Households using pesticides to kill weeds (%)
Physical Activity - People doing vigorous-intensity work activities (%)
Physical Activity - People doing moderate-intensity work activities (%)
Physical Activity - People walking or bicycling (%)
Physical Activity - People doing vigorous-intensity recreational activities (%)
Physical Activity - People doing moderate-intensity recreational activities (%)
Physical Activity - Average hours a day doing sedentary activities
Physical Activity - Average hours a day watching TV or videos
Physical Activity - Average hours a day using computer
Physical Functioning - People having limitations keeping them from working (%)
Physical Functioning - People limited in amount of work they can do (%)
Physical Functioning - People that need special equipment to walk (%)
Physical Functioning - People experiencing confusion/memory problems (%)
Physical Functioning - People requiring special healthcare equipment (%)
Prescription Medications - Average number of prescription medicines taking
Preventive Aspirin Use - Adults 40+ taking low-dose aspirin (%)
Reproductive Health - Vaginal deliveries (%)
Reproductive Health - Cesarean deliveries (%)
Reproductive Health - Deliveries resulted in a live birth (%)
Reproductive Health - Pregnancies resulted in a delivery (%)
Reproductive Health - Women breastfeeding newborns (%)
Reproductive Health - Women that had a hysterectomy (%)
Reproductive Health - Women that had both ovaries removed (%)
Reproductive Health - Women that have ever taken birth control pills (%)
Reproductive Health - Women taking birth control pills (%)
Reproductive Health - Women that have ever used Depo-Provera or injectables (%)
Reproductive Health - Women that have ever used female hormones (%)
Sexual Behavior - People 18+ that ever had sex (vaginal, anal, or oral) (%)
Sexual Behavior - Males 18+ that ever had vaginal sex with a woman (%)
Sexual Behavior - Males 18+ that ever performed oral sex on a woman (%)
Sexual Behavior - Males 18+ that ever had anal sex with a woman (%)
Sexual Behavior - Males 18+ that ever had any sex with a man (%)
Sexual Behavior - Females 18+ that ever had vaginal sex with a man (%)
Sexual Behavior - Females 18+ that ever performed oral sex on a man (%)
Sexual Behavior - Females 18+ that ever had anal sex with a man (%)
Sexual Behavior - Females 18+ that ever had any kind of sex with a woman (%)
Sexual Behavior - Average age people first had sex
Sexual Behavior - Average number of female sex partners in lifetime (males 18+)
Sexual Behavior - Average number of female vaginal sex partners in lifetime (males 18+)
Sexual Behavior - Average age people first performed oral sex on a woman (18+)
Sexual Behavior - Average number of woman performed oral sex on in lifetime (18+)
Sexual Behavior - Average number of male sex partners in lifetime (males 18+)
Sexual Behavior - Average number of male anal sex partners in lifetime (males 18+)
Sexual Behavior - Average age people first performed oral sex on a man (18+)
Sexual Behavior - Average number of male oral sex partners in lifetime (18+)
Sexual Behavior - People using protection when performing oral sex (%)
Sexual Behavior - Average number of times people have vaginal or anal sex a year
Sexual Behavior - People having sex without condom (%)
Sexual Behavior - Average number of male sex partners in lifetime (females 18+)
Sexual Behavior - Average number of male vaginal sex partners in lifetime (females 18+)
Sexual Behavior - Average number of female sex partners in lifetime (females 18+)
Sexual Behavior - Circumcised males 18+ (%)
Sleep Disorders - Average hours sleeping at night
Sleep Disorders - People that has trouble sleeping (%)
Smoking-Cigarette Use - People smoking cigarettes (%)
Taste & Smell - People 40+ having problems with smell (%)
Taste & Smell - People 40+ having problems with taste (%)
Taste & Smell - People 40+ that ever had wisdom teeth removed (%)
Taste & Smell - People 40+ that ever had tonsils teeth removed (%)
Taste & Smell - People 40+ that ever had a loss of consciousness because of a head injury (%)
Taste & Smell - People 40+ that ever had a broken nose or other serious injury to face or skull (%)
Taste & Smell - People 40+ that ever had two or more sinus infections (%)
Weight - Average height (inches)
Weight - Average weight (pounds)
Weight - Average BMI
Weight - People that are obese (%)
Weight - People that ever were obese (%)
Weight - People trying to lose weight (%)
100%
urban population.
Estimated median house/condo value in 2022: $686,582
90062:
$686,582California:
$715,900
Median resident age: This zip code:
38.2 yearsCalifornia median age:
37.9 years
Average household size: This zip code:
3.3 peopleCalifornia:
2.8 people
Averages for the 2020 tax year for zip code 90062, filed in 2021:
Average Adjusted Gross Income (AGI) in 2020: $39,043 (Individual Income Tax Returns) Here:
$39,043State:
$95,910
Salary/wage: $38,910 (reported on 79.8% of returns )Here:
$38,910State:
$77,331
(% of AGI for various income ranges: 1204.7% for AGIs below $25k , 4033.0% for AGIs $25k-50k , 7693.3% for AGIs $50k-75k , 11422.1% for AGIs $75k-100k , 19820.7% for AGIs $100k-200k , 64740.0% for AGIs over 200k ) Taxable interest for individuals: $250 (reported on 17.8% of returns )This zip code:
$250California:
$2,294
(% of AGI for various income ranges: 1.7% for AGIs below $25k , 4.7% for AGIs $25k-50k , 8.2% for AGIs $50k-75k , 14.1% for AGIs $75k-100k , 39.8% for AGIs $100k-200k , 188.0% for AGIs over 200k ) Ordinary dividends: $649 (reported on 4.0% of returns )(% of AGI for various income ranges: 0.7% for AGIs below $25k , 2.6% for AGIs $25k-50k , 4.1% for AGIs $50k-75k , 5.7% for AGIs $75k-100k , 17.3% for AGIs $100k-200k , 242.0% for AGIs over 200k ) Net capital gain/loss in AGI: +$9,574 (reported on 4.8% of returns )Here:
+$9,574State:
+$49,306
(% of AGI for various income ranges: 0.9% for AGIs below $25k , 5.5% for AGIs $25k-50k , 8.1% for AGIs $50k-75k , 42.3% for AGIs $75k-100k , 338.5% for AGIs $100k-200k , 10588.0% for AGIs over 200k ) Profit/loss from business: +$6,829 (reported on 25.1% of returns )Here:
+$6,829State:
+$15,671
(% of AGI for various income ranges: 313.0% for AGIs below $25k , 151.7% for AGIs $25k-50k , 238.6% for AGIs $50k-75k , 297.3% for AGIs $75k-100k , 341.7% for AGIs $100k-200k , 2532.0% for AGIs over 200k ) Taxable individual retirement arrangement distribution: $10,185 (reported on 1.3% of returns )90062:
$10,185California:
$23,505
(% of AGI for various income ranges: 6.8% for AGIs below $25k , 9.8% for AGIs $25k-50k , 23.5% for AGIs $50k-75k , 75.5% for AGIs $75k-100k , 153.2% for AGIs $100k-200k ) Total itemized deductions: $26,966 (reported on 8.9% of returns )Here:
$26,966State:
$39,517
(% of AGI for various income ranges: 47.8% for AGIs below $25k , 194.7% for AGIs $25k-50k , 579.6% for AGIs $50k-75k , 1298.9% for AGIs $75k-100k , 2411.7% for AGIs $100k-200k , 6374.0% for AGIs over 200k ) Charity contributions: $5,478 (reported on 7.2% of returns )(% of AGI for various income ranges: 4.6% for AGIs below $25k , 28.4% for AGIs $25k-50k , 89.8% for AGIs $50k-75k , 235.5% for AGIs $75k-100k , 478.3% for AGIs $100k-200k , 812.0% for AGIs over 200k ) Taxes paid: $7,384 (reported on 8.9% of returns )(% of AGI for various income ranges: 12.3% for AGIs below $25k , 48.6% for AGIs $25k-50k , 153.1% for AGIs $50k-75k , 373.6% for AGIs $75k-100k , 725.1% for AGIs $100k-200k , 1588.0% for AGIs over 200k ) Earned income credit: $2,182 (reported on 26.3% of returns )(% of AGI for various income ranges: 139.0% for AGIs below $25k , 78.6% for AGIs $25k-50k , 1.4% for AGIs $50k-75k ) Percentage of individuals using paid preparers for their 2020 taxes: 89.2%(% for various income ranges: 86.4% for AGIs below $25k , 90.9% for AGIs $25k-50k , 91.3% for AGIs $50k-75k , 92.1% for AGIs $75k-100k , 93.3% for AGIs $100k-200k , 93.3% for AGIs over 200k )
Averages for the 2012 tax year for zip code 90062, filed in 2013:
Average Adjusted Gross Income (AGI) in 2012: $27,781 (Individual Income Tax Returns) Here:
$27,781State:
$72,726
Salary/wage: $28,338 (reported on 82.4% of returns )Here:
$28,338State:
$59,079
(% of AGI for various income ranges: 73.6% for AGIs below $25k , 89.7% for AGIs $25k-50k , 87.7% for AGIs $50k-75k , 86.8% for AGIs $75k-100k , 81.3% for AGIs $100k-200k ) Taxable interest for individuals: $205 (reported on 15.2% of returns )This zip code:
$205California:
$2,146
(% of AGI for various income ranges: 0.1% for AGIs $25k-50k , 0.1% for AGIs $75k-100k , 0.2% for AGIs $100k-200k ) Ordinary dividends: $667 (reported on 2.2% of returns )(% of AGI for various income ranges: 0.1% for AGIs $75k-100k ) Profit/loss from business: +$8,203 (reported on 22.7% of returns )Here:
+$8,203State:
+$17,064
(% of AGI for various income ranges: 19.1% for AGIs below $25k , 2.9% for AGIs $25k-50k , 1.4% for AGIs $50k-75k , 0.9% for AGIs $75k-100k , 0.9% for AGIs $100k-200k ) Taxable individual retirement arrangement distribution: $9,735 (reported on 1.7% of returns )90062:
$9,735California:
$19,557
(% of AGI for various income ranges: 0.5% for AGIs below $25k , 0.5% for AGIs $25k-50k , 0.7% for AGIs $50k-75k , 1.3% for AGIs $75k-100k ) Total itemized deductions: $18,846 (38% of AGI, reported on 22.0% of returns )Here:
$18,846State:
$34,004
Here:
37.9% of AGIState:
22.7% of AGI
(% of AGI for various income ranges: 7.7% for AGIs below $25k , 14.5% for AGIs $25k-50k , 20.4% for AGIs $50k-75k , 21.0% for AGIs $75k-100k , 21.7% for AGIs $100k-200k ) Charity contributions: $3,002 (reported on 16.3% of returns )(% of AGI for various income ranges: 0.6% for AGIs below $25k , 1.6% for AGIs $25k-50k , 2.4% for AGIs $50k-75k , 3.4% for AGIs $75k-100k , 3.2% for AGIs $100k-200k ) Taxes paid: $4,343 (reported on 21.8% of returns )90062:
$4,343State:
$14,448
(% of AGI for various income ranges: 1.4% for AGIs below $25k , 2.9% for AGIs $25k-50k , 5.0% for AGIs $50k-75k , 5.6% for AGIs $75k-100k , 6.6% for AGIs $100k-200k ) Earned income credit: $2,593 (reported on 37.9% of returns )(% of AGI for various income ranges: 10.6% for AGIs below $25k , 1.8% for AGIs $25k-50k ) Percentage of individuals using paid preparers for their 2012 taxes: 75.0%(% for various income ranges: 74.1% for AGIs below $25k , 77.1% for AGIs $25k-50k , 76.4% for AGIs $50k-75k , 70.7% for AGIs $75k-100k , 71.4% for AGIs $100k-200k )
Averages for the 2004 tax year for zip code 90062, filed in 2005:
Average Adjusted Gross Income (AGI) in 2004: $24,846 (Individual Income Tax Returns) Here:
$24,846State:
$58,600
Salary/wage: $25,384 (reported on 84.9% of returns )Here:
$25,384State:
$49,455
(% of AGI for various income ranges: 71.6% for AGIs below $10k , 82.7% for AGIs $10k-25k , 91.4% for AGIs $25k-50k , 90.0% for AGIs $50k-75k , 88.2% for AGIs $75k-100k , 69.6% for AGIs over 100k ) Taxable interest for individuals: $356 (reported on 21.1% of returns )This zip code:
$356California:
$2,365
(% of AGI for various income ranges: 1.0% for AGIs below $10k , 0.4% for AGIs $10k-25k , 0.2% for AGIs $25k-50k , 0.2% for AGIs $50k-75k , 0.2% for AGIs $75k-100k , 0.1% for AGIs over 100k ) Taxable dividends: $413 (reported on 3.3% of returns )(% of AGI for various income ranges: 0.1% for AGIs below $10k , 0.1% for AGIs $10k-25k , 0.0% for AGIs $25k-50k , 0.1% for AGIs $50k-75k , 0.1% for AGIs $75k-100k , 0.0% for AGIs over 100k ) Net capital gain/loss: +$7,338 (reported on 1.9% of returns )Here:
+$7,338State:
+$23,418
(% of AGI for various income ranges: 0.2% for AGIs below $10k , -0.0% for AGIs $10k-25k , 0.1% for AGIs $25k-50k , 0.1% for AGIs $50k-75k , 0.5% for AGIs $75k-100k , 10.7% for AGIs over 100k ) Profit/loss from business: +$6,794 (reported on 18.7% of returns )Here:
+$6,794State:
+$16,826
(% of AGI for various income ranges: 26.4% for AGIs below $10k , 10.7% for AGIs $10k-25k , 1.9% for AGIs $25k-50k , 0.8% for AGIs $50k-75k , -0.5% for AGIs $75k-100k , 1.5% for AGIs over 100k ) IRA payment deduction: $1,558 (reported on 1.0% of returns )90062:
$1,558California:
$3,192
Total itemized deductions: $17,238 (41% of AGI, reported on 26.0% of returns )Here:
$17,238State:
$28,113
Here:
41.1% of AGIState:
25.3% of AGI
(% of AGI for various income ranges: 9.5% for AGIs below $10k , 12.3% for AGIs $10k-25k , 19.1% for AGIs $25k-50k , 24.2% for AGIs $50k-75k , 23.2% for AGIs $75k-100k , 21.7% for AGIs over 100k ) Charity contributions deductions: $2,790 (6% of AGI, reported on 21.5% of returns )Here:
6.3% of AGIState:
3.3% of AGI
(% of AGI for various income ranges: 0.5% for AGIs below $10k , 0.9% for AGIs $10k-25k , 2.6% for AGIs $25k-50k , 3.7% for AGIs $50k-75k , 4.2% for AGIs $75k-100k , 4.6% for AGIs over 100k ) Total tax: $2,205 (reported on 59.4% of returns )90062:
$2,205State:
$10,761
(% of AGI for various income ranges: 4.7% for AGIs below $10k , 3.4% for AGIs $10k-25k , 4.4% for AGIs $25k-50k , 7.0% for AGIs $50k-75k , 9.2% for AGIs $75k-100k , 13.5% for AGIs over 100k ) Earned income credit: $2,021 (reported on 40.0% of returns )Percentage of individuals using paid preparers for their 2004 taxes: 78.3%(% for various income ranges: 73.4% for AGIs below $10k , 81.1% for AGIs $10k-25k , 78.5% for AGIs $25k-50k , 78.4% for AGIs $50k-75k , 78.0% for AGIs $75k-100k , 78.7% for AGIs over 100k )
Estimated median household income in 2022: This zip code:
$61,185California:
$91,551
Nearest zip codes: 90037 ,
90018 ,
90089 ,
90043 ,
90007 ,
90008 .
Los Angeles Zip Code Map
Percentage of family households: This zip code:
54.5%California:
46.8%
Percentage of households with unmarried partners: This zip code:
7.5%California:
48.1%
Likely homosexual households (counted as self-reported same-sex unmarried-partner households)
Lesbian couples: 0.1% of all households Gay men: 0.0% of all households
Household received Food Stamps/SNAP in the past 12 months: 2,850Household did not receive Food Stamps/SNAP in the past 12 months: 7,460
Women who had a birth in the past 12 months: 629 (370 now married , 261 unmarried) Women who did not have a birth in the past 12 months: 8,262 (2,357 now married , 5,943 unmarried)
Housing units in zip code 90062 with a mortgage: 3,340 (221
second mortgage , 12
home equity loan , 117
both second mortgage and home equity loan )
Houses without a mortgage: 7
Median monthly owner costs for units with a mortgage: $2,405
Median monthly owner costs for units without a mortgage: $671
Residents with income below the poverty level in 2022:
This zip code:
15.6%Whole state:
12.2%
Residents with income below 50% of the poverty level in 2022:
This zip code:
8.8%Whole state:
6.2%
Median number of rooms in houses and condos: Median number of rooms in apartments:
Year house built (houses)
0 2020 or later301 2010 to 2019405 2000 to 2009313 1990 to 1999270 1980 to 1989537 1970 to 1979484 1960 to 1969904 1950 to 19591,326 1940 to 19495,804 1939 or earlier
Zip code 90062 household income distribution in 2022 760 Less than $10,000595 $10,000 to $14,999242 $15,000 to $19,999320 $20,000 to $24,999500 $25,000 to $29,999450 $30,000 to $34,999216 $35,000 to $39,999520 $40,000 to $44,999270 $45,000 to $49,9991,020 $50,000 to $59,9991,021 $60,000 to $74,9991,172 $75,000 to $99,999796 $100,000 to $124,999678 $125,000 to $149,999791 $150,000 to $199,999626 $200,000 or moreEstimate of home value of owner-occupied houses/condos in 2022 in zip code 90062 25 Less than $10,00022 $30,000 to $34,99914 $50,000 to $59,99925 $60,000 to $69,99983 $70,000 to $79,99920 $100,000 to $124,99913 $150,000 to $174,99926 $175,000 to $199,99931 $200,000 to $249,99935 $250,000 to $299,999188 $300,000 to $399,999469 $400,000 to $499,9992,398 $500,000 to $749,9991,200 $750,000 to $999,99986 $1,000,000 to $1,499,99965 $1,500,000 to $1,999,99924 $2,000,000 or moreRent paid by renters in 2022 in zip code 90062 114 Less than $10021 $100 to $14958 $150 to $19962 $200 to $249121 $250 to $29995 $300 to $34949 $350 to $39930 $450 to $49930 $500 to $54970 $550 to $59997 $600 to $64924 $650 to $69926 $700 to $749167 $750 to $799159 $800 to $899298 $900 to $9991,053 $1,000 to $1,249688 $1,250 to $1,4991,095 $1,500 to $1,999568 $2,000 to $2,49976 $2,500 to $2,99971 $3,000 to $3,49939 $3,500 or more92 No cash rent
Median gross rent in 2022: $1,462.
Median price asked for vacant for-sale houses and condos in 2022: $1,809,596.
Estimated median house (or condo) value in 2022 for: White Non-Hispanic householders: $693,531Black or African American householders: $675,463American Indian or Alaska Native householders: $405,370Asian householders: $807,035Native Hawaiian and other Pacific Islander householders: $752,831Some other race householders: $709,282Two or more races householders: $687,508Hispanic or Latino householders: $689,361Estimated median house or condo value in 2022: $686,582
90062:
$686,582California:
$715,900
Lower value quartile - upper value quartile: $564,702 - $830,830
Mean price in 2022: Detached houses: $640,700Here:
$640,700State:
$988,808
Townhouses or other attached units: $622,622Here:
$622,622State:
$838,546
In 2-unit structures: $891,079Here:
$891,079State:
$1,138,100
In 3-to-4-unit structures: $1,084,408Here:
$1,084,408State:
$824,253
Housing units in structures:
One, detached: 5,375One, attached: 2,022Two: 8453 or 4: 8425 to 9: 42710 to 19: 44920 to 49: 37050 or more: 37Unemployment : 6.2%
Means of transportation to work in zip code 90062 68.2% 10,584 Drove a car alone9.2% 1,428 Carpooled6.2% 963 Bus or trolley bus0.1% 20 Streetcar or trolley car0.2% 24 Subway or elevated0.4% 66 Railroad0.2% 35 Taxi0.1% 17 Motorcycle0.3% 41 Bicycle0.8% 120 Walked1.0% 156 Other means10.8% 1,684 Worked at homeTravel time to work (commute) in zip code 90062 26 Less than 5 minutes300 5 to 9 minutes635 10 to 14 minutes1,185 15 to 19 minutes2,028 20 to 24 minutes691 25 to 29 minutes2,911 30 to 34 minutes525 35 to 39 minutes1,118 40 to 44 minutes1,789 45 to 59 minutes1,674 60 to 89 minutes718 90 or more minutes
Percentage of zip code residents living and working in this county: 99.0%
Household type by relationship:
Households: 33,249
Male householders: 4,392 (807 living alone ), Female householders: 5,596 (1,137 living alone )3,668 spouses (3,537 opposite-sex spouses ), 1,006 unmarried partners , (982 opposite-sex unmarried partners ), 10,918 children (10,242 natural , 187 adopted , 484 stepchildren ), 1,869 grandchildren , 961 brothers or sisters , 1,156 parents , 15 foster children , 1,676 other relatives , 1,388 non-relatives In group quarters: 494 (-1 institutionalized population )
Size of family households: 1,728 2-persons , 1,958 3-persons , 1,827 4-persons , 1,096 5-persons , 548 6-persons , 212 7-or-more-persons
Size of nonfamily households: 1,945 1-person , 314 2-persons , 153 3-persons , 101 4-persons , 23 5-persons
2,900 married couples with children. single-parent households (578 men , 1,698 women ).
35.6% of residents of 90062 zip code speak English at home. of residents speak Spanish at home (52% very well, 17% well, 22% not well, 10% not at all ).of residents speak other Indo-European language at home (96% very well, 4% well ).of residents speak Asian or Pacific Island language at home (46% very well, 34% well, 17% not well, 3% not at all ).of residents speak other language at home (94% very well, 3% well, 3% not well ).
Foreign born population: 12,737 (38.3%)
(40.9%
of them are naturalized citizens )
This zip code:
38.3%Whole state:
26.7%
32% Costa Rica 29% Honduras 19% El Salvador 2% Guatemala 2% Japan 1% Guyana 1% Belize 5% American 2% Belizean 1% African 0% Nigerian 0% German 0% Ethiopian 0% European
Year of entry for the foreign-born population
2,157 2010 or later 2,608 2000 to 2009 3,270 1990 to 1999 4,649 Before 1990
There are
149 Medical Specialists in Zip Code 90062 .
Facilities with environmental interests located in this zip code:
EQUILON ENTERPRISES (1404 MARTIN LUTHER KING JR BLVD in LOS ANGELES, CA)
STATE MASTER (California - Hazardous Waste Tracking) - HAZARDOU WASTE PROGRAM HAZARDOUS WASTE BIENNIAL REPORTER (Resource Conservation and Recovery Act (tracking hazardous waste)) Small Quantity Generators, between 100 kg and 1000 kg of hazardous waste/month (Resource Conservation and Recovery Act (tracking hazardous waste)) - notification Organizations: EQUILON ENTERPRISES L L C (CONTACT/OWNER)
Alternative names: SHELL OIL CO
EQUILON ENTERPRISES (4404 S WESTERN in LOS ANGELES, CA)
STATE MASTER (California - Hazardous Waste Tracking) - HAZARDOU WASTE PROGRAM Small Quantity Generators, between 100 kg and 1000 kg of hazardous waste/month (Resource Conservation and Recovery Act (tracking hazardous waste)) - notification Organizations: EQUILON ENTERPRISES L L C (CONTACT/OWNER)
Alternative names: SHELL OIL CO
KING (MARTIN LUTHER, JR) ELEMENTARY (3989 S. HOBART BLVD. in LOS ANGELES, CA)
(National Center for Education Statistics) - STATE ID-6019061 Organizations: LOS ANGELES UNIFIED (SCHOOL DISTRICT)
FLEMINGS AUTO BODY (5120 SOUTH WESTERN AVE in LOS ANGELES, CA)
Small Quantity Generators, between 100 kg and 1000 kg of hazardous waste/month (Resource Conservation and Recovery Act (tracking hazardous waste)) - notification Organizations: FLEMING JOHN (CONTACT/OWNER)
JIMMYS DRY CLEANERS (1764 W MARTIN LUTHER KING in LOS ANGELES, CA)
Small Quantity Generators, between 100 kg and 1000 kg of hazardous waste/month (Resource Conservation and Recovery Act (tracking hazardous waste)) Organizations: JIMMY HOLMES (CONTACT/OWNER)
JORDAN DRY CLEANER (3941 WESTERN in LOS ANGELES, CA)
Small Quantity Generators, between 100 kg and 1000 kg of hazardous waste/month (Resource Conservation and Recovery Act (tracking hazardous waste)) Organizations: WILLARD JORDAN (CONTACT/OWNER)
LEEDEILS (2042 MARTIN LUTHER KING BLVD in LOS ANGELES, CA)
Small Quantity Generators, between 100 kg and 1000 kg of hazardous waste/month (Resource Conservation and Recovery Act (tracking hazardous waste)) Organizations: LEONARD LINDGREN (CONTACT/OWNER)
CALIF CURTAIN & DRAPERY (5159 S WESTERN in LOS ANGELES, CA)
Small Quantity Generators, between 100 kg and 1000 kg of hazardous waste/month (Resource Conservation and Recovery Act (tracking hazardous waste)) Organizations: TRANS CONTINENTAL (CONTACT/OWNER)
HARRYS CLEANERS (4832 WESTERN AVE in LOS ANGELES, CA)
Small Quantity Generators, between 100 kg and 1000 kg of hazardous waste/month (Resource Conservation and Recovery Act (tracking hazardous waste)) - notification Organizations: LEE SANG K (CONTACT/OWNER)
LEWIS METROPOLITAN CHRISTIAN (4900 S WESTERN AVE in LOS ANGELES, CA)
COMPLIANCE ACTIVITY (Tracking inspections of insecticide, fungicide, and rodenticide, and toxic substances)
Housing units lacking complete plumbing facilities: 0.4%
Housing units lacking complete kitchen facilities: 2.1%
61.9% Utility gas 25.7% Electricity 10.0% No fuel used 2.1% Bottled, tank, or LP gas
Population in 1990: 27,517. Population change in the 1990s: +1,762 (+6.4%).
Place of birth for U.S.-born residents:
This state: 17,198Northeast: 453Midwest: 572South: 1,974West: 291
60% of the 90062 zip code residents lived in the same house 5 years ago.
Out of people who lived in different houses, 90% lived in this county.
Out of people who lived in different counties, 50% lived in California.
95% of the 90062 zip code residents lived in the same house 1 year ago.
Out of people who lived in different houses, 87% moved from this county.
Out of people who lived in different houses, 4% moved from different county within same state.
Out of people who lived in different houses, 6% moved from different state.
Out of people who lived in different houses, 6% moved from abroad.
Private vs. public school enrollment:
Students in private schools in grades 1 to 8 (elementary and middle school): 126
Here:
4.5%California:
10.5%
Students in private schools in grades 9 to 12 (high school): 123
Students in private undergraduate colleges: 586
Here:
29.3%California:
15.9%
Occupation by median earnings in the past 12 months ($)
97,435 Life, physical, and social science occupations 96,194 Computer and mathematical occupations 86,154 Architecture and engineering occupations 74,765 Legal occupations 69,565 Health diagnosing and treating practitioners and other technical occupations 59,978 Arts, design, entertainment, sports, and media occupations
Companies with federal contracts located in this zip code:
ENERTIA INC (1808 W 39TH PL in LOS ANGELES, CA; small business)
$33,956 with Navy for Miscellaneous Materials Handling Equipment. Signed on 2005-10-13. Completion date: 2005-11-15.
Top industries in this zip code by the number of employees in 2005:
Accommodation and Food Services: Limited-Service Restaurants (50-99 employees: 2 establishments, 20-49 employees: 3 establishments, 5-9 employees: 2 establishments, 1-4 employees: 3 establishments)Health Care and Social Assistance: Other Residential Care Facilities (10-19: 3, 5-9: 1)Health Care and Social Assistance: Child Day Care Services (10-19: 2, 5-9: 2, 1-4: 3)Health Care and Social Assistance: Other Individual and Family Services (20-49: 1, 10-19: 1, 1-4: 1)Educational Services: Elementary and Secondary Schools (20-49: 1, 1-4: 2)Professional, Scientific, and Technical Services: Tax Preparation Services (20-49: 1, 1-4: 1)Health Care and Social Assistance: Vocational Rehabilitation Services (20-49: 1)Other Services (except Public Administration): Car Washes (20-49: 1)
People in group quarters in 2010:
149 people in residential treatment centers for adults
54 people in group homes intended for adults
44 people in other noninstitutional facilities
28 people in emergency and transitional shelters (with sleeping facilities) for people experiencing homelessness
17 people in group homes for juveniles (non-correctional)
People in group quarters in 2000:
220 people in other noninstitutional group quarters
67 people in other types of correctional institutions
39 people in homes or halfway houses for drug/alcohol abuse
28 people in other group homes
26 people in homes for the mentally retarded
12 people in other nonhousehold living situations
11 people in homes for the mentally ill
Fatal accident statistics in 2014:
Fatal accident count: 3Vehicles involved in fatal accidents: 4Fatal accidents caused by drunken drivers: 1Fatalities: 3Persons involved in fatal accidents: 7Pedestrians involved in fatal accidents: 2
Fatal accident statistics in 2012:
Fatal accident count: 5Vehicles involved in fatal accidents: 6Fatal accidents caused by drunken drivers: 0Fatalities: 5Persons involved in fatal accidents: 8Pedestrians involved in fatal accidents: 3
Home Mortgage Disclosure Act Aggregated Statistics For Year 2009(Based on 7 full and 10 partial tracts) A) FHA, FSA/RHS & VA B) Conventional C) Refinancings D) Home Improvement Loans E) Loans on Dwellings For 5+ Families F) Non-occupant Loans on G) Loans On Manufactured Number Average Value Number Average Value Number Average Value Number Average Value Number Average Value Number Average Value Number Average Value
LOANS ORIGINATED 196 $226,609 101 $206,921 198 $194,704 17 $126,946 9 $317,058 67 $195,209 0 $0 APPLICATIONS APPROVED, NOT ACCEPTED 33 $249,142 19 $238,339 52 $217,818 3 $171,413 0 $0 11 $233,774 0 $0 APPLICATIONS DENIED 76 $246,710 38 $201,028 286 $247,345 40 $113,288 2 $500,355 46 $220,608 2 $111,000 APPLICATIONS WITHDRAWN 53 $227,698 20 $168,151 125 $242,516 0 $0 8 $1,806,576 13 $234,485 0 $0 FILES CLOSED FOR INCOMPLETENESS 12 $230,530 4 $175,425 46 $274,830 1 $207,330 0 $0 6 $180,357 0 $0
Aggregated Statistics For Year 2008(Based on 7 full and 10 partial tracts) A) FHA, FSA/RHS & VA B) Conventional C) Refinancings D) Home Improvement Loans E) Loans on Dwellings For 5+ Families F) Non-occupant Loans on G) Loans On Manufactured Number Average Value Number Average Value Number Average Value Number Average Value Number Average Value Number Average Value Number Average Value
LOANS ORIGINATED 45 $304,996 97 $279,810 399 $262,341 52 $210,186 11 $321,279 109 $271,314 0 $0 APPLICATIONS APPROVED, NOT ACCEPTED 9 $320,033 46 $312,069 140 $293,338 15 $136,013 0 $0 22 $283,251 3 $62,313 APPLICATIONS DENIED 35 $326,064 100 $306,034 575 $328,687 107 $157,490 15 $608,041 111 $327,257 2 $86,470 APPLICATIONS WITHDRAWN 12 $287,252 37 $306,622 145 $279,506 43 $196,377 0 $0 16 $290,191 0 $0 FILES CLOSED FOR INCOMPLETENESS 4 $289,950 13 $313,366 70 $307,766 10 $273,985 2 $789,220 5 $235,372 0 $0
Aggregated Statistics For Year 2007(Based on 7 full and 10 partial tracts) A) FHA, FSA/RHS & VA B) Conventional C) Refinancings D) Home Improvement Loans E) Loans on Dwellings For 5+ Families F) Non-occupant Loans on G) Loans On Manufactured Number Average Value Number Average Value Number Average Value Number Average Value Number Average Value Number Average Value Number Average Value
LOANS ORIGINATED 2 $88,445 343 $311,390 1,391 $314,539 192 $241,380 26 $615,565 255 $315,078 1 $146,000 APPLICATIONS APPROVED, NOT ACCEPTED 0 $0 175 $289,838 374 $309,734 36 $209,059 0 $0 83 $316,540 0 $0 APPLICATIONS DENIED 2 $344,000 417 $332,279 1,120 $349,254 199 $184,947 5 $308,896 194 $351,603 3 $225,037 APPLICATIONS WITHDRAWN 0 $0 137 $313,805 431 $348,406 56 $233,799 3 $714,330 97 $354,765 2 $50,000 FILES CLOSED FOR INCOMPLETENESS 0 $0 49 $305,813 195 $343,931 24 $262,250 0 $0 24 $389,438 0 $0
Aggregated Statistics For Year 2006(Based on 7 full and 10 partial tracts) B) Conventional C) Refinancings D) Home Improvement Loans E) Loans on Dwellings For 5+ Families F) Non-occupant Loans on G) Loans On Manufactured Number Average Value Number Average Value Number Average Value Number Average Value Number Average Value Number Average Value
LOANS ORIGINATED 919 $273,027 1,923 $305,342 296 $237,882 26 $442,419 407 $309,467 4 $165,000 APPLICATIONS APPROVED, NOT ACCEPTED 256 $261,873 452 $314,447 36 $221,215 5 $255,440 96 $284,207 3 $56,900 APPLICATIONS DENIED 623 $286,072 1,092 $324,219 183 $204,886 4 $3,355,820 182 $338,402 4 $330,405 APPLICATIONS WITHDRAWN 235 $278,415 772 $300,562 81 $218,052 0 $0 108 $294,910 4 $221,158 FILES CLOSED FOR INCOMPLETENESS 78 $281,444 183 $306,349 29 $128,635 3 $340,667 29 $292,430 0 $0
Aggregated Statistics For Year 2005(Based on 7 full and 10 partial tracts) A) FHA, FSA/RHS & VA B) Conventional C) Refinancings D) Home Improvement Loans E) Loans on Dwellings For 5+ Families F) Non-occupant Loans on G) Loans On Manufactured Number Average Value Number Average Value Number Average Value Number Average Value Number Average Value Number Average Value Number Average Value
LOANS ORIGINATED 1 $154,470 963 $240,447 2,148 $257,575 287 $192,061 30 $491,219 458 $262,723 2 $329,010 APPLICATIONS APPROVED, NOT ACCEPTED 0 $0 249 $235,473 466 $251,434 55 $143,068 2 $107,675 105 $270,325 0 $0 APPLICATIONS DENIED 3 $469,063 468 $254,452 1,120 $262,470 192 $169,977 16 $423,563 239 $268,426 4 $130,205 APPLICATIONS WITHDRAWN 2 $232,900 261 $264,705 786 $246,577 97 $183,068 1 $658,100 124 $241,607 0 $0 FILES CLOSED FOR INCOMPLETENESS 0 $0 73 $258,845 292 $257,437 23 $127,792 2 $434,800 45 $271,006 2 $172,530
Aggregated Statistics For Year 2004(Based on 7 full and 10 partial tracts) A) FHA, FSA/RHS & VA B) Conventional C) Refinancings D) Home Improvement Loans E) Loans on Dwellings For 5+ Families F) Non-occupant Loans on G) Loans On Manufactured Number Average Value Number Average Value Number Average Value Number Average Value Number Average Value Number Average Value Number Average Value
LOANS ORIGINATED 12 $225,062 937 $190,406 2,183 $203,215 254 $162,798 29 $426,520 462 $210,349 0 $0 APPLICATIONS APPROVED, NOT ACCEPTED 9 $178,122 195 $209,804 537 $196,805 55 $140,201 3 $229,667 86 $212,185 2 $140,000 APPLICATIONS DENIED 1 $258,220 402 $190,987 1,157 $204,625 180 $119,799 9 $286,784 186 $221,784 0 $0 APPLICATIONS WITHDRAWN 8 $233,984 193 $204,310 739 $196,840 75 $150,214 9 $215,863 83 $211,729 0 $0 FILES CLOSED FOR INCOMPLETENESS 0 $0 54 $198,397 250 $195,991 15 $131,169 0 $0 31 $203,625 0 $0
Aggregated Statistics For Year 2003(Based on 7 full and 10 partial tracts) A) FHA, FSA/RHS & VA B) Conventional C) Refinancings D) Home Improvement Loans E) Loans on Dwellings For 5+ Families F) Non-occupant Loans on Number Average Value Number Average Value Number Average Value Number Average Value Number Average Value Number Average Value
LOANS ORIGINATED 68 $210,987 791 $154,719 2,207 $154,759 48 $46,469 26 $279,518 386 $163,749 APPLICATIONS APPROVED, NOT ACCEPTED 15 $166,534 206 $168,212 481 $158,200 13 $83,210 1 $133,760 111 $176,618 APPLICATIONS DENIED 18 $236,084 330 $167,873 1,168 $162,026 87 $42,156 6 $370,005 181 $177,862 APPLICATIONS WITHDRAWN 19 $218,494 112 $169,104 678 $158,331 22 $77,378 2 $275,310 68 $176,152 FILES CLOSED FOR INCOMPLETENESS 4 $153,762 34 $188,845 125 $155,601 5 $62,802 0 $0 20 $175,464
Aggregated Statistics For Year 2002(Based on 7 full and 10 partial tracts) A) FHA, FSA/RHS & VA B) Conventional C) Refinancings D) Home Improvement Loans E) Loans on Dwellings For 5+ Families F) Non-occupant Loans on Number Average Value Number Average Value Number Average Value Number Average Value Number Average Value Number Average Value
LOANS ORIGINATED 111 $187,601 509 $143,124 1,191 $136,597 39 $30,617 13 $218,568 203 $137,147 APPLICATIONS APPROVED, NOT ACCEPTED 21 $177,289 87 $144,727 267 $138,952 10 $28,072 0 $0 46 $147,417 APPLICATIONS DENIED 34 $172,585 259 $143,130 807 $141,417 102 $24,426 11 $222,565 102 $135,857 APPLICATIONS WITHDRAWN 18 $193,626 104 $130,577 491 $147,071 24 $37,989 5 $242,666 36 $137,493 FILES CLOSED FOR INCOMPLETENESS 1 $140,000 67 $126,730 165 $132,963 2 $9,970 2 $146,000 24 $134,746
Aggregated Statistics For Year 2001(Based on 7 full and 10 partial tracts) A) FHA, FSA/RHS & VA B) Conventional C) Refinancings D) Home Improvement Loans E) Loans on Dwellings For 5+ Families F) Non-occupant Loans on Number Average Value Number Average Value Number Average Value Number Average Value Number Average Value Number Average Value
LOANS ORIGINATED 211 $154,793 300 $125,195 898 $129,785 52 $32,126 15 $202,344 168 $125,925 APPLICATIONS APPROVED, NOT ACCEPTED 20 $154,519 68 $139,444 196 $125,214 10 $47,129 1 $147,800 37 $129,849 APPLICATIONS DENIED 38 $181,050 167 $131,611 989 $125,457 162 $29,071 13 $255,209 92 $137,524 APPLICATIONS WITHDRAWN 52 $155,240 80 $131,241 511 $125,060 47 $41,008 3 $179,643 38 $126,744 FILES CLOSED FOR INCOMPLETENESS 14 $196,289 23 $126,329 191 $138,359 7 $39,340 2 $210,170 24 $125,147
Aggregated Statistics For Year 2000(Based on 7 full and 10 partial tracts) A) FHA, FSA/RHS & VA B) Conventional C) Refinancings D) Home Improvement Loans E) Loans on Dwellings For 5+ Families F) Non-occupant Loans on Number Average Value Number Average Value Number Average Value Number Average Value Number Average Value Number Average Value
LOANS ORIGINATED 299 $150,647 253 $112,799 458 $112,585 58 $23,752 12 $263,991 129 $106,553 APPLICATIONS APPROVED, NOT ACCEPTED 43 $149,825 90 $124,455 152 $111,450 38 $27,985 0 $0 44 $116,729 APPLICATIONS DENIED 65 $171,512 225 $130,311 717 $106,433 175 $25,671 8 $229,232 117 $120,890 APPLICATIONS WITHDRAWN 53 $154,668 97 $112,196 274 $101,682 27 $31,392 2 $446,190 39 $132,796 FILES CLOSED FOR INCOMPLETENESS 22 $160,156 26 $121,073 172 $122,818 5 $32,000 0 $0 33 $120,583
Aggregated Statistics For Year 1999(Based on 3 full and 7 partial tracts) A) FHA, FSA/RHS & VA B) Conventional C) Refinancings D) Home Improvement Loans E) Loans on Dwellings For 5+ Families F) Non-occupant Loans on Number Average Value Number Average Value Number Average Value Number Average Value Number Average Value Number Average Value
LOANS ORIGINATED 124 $142,347 128 $241,382 381 $107,199 71 $16,577 10 $167,087 97 $106,226 APPLICATIONS APPROVED, NOT ACCEPTED 12 $163,993 24 $111,755 122 $106,206 29 $16,508 2 $112,705 14 $122,664 APPLICATIONS DENIED 31 $159,165 82 $115,338 374 $108,879 54 $20,768 3 $266,770 49 $112,153 APPLICATIONS WITHDRAWN 19 $145,859 42 $112,971 153 $112,345 4 $41,672 6 $140,605 20 $117,920 FILES CLOSED FOR INCOMPLETENESS 11 $144,364 6 $100,212 117 $106,437 2 $47,150 0 $0 16 $111,795
Private Mortgage Insurance Companies Aggregated Statistics For Year 2009(Based on 7 full and 8 partial tracts) A) Conventional B) Refinancings Number Average Value Number Average Value
LOANS ORIGINATED 22 $205,385 0 $0 APPLICATIONS APPROVED, NOT ACCEPTED 17 $273,681 2 $186,440 APPLICATIONS DENIED 14 $191,439 4 $206,482 APPLICATIONS WITHDRAWN 0 $0 0 $0 FILES CLOSED FOR INCOMPLETENESS 3 $216,563 0 $0
Aggregated Statistics For Year 2008(Based on 7 full and 10 partial tracts) A) Conventional B) Refinancings C) Non-occupant Loans on Number Average Value Number Average Value Number Average Value
LOANS ORIGINATED 55 $309,653 15 $430,366 0 $0 APPLICATIONS APPROVED, NOT ACCEPTED 27 $356,137 22 $432,492 1 $709,600 APPLICATIONS DENIED 12 $325,434 3 $309,347 2 $204,000 APPLICATIONS WITHDRAWN 2 $313,500 6 $477,330 0 $0 FILES CLOSED FOR INCOMPLETENESS 1 $332,000 1 $269,550 2 $300,775
Aggregated Statistics For Year 2007(Based on 7 full and 10 partial tracts) A) Conventional B) Refinancings C) Non-occupant Loans on Number Average Value Number Average Value Number Average Value
LOANS ORIGINATED 31 $411,705 28 $449,132 5 $336,358 APPLICATIONS APPROVED, NOT ACCEPTED 6 $417,483 11 $454,376 0 $0 APPLICATIONS DENIED 7 $447,801 5 $528,694 1 $324,330 APPLICATIONS WITHDRAWN 1 $131,080 7 $411,031 2 $401,000 FILES CLOSED FOR INCOMPLETENESS 1 $387,790 0 $0 0 $0
Aggregated Statistics For Year 2006(Based on 7 full and 8 partial tracts) A) Conventional B) Refinancings C) Non-occupant Loans on Number Average Value Number Average Value Number Average Value
LOANS ORIGINATED 11 $431,073 16 $446,259 3 $271,240 APPLICATIONS APPROVED, NOT ACCEPTED 3 $356,833 17 $409,392 0 $0 APPLICATIONS DENIED 1 $174,160 2 $443,500 0 $0 APPLICATIONS WITHDRAWN 0 $0 8 $409,892 0 $0 FILES CLOSED FOR INCOMPLETENESS 0 $0 0 $0 0 $0
Aggregated Statistics For Year 2005(Based on 7 full and 10 partial tracts) A) Conventional B) Refinancings C) Non-occupant Loans on Number Average Value Number Average Value Number Average Value
LOANS ORIGINATED 24 $331,529 14 $351,686 8 $323,755 APPLICATIONS APPROVED, NOT ACCEPTED 13 $244,910 7 $356,356 5 $215,512 APPLICATIONS DENIED 1 $240,770 4 $322,588 2 $274,175 APPLICATIONS WITHDRAWN 3 $213,087 4 $270,078 1 $163,860 FILES CLOSED FOR INCOMPLETENESS 0 $0 0 $0 0 $0
Aggregated Statistics For Year 2004(Based on 7 full and 10 partial tracts) A) Conventional B) Refinancings C) Non-occupant Loans on Number Average Value Number Average Value Number Average Value
LOANS ORIGINATED 77 $252,743 23 $248,512 9 $173,232 APPLICATIONS APPROVED, NOT ACCEPTED 25 $257,226 14 $220,250 5 $298,296 APPLICATIONS DENIED 2 $300,045 2 $329,000 0 $0 APPLICATIONS WITHDRAWN 6 $280,680 7 $201,714 1 $375,510 FILES CLOSED FOR INCOMPLETENESS 2 $155,265 0 $0 0 $0
Aggregated Statistics For Year 2003(Based on 7 full and 10 partial tracts) A) Conventional B) Refinancings C) Non-occupant Loans on Number Average Value Number Average Value Number Average Value
LOANS ORIGINATED 152 $203,758 51 $185,397 11 $181,889 APPLICATIONS APPROVED, NOT ACCEPTED 28 $187,030 21 $176,807 7 $177,010 APPLICATIONS DENIED 3 $260,000 1 $115,080 0 $0 APPLICATIONS WITHDRAWN 12 $226,746 1 $115,470 4 $254,758 FILES CLOSED FOR INCOMPLETENESS 2 $222,000 0 $0 0 $0
Aggregated Statistics For Year 2002(Based on 7 full and 10 partial tracts) A) Conventional B) Refinancings C) Non-occupant Loans on Number Average Value Number Average Value Number Average Value
LOANS ORIGINATED 170 $172,969 61 $155,915 9 $194,966 APPLICATIONS APPROVED, NOT ACCEPTED 35 $175,302 29 $159,020 0 $0 APPLICATIONS DENIED 7 $171,893 6 $168,647 3 $187,303 APPLICATIONS WITHDRAWN 10 $164,567 7 $150,897 0 $0 FILES CLOSED FOR INCOMPLETENESS 0 $0 0 $0 0 $0
Aggregated Statistics For Year 2001(Based on 7 full and 10 partial tracts) A) Conventional B) Refinancings C) Non-occupant Loans on Number Average Value Number Average Value Number Average Value
LOANS ORIGINATED 127 $147,729 80 $144,460 15 $130,958 APPLICATIONS APPROVED, NOT ACCEPTED 27 $135,494 18 $142,418 5 $142,876 APPLICATIONS DENIED 13 $153,898 7 $175,071 8 $133,386 APPLICATIONS WITHDRAWN 2 $181,700 4 $162,735 1 $158,350 FILES CLOSED FOR INCOMPLETENESS 0 $0 4 $135,232 0 $0
Aggregated Statistics For Year 2000(Based on 7 full and 10 partial tracts) A) Conventional B) Refinancings C) Non-occupant Loans on Number Average Value Number Average Value Number Average Value
LOANS ORIGINATED 85 $132,922 53 $129,214 19 $122,932 APPLICATIONS APPROVED, NOT ACCEPTED 6 $105,787 14 $136,954 0 $0 APPLICATIONS DENIED 10 $152,775 3 $128,140 2 $195,165 APPLICATIONS WITHDRAWN 3 $149,633 2 $143,475 0 $0 FILES CLOSED FOR INCOMPLETENESS 5 $91,678 2 $136,000 0 $0
Aggregated Statistics For Year 1999(Based on 3 full and 7 partial tracts) A) Conventional B) Refinancings C) Non-occupant Loans on Number Average Value Number Average Value Number Average Value
LOANS ORIGINATED 29 $126,008 31 $131,075 2 $109,210 APPLICATIONS APPROVED, NOT ACCEPTED 2 $167,480 7 $118,189 0 $0 APPLICATIONS DENIED 6 $128,042 3 $158,147 2 $100,625 APPLICATIONS WITHDRAWN 1 $100,000 1 $171,630 0 $0 FILES CLOSED FOR INCOMPLETENESS 0 $0 0 $0 0 $0
2005 - 2018 National Fire Incident Reporting System (NFIRS) incidents See full 2006 National Fire Incident Reporting System statistics for zip code 90062, California
Most common first names in zip code 90062 among deceased individuals Name Count Lived (average)
John 133 73.6 years Mary 126 75.7 years Willie 122 72.5 years James 120 71.3 years William 117 72.8 years Robert 104 68.1 years George 81 75.2 years Charles 76 71.0 years Henry 50 70.7 years Frank 49 72.4 years
Most common last names in zip code 90062 among deceased individuals Last name Count Lived (average)
Williams 158 71.3 years Johnson 125 70.4 years Jones 116 70.8 years Smith 99 71.9 years Brown 91 71.8 years Jackson 78 69.0 years Thomas 60 72.0 years Davis 60 71.8 years Moore 51 73.6 years Taylor 40 68.0 years
Businesses in zip code 90062
Name Count Name Count
AutoZone 1 Popeyes 1 H&R Block 1 Subway 1 KFC 1 Taco Bell 1 Kroger 1 True Value 1 McDonald's 1 U-Haul 1


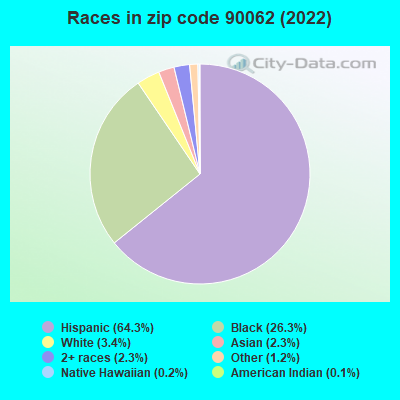


 Nearest zip codes: 90037, 90018, 90089, 90043, 90007, 90008.
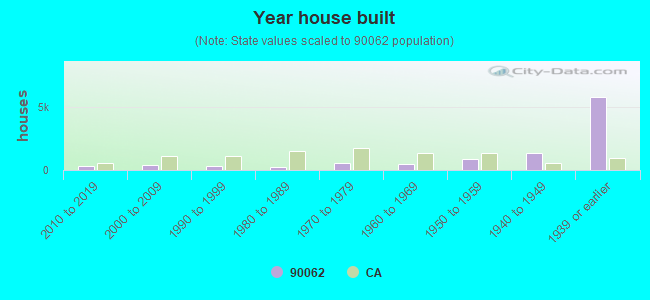

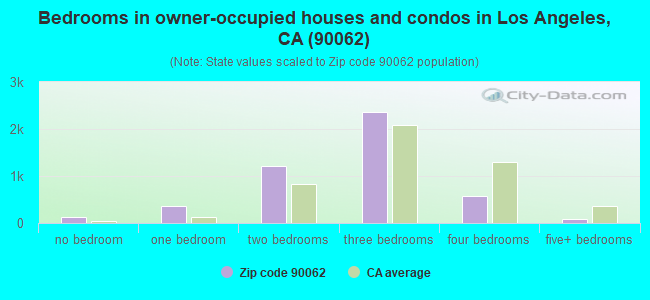
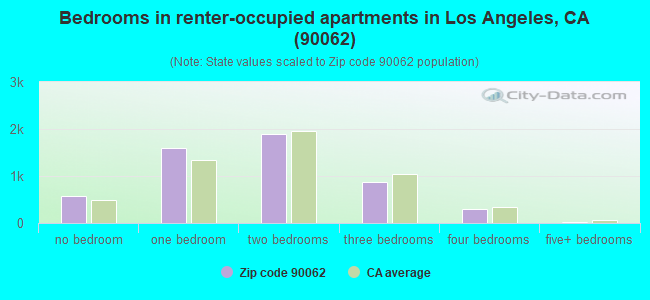
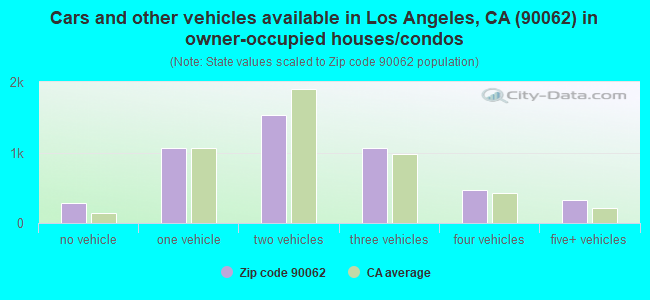
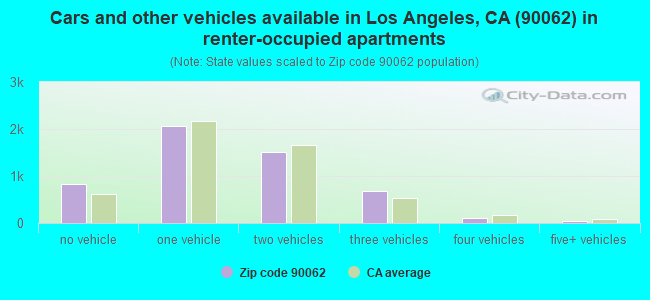


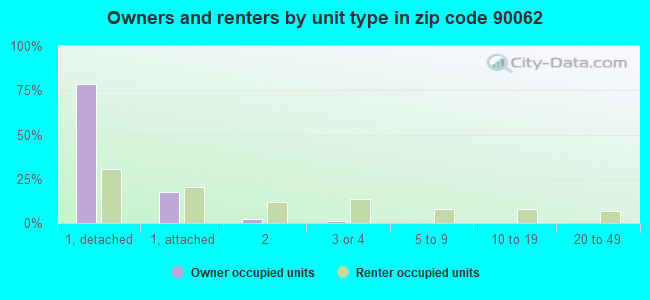
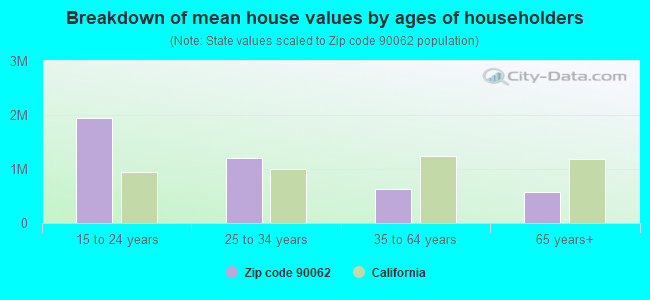


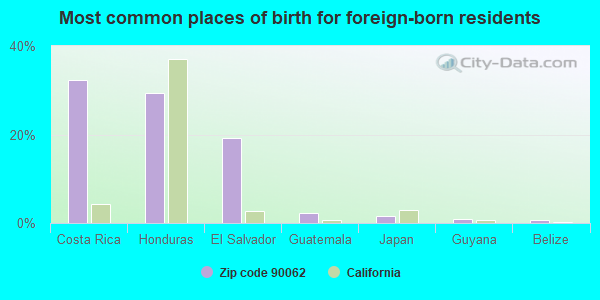
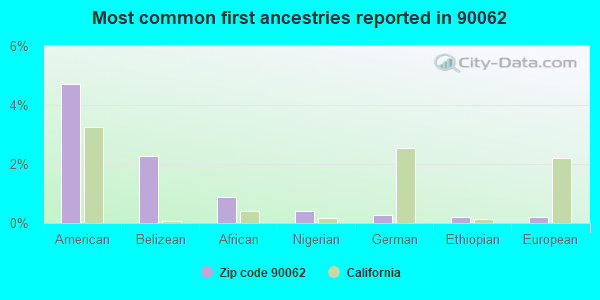
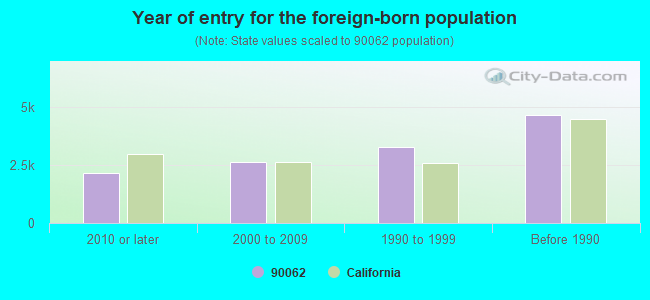
 . Federal Facility
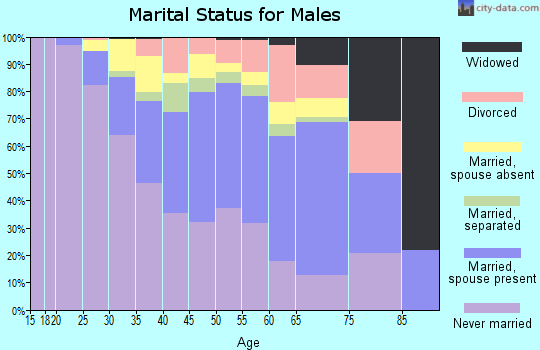

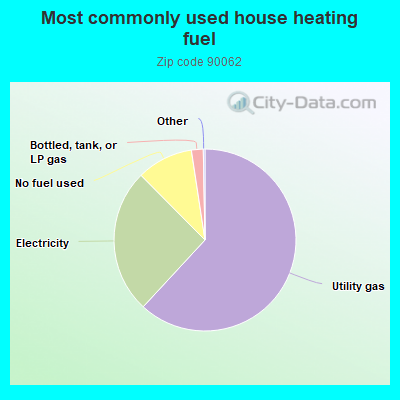
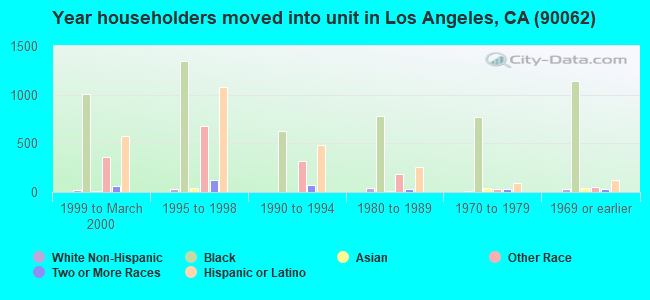
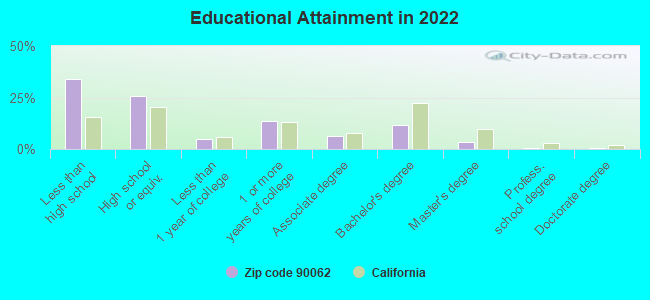
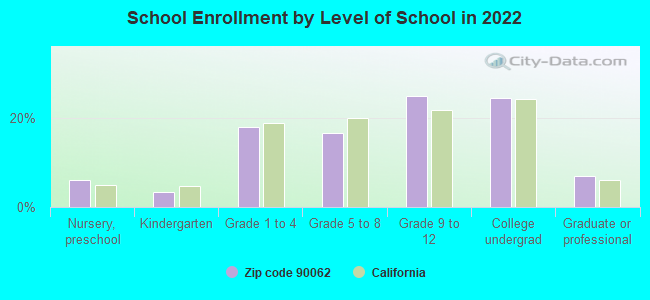
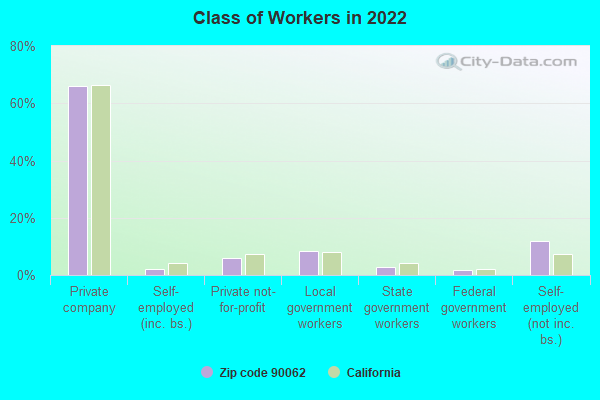
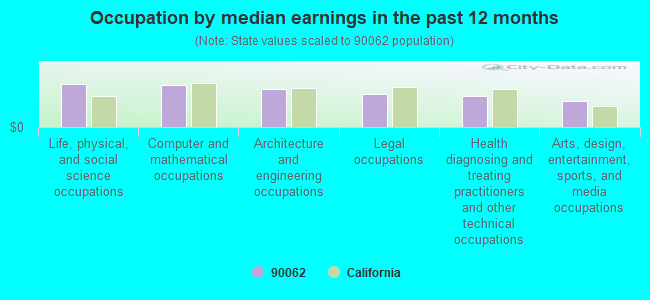
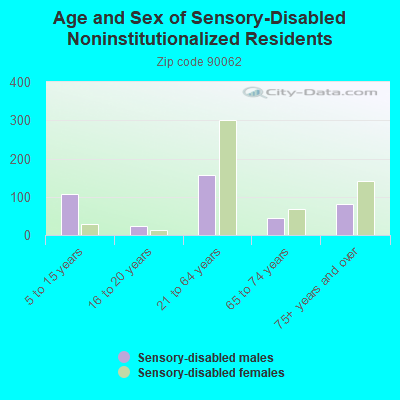
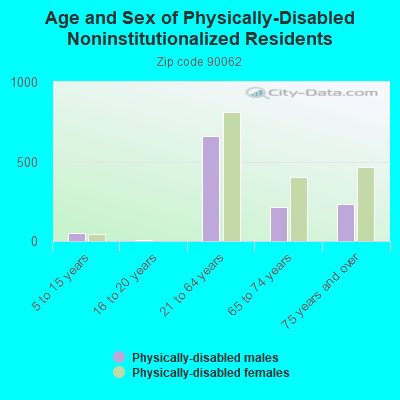
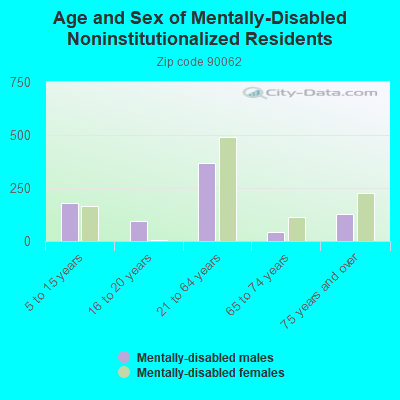
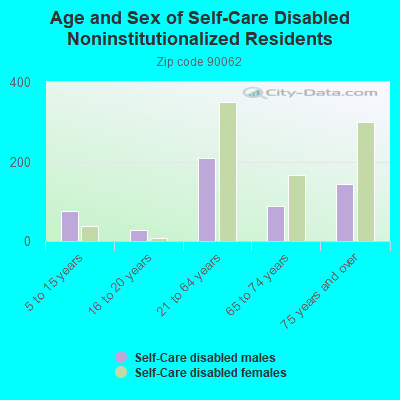
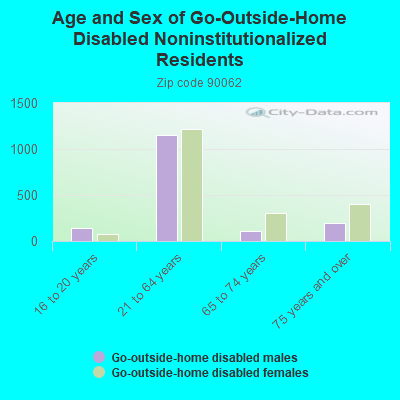
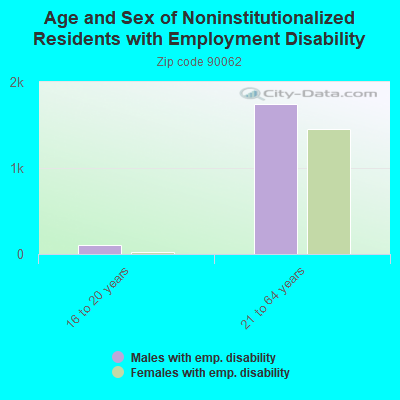
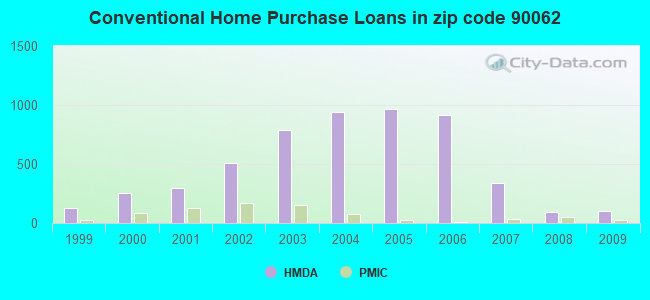
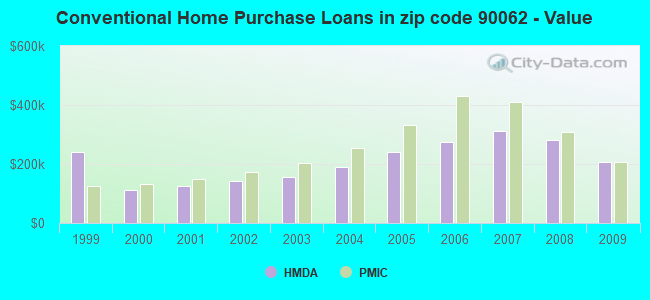
 Based on the data from the years 2005 - 2018 the average number of fire incidents per year is 70. The highest number of fire incidents - 133 took place in 2006, and the least - 38 in 2016. The data has a dropping trend.
 When looking into fire subcategories, the most reports belonged to: Structure Fires (48.2%), and Outside Fires (24.0%).