Estimated zip code population in 2022: 68,490 Zip code population in 2010: 62,276 Zip code population in 2000: 56,691
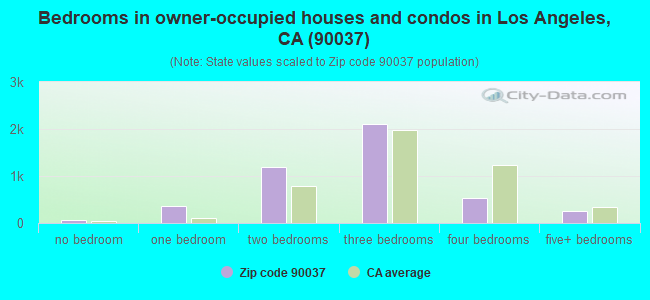
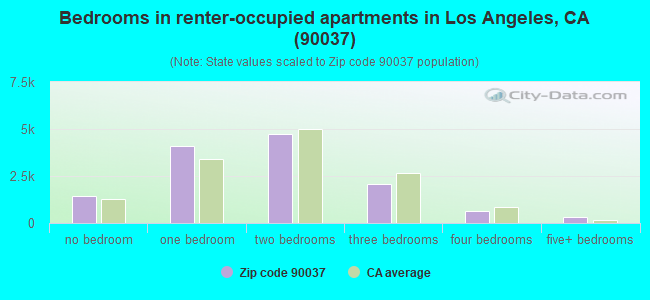
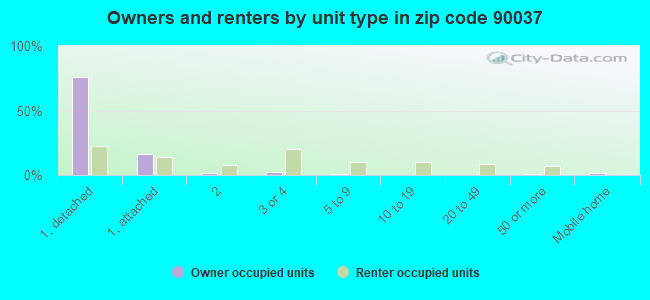
Houses and condos: 18,810 Renter-occupied apartments: 13,325
% of renters here:
75%
State:
44%
March 2022 cost of living index in zip code 90037: 139.3 (high, U.S. average is 100)
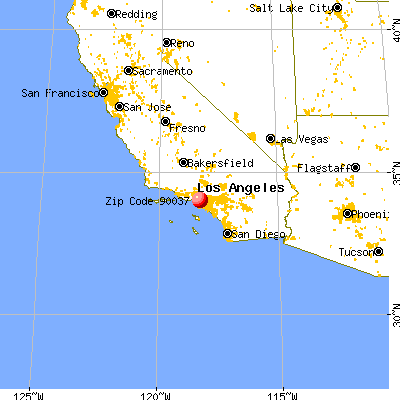
Land area: 2.8 sq. mi. Water area: 0.0 sq. mi.
Population density: 24,131 people per square mile
(very high).
OSM Map
General Map
Google Map
MSN Map
OSM Map
General Map
Google Map
MSN Map
OSM Map
General Map
Google Map
MSN Map
OSM Map
General Map
Google Map
MSN Map
Please wait while loading the map...
Real estate property taxes paid for housing units in 2022:
This zip code:
0.6% ($4,060)
California:
0.7% ($4,831)
Median real estate property taxes paid for housing units with mortgages in 2022: $4,369 (0.7%) Median real estate property taxes paid for housing units with no mortgage in 2022: $3,235 (0.5%)
Averages for the 2020 tax year for zip code 90037, filed in 2021:
Average Adjusted Gross Income (AGI) in 2020: $31,674 (Individual Income Tax Returns)
Here:
$31,674
State:
$95,910
Salary/wage: $31,857 (reported on 80.7% of returns)
Here:
$31,857
State:
$77,331
(% of AGI for various income ranges: 1263.6% for AGIs below $25k, 3988.0% for AGIs $25k-50k, 7609.8% for AGIs $50k-75k, 11588.2% for AGIs $75k-100k, 18182.8% for AGIs $100k-200k)
Taxable interest for individuals: $204 (reported on 11.3% of returns)
This zip code:
$204
California:
$2,294
(% of AGI for various income ranges: 1.8% for AGIs below $25k, 2.6% for AGIs $25k-50k, 4.7% for AGIs $50k-75k, 12.6% for AGIs $75k-100k, 25.3% for AGIs $100k-200k)
Ordinary dividends: $500 (reported on 1.8% of returns)
Here:
$500
State:
$10,949
(% of AGI for various income ranges: 0.4% for AGIs below $25k, 1.0% for AGIs $25k-50k, 1.5% for AGIs $50k-75k, 3.2% for AGIs $75k-100k, 24.7% for AGIs $100k-200k)
Net capital gain/loss in AGI: +$4,529 (reported on 2.9% of returns)
Here:
+$4,529
State:
+$49,306
(% of AGI for various income ranges: 0.7% for AGIs $25k-50k, 9.5% for AGIs $50k-75k, 34.5% for AGIs $75k-100k, 329.4% for AGIs $100k-200k)
Profit/loss from business: +$6,682 (reported on 24.8% of returns)
Here:
+$6,682
State:
+$15,671
(% of AGI for various income ranges: 346.8% for AGIs below $25k, 133.5% for AGIs $25k-50k, 130.6% for AGIs $50k-75k, 271.8% for AGIs $75k-100k, 431.1% for AGIs $100k-200k)
Taxable individual retirement arrangement distribution: $8,186 (reported on 0.5% of returns)
90037:
$8,186
California:
$23,505
(% of AGI for various income ranges: 2.3% for AGIs below $25k, 2.1% for AGIs $25k-50k, 22.6% for AGIs $50k-75k, 55.2% for AGIs $75k-100k)
Total itemized deductions: $25,487 (reported on 4.8% of returns)
Here:
$25,487
State:
$39,517
(% of AGI for various income ranges: 29.7% for AGIs below $25k, 120.7% for AGIs $25k-50k, 391.0% for AGIs $50k-75k, 867.3% for AGIs $75k-100k, 1879.7% for AGIs $100k-200k)
Charity contributions: $5,515 (reported on 3.5% of returns)
Here:
$5,515
State:
$12,598
(% of AGI for various income ranges: 2.6% for AGIs below $25k, 15.4% for AGIs $25k-50k, 76.5% for AGIs $50k-75k, 151.8% for AGIs $75k-100k, 330.6% for AGIs $100k-200k)
Taxes paid: $7,177 (reported on 4.8% of returns)
90037:
$7,177
State:
$8,807
(% of AGI for various income ranges: 8.0% for AGIs below $25k, 30.4% for AGIs $25k-50k, 110.7% for AGIs $50k-75k, 266.5% for AGIs $75k-100k, 598.9% for AGIs $100k-200k)
Earned income credit: $2,438 (reported on 29.4% of returns)
Here:
$2,438
State:
$2,074
(% of AGI for various income ranges: 155.2% for AGIs below $25k, 92.2% for AGIs $25k-50k, 1.4% for AGIs $50k-75k)
Percentage of individuals using paid preparers for their 2020 taxes: 88.2%
Here:
88%
State:
92%
(% for various income ranges: 85.4% for AGIs below $25k, 90.2% for AGIs $25k-50k, 91.2% for AGIs $50k-75k, 91.8% for AGIs $75k-100k, 95.1% for AGIs $100k-200k, 100.0% for AGIs over 200k)
Averages for the 2012 tax year for zip code 90037, filed in 2013:
Average Adjusted Gross Income (AGI) in 2012: $23,557 (Individual Income Tax Returns)
Here:
$23,557
State:
$72,726
Salary/wage: $24,272 (reported on 81.9% of returns)
Here:
$24,272
State:
$59,079
(% of AGI for various income ranges: 76.2% for AGIs below $25k, 92.2% for AGIs $25k-50k, 88.8% for AGIs $50k-75k, 86.2% for AGIs $75k-100k, 72.0% for AGIs $100k-200k)
Taxable interest for individuals: $139 (reported on 10.5% of returns)
This zip code:
$139
California:
$2,146
(% of AGI for various income ranges: 0.1% for AGIs $75k-100k)
Ordinary dividends: $667 (reported on 1.2% of returns)
Here:
$667
State:
$9,308
(% of AGI for various income ranges: )
Net capital gain/loss in AGI: +$74 (reported on 1.0% of returns)
Here:
+$74
State:
+$30,460
(% of AGI for various income ranges: 0.3% for AGIs $75k-100k)
Profit/loss from business: +$8,881 (reported on 23.7% of returns)
Here:
+$8,881
State:
+$17,064
(% of AGI for various income ranges: 19.6% for AGIs below $25k, 3.1% for AGIs $25k-50k, 1.3% for AGIs $50k-75k, 0.4% for AGIs $75k-100k, 2.5% for AGIs $100k-200k)
Taxable individual retirement arrangement distribution: $8,545 (reported on 0.9% of returns)
90037:
$8,545
California:
$19,557
(% of AGI for various income ranges: 0.2% for AGIs below $25k, 0.2% for AGIs $25k-50k, 0.6% for AGIs $50k-75k, 1.3% for AGIs $75k-100k)
Total itemized deductions: $18,130 (39% of AGI, reported on 13.5% of returns)
Here:
$18,130
State:
$34,004
Here:
38.7% of AGI
State:
22.7% of AGI
(% of AGI for various income ranges: 4.4% for AGIs below $25k, 11.2% for AGIs $25k-50k, 17.3% for AGIs $50k-75k, 20.7% for AGIs $75k-100k, 18.2% for AGIs $100k-200k)
Charity contributions: $2,806 (reported on 9.5% of returns)
Here:
$2,806
State:
$4,659
(% of AGI for various income ranges: 0.3% for AGIs below $25k, 1.2% for AGIs $25k-50k, 2.1% for AGIs $50k-75k, 2.7% for AGIs $75k-100k, 2.5% for AGIs $100k-200k)
Taxes paid: $4,218 (reported on 13.4% of returns)
90037:
$4,218
State:
$14,448
(% of AGI for various income ranges: 1.0% for AGIs below $25k, 2.2% for AGIs $25k-50k, 4.1% for AGIs $50k-75k, 5.7% for AGIs $75k-100k, 6.3% for AGIs $100k-200k)
Earned income credit: $2,811 (reported on 41.5% of returns)
Here:
$2,811
State:
$2,286
(% of AGI for various income ranges: 11.1% for AGIs below $25k, 2.0% for AGIs $25k-50k)
Percentage of individuals using paid preparers for their 2012 taxes: 79.0%
Here:
79%
State:
64%
(% for various income ranges: 78.5% for AGIs below $25k, 81.0% for AGIs $25k-50k, 78.2% for AGIs $50k-75k, 75.0% for AGIs $75k-100k, 76.5% for AGIs $100k-200k)
Averages for the 2004 tax year for zip code 90037, filed in 2005:
Average Adjusted Gross Income (AGI) in 2004: $21,021 (Individual Income Tax Returns)
Here:
$21,021
State:
$58,600
Salary/wage: $21,437 (reported on 86.2% of returns)
Here:
$21,437
State:
$49,455
(% of AGI for various income ranges: 79.5% for AGIs below $10k, 86.0% for AGIs $10k-25k, 93.3% for AGIs $25k-50k, 89.5% for AGIs $50k-75k, 82.0% for AGIs $75k-100k, 51.2% for AGIs over 100k)
Taxable interest for individuals: $283 (reported on 14.0% of returns)
This zip code:
$283
California:
$2,365
(% of AGI for various income ranges: 0.3% for AGIs below $10k, 0.2% for AGIs $10k-25k, 0.2% for AGIs $25k-50k, 0.2% for AGIs $50k-75k, 0.3% for AGIs $75k-100k, 0.3% for AGIs over 100k)
Taxable dividends: $369 (reported on 1.5% of returns)
Here:
$369
State:
$4,746
(% of AGI for various income ranges: 0.0% for AGIs below $10k, 0.0% for AGIs $10k-25k, 0.0% for AGIs $25k-50k, 0.0% for AGIs $50k-75k, 0.0% for AGIs $75k-100k, 0.0% for AGIs over 100k)
Net capital gain/loss: +$17,959 (reported on 1.2% of returns)
Here:
+$17,959
State:
+$23,418
(% of AGI for various income ranges: 0.1% for AGIs below $10k, 0.0% for AGIs $10k-25k, 0.1% for AGIs $25k-50k, 0.8% for AGIs $50k-75k, 3.5% for AGIs $75k-100k, 31.5% for AGIs over 100k)
Profit/loss from business: +$8,009 (reported on 18.7% of returns)
Here:
+$8,009
State:
+$16,826
(% of AGI for various income ranges: 32.4% for AGIs below $10k, 10.3% for AGIs $10k-25k, 2.6% for AGIs $25k-50k, 2.1% for AGIs $50k-75k, 2.7% for AGIs $75k-100k, 1.6% for AGIs over 100k)
IRA payment deduction: $1,374 (reported on 0.6% of returns)
90037:
$1,374
California:
$3,192
Total itemized deductions: $15,996 (41% of AGI, reported on 16.1% of returns)
Here:
$15,996
State:
$28,113
Here:
41.5% of AGI
State:
25.3% of AGI
(% of AGI for various income ranges: 5.5% for AGIs below $10k, 6.6% for AGIs $10k-25k, 15.1% for AGIs $25k-50k, 20.2% for AGIs $50k-75k, 21.6% for AGIs $75k-100k, 15.5% for AGIs over 100k)
Charity contributions deductions: $2,446 (6% of AGI, reported on 12.5% of returns)
Here:
$2,446
State:
$3,923
Here:
5.9% of AGI
State:
3.3% of AGI
(% of AGI for various income ranges: 0.2% for AGIs below $10k, 0.5% for AGIs $10k-25k, 1.7% for AGIs $25k-50k, 3.0% for AGIs $50k-75k, 3.8% for AGIs $75k-100k, 3.6% for AGIs over 100k)
Total tax: $1,782 (reported on 51.3% of returns)
90037:
$1,782
State:
$10,761
(% of AGI for various income ranges: 5.3% for AGIs below $10k, 2.9% for AGIs $10k-25k, 3.8% for AGIs $25k-50k, 6.8% for AGIs $50k-75k, 8.9% for AGIs $75k-100k, 14.2% for AGIs over 100k)
Earned income credit: $2,169 (reported on 47.1% of returns)
Here:
$2,169
State:
$1,763
Percentage of individuals using paid preparers for their 2004 taxes: 80.6%
Here:
81%
State:
66%
(% for various income ranges: 76.1% for AGIs below $10k, 82.6% for AGIs $10k-25k, 81.2% for AGIs $25k-50k, 80.0% for AGIs $50k-75k, 81.6% for AGIs $75k-100k, 82.3% for AGIs over 100k)
Likely homosexual households (counted as self-reported same-sex unmarried-partner households)
Lesbian couples: 0.0% of all households
Gay men: 0.1% of all households
Household received Food Stamps/SNAP in the past 12 months: 6,727 Household did not receive Food Stamps/SNAP in the past 12 months: 12,100
Women who had a birth in the past 12 months: 1,240 (650 now married, 594 unmarried) Women who did not have a birth in the past 12 months: 16,044 (4,795 now married, 11,314 unmarried)
Housing units in zip code 90037 with a mortgage: 3,219 (214 second mortgage, 40 home equity loan, 77 both second mortgage and home equity loan) Houses without a mortgage: 78
Median monthly owner costs for units with a mortgage: $2,447 Median monthly owner costs for units without a mortgage: $739
Residents with income below the poverty level in 2022:
This zip code:
26.8%
Whole state:
12.2%
Residents with income below 50% of the poverty level in 2022:
This zip code:
13.1%
Whole state:
6.2%
Median number of rooms in houses and condos:
Here:
5.5
State:
6.0
Median number of rooms in apartments:
Here:
3.9
State:
3.9
Notable locations in this zip code not listed on our city pages
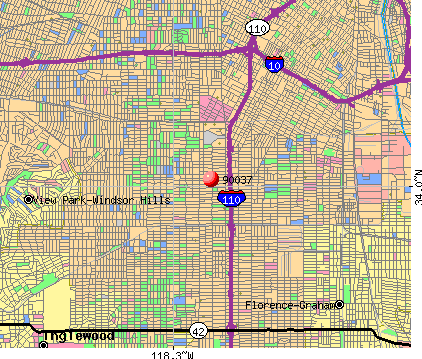
Notable locations in zip code 90037: Los Angeles Memorial Coliseum (A), Vermont Square Branch Los Angeles Public Library (B), Junipero Serra Branch Los Angeles Public Library (C), Museum of Science and Industry (D), Los Angeles Sports Arena (E), Sports Arena (F), City of Los Angeles Fire Department Station 46 (G). Display/hide their locations on the map
Churches in zip code 90037 include: Saint Cecilias Catholic Church (A), American Hungarian Baptist Church (B), Atherton Baptist Church (C), Carver Baptist Church (D), Church of the Good Shepherd (E), Church of the Living God (F), Church of the Nativity (G), Elim Assembly of God Church (H), Figueroa Church of Christ (I). Display/hide their locations on the map
Parks in zip code 90037 include: Wilson Field (1), Exposition Park (2), Vermont Square (3), Fortyeighth Street Park (4), Theresa Lindsay Park (5), Los Angeles Swim Stadium (6), Thirty-Eighth and Normandie Park (7). Display/hide their locations on the map
Tourist attraction (not listed on the city page) : California Science Center (Museums; 700 State Drive).
6,112 married couples with children.
7,391 single-parent households (2,656 men, 4,735 women).
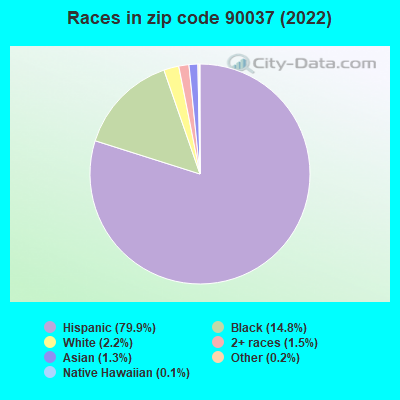
23.0% of residents of 90037 zip code speak English at home.
74.4% of residents speak Spanish at home (47% very well, 17% well, 21% not well, 15% not at all).
0.8% of residents speak other Indo-European language at home (62% very well, 35% well, 3% not well).
1.1% of residents speak Asian or Pacific Island language at home (24% very well, 15% well, 20% not well, 42% not at all).
0.7% of residents speak other language at home (57% very well, 27% well, 4% not well, 13% not at all).
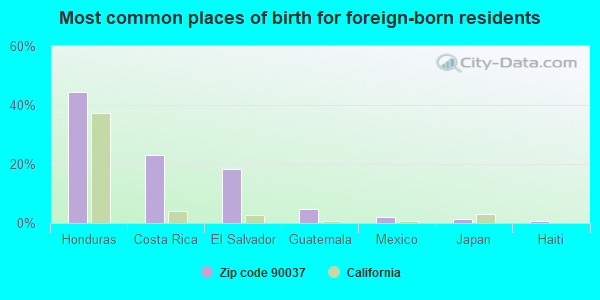
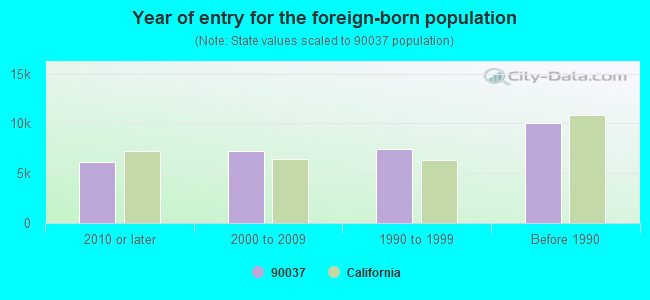
Foreign born population: 30,126 (44.0%) (32.1% of them are naturalized citizens)
Major facilities with environmental interests located in this zip code:
MANUAL ARTS NEW P C NO 2 (1017 W 47TH ST in LOS ANGELES, CA)
STATE MASTER (California - Hazardous Waste Tracking) - HAZARDOU WASTE PROGRAM Large Quantity Generators, more that 1000 kg of hazardous waste/month (Resource Conservation and Recovery Act (tracking hazardous waste)) - notification Organizations: LAUSD (CONTACT/OPERATOR)
ACCELERATED CHARTER SCHOOL (116 MARTIN LUTHER KING JR BLVD in LOS ANGELES, CA)
STATE MASTER (California - Hazardous Waste Tracking) - HAZARDOU WASTE PROGRAM Large Quantity Generators, more that 1000 kg of hazardous waste/month (Resource Conservation and Recovery Act (tracking hazardous waste)) - notification Organizations: L A UNIFIED SCHOOL DISTRICT (CONTACT/OWNER)
GUILD PRINTING COMP INC (3801 S GRAND AVE in LOS ANGELES, CA)
STATE MASTER (California - Hazardous Waste Tracking) - HAZARDOU WASTE PROGRAM CRITERIA AND HAZARDOUS AIR POLLUTANT INVENTORY (Inventory of air pollution sources) Small Quantity Generators, between 100 kg and 1000 kg of hazardous waste/month (Resource Conservation and Recovery Act (tracking hazardous waste)) - notification Business SIC classification: COMMERCIAL PRINTING Business NAICS classification: COMMERCIAL LITHOGRAPHIC PRINTING. Organizations: BABICK RONALD D (CONTACT/OWNER)
LA SOUTHEAST MAINTENANCE YARD (4206 SOUTH MAIN ST in LOS ANGELES, CA)
STATE MASTER (California - Hazardous Waste Tracking) - HAZARDOU WASTE PROGRAM Small Quantity Generators, between 100 kg and 1000 kg of hazardous waste/month (Resource Conservation and Recovery Act (tracking hazardous waste)) - notification Organizations: CITY OF LOS ANGELES (CONTACT/OWNER)
LA USD MANUAL ARTS HS (4131 S VERMONT AVE in LOS ANGELES, CA)
STATE MASTER (California - Hazardous Waste Tracking) - HAZARDOU WASTE PROGRAM Small Quantity Generators, between 100 kg and 1000 kg of hazardous waste/month (Resource Conservation and Recovery Act (tracking hazardous waste)) - notification Alternative names: MANUAL ARTS SENIOR HIGH
LAUSD 52ND STREET CC (901 W 52ND ST in LOS ANGELES, CA)
STATE MASTER (California - Hazardous Waste Tracking) - HAZARDOU WASTE PROGRAM Small Quantity Generators, between 100 kg and 1000 kg of hazardous waste/month (Resource Conservation and Recovery Act (tracking hazardous waste)) - notification Alternative names: LAUSD/ 52ND ST ELEM
LAUSD MENLO ELEM SCHOOL (1456 MENLO AVE in LOS ANGELES, CA)
STATE MASTER (California - Hazardous Waste Tracking) - HAZARDOU WASTE PROGRAM Small Quantity Generators, between 100 kg and 1000 kg of hazardous waste/month (Resource Conservation and Recovery Act (tracking hazardous waste)) - notification
LAUSD WEST VERNON ELEM SCHOOL (4312 S GRAND AVE in LOS ANGELES, CA)
STATE MASTER (California - Hazardous Waste Tracking) - HAZARDOU WASTE PROGRAM Small Quantity Generators, between 100 kg and 1000 kg of hazardous waste/month (Resource Conservation and Recovery Act (tracking hazardous waste)) - notification Alternative names: LAUSD/ WEST VERNON AVE ELEM, WEST VERNON AVENUE ELEMENTARY
ACE PARTS INC (5001 S BROADWAY in LOS ANGELES, CA)
STATE MASTER (California - Hazardous Waste Tracking) - HAZARDOU WASTE PROGRAM Small Quantity Generators, between 100 kg and 1000 kg of hazardous waste/month (Resource Conservation and Recovery Act (tracking hazardous waste)) - notification
CHEVRON STATION NO 207669 (4000 S FIGUEROA BLVD in LOS ANGELES, CA)
STATE MASTER (California - Hazardous Waste Tracking) - HAZARDOU WASTE PROGRAM Small Quantity Generators, between 100 kg and 1000 kg of hazardous waste/month (Resource Conservation and Recovery Act (tracking hazardous waste)) - notification Organizations: CHEVRON PRODUCTS CO (CONTACT/OWNER)
FIFTY-SECOND STREET ELEMENTARY (816 W. 51ST ST. in LOS ANGELES, CA)
(National Center for Education Statistics) - STATE ID-6017065 Organizations: LOS ANGELES UNIFIED (SCHOOL DISTRICT)
MENLO AVENUE ELEMENTARY (4156 MENLO AVE. in LOS ANGELES, CA)
(National Center for Education Statistics) - STATE ID-6018139 Organizations: LOS ANGELES UNIFIED (SCHOOL DISTRICT)
NORMANDIE AVENUE ELEMENTARY (4505 S. RAYMOND AVE. in LOS ANGELES, CA)
(National Center for Education Statistics) - STATE ID-6018410 Organizations: LOS ANGELES UNIFIED (SCHOOL DISTRICT)
Housing units lacking complete plumbing facilities: 1.4% Housing units lacking complete kitchen facilities: 3.5%
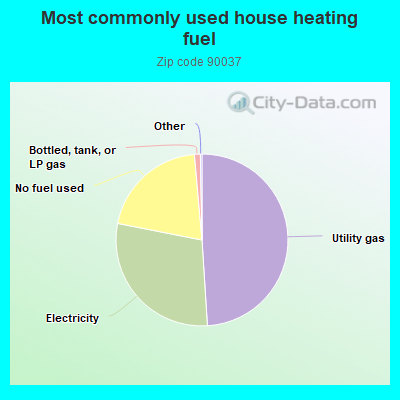
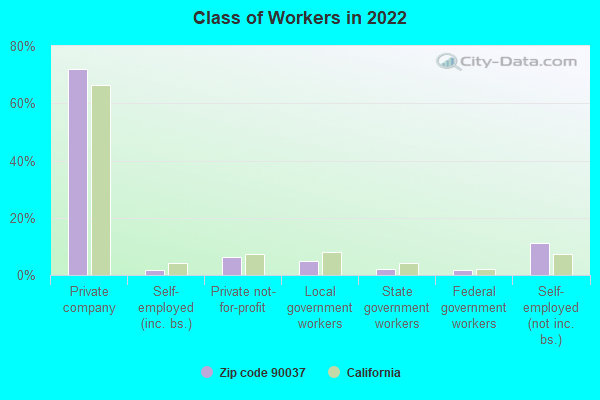
49.0%Utility gas
29.1%Electricity
20.5%No fuel used
1.1%Bottled, tank, or LP gas
Population in 1990: 56,922.
Place of birth for U.S.-born residents:
This state: 34,944
Northeast: 345
Midwest: 517
South: 1,758
West: 295
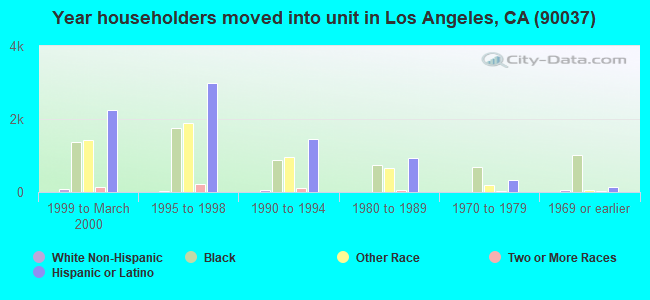
55% of the 90037 zip code residents lived in the same house 5 years ago. Out of people who lived in different houses, 95% lived in this county. Out of people who lived in different counties, 50% lived in California.
93% of the 90037 zip code residents lived in the same house 1 year ago. Out of people who lived in different houses, 74% moved from this county. Out of people who lived in different houses, 12% moved from different county within same state. Out of people who lived in different houses, 4% moved from different state. Out of people who lived in different houses, 11% moved from abroad.
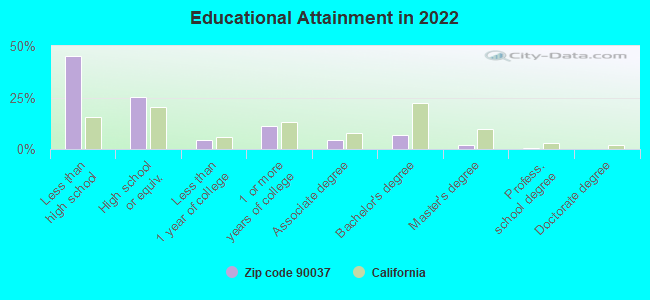
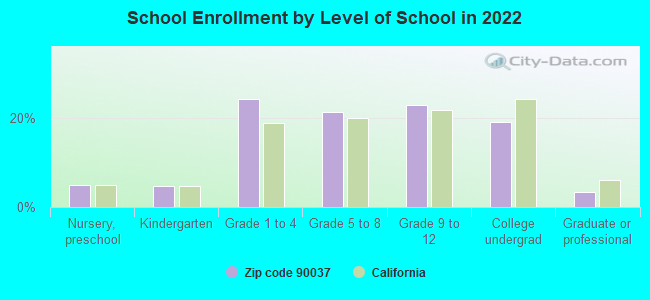
Private vs. public school enrollment:
Students in private schools in grades 1 to 8 (elementary and middle school): 290
Here:
3.5%
California:
10.5%
Students in private schools in grades 9 to 12 (high school): 92
Here:
2.2%
California:
8.5%
Students in private undergraduate colleges: 287
Here:
8.3%
California:
15.9%
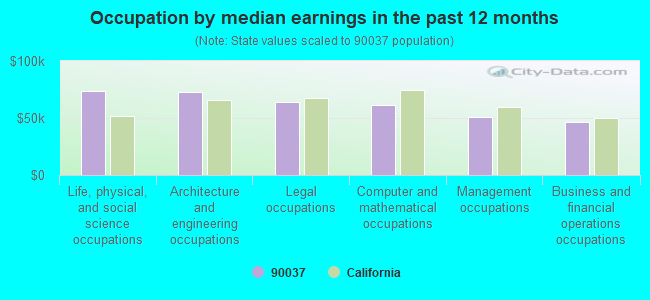
Occupation by median earnings in the past 12 months ($)
73,379Life, physical, and social science occupations
73,226Architecture and engineering occupations
64,084Legal occupations
61,015Computer and mathematical occupations
51,295Management occupations
46,244Business and financial operations occupations
Companies with federal contracts located in this zip code:
INTERNATIONAL RESOURCE RECOVER (3982 SOUTH FIGUEROA STREET in LOS ANGELES, CA; small business) : $9,439,616 in 83 contractsfrom 2001 to 2006
Contracts for Trash/Garbage Collection Services - Including Portable Sanitation Services, Air Passenger Service, Maintenance, Repair or Alteration of Real Property -- Family Housing Facilities by Army, Navy Signed by year:2000: $0; 2001: $1,165,236; 2002: $2,001,814; 2003: $3,113,315; 2004: $2,638,064; 2005: $396,750; 2006: $124,437.
Biggest contracts:
$1,972,023 with Army for Trash/Garbage Collection Services - Including Portable Sanitation Services. Taking place in HI. Signed on 2003-04-29. Completion date: 2003-12-31.
$1,612,750, same as above.Signed on 2002-01-30. Completion date: 2003-12-31.
$1,278,625 with Navy for Trash/Garbage Collection Services - Including Portable Sanitation Services. Taking place in HI. Signed on 2004-03-03. Completion date: 2008-09-30.
$1,054,377, same as above.Signed on 2004-10-25. Completion date: 2005-09-30.
PRINTER RIBBONS PLUS INC (225 W 38TH ST in LOS ANGELES, CA; small business) : $16,532 in 3 contractsfrom 2005 to 2006
$10,485 with Navy for ADP Supplies. Signed on 2005-03-17. Completion date: 2005-03-18.
$3,990, same as above.Signed on 2005-12-19. Completion date: 2005-12-21.
$2,057 with Navy for Miscellaneous Chemical Specialties. Signed on 2006-03-18. Completion date: 2006-03-24.
TRANSCONTINENTAL SALES CO (5725 SOUTH MAIN STREET in LOS ANGELES, CA; small business) : $14,675 in 2 contractsin 2005
$8,107 with Navy for Clothing, Special Purpose. Signed on 2005-09-15. Completion date: 2005-10-14.
$6,568 with Navy for Outerwear, Men's. Signed on 2005-05-04. Completion date: 2005-06-06.
Top industries in this zip code by the number of employees in 2005:
2005 - 2018 National Fire Incident Reporting System (NFIRS) incidents
According to the data from the years 2005 - 2018 the average number of fires per year is 174. The highest number of fire incidents - 261 took place in 2006, and the least - 119 in 2010. The data has a decreasing trend.
When looking into fire subcategories, the most incidents belonged to: Structure Fires (43.4%), and Mobile Property/Vehicle Fires (26.9%).
Fire incident types reported to NFIRS in Zip Code 90037


 Nearest zip codes: 90089, 90062, 90007, 90011, 90018, 90003.


 According to the data from the years 2005 - 2018 the average number of fires per year is 174. The highest number of fire incidents - 261 took place in 2006, and the least - 119 in 2010. The data has a decreasing trend.
 When looking into fire subcategories, the most incidents belonged to: Structure Fires (43.4%), and Mobile Property/Vehicle Fires (26.9%).