Estimated zip code population in 2022: 62,904 Zip code population in 2010: 59,662 Zip code population in 2000: 58,622
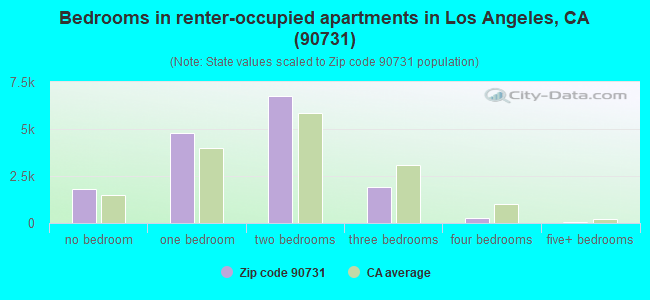
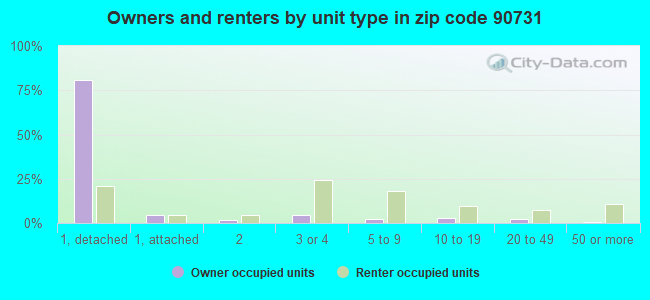
Houses and condos: 24,816 Renter-occupied apartments: 15,570
% of renters here:
66%
State:
44%
March 2022 cost of living index in zip code 90731: 139.0 (high, U.S. average is 100)
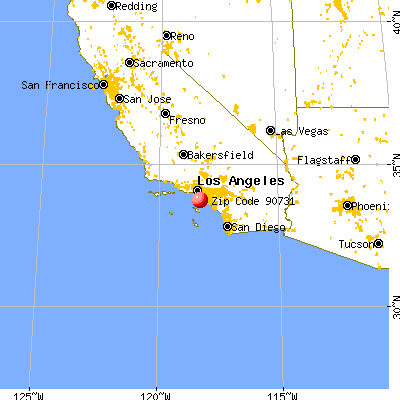
Land area: 9.2 sq. mi. Water area: 6.4 sq. mi.
Population density: 6,844 people per square mile
(high).
OSM Map
General Map
Google Map
MSN Map
OSM Map
General Map
Google Map
MSN Map
OSM Map
General Map
Google Map
MSN Map
OSM Map
General Map
Google Map
MSN Map
Please wait while loading the map...
Real estate property taxes paid for housing units in 2022:
This zip code:
0.6% ($5,220)
California:
0.7% ($4,831)
Median real estate property taxes paid for housing units with mortgages in 2022: $6,044 (0.7%) Median real estate property taxes paid for housing units with no mortgage in 2022: $3,208 (0.4%)
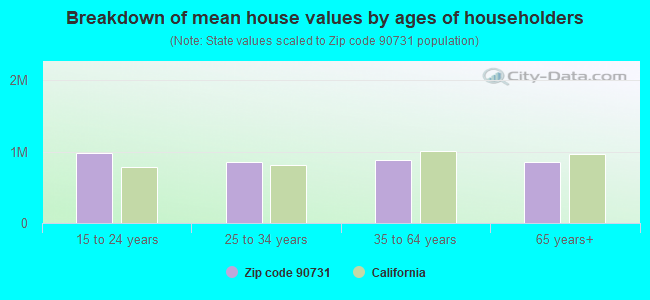
Estimated median house/condo value in 2022: $815,907
90731:
$815,907
California:
$715,900
According to our research of California and other state lists, there were 81 registered sex offenders living in 90731 zip code as of April 26, 2024. The ratio of all residents to sex offenders in zip code 90731 is 764 to 1. The ratio of registered sex offenders to all residents in this zip code is near the state average.
Median resident age:
This zip code:
38.7 years
California median age:
37.9 years
Average household size:
This zip code:
2.6 people
California:
2.8 people
Averages for the 2020 tax year for zip code 90731, filed in 2021:
Average Adjusted Gross Income (AGI) in 2020: $62,015 (Individual Income Tax Returns)
Here:
$62,015
State:
$95,910
Salary/wage: $57,388 (reported on 80.8% of returns)
Here:
$57,388
State:
$77,331
(% of AGI for various income ranges: 1211.3% for AGIs below $25k, 3895.9% for AGIs $25k-50k, 7416.6% for AGIs $50k-75k, 11037.8% for AGIs $75k-100k, 21013.9% for AGIs $100k-200k, 64676.3% for AGIs over 200k)
Taxable interest for individuals: $975 (reported on 25.2% of returns)
This zip code:
$975
California:
$2,294
(% of AGI for various income ranges: 10.7% for AGIs below $25k, 15.2% for AGIs $25k-50k, 22.3% for AGIs $50k-75k, 43.8% for AGIs $75k-100k, 109.2% for AGIs $100k-200k, 544.7% for AGIs over 200k)
Ordinary dividends: $4,033 (reported on 11.7% of returns)
Here:
$4,033
State:
$10,949
(% of AGI for various income ranges: 13.4% for AGIs below $25k, 15.5% for AGIs $25k-50k, 59.0% for AGIs $50k-75k, 85.8% for AGIs $75k-100k, 194.9% for AGIs $100k-200k, 1315.0% for AGIs over 200k)
Net capital gain/loss in AGI: +$11,497 (reported on 12.4% of returns)
Here:
+$11,497
State:
+$49,306
(% of AGI for various income ranges: 6.3% for AGIs below $25k, 10.6% for AGIs $25k-50k, 34.0% for AGIs $50k-75k, 97.8% for AGIs $75k-100k, 365.2% for AGIs $100k-200k, 7795.5% for AGIs over 200k)
Profit/loss from business: +$8,304 (reported on 19.4% of returns)
Here:
+$8,304
State:
+$15,671
(% of AGI for various income ranges: 206.3% for AGIs below $25k, 149.7% for AGIs $25k-50k, 157.4% for AGIs $50k-75k, 251.1% for AGIs $75k-100k, 383.8% for AGIs $100k-200k, 2403.2% for AGIs over 200k)
Taxable individual retirement arrangement distribution: $18,701 (reported on 4.9% of returns)
90731:
$18,701
California:
$23,505
(% of AGI for various income ranges: 26.8% for AGIs below $25k, 49.4% for AGIs $25k-50k, 126.6% for AGIs $50k-75k, 217.4% for AGIs $75k-100k, 471.0% for AGIs $100k-200k, 1497.9% for AGIs over 200k)
Self-employed (Keogh) retirement plans: $19,818 (reported on 0.4% of returns)
90731:
$19,818
California:
$30,163
(% of AGI for various income ranges: 16.3% for AGIs $50k-75k, 23.2% for AGIs $100k-200k, 340.5% for AGIs over 200k)
Total itemized deductions: $30,441 (reported on 12.5% of returns)
Here:
$30,441
State:
$39,517
(% of AGI for various income ranges: 63.1% for AGIs below $25k, 132.9% for AGIs $25k-50k, 423.0% for AGIs $50k-75k, 986.0% for AGIs $75k-100k, 2189.2% for AGIs $100k-200k, 7333.7% for AGIs over 200k)
Charity contributions: $5,858 (reported on 10.8% of returns)
Here:
$5,858
State:
$12,598
(% of AGI for various income ranges: 3.8% for AGIs below $25k, 17.0% for AGIs $25k-50k, 57.3% for AGIs $50k-75k, 143.6% for AGIs $75k-100k, 317.8% for AGIs $100k-200k, 1792.4% for AGIs over 200k)
Taxes paid: $8,650 (reported on 12.5% of returns)
90731:
$8,650
State:
$8,807
(% of AGI for various income ranges: 12.8% for AGIs below $25k, 32.1% for AGIs $25k-50k, 114.3% for AGIs $50k-75k, 307.2% for AGIs $75k-100k, 700.1% for AGIs $100k-200k, 1787.6% for AGIs over 200k)
Earned income credit: $2,076 (reported on 17.8% of returns)
Here:
$2,076
State:
$2,074
(% of AGI for various income ranges: 106.5% for AGIs below $25k, 70.5% for AGIs $25k-50k, 1.0% for AGIs $50k-75k)
Percentage of individuals using paid preparers for their 2020 taxes: 92.5%
Here:
93%
State:
92%
(% for various income ranges: 91.1% for AGIs below $25k, 93.1% for AGIs $25k-50k, 93.1% for AGIs $50k-75k, 92.7% for AGIs $75k-100k, 93.9% for AGIs $100k-200k, 94.6% for AGIs over 200k)
Averages for the 2012 tax year for zip code 90731, filed in 2013:
Average Adjusted Gross Income (AGI) in 2012: $49,088 (Individual Income Tax Returns)
Here:
$49,088
State:
$72,726
Salary/wage: $46,509 (reported on 83.5% of returns)
Here:
$46,509
State:
$59,079
(% of AGI for various income ranges: 73.8% for AGIs below $25k, 84.2% for AGIs $25k-50k, 83.6% for AGIs $50k-75k, 82.0% for AGIs $75k-100k, 82.7% for AGIs $100k-200k, 58.4% for AGIs over 200k)
Taxable interest for individuals: $1,041 (reported on 26.5% of returns)
This zip code:
$1,041
California:
$2,146
(% of AGI for various income ranges: 0.5% for AGIs below $25k, 0.4% for AGIs $25k-50k, 0.5% for AGIs $50k-75k, 0.6% for AGIs $75k-100k, 0.5% for AGIs $100k-200k, 1.2% for AGIs over 200k)
Ordinary dividends: $3,785 (reported on 10.9% of returns)
Here:
$3,785
State:
$9,308
(% of AGI for various income ranges: 0.6% for AGIs below $25k, 0.4% for AGIs $25k-50k, 0.7% for AGIs $50k-75k, 0.7% for AGIs $75k-100k, 0.7% for AGIs $100k-200k, 2.4% for AGIs over 200k)
Net capital gain/loss in AGI: +$4,983 (reported on 9.1% of returns)
Here:
+$4,983
State:
+$30,460
(% of AGI for various income ranges: 0.1% for AGIs $50k-75k, 0.3% for AGIs $75k-100k, 0.6% for AGIs $100k-200k, 5.9% for AGIs over 200k)
Profit/loss from business: +$10,471 (reported on 17.6% of returns)
Here:
+$10,471
State:
+$17,064
(% of AGI for various income ranges: 13.8% for AGIs below $25k, 3.5% for AGIs $25k-50k, 2.4% for AGIs $50k-75k, 1.8% for AGIs $75k-100k, 1.9% for AGIs $100k-200k, 3.4% for AGIs over 200k)
Taxable individual retirement arrangement distribution: $13,856 (reported on 5.5% of returns)
90731:
$13,856
California:
$19,557
(% of AGI for various income ranges: 1.5% for AGIs below $25k, 1.3% for AGIs $25k-50k, 1.5% for AGIs $50k-75k, 1.7% for AGIs $75k-100k, 1.7% for AGIs $100k-200k, 1.7% for AGIs over 200k)
Self-employment retirement plans: $17,950 (reported on 0.3% of returns)
90731:
$17,950
California:
$24,530
Total itemized deductions: $25,115 (26% of AGI, reported on 30.3% of returns)
Here:
$25,115
State:
$34,004
Here:
26.2% of AGI
State:
22.7% of AGI
(% of AGI for various income ranges: 6.6% for AGIs below $25k, 10.0% for AGIs $25k-50k, 14.6% for AGIs $50k-75k, 18.4% for AGIs $75k-100k, 20.2% for AGIs $100k-200k, 18.5% for AGIs over 200k)
Charity contributions: $2,804 (reported on 25.7% of returns)
Here:
$2,804
State:
$4,659
(% of AGI for various income ranges: 0.4% for AGIs below $25k, 0.9% for AGIs $25k-50k, 1.7% for AGIs $50k-75k, 1.8% for AGIs $75k-100k, 2.0% for AGIs $100k-200k, 1.4% for AGIs over 200k)
Taxes paid: $8,618 (reported on 30.2% of returns)
90731:
$8,618
State:
$14,448
(% of AGI for various income ranges: 1.1% for AGIs below $25k, 2.2% for AGIs $25k-50k, 4.1% for AGIs $50k-75k, 6.0% for AGIs $75k-100k, 7.8% for AGIs $100k-200k, 8.7% for AGIs over 200k)
Earned income credit: $2,404 (reported on 23.5% of returns)
Here:
$2,404
State:
$2,286
(% of AGI for various income ranges: 8.3% for AGIs below $25k, 1.3% for AGIs $25k-50k)
Percentage of individuals using paid preparers for their 2012 taxes: 69.3%
Here:
69%
State:
64%
(% for various income ranges: 66.9% for AGIs below $25k, 66.9% for AGIs $25k-50k, 69.6% for AGIs $50k-75k, 75.1% for AGIs $75k-100k, 77.9% for AGIs $100k-200k, 77.3% for AGIs over 200k)
Averages for the 2004 tax year for zip code 90731, filed in 2005:
Average Adjusted Gross Income (AGI) in 2004: $42,300 (Individual Income Tax Returns)
Here:
$42,300
State:
$58,600
Salary/wage: $41,305 (reported on 85.2% of returns)
Here:
$41,305
State:
$49,455
(% of AGI for various income ranges: 186.9% for AGIs below $10k, 79.6% for AGIs $10k-25k, 86.7% for AGIs $25k-50k, 88.0% for AGIs $50k-75k, 87.1% for AGIs $75k-100k, 74.3% for AGIs over 100k)
Taxable interest for individuals: $1,188 (reported on 37.3% of returns)
This zip code:
$1,188
California:
$2,365
(% of AGI for various income ranges: 9.5% for AGIs below $10k, 1.3% for AGIs $10k-25k, 0.8% for AGIs $25k-50k, 0.8% for AGIs $50k-75k, 0.8% for AGIs $75k-100k, 1.2% for AGIs over 100k)
Taxable dividends: $2,065 (reported on 14.0% of returns)
Here:
$2,065
State:
$4,746
(% of AGI for various income ranges: 4.4% for AGIs below $10k, 0.7% for AGIs $10k-25k, 0.5% for AGIs $25k-50k, 0.4% for AGIs $50k-75k, 0.4% for AGIs $75k-100k, 1.0% for AGIs over 100k)
Net capital gain/loss: +$10,050 (reported on 11.8% of returns)
Here:
+$10,050
State:
+$23,418
(% of AGI for various income ranges: -1.9% for AGIs below $10k, -0.0% for AGIs $10k-25k, 0.2% for AGIs $25k-50k, 0.5% for AGIs $50k-75k, 0.8% for AGIs $75k-100k, 8.0% for AGIs over 100k)
Profit/loss from business: +$10,565 (reported on 15.2% of returns)
Here:
+$10,565
State:
+$16,826
(% of AGI for various income ranges: 31.0% for AGIs below $10k, 7.9% for AGIs $10k-25k, 3.0% for AGIs $25k-50k, 1.9% for AGIs $50k-75k, 2.3% for AGIs $75k-100k, 4.0% for AGIs over 100k)
IRA payment deduction: $2,918 (reported on 2.3% of returns)
90731:
$2,918
California:
$3,192
(% of AGI for various income ranges: 0.5% for AGIs below $10k, 0.1% for AGIs $10k-25k, 0.2% for AGIs $25k-50k, 0.2% for AGIs $50k-75k, 0.1% for AGIs $75k-100k, 0.1% for AGIs over 100k)
Self-employed pension: $14,533 (reported on 0.5% of returns)
Here:
$14,533
California:
$17,688
(% of AGI for various income ranges: 0.5% for AGIs below $10k, 0.0% for AGIs $25k-50k, 0.1% for AGIs $50k-75k, 0.1% for AGIs $75k-100k, 0.4% for AGIs over 100k)
Total itemized deductions: $22,391 (28% of AGI, reported on 32.7% of returns)
Here:
$22,391
State:
$28,113
Here:
28.1% of AGI
State:
25.3% of AGI
(% of AGI for various income ranges: 23.1% for AGIs below $10k, 8.4% for AGIs $10k-25k, 12.4% for AGIs $25k-50k, 19.1% for AGIs $50k-75k, 21.2% for AGIs $75k-100k, 20.9% for AGIs over 100k)
Charity contributions deductions: $2,975 (4% of AGI, reported on 29.8% of returns)
Here:
$2,975
State:
$3,923
Here:
3.6% of AGI
State:
3.3% of AGI
(% of AGI for various income ranges: 1.2% for AGIs below $10k, 0.9% for AGIs $10k-25k, 1.6% for AGIs $25k-50k, 2.4% for AGIs $50k-75k, 2.5% for AGIs $75k-100k, 2.5% for AGIs over 100k)
Total tax: $6,009 (reported on 72.9% of returns)
90731:
$6,009
State:
$10,761
(% of AGI for various income ranges: 8.6% for AGIs below $10k, 4.0% for AGIs $10k-25k, 6.6% for AGIs $25k-50k, 9.3% for AGIs $50k-75k, 10.7% for AGIs $75k-100k, 15.8% for AGIs over 100k)
Earned income credit: $1,805 (reported on 20.0% of returns)
Here:
$1,805
State:
$1,763
Percentage of individuals using paid preparers for their 2004 taxes: 73.1%
Here:
73%
State:
66%
(% for various income ranges: 67.1% for AGIs below $10k, 73.7% for AGIs $10k-25k, 72.1% for AGIs $25k-50k, 74.9% for AGIs $50k-75k, 75.3% for AGIs $75k-100k, 82.1% for AGIs over 100k)
Likely homosexual households (counted as self-reported same-sex unmarried-partner households)
Lesbian couples: 0.1% of all households
Gay men: 0.3% of all households
Household received Food Stamps/SNAP in the past 12 months: 3,883 Household did not receive Food Stamps/SNAP in the past 12 months: 19,960
Women who had a birth in the past 12 months: 678 (321 now married, 360 unmarried) Women who did not have a birth in the past 12 months: 14,312 (5,597 now married, 8,718 unmarried)
Housing units in zip code 90731 with a mortgage: 5,715 (547 second mortgage, 23 home equity loan, 412 both second mortgage and home equity loan) Houses without a mortgage: 90
Median monthly owner costs for units with a mortgage: $2,969 Median monthly owner costs for units without a mortgage: $741
Residents with income below the poverty level in 2022:
This zip code:
15.4%
Whole state:
12.2%
Residents with income below 50% of the poverty level in 2022:
This zip code:
7.8%
Whole state:
6.2%
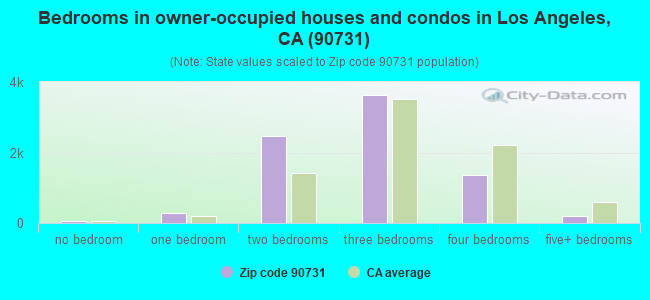
Median number of rooms in houses and condos:
Here:
5.4
State:
6.0
Median number of rooms in apartments:
Here:
3.7
State:
3.9
Notable locations in this zip code not listed on our city pages
Notable locations in zip code 90731: Daniels Field (A), United States Immigration Station (B), United States Quarantine Station (C), World Port Business Center (D), The Mole (E), Terminal Island Sewage Treatment Plant (F), Catalina Terminal (G), Cabrillo Marina (H), Cabrillo Beach Yacht Club (I), Fellows Marina (J), Point Fermin Lighthouse (K), Cabrillo Fishing Pier (L), San Pedro Regional Branch Los Angeles Public Library (M), Los Angeles Harbor Administration Building (N), Fort MacArthur Military Museum (O), Los Angeles Maritime Museum (P), Cabrillo Marine Museum (Q), San Pedro County Courts Building (R), San Pedro Athletic Club (S), Pacific Trade Center (T). Display/hide their locations on the map
Churches in zip code 90731 include: First United Methodist Church (A), Mount Sinai Missionary Baptist Church (B), Old Saint Peters Episcopal Church (C), Bethany Foursquare Church (D), Calvary Pentecostal Church of God (E), Church of Christ (F), Church of the Nazarene (G), Episcopal Seamens Center (H), First Assembly of God Church (I). Display/hide their locations on the map
Parks in zip code 90731 include: Alma Park (1), Anderson Memorial Playground (2), Cabrillo Beach Park (3), Leland Park (4), Point Fermin Park (5), Reeves Field (6), Angels Gate Park (7), Point Fermin Marine Life Refuge (8), White Point Park (9). Display/hide their locations on the map
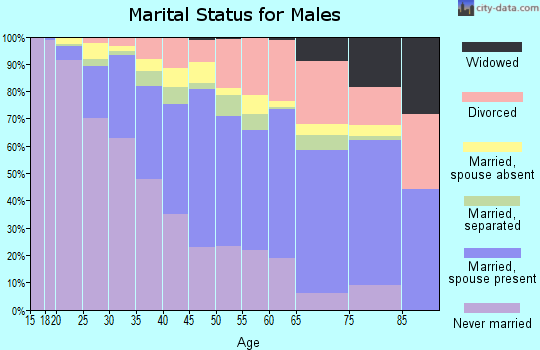
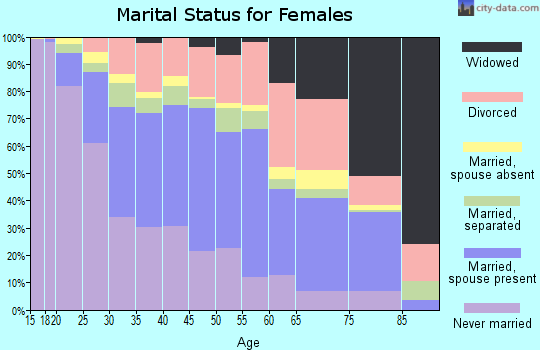
7,377 married couples with children.
4,112 single-parent households (978 men, 3,134 women).
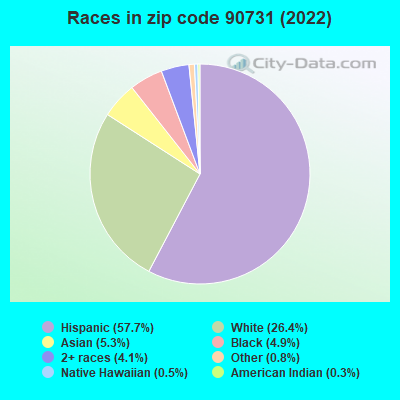
52.3% of residents of 90731 zip code speak English at home.
38.8% of residents speak Spanish at home (64% very well, 17% well, 14% not well, 5% not at all).
3.9% of residents speak other Indo-European language at home (69% very well, 20% well, 7% not well, 3% not at all).
4.2% of residents speak Asian or Pacific Island language at home (54% very well, 30% well, 14% not well, 2% not at all).
0.7% of residents speak other language at home (59% very well, 36% well, 1% not well, 3% not at all).
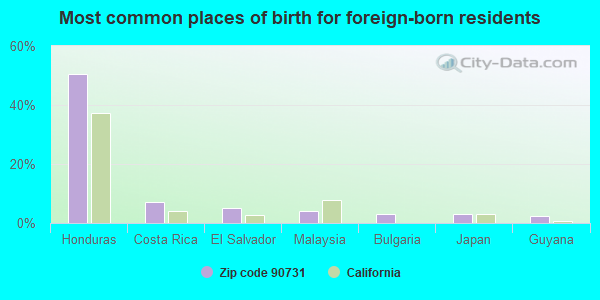
Foreign born population: 16,020 (25.5%) (47.9% of them are naturalized citizens)
This zip code:
25.5%
Whole state:
26.7%
50%Honduras
7%Costa Rica
5%El Salvador
4%Malaysia
3%Bulgaria
3%Japan
2%Guyana
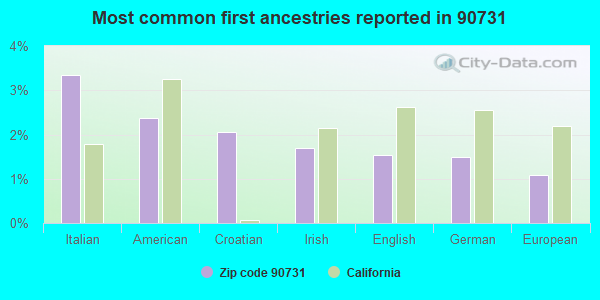
3%Italian
2%American
2%Croatian
2%Irish
2%English
2%German
1%European
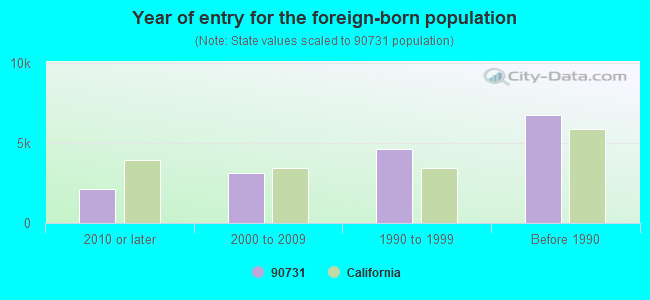
Year of entry for the foreign-born population
2,1342010 or later
3,0952000 to 2009
4,6341990 to 1999
6,731Before 1990
Major facilities with environmental interests located in this zip code:
MOBIL OIL CORPORATION SOUTHWEST TERMINAL 1 (799 SOUTH SEASIDE AVENUE in SAN PEDRO, CA)
AIR MINOR (AIRS/AFS) OIL CONTROL (Facility Response Plan for oil discharge) STATE MASTER (California - Hazardous Waste Tracking) - HAZARDOU WASTE PROGRAM CRITERIA AND HAZARDOUS AIR POLLUTANT INVENTORY (Inventory of air pollution sources) National Pollutant Discharge Elimination System NON-MAJOR (Tracking pollutant discharge elimination systems) - permit Small Quantity Generators, between 100 kg and 1000 kg of hazardous waste/month (Resource Conservation and Recovery Act (tracking hazardous waste)) HAZARDOUS WASTE BIENNIAL REPORTER (Resource Conservation and Recovery Act (tracking hazardous waste)) Large Quantity Generators, more that 1000 kg of hazardous waste/month (Resource Conservation and Recovery Act (tracking hazardous waste)) TRI REPORTER (Tracking of toxic chemicals releasing facilities) Business SIC classification: REFINED PETROLEUM PIPELINES; PETROLEUM BULK STATIONS AND TERMINALS Organizations: MOBIL OIL CORP WEST COAST PIPE LINES (CONTACT/OPERATOR)
, EXXONMOBIL OIL CORPORATION (CONTACT/OWNER)
Alternative names: EXXONMOBIL OIL CORP, MOBIL OIL CORPoration MARINE TERMinal, MOBIL OIL CORP SW TERM AREA, MOBIL OIL SOUTHWESTERN TERMINAL, SOUTHWESTERN TERMINAL , SOUTHWESTERN TERMINAL-AREA I
IMPRESS USA INC (936 BARRACUDA ST in TERMINAL ISLAND, CA)
AIR MAJOR (AIRS/AFS) STATE MASTER (California - Hazardous Waste Tracking) - HAZARDOU WASTE PROGRAM CRITERIA AND HAZARDOUS AIR POLLUTANT INVENTORY (Inventory of air pollution sources) HAZARDOUS WASTE BIENNIAL REPORTER (Resource Conservation and Recovery Act (tracking hazardous waste)) Large Quantity Generators, more that 1000 kg of hazardous waste/month (Resource Conservation and Recovery Act (tracking hazardous waste)) - notification TRI REPORTER (Tracking of toxic chemicals releasing facilities) Business SIC classification: METAL CANS Business NAICS classification: ELECTROPLATING, PLATING, POLISHING, ANODIZING, AND COLORING. Organizations: IMPRESS USA, INC. (CONTACT/OPERATOR)
Alternative names: IMPRESS U S A INC
15TH ST E S (1527 S MESA ST in SAN PEDRO, CA)
STATE MASTER (California - Hazardous Waste Tracking) - HAZARDOU WASTE PROGRAM Large Quantity Generators, more that 1000 kg of hazardous waste/month (Resource Conservation and Recovery Act (tracking hazardous waste)) - notification Organizations: LAUSD (CONTACT/OPERATOR)
Alternative names: LAUSD 15TH ST ELEM SCHOOL, LAUSD/FIFTEENTH ST ELEM
LAUSD COOPER HS (2210 TAPER AVE in SAN PEDRO, CA)
STATE MASTER (California - Hazardous Waste Tracking) - HAZARDOU WASTE PROGRAM (Resource Conservation and Recovery Act (tracking hazardous waste)) Alternative names: COOPER (JAMES FENIMORE) OPPORTUNITY HIGH, LAUSD/ COOPER OPPORTUNITY HS
CABRILLO E S (732 S CABRILLO AVE in SAN PEDRO, CA)
STATE MASTER (California - Hazardous Waste Tracking) - HAZARDOU WASTE PROGRAM Large Quantity Generators, more that 1000 kg of hazardous waste/month (Resource Conservation and Recovery Act (tracking hazardous waste)) - notification Organizations: L A UNIFIED SCHOOL DISTRICT (CONTACT/OWNER)
Alternative names: LA USD CABRILLO EL, LAUSD/ CABRILLO AVE ELEM
LAUSD-SAN PEDRO HIGH SCHOOL (1001 W 15TH ST in SAN PEDRO, CA)
STATE MASTER (California - Hazardous Waste Tracking) - HAZARDOU WASTE PROGRAM HAZARDOUS WASTE BIENNIAL REPORTER (Resource Conservation and Recovery Act (tracking hazardous waste)) Large Quantity Generators, more that 1000 kg of hazardous waste/month (Resource Conservation and Recovery Act (tracking hazardous waste)) Alternative names: LAUSD/ SAN PEDRO HS, LOS ANGELES USD SAN PEDRO HIGH SCHOOL, SAN PEDRO SENIOR HIGH
JOE FURGEL AUTO PART & SERV INC (1106 SO GAFFEY ST in SAN PEDRO, CA)
STATE MASTER (California - Hazardous Waste Tracking) - HAZARDOU WASTE PROGRAM Small Quantity Generators, between 100 kg and 1000 kg of hazardous waste/month (Resource Conservation and Recovery Act (tracking hazardous waste)) - notification
LA FIRE STATION 110 (2945 MINER ST in SAN PEDRO, CA)
STATE MASTER (California - Hazardous Waste Tracking) - HAZARDOU WASTE PROGRAM Small Quantity Generators, between 100 kg and 1000 kg of hazardous waste/month (Resource Conservation and Recovery Act (tracking hazardous waste)) - notification Organizations: CITY OF LOS ANGELES (CONTACT/OWNER)
Alternative names: CITY OF LA GENERAL SERVICES
ADVERTISING INK (425 W 6TH ST in SAN PEDRO, CA)
STATE MASTER (California - Hazardous Waste Tracking) - HAZARDOU WASTE PROGRAM Small Quantity Generators, between 100 kg and 1000 kg of hazardous waste/month (Resource Conservation and Recovery Act (tracking hazardous waste)) - notification Business NAICS classification: COMMERCIAL LITHOGRAPHIC PRINTING. Organizations: CHARLES H SENIOR (CONTACT/OWNER)
LA FIRE STATION 111 (954 SEASIDE AVE in TERMINAL ISLAND, CA)
STATE MASTER (California - Hazardous Waste Tracking) - HAZARDOU WASTE PROGRAM Small Quantity Generators, between 100 kg and 1000 kg of hazardous waste/month (Resource Conservation and Recovery Act (tracking hazardous waste)) - notification Organizations: CITY OF LOS ANGELES (CONTACT/OWNER)
Alternative names: CITY OF LA GENERAL SERVICES
LOS ANGLELES FIRE STATION 40 (330 FERRY STREET in TERMINAL ISLAND, CA)
STATE MASTER (California - Hazardous Waste Tracking) - HAZARDOU WASTE PROGRAM Small Quantity Generators, between 100 kg and 1000 kg of hazardous waste/month (Resource Conservation and Recovery Act (tracking hazardous waste)) - notification Organizations: CITY OF LA (CONTACT/OWNER)
Alternative names: CITY OF LA GENERAL SERVICES, LA FIRE STATION 40
CALTRANS TERMINAL ISLAND BRIDGE (430 N SEASIDE AVE in TERMINAL ISLAND, CA)
STATE MASTER (California - Hazardous Waste Tracking) - HAZARDOU WASTE PROGRAM Small Quantity Generators, between 100 kg and 1000 kg of hazardous waste/month (Resource Conservation and Recovery Act (tracking hazardous waste)) - notification TRANSPORTER (Resource Conservation and Recovery Act (tracking hazardous waste)) - notification Organizations: STATE OF CALIFORNIA (CONTACT/OWNER)
LA FIRE STATION 53 (438 N MESA ST in SAN PEDRO, CA)
STATE MASTER (California - Hazardous Waste Tracking) - HAZARDOU WASTE PROGRAM Small Quantity Generators, between 100 kg and 1000 kg of hazardous waste/month (Resource Conservation and Recovery Act (tracking hazardous waste)) - notification Organizations: CITY OF LA (CONTACT/OWNER)
Alternative names: CITY OF LA GENERAL SERVICES
Housing units lacking complete plumbing facilities: 0.6% Housing units lacking complete kitchen facilities: 2.8%
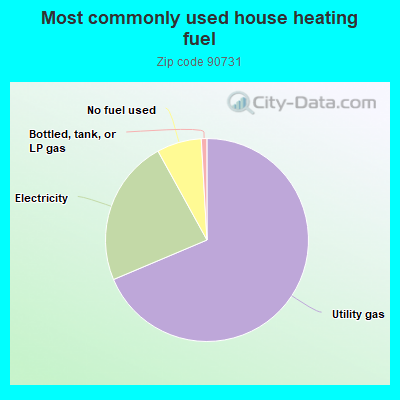
68.5%Utility gas
23.3%Electricity
7.1%No fuel used
0.9%Bottled, tank, or LP gas
Population in 1990: 58,821.
Place of birth for U.S.-born residents:
This state: 38,812
Northeast: 1,723
Midwest: 1,822
South: 2,128
West: 1,558
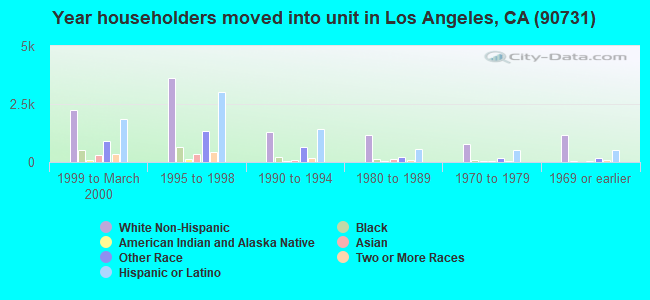
49% of the 90731 zip code residents lived in the same house 5 years ago. Out of people who lived in different houses, 83% lived in this county. Out of people who lived in different counties, 50% lived in California.
89% of the 90731 zip code residents lived in the same house 1 year ago. Out of people who lived in different houses, 78% moved from this county. Out of people who lived in different houses, 7% moved from different county within same state. Out of people who lived in different houses, 8% moved from different state. Out of people who lived in different houses, 3% moved from abroad.
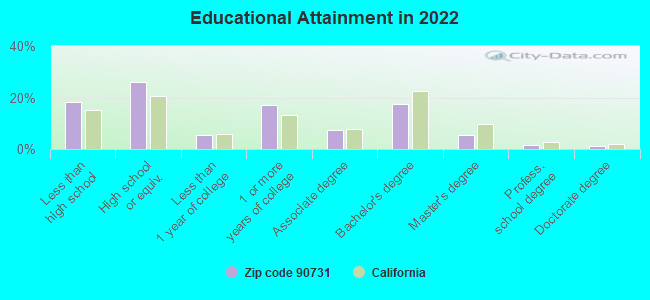
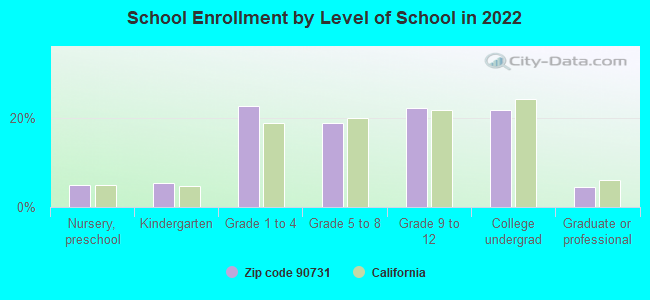
Private vs. public school enrollment:
Students in private schools in grades 1 to 8 (elementary and middle school): 563
Here:
9.1%
California:
10.5%
Students in private schools in grades 9 to 12 (high school): 265
Here:
8.0%
California:
8.5%
Students in private undergraduate colleges: 590
Here:
18.1%
California:
15.9%
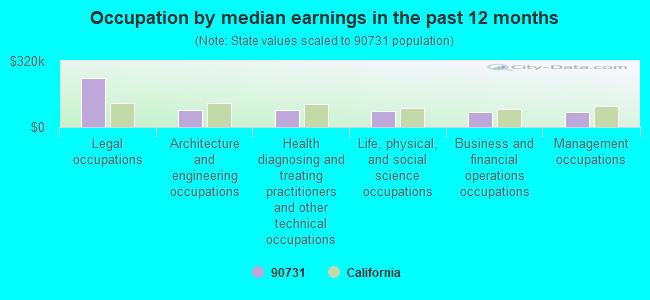
Occupation by median earnings in the past 12 months ($)
237,352Legal occupations
83,965Architecture and engineering occupations
80,285Health diagnosing and treating practitioners and other technical occupations
78,716Life, physical, and social science occupations
74,608Business and financial operations occupations
73,474Management occupations
Companies with biggest federal contracts located in this zip code (SAN PEDRO, CA):
TPA-CKY JOINT VENTURE (302 W 5TH ST STE 310; small business) : $20,741,255 in 55 contractsfrom 2002 to 2006
Contracts for Other Environmental Services, Studies, and Analytical Support, Maintenance, Repair or Alteration of Real Property -- Other Non-Building Facilities, Construction of Structures and Facilities -- Highways, Roads, Streets, Bridges, and Railways (includes resurfacing), Water Quality Support Services by Navy, Army, U.S. Army Corps of Engineers - civil program financing only Signed by year:2000: $0; 2001: $0; 2002: $265,357; 2003: $5,352,738; 2004: $2,752,034; 2005: $6,511,083; 2006: $5,860,043.
Biggest contracts:
$2,504,243 with Navy for Other Environmental Services, Studies, and Analytical Support. Signed on 2006-01-30. Completion date: 2005-11-30.
$2,488,565 with Army for Maintenance, Repair or Alteration of Real Property -- Other Non-Building Facilities. Signed on 2005-08-23. Completion date: 2005-12-30.
$2,399,540 with Navy for Other Environmental Services, Studies, and Analytical Support. Signed on 2003-11-07. Completion date: 2004-12-06.
$2,358,088 with Army for Other Environmental Services, Studies, and Analytical Support. Taking place in WA. Signed on 2003-09-30. Completion date: 2004-06-06.
CKY INC (302 W 5TH ST STE 310; small business) : $14,383,153 in 84 contractsfrom 2000 to 2006
Contracts for Construction of Structures and Facilities -- Other Non-Building Facilities, Maintenance, Repair or Alteration of Real Property -- Other Non-Building Facilities, Other Environmental Services, Studies, and Analytical Support, Hazardous Substance Removal, Cleanup, and Disposal Services and Operational Support, and moreby Army, Navy, U.S. Army Corps of Engineers - civil program financing only, Air Force, and others Signed by year:2000: $5,200,530; 2001: $3,402,145; 2002: $1,037,263; 2003: $1,518,550; 2004: $354,373; 2005: $30,566; 2006: $2,839,726.
Biggest contracts:
$2,245,000 with Army for Construction of Structures and Facilities -- Other Non-Building Facilities. Taking place in WA. Signed on 2006-06-01. Completion date: 2006-01-31.
$2,195,538 with Navy for Construction of Structures and Facilities -- Other Non-Building Facilities. Signed on 2001-03-29. Completion date: 2001-12-31.
$1,193,882, same as above.Signed on 2000-08-14. Completion date: 2000-11-28.
$1,000,000 with U.S. Army Corps of Engineers - civil program financing only for Maintenance, Repair or Alteration of Real Property -- Other Non-Building Facilities. Signed on 2000-10-19. Completion date: 2003-11-15.
A P L LIMITED (614 TERMINAL WAY) : $13,386,058 in 11 contractsfrom 2002 to 2005
Contracts for Stevedoring by Army Signed by year:2000: $0; 2001: $0; 2002: $1,518,179; 2003: $7,517,979; 2004: $0; 2005: $4,349,900; 2006: $0.
Biggest contracts:
$6,000,000 with Army for Stevedoring. Signed on 2003-12-04. Completion date: 2004-06-30.
$1,600,000, same as above.Signed on 2005-06-30. Completion date: 2004-06-30.
$1,600,000, same as above.Signed on 2005-06-30. Completion date: 2005-06-30.
$1,518,079, same as above.Signed on 2002-08-15. Completion date: 2004-06-30.
CONTESSA FOOD PRODUCTS (222 W 6TH ST FL 8; small business) : $8,405,151 in 29 contractsfrom 1999 to 2004
Contracts for Food Items For Resale by Department of Defense, Defense Commissary Agency Signed by year:2000: $1,454,948; 2001: $1,099,179; 2002: $2,830,070; 2003: $1,123,170; 2004: $1,238,841; 2005: $0; 2006: $0.
Biggest contracts:
$1,351,986 with Department of Defense for Food Items For Resale. Signed on 2002-10-01. Completion date: 2003-05-31.
$710,913, same as above.Signed on 2003-06-01. Completion date: 2003-09-30.
$672,945, same as above.Signed on 2001-04-01. Completion date: 2001-05-31.
$565,539 with Defense Commissary Agency for Food Items For Resale. Signed on 2004-02-01. Completion date: 2004-04-30.
SAN PEDRO BOAT WORKS INC (BERTH 44 OUTER HBR; small business) : $5,033,753 in 44 contractsfrom 1999 to 2001
Contracts for Non-nuclear Ship Repair (East) Ship repair (including overhauls and conversions) performed on non-nuclear propelled and nonpropelled ships east of the 108th meridian, Non-nuclear Ship Repair (West) Ship repair (including overhauls and conversions) performed on. non-nuclear propelled and nonpropelled ships west of the 108th meridian, Small Craft by United States Coast Guard (disused code: now 7008), National Oceanic and Atmospheric Administration/Under Secretary for Oceans and Atmosphere, Navy Signed by year:2000: $3,204,948; 2001: $360,047; 2002: $0; 2003: $0; 2004: $0; 2005: $0; 2006: $0.
Biggest contracts:
$1,132,000 with United States Coast Guard (disused code: now 7008) for Non-nuclear Ship Repair (East) Ship repair (including overhauls and conversions) performed on non-nuclear propelled and nonpropelled ships east of the 108th meridian. Signed on 2000-12-15. Completion date: 2000-12-15.
$508,000 with National Oceanic and Atmospheric Administration/Under Secretary for Oceans and Atmosphere for Non-nuclear Ship Repair (East) Ship repair (including overhauls and conversions) performed on non-nuclear propelled and nonpropelled ships east of the 108th meridian. Signed on 1999-12-15. Completion date: 2000-03-15.
$464,222 with Navy for Non-nuclear Ship Repair (West) Ship repair (including overhauls and conversions) performed on. non-nuclear propelled and nonpropelled ships west of the 108th meridian. Signed on 1999-11-05. Completion date: 2000-01-24.
$314,615, same as above.Signed on 2000-09-14. Completion date: 2001-03-01.
STAR FISHERIES (2206 SIGNAL PLACE; small business) : $1,444,332 in 6 contractsfrom 2004 to 2006
Contracts for Non-Food Items For Resale, Food Items For Resale by Defense Commissary Agency Signed by year:2000: $0; 2001: $0; 2002: $0; 2003: $0; 2004: $79,200; 2005: $626,825; 2006: $738,307.
Biggest contracts:
$738,307 with Defense Commissary Agency for Non-Food Items For Resale. Signed on 2006-01-01. Completion date: 2006-03-31.
$236,405 with Defense Commissary Agency for Food Items For Resale. Signed on 2005-04-01. Completion date: 2005-08-31.
$214,824 with Defense Commissary Agency for Non-Food Items For Resale. Signed on 2005-10-01. Completion date: 2005-12-31.
$125,557 with Defense Commissary Agency for Food Items For Resale. Signed on 2005-09-01. Completion date: 2005-09-30.
SOUTHWEST MARINE INC (985 S SEASIDE AVE) : $542,101 in 8 contractsfrom 1999 to 2000
Contracts for Non-nuclear Ship Repair (West) Ship repair (including overhauls and conversions) performed on. non-nuclear propelled and nonpropelled ships west of the 108th meridian by Navy Signed by year:2000: $172,201; 2001: $0; 2002: $0; 2003: $0; 2004: $0; 2005: $0; 2006: $0.
Biggest contracts:
$369,900 with Navy for Non-nuclear Ship Repair (West) Ship repair (including overhauls and conversions) performed on. non-nuclear propelled and nonpropelled ships west of the 108th meridian. Signed on 1999-12-16. Completion date: 2000-03-14.
$63,589, same as above.Signed on 2000-03-02. Completion date: 2000-03-14.
$40,370, same as above.Signed on 2000-03-09. Completion date: 2000-03-14.
$25,798, same as above.Signed on 2000-02-09. Completion date: 2000-02-14.
TAN PHUNG & ASSOCIATES INC (302 W 5TH ST STE 310; small business) : $530,116 in 8 contractsfrom 2002 to 2005
Contracts for Construction of Structures and Facilities -- Restoration of real property, Water Pollution -- Advanced Development (R&D), Other Professional Services, Other Architect and Engineering Services, and moreby Navy Signed by year:2000: $0; 2001: $0; 2002: $156,484; 2003: $23,969; 2004: $39,817; 2005: $309,846; 2006: $0.
Biggest contracts:
$226,890 with Navy for Construction of Structures and Facilities -- Restoration of real property. Signed on 2005-02-18. Completion date: 2005-08-16.
$156,484 with Navy for Water Pollution -- Advanced Development (R&D). Signed on 2002-11-04. Completion date: 2003-04-28.
$82,539 with Navy for Other Professional Services. Signed on 2005-06-28. Completion date: 2005-09-30.
$24,982 with Navy for Other Architect and Engineering Services. Signed on 2004-05-11. Completion date: 2006-05-12.
AEROFAST SUPPLY (405 W 20TH ST; small business) : $385,129 in 88 contractsfrom 2004 to 2006
Contracts for Screws, Guns, 75 mm through 125 mm, Bolts, Hardware, Commercial, and moreby Defense Logistics Agency Signed by year:2000: $0; 2001: $0; 2002: $0; 2003: $0; 2004: $110,409; 2005: $232,917; 2006: $41,803.
Biggest contracts:
$28,440 with Defense Logistics Agency for Screws. Signed on 2004-05-24. Completion date: 2005-01-19.
$18,000 with Defense Logistics Agency for Guns, 75 mm through 125 mm. Signed on 2005-10-04. Completion date: 2005-12-28.
$14,480 with Defense Logistics Agency for Screws. Signed on 2005-06-23. Completion date: 2006-04-03.
$10,054 with Defense Logistics Agency for Bolts. Signed on 2005-03-21. Completion date: 2005-08-08.
FINELINE TECHNICAL SERVICES (702 W HAMILTON PLACE SUIT; small business) : $323,570 in 8 contractsfrom 2002 to 2005
Contracts for Miscellaneous Special Industry Machinery, Miscellaneous Power Transmission Equipment, Hydraulic and Pneumatic Presses, Power Driven, Compressors and Vacuum Pumps by U.S. Army Corps of Engineers - civil program financing only, Army, United States Coast Guard (disused code: now 7008), Navy, and others Signed by year:2000: $0; 2001: $0; 2002: $61,000; 2003: $25,770; 2004: $83,706; 2005: $153,094; 2006: $0.
Biggest contracts:
$76,872 with U.S. Army Corps of Engineers - civil program financing only for Miscellaneous Special Industry Machinery. Taking place in WV. Signed on 2005-04-28. Completion date: 2005-03-02.
$76,872 with Army for Miscellaneous Special Industry Machinery. Taking place in WV. Signed on 2005-04-28. Completion date: 2005-03-02.
$61,000 with United States Coast Guard (disused code: now 7008) for Miscellaneous Power Transmission Equipment. Signed on 2002-03-15. Completion date: 2002-07-15.
$41,853 with Army for Hydraulic and Pneumatic Presses, Power Driven. Taking place in WV. Signed on 2004-04-08. Completion date: 2004-09-30.
Top industries in this zip code by the number of employees in 2005:
2005 - 2018 National Fire Incident Reporting System (NFIRS) incidents
Based on the data from the years 2005 - 2018 the average number of fire incidents per year is 142. The highest number of reported fires - 212 took place in 2006, and the least - 81 in 2012. The data has a decreasing trend.
When looking into fire subcategories, the most reports belonged to: Structure Fires (43.9%), and Outside Fires (31.7%).
Fire incident types reported to NFIRS in Zip Code 90731


 Nearest zip codes: 90732, 90744, 90710, 90802, 90717, 90831.


 Based on the data from the years 2005 - 2018 the average number of fire incidents per year is 142. The highest number of reported fires - 212 took place in 2006, and the least - 81 in 2012. The data has a decreasing trend.
 When looking into fire subcategories, the most reports belonged to: Structure Fires (43.9%), and Outside Fires (31.7%).