Estimated zip code population in 2022: 21,607 Zip code population in 2010: 21,318 Zip code population in 2000: 21,060
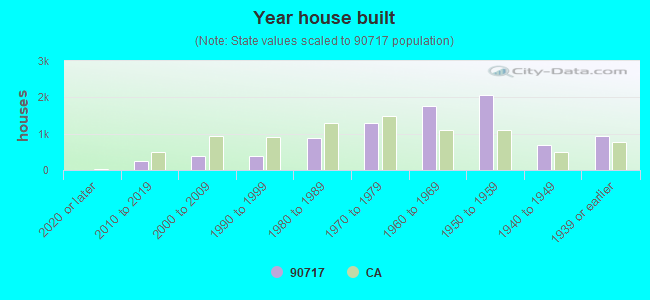
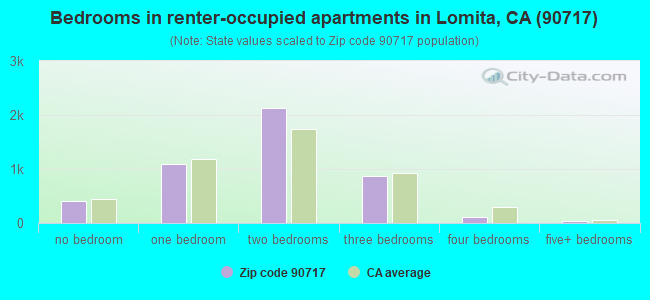
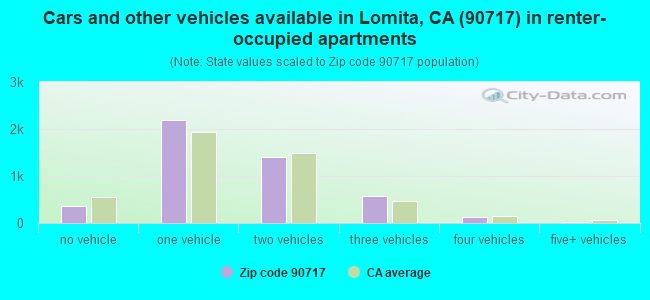
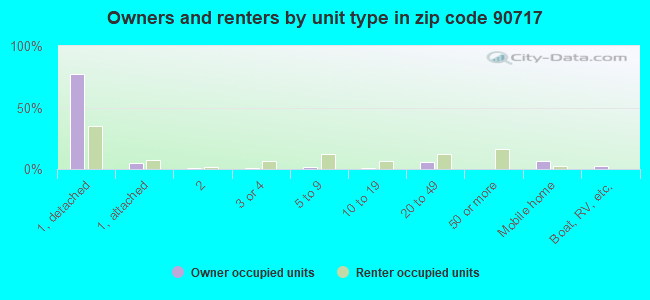
Houses and condos: 8,835 Renter-occupied apartments: 4,664
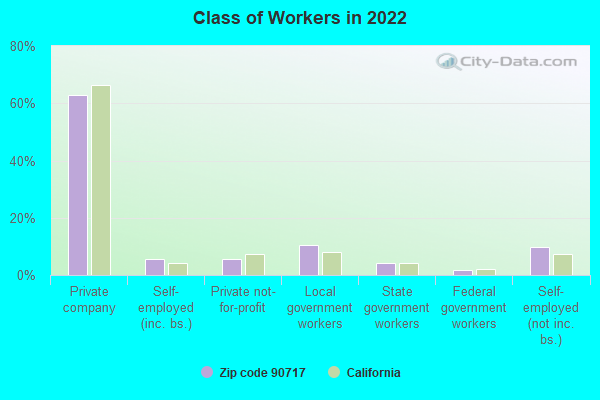
% of renters here:
55%
State:
44%
March 2022 cost of living index in zip code 90717: 135.0 (high, U.S. average is 100)
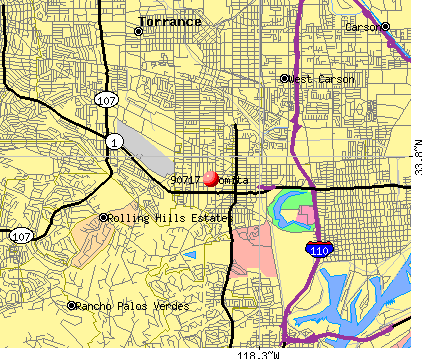
Land area: 2.0 sq. mi. Water area: 0.0 sq. mi.
Population density: 10,913 people per square mile
(high).
OSM Map
General Map
Google Map
MSN Map
OSM Map
General Map
Google Map
MSN Map
OSM Map
General Map
Google Map
MSN Map
OSM Map
General Map
Google Map
MSN Map
Please wait while loading the map...
Real estate property taxes paid for housing units in 2022:
This zip code:
0.7% ($5,910)
California:
0.7% ($4,831)
Median real estate property taxes paid for housing units with mortgages in 2022: $6,509 (0.8%) Median real estate property taxes paid for housing units with no mortgage in 2022: $4,322 (0.6%)
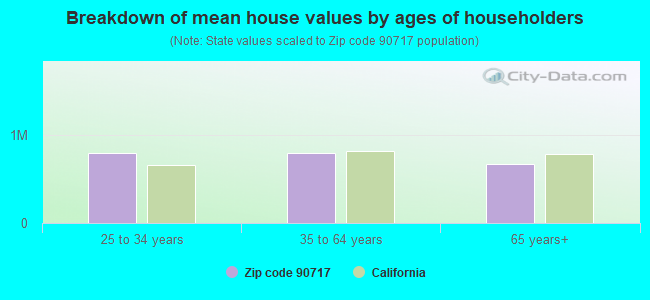
Estimated median house/condo value in 2022: $795,058
90717:
$795,058
California:
$715,900
According to our research of California and other state lists, there were 22 registered sex offenders living in 90717 zip code as of April 27, 2024. The ratio of all residents to sex offenders in zip code 90717 is 999 to 1. The ratio of registered sex offenders to all residents in this zip code is lower than the state average.
Median resident age:
This zip code:
41.3 years
California median age:
37.9 years
Average household size:
This zip code:
2.5 people
California:
2.8 people
Averages for the 2020 tax year for zip code 90717, filed in 2021:
Average Adjusted Gross Income (AGI) in 2020: $67,087 (Individual Income Tax Returns)
Here:
$67,087
State:
$95,910
Salary/wage: $61,083 (reported on 79.5% of returns)
Here:
$61,083
State:
$77,331
(% of AGI for various income ranges: 1166.7% for AGIs below $25k, 3988.3% for AGIs $25k-50k, 7458.3% for AGIs $50k-75k, 10773.3% for AGIs $75k-100k, 19511.5% for AGIs $100k-200k, 67328.1% for AGIs over 200k)
Taxable interest for individuals: $1,210 (reported on 31.7% of returns)
This zip code:
$1,210
California:
$2,294
(% of AGI for various income ranges: 20.0% for AGIs below $25k, 28.2% for AGIs $25k-50k, 35.7% for AGIs $50k-75k, 56.1% for AGIs $75k-100k, 138.8% for AGIs $100k-200k, 785.0% for AGIs over 200k)
Ordinary dividends: $4,221 (reported on 17.4% of returns)
Here:
$4,221
State:
$10,949
(% of AGI for various income ranges: 23.7% for AGIs below $25k, 30.1% for AGIs $25k-50k, 72.7% for AGIs $50k-75k, 144.0% for AGIs $75k-100k, 227.0% for AGIs $100k-200k, 2028.8% for AGIs over 200k)
Net capital gain/loss in AGI: +$8,952 (reported on 17.2% of returns)
Here:
+$8,952
State:
+$49,306
(% of AGI for various income ranges: 6.7% for AGIs below $25k, 17.3% for AGIs $25k-50k, 93.9% for AGIs $50k-75k, 165.2% for AGIs $75k-100k, 530.8% for AGIs $100k-200k, 6011.9% for AGIs over 200k)
Profit/loss from business: +$9,058 (reported on 19.9% of returns)
Here:
+$9,058
State:
+$15,671
(% of AGI for various income ranges: 223.8% for AGIs below $25k, 194.1% for AGIs $25k-50k, 233.4% for AGIs $50k-75k, 366.9% for AGIs $75k-100k, 438.2% for AGIs $100k-200k, 1603.8% for AGIs over 200k)
Taxable individual retirement arrangement distribution: $21,470 (reported on 6.9% of returns)
90717:
$21,470
California:
$23,505
(% of AGI for various income ranges: 43.3% for AGIs below $25k, 72.0% for AGIs $25k-50k, 172.1% for AGIs $50k-75k, 338.4% for AGIs $75k-100k, 634.1% for AGIs $100k-200k, 2630.0% for AGIs over 200k)
Self-employed (Keogh) retirement plans: $16,900 (reported on 0.5% of returns)
90717:
$16,900
California:
$30,163
(% of AGI for various income ranges: 32.5% for AGIs $50k-75k, 315.0% for AGIs over 200k)
Total itemized deductions: $30,073 (reported on 15.7% of returns)
Here:
$30,073
State:
$39,517
(% of AGI for various income ranges: 81.5% for AGIs below $25k, 221.0% for AGIs $25k-50k, 512.2% for AGIs $50k-75k, 951.2% for AGIs $75k-100k, 2381.6% for AGIs $100k-200k, 7965.0% for AGIs over 200k)
Charity contributions: $5,718 (reported on 13.1% of returns)
Here:
$5,718
State:
$12,598
(% of AGI for various income ranges: 3.9% for AGIs below $25k, 30.1% for AGIs $25k-50k, 62.4% for AGIs $50k-75k, 138.7% for AGIs $75k-100k, 382.7% for AGIs $100k-200k, 1576.2% for AGIs over 200k)
Taxes paid: $8,685 (reported on 15.6% of returns)
90717:
$8,685
State:
$8,807
(% of AGI for various income ranges: 19.7% for AGIs below $25k, 51.9% for AGIs $25k-50k, 149.2% for AGIs $50k-75k, 307.5% for AGIs $75k-100k, 721.6% for AGIs $100k-200k, 2098.1% for AGIs over 200k)
Earned income credit: $1,860 (reported on 14.5% of returns)
Here:
$1,860
State:
$2,074
(% of AGI for various income ranges: 85.6% for AGIs below $25k, 61.4% for AGIs $25k-50k, 1.2% for AGIs $50k-75k)
Percentage of individuals using paid preparers for their 2020 taxes: 92.0%
Here:
92%
State:
92%
(% for various income ranges: 90.7% for AGIs below $25k, 91.9% for AGIs $25k-50k, 92.8% for AGIs $50k-75k, 91.7% for AGIs $75k-100k, 94.2% for AGIs $100k-200k, 92.5% for AGIs over 200k)
Averages for the 2012 tax year for zip code 90717, filed in 2013:
Average Adjusted Gross Income (AGI) in 2012: $54,208 (Individual Income Tax Returns)
Here:
$54,208
State:
$72,726
Salary/wage: $51,134 (reported on 81.6% of returns)
Here:
$51,134
State:
$59,079
(% of AGI for various income ranges: 70.8% for AGIs below $25k, 80.9% for AGIs $25k-50k, 80.2% for AGIs $50k-75k, 80.7% for AGIs $75k-100k, 79.6% for AGIs $100k-200k, 61.1% for AGIs over 200k)
Taxable interest for individuals: $1,043 (reported on 34.0% of returns)
This zip code:
$1,043
California:
$2,146
(% of AGI for various income ranges: 1.2% for AGIs below $25k, 0.6% for AGIs $25k-50k, 0.6% for AGIs $50k-75k, 0.6% for AGIs $75k-100k, 0.5% for AGIs $100k-200k, 0.7% for AGIs over 200k)
Ordinary dividends: $2,957 (reported on 16.2% of returns)
Here:
$2,957
State:
$9,308
(% of AGI for various income ranges: 1.2% for AGIs below $25k, 0.7% for AGIs $25k-50k, 0.7% for AGIs $50k-75k, 0.8% for AGIs $75k-100k, 0.9% for AGIs $100k-200k, 1.3% for AGIs over 200k)
Net capital gain/loss in AGI: +$3,829 (reported on 13.3% of returns)
Here:
+$3,829
State:
+$30,460
(% of AGI for various income ranges: 0.3% for AGIs $50k-75k, 0.6% for AGIs $100k-200k, 5.9% for AGIs over 200k)
Profit/loss from business: +$11,474 (reported on 18.0% of returns)
Here:
+$11,474
State:
+$17,064
(% of AGI for various income ranges: 13.7% for AGIs below $25k, 5.2% for AGIs $25k-50k, 2.5% for AGIs $50k-75k, 2.7% for AGIs $75k-100k, 2.3% for AGIs $100k-200k, 2.0% for AGIs over 200k)
Taxable individual retirement arrangement distribution: $16,699 (reported on 7.9% of returns)
90717:
$16,699
California:
$19,557
(% of AGI for various income ranges: 2.6% for AGIs below $25k, 2.0% for AGIs $25k-50k, 2.8% for AGIs $50k-75k, 2.1% for AGIs $75k-100k, 2.5% for AGIs $100k-200k, 2.6% for AGIs over 200k)
Self-employment retirement plans: $11,960 (reported on 0.5% of returns)
90717:
$11,960
California:
$24,530
Total itemized deductions: $26,846 (27% of AGI, reported on 34.0% of returns)
Here:
$26,846
State:
$34,004
Here:
26.9% of AGI
State:
22.7% of AGI
(% of AGI for various income ranges: 12.1% for AGIs below $25k, 10.8% for AGIs $25k-50k, 14.8% for AGIs $50k-75k, 18.3% for AGIs $75k-100k, 20.7% for AGIs $100k-200k, 19.2% for AGIs over 200k)
Charity contributions: $3,360 (reported on 28.6% of returns)
Here:
$3,360
State:
$4,659
(% of AGI for various income ranges: 0.6% for AGIs below $25k, 1.0% for AGIs $25k-50k, 1.6% for AGIs $50k-75k, 1.9% for AGIs $75k-100k, 2.1% for AGIs $100k-200k, 2.8% for AGIs over 200k)
Taxes paid: $9,997 (reported on 33.8% of returns)
90717:
$9,997
State:
$14,448
(% of AGI for various income ranges: 6.1% for AGIs below $25k, 2.4% for AGIs $25k-50k, 4.3% for AGIs $50k-75k, 6.5% for AGIs $75k-100k, 8.0% for AGIs $100k-200k, 9.2% for AGIs over 200k)
Earned income credit: $1,994 (reported on 17.1% of returns)
Here:
$1,994
State:
$2,286
(% of AGI for various income ranges: 5.5% for AGIs below $25k, 0.9% for AGIs $25k-50k)
Percentage of individuals using paid preparers for their 2012 taxes: 66.4%
Here:
66%
State:
64%
(% for various income ranges: 62.8% for AGIs below $25k, 64.6% for AGIs $25k-50k, 69.0% for AGIs $50k-75k, 72.5% for AGIs $75k-100k, 71.8% for AGIs $100k-200k, 72.7% for AGIs over 200k)
Averages for the 2004 tax year for zip code 90717, filed in 2005:
Average Adjusted Gross Income (AGI) in 2004: $46,583 (Individual Income Tax Returns)
Here:
$46,583
State:
$58,600
Salary/wage: $45,266 (reported on 82.9% of returns)
Here:
$45,266
State:
$49,455
(% of AGI for various income ranges: 194.1% for AGIs below $10k, 73.4% for AGIs $10k-25k, 85.2% for AGIs $25k-50k, 84.0% for AGIs $50k-75k, 84.7% for AGIs $75k-100k, 73.0% for AGIs over 100k)
Taxable interest for individuals: $1,380 (reported on 44.8% of returns)
This zip code:
$1,380
California:
$2,365
(% of AGI for various income ranges: 10.7% for AGIs below $10k, 1.8% for AGIs $10k-25k, 1.0% for AGIs $25k-50k, 1.0% for AGIs $50k-75k, 1.1% for AGIs $75k-100k, 1.6% for AGIs over 100k)
Taxable dividends: $1,854 (reported on 20.4% of returns)
Here:
$1,854
State:
$4,746
(% of AGI for various income ranges: 7.0% for AGIs below $10k, 1.0% for AGIs $10k-25k, 0.6% for AGIs $25k-50k, 0.4% for AGIs $50k-75k, 0.6% for AGIs $75k-100k, 1.1% for AGIs over 100k)
Net capital gain/loss: +$7,305 (reported on 16.4% of returns)
Here:
+$7,305
State:
+$23,418
(% of AGI for various income ranges: -9.5% for AGIs below $10k, -0.6% for AGIs $10k-25k, 0.1% for AGIs $25k-50k, 0.4% for AGIs $50k-75k, 0.8% for AGIs $75k-100k, 7.4% for AGIs over 100k)
Profit/loss from business: +$11,402 (reported on 18.5% of returns)
Here:
+$11,402
State:
+$16,826
(% of AGI for various income ranges: 27.6% for AGIs below $10k, 11.2% for AGIs $10k-25k, 4.7% for AGIs $25k-50k, 3.6% for AGIs $50k-75k, 3.1% for AGIs $75k-100k, 3.5% for AGIs over 100k)
IRA payment deduction: $3,040 (reported on 3.1% of returns)
90717:
$3,040
California:
$3,192
(% of AGI for various income ranges: 0.8% for AGIs below $10k, 0.2% for AGIs $10k-25k, 0.2% for AGIs $25k-50k, 0.2% for AGIs $50k-75k, 0.2% for AGIs $75k-100k, 0.1% for AGIs over 100k)
Self-employed pension: $10,381 (reported on 0.9% of returns)
Here:
$10,381
California:
$17,688
(% of AGI for various income ranges: 0.1% for AGIs $10k-25k, 0.2% for AGIs $25k-50k, 0.1% for AGIs $50k-75k, 0.2% for AGIs $75k-100k, 0.3% for AGIs over 100k)
Total itemized deductions: $22,383 (28% of AGI, reported on 37.7% of returns)
Here:
$22,383
State:
$28,113
Here:
27.8% of AGI
State:
25.3% of AGI
(% of AGI for various income ranges: 35.6% for AGIs below $10k, 11.0% for AGIs $10k-25k, 13.4% for AGIs $25k-50k, 18.5% for AGIs $50k-75k, 22.5% for AGIs $75k-100k, 20.1% for AGIs over 100k)
Charity contributions deductions: $2,992 (4% of AGI, reported on 33.8% of returns)
Here:
$2,992
State:
$3,923
Here:
3.6% of AGI
State:
3.3% of AGI
(% of AGI for various income ranges: 2.0% for AGIs below $10k, 0.9% for AGIs $10k-25k, 1.6% for AGIs $25k-50k, 2.2% for AGIs $50k-75k, 2.5% for AGIs $75k-100k, 2.7% for AGIs over 100k)
Total tax: $6,411 (reported on 79.1% of returns)
90717:
$6,411
State:
$10,761
(% of AGI for various income ranges: 9.1% for AGIs below $10k, 5.0% for AGIs $10k-25k, 7.3% for AGIs $25k-50k, 9.7% for AGIs $50k-75k, 10.4% for AGIs $75k-100k, 15.6% for AGIs over 100k)
Earned income credit: $1,521 (reported on 14.7% of returns)
Here:
$1,521
State:
$1,763
Percentage of individuals using paid preparers for their 2004 taxes: 68.9%
Here:
69%
State:
66%
(% for various income ranges: 63.0% for AGIs below $10k, 68.8% for AGIs $10k-25k, 68.5% for AGIs $25k-50k, 70.8% for AGIs $50k-75k, 75.4% for AGIs $75k-100k, 71.8% for AGIs over 100k)
Household received Food Stamps/SNAP in the past 12 months: 762 Household did not receive Food Stamps/SNAP in the past 12 months: 7,643
Women who had a birth in the past 12 months: 191 (174 now married, 16 unmarried) Women who did not have a birth in the past 12 months: 5,040 (1,748 now married, 3,302 unmarried)
Housing units in zip code 90717 with a mortgage: 2,474 (254 second mortgage, 138 both second mortgage and home equity loan) Houses without a mortgage: 92
Median monthly owner costs for units with a mortgage: $2,829 Median monthly owner costs for units without a mortgage: $725
Residents with income below the poverty level in 2022:
This zip code:
12.8%
Whole state:
12.2%
Residents with income below 50% of the poverty level in 2022:
This zip code:
6.1%
Whole state:
6.2%
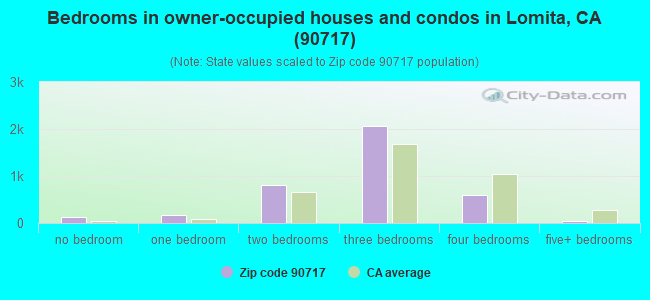
Median number of rooms in houses and condos:
Here:
5.7
State:
6.0
Median number of rooms in apartments:
Here:
3.9
State:
3.9
Notable locations in this zip code not listed on our city pages
Notable locations in zip code 90717: Los Angeles County Fire Department Station 6 (A), Lomita Railroad Museum (B), Lomita City Hall (C), Lomita Branch County of Los Angeles Public Library (D), Lomita Sheriffs Station (E). Display/hide their locations on the map
Churches in zip code 90717 include: Calvary Assembly of God Church (A), Community Bible Church (B), First Born Chapel (C), First Missionary Baptist Church of Lomita (D), Lomita Christian Church (E), Narbonne Avenue Baptist Church (F), Saint Margaret Mary Catholic Church (G), Saint Marks Presbyterian Church (H), South Bay Free Methodist Church (I). Display/hide their locations on the map
Parks in zip code 90717 include: Lomita Park (1), Hathaway Park (2), Veterans Park (3), Lomita Recreation Center (4). Display/hide their locations on the map
2,568 married couples with children.
1,002 single-parent households (242 men, 760 women).
60.6% of residents of 90717 zip code speak English at home.
22.0% of residents speak Spanish at home (65% very well, 14% well, 13% not well, 8% not at all).
4.6% of residents speak other Indo-European language at home (74% very well, 18% well, 8% not well).
11.3% of residents speak Asian or Pacific Island language at home (59% very well, 24% well, 16% not well).
1.5% of residents speak other language at home (52% very well, 32% well, 16% not well).
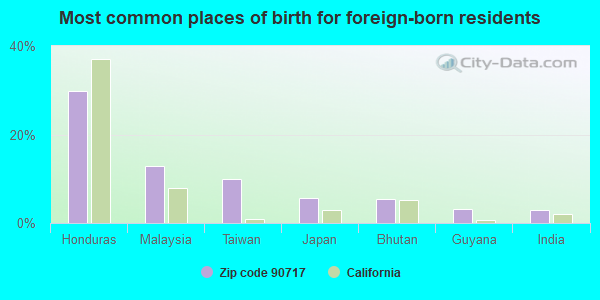
Foreign born population: 6,257 (29.0%) (58.8% of them are naturalized citizens)
This zip code:
29.0%
Whole state:
26.7%
30%Honduras
13%Malaysia
10%Taiwan
6%Japan
5%Bhutan
3%Guyana
3%India
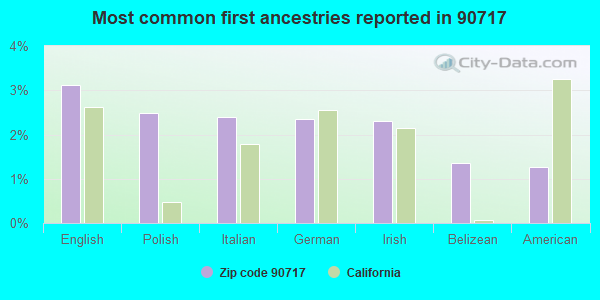
3%English
2%Polish
2%Italian
2%German
2%Irish
1%Belizean
1%American
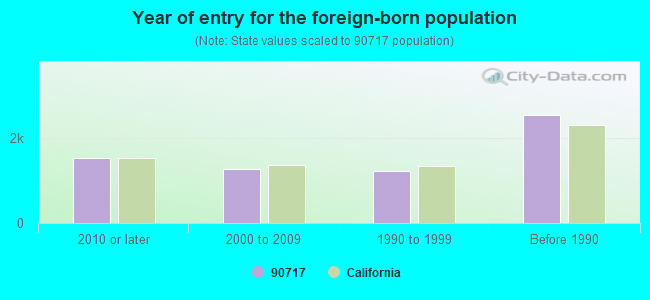
Year of entry for the foreign-born population
1,5312010 or later
1,2762000 to 2009
1,2281990 to 1999
2,548Before 1990
Major facilities with environmental interests located in this zip code:
LOS ANGELES DEPT OF WATER AND POWER (1700 W L ST LOMITA PUMPING STATION in LOMITA, CA)
STATE MASTER (California - Hazardous Waste Tracking) - HAZARDOU WASTE PROGRAM Large Quantity Generators, more that 1000 kg of hazardous waste/month (Resource Conservation and Recovery Act (tracking hazardous waste)) - notification Organizations: LOS ANGELES D W P (CONTACT/OWNER)
Alternative names: LOS ANGELES D W P LOMITA P S, LOS ANGELES DWP LOMITA PS
GASSERS GARAGE INC (2258 LOMITA BLVD in LOMITA, CA)
STATE MASTER (California - Hazardous Waste Tracking) - HAZARDOU WASTE PROGRAM Small Quantity Generators, between 100 kg and 1000 kg of hazardous waste/month (Resource Conservation and Recovery Act (tracking hazardous waste)) - notification Business NAICS classification: GENERAL AUTOMOTIVE REPAIR.
LAUSD ESHELMAN ELEM SCHOOL (25902 ESHELMAN AVE in LOMITA, CA)
STATE MASTER (California - Hazardous Waste Tracking) - HAZARDOU WASTE PROGRAM Small Quantity Generators, between 100 kg and 1000 kg of hazardous waste/month (Resource Conservation and Recovery Act (tracking hazardous waste)) - notification Alternative names: ESHELMAN AVENUE ELEMENTARY, LAUSD/ ESHELMAN AVE ELEM
ALEXANDER FLEMING MIDDLE SCHOOL (25425 WALNUT ST in LOMITA, CA)
(Geographic Names Information System) (National Center for Education Statistics) - STATE ID-6057996 Organizations: LOS ANGELES UNIFIED (SCHOOL DISTRICT)
Alternative names: FLEMING (ALEXANDER) MIDDLE
LOMITA FUNDAMENTAL CENTER ELEMENTARY (2211 W. 247TH ST. in LOMITA, CA)
(National Center for Education Statistics) - STATE ID-6017933 Organizations: LOS ANGELES UNIFIED (SCHOOL DISTRICT)
CESAR'S SHELL SVC (2477 LOMITA in LOMITA, CA)
Small Quantity Generators, between 100 kg and 1000 kg of hazardous waste/month (Resource Conservation and Recovery Act (tracking hazardous waste)) - notification Small Quantity Generators, between 100 kg and 1000 kg of hazardous waste/month (Resource Conservation and Recovery Act (tracking hazardous waste)) - notification Organizations: EQUILON ENTERPRISES L L C (CONTACT/OWNER)
, CESAR RANOLA (CONTACT/OWNER)
Alternative names: SHELL OIL CO
A 1 CLEANERS (2413 PC HWY in LOMITA, CA)
Small Quantity Generators, between 100 kg and 1000 kg of hazardous waste/month (Resource Conservation and Recovery Act (tracking hazardous waste)) - notification Organizations: ABUMUHOR EMIL M (CONTACT/OWNER)
A A AUTO CENTER (2084 W LOMITA BLVD in LOMITA, CA)
Small Quantity Generators, between 100 kg and 1000 kg of hazardous waste/month (Resource Conservation and Recovery Act (tracking hazardous waste)) - notification Organizations: SHANG F FUNG (CONTACT/OWNER)
FERRERA'S AUTO SALES (2212 1/2 PACIFIC COAST HWY in LOMITA, CA)
Small Quantity Generators, between 100 kg and 1000 kg of hazardous waste/month (Resource Conservation and Recovery Act (tracking hazardous waste)) - notification Organizations: FERRERA CHAS (CONTACT/OWNER)
GEORGE'S ARCO SVC (2031 PALOS VERDES DR N in LOMITA, CA)
Small Quantity Generators, between 100 kg and 1000 kg of hazardous waste/month (Resource Conservation and Recovery Act (tracking hazardous waste)) - notification Organizations: GEORGE SHILAOS (CONTACT/OWNER)
JOHNNYS EXCLUSIVE AUTOMOTIVE (2310 LOMITA in LOMITA, CA)
Small Quantity Generators, between 100 kg and 1000 kg of hazardous waste/month (Resource Conservation and Recovery Act (tracking hazardous waste)) - notification Organizations: JOHN S HAINES (CONTACT/OWNER)
KURT'S PORSCHE AUDI SERVICE (2472 PACIFIC COAST HWY in LOMITA, CA)
Small Quantity Generators, between 100 kg and 1000 kg of hazardous waste/month (Resource Conservation and Recovery Act (tracking hazardous waste)) - notification Organizations: LANSCHUTZER KURT (CONTACT/OWNER)
LOMITA AUTOHAUS (2330 PACIFIC COAST HWY in LOMITA, CA)
Small Quantity Generators, between 100 kg and 1000 kg of hazardous waste/month (Resource Conservation and Recovery Act (tracking hazardous waste)) - notification Organizations: LOUIS REYES (CONTACT/OWNER)
Housing units lacking complete plumbing facilities: 0.7% Housing units lacking complete kitchen facilities: 2.4%
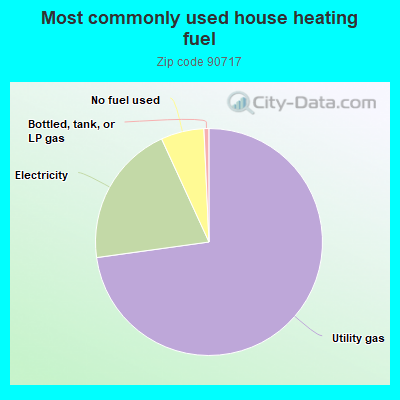
72.3%Utility gas
20.2%Electricity
6.1%No fuel used
0.7%Bottled, tank, or LP gas
Population in 1990: 19,635. Population change in the 1990s: +1,425 (+7.3%).
Place of birth for U.S.-born residents:
This state: 12,229
Northeast: 819
Midwest: 857
South: 587
West: 541
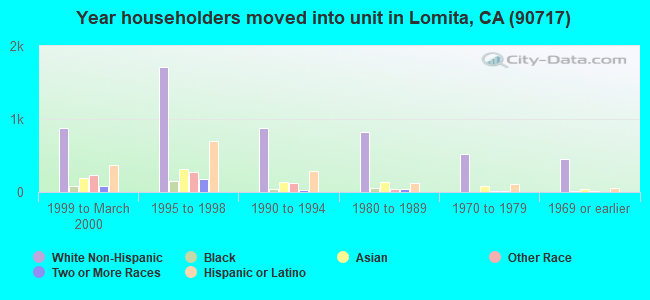
53% of the 90717 zip code residents lived in the same house 5 years ago. Out of people who lived in different houses, 89% lived in this county. Out of people who lived in different counties, 50% lived in California.
92% of the 90717 zip code residents lived in the same house 1 year ago. Out of people who lived in different houses, 75% moved from this county. Out of people who lived in different houses, 9% moved from different county within same state. Out of people who lived in different houses, 4% moved from different state. Out of people who lived in different houses, 11% moved from abroad.
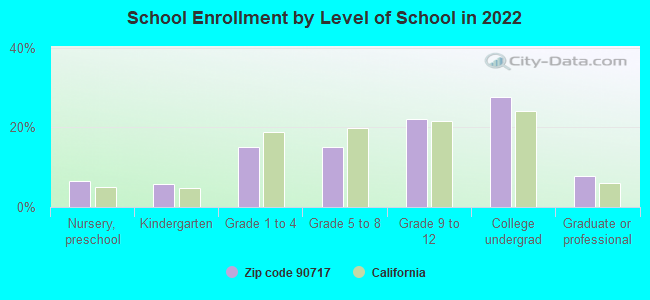
Private vs. public school enrollment:
Students in private schools in grades 1 to 8 (elementary and middle school): 341
Here:
21.8%
California:
10.5%
Students in private schools in grades 9 to 12 (high school): 198
Here:
17.3%
California:
8.5%
Students in private undergraduate colleges: 311
Here:
21.7%
California:
15.9%
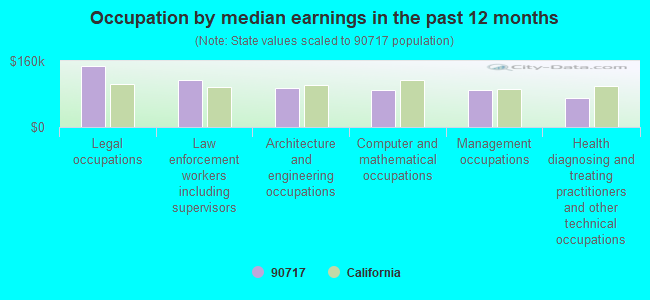
Occupation by median earnings in the past 12 months ($)
149,040Legal occupations
113,720Law enforcement workers including supervisors
95,529Architecture and engineering occupations
90,370Computer and mathematical occupations
89,443Management occupations
70,044Health diagnosing and treating practitioners and other technical occupations
Companies with federal contracts located in this zip code:
RCA COMPUTER CORPORATION (2413 PACIFIC COAST HWY in LOMITA, CA; small business) : $122,186 in 2 contractsin 2000
$122,186 with Army for Cutting Tools for Machine Tools. Signed on 2000-09-28. Completion date: 2000-09-28.
$0, same as above.Signed on 2000-09-28. Completion date: 2000-09-28.
OLD WEST WOODWORKS (25031 NARBONNE AVE. in LOMITA, CA; small business)
$99,736 with Defense Logistics Agency for Boxes, Cartons, and Crates. Signed on 2000-01-24. Completion date: 2000-08-31.
JOHN COLLVER (25843 NARBONNE AVE APT 11 in LOMITA, CA; small business) : $7,300 in 2 contractsin 2004
$3,650 with Air Force for Recreational Services. Signed on 2004-10-22. Completion date: 2004-10-31.
$3,650, same as above.Signed on 2004-04-16. Completion date: 2004-04-23.
Top industries in this zip code by the number of employees in 2005:


 Nearest zip codes: 90710, 90505, 90501, 90502, 90732, 90274.