Estimated zip code population in 2022: 18,276 Zip code population in 2010: 18,010 Zip code population in 2000: 17,038
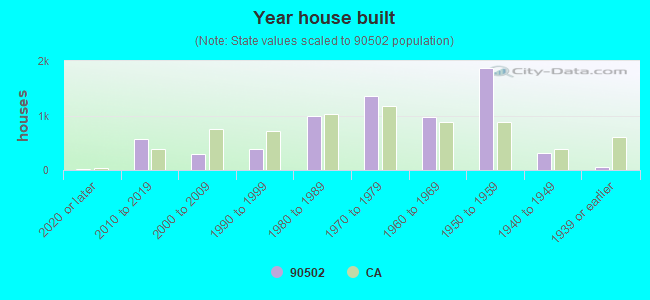
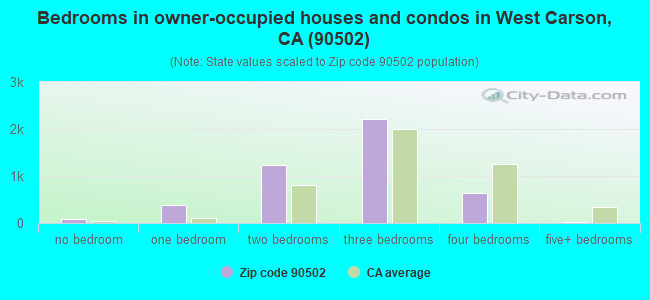
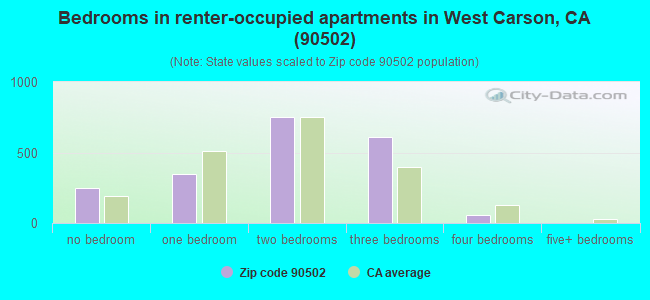
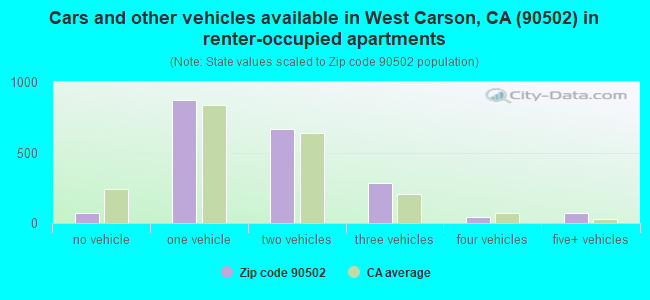
Houses and condos: 6,933 Renter-occupied apartments: 2,007
% of renters here:
31%
State:
44%
March 2022 cost of living index in zip code 90502: 131.7 (high, U.S. average is 100)
Land area: 2.2 sq. mi. Water area: 0.0 sq. mi.
Population density: 8,177 people per square mile
(high).
OSM Map
General Map
Google Map
MSN Map
OSM Map
General Map
Google Map
MSN Map
OSM Map
General Map
Google Map
MSN Map
OSM Map
General Map
Google Map
MSN Map
Please wait while loading the map...
Real estate property taxes paid for housing units in 2022:
This zip code:
0.7% ($4,573)
California:
0.7% ($4,831)
Median real estate property taxes paid for housing units with mortgages in 2022: $5,244 (0.8%) Median real estate property taxes paid for housing units with no mortgage in 2022: $3,196 (0.5%)
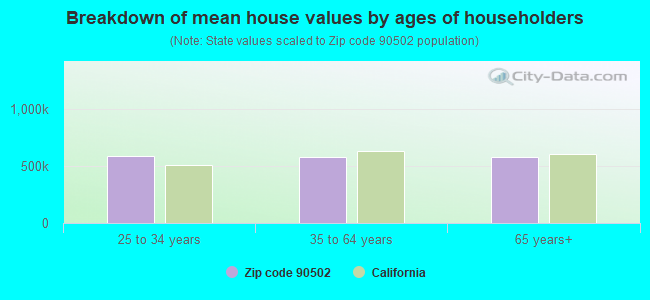
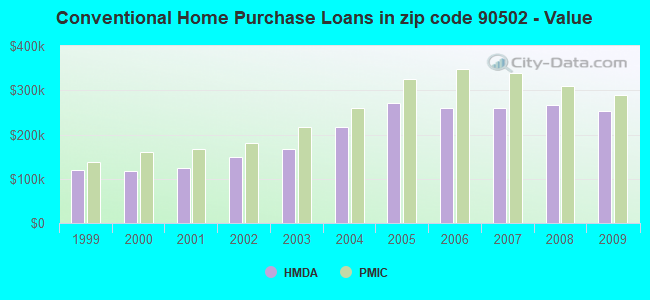
Estimated median house/condo value in 2022: $637,393
90502:
$637,393
California:
$715,900
According to our research of California and other state lists, there were 12 registered sex offenders living in 90502 zip code as of April 27, 2024. The ratio of all residents to sex offenders in zip code 90502 is 1,509 to 1. The ratio of registered sex offenders to all residents in this zip code is lower than the state average.
Median resident age:
This zip code:
42.9 years
California median age:
37.9 years
Average household size:
This zip code:
2.7 people
California:
2.8 people
Averages for the 2020 tax year for zip code 90502, filed in 2021:
Average Adjusted Gross Income (AGI) in 2020: $65,093 (Individual Income Tax Returns)
Here:
$65,093
State:
$95,910
Salary/wage: $61,195 (reported on 81.5% of returns)
Here:
$61,195
State:
$77,331
(% of AGI for various income ranges: 1175.2% for AGIs below $25k, 3971.3% for AGIs $25k-50k, 7214.5% for AGIs $50k-75k, 10620.0% for AGIs $75k-100k, 21177.8% for AGIs $100k-200k, 67328.0% for AGIs over 200k)
Taxable interest for individuals: $756 (reported on 34.4% of returns)
This zip code:
$756
California:
$2,294
(% of AGI for various income ranges: 16.6% for AGIs below $25k, 19.7% for AGIs $25k-50k, 30.9% for AGIs $50k-75k, 56.1% for AGIs $75k-100k, 84.6% for AGIs $100k-200k, 448.0% for AGIs over 200k)
Ordinary dividends: $3,162 (reported on 15.3% of returns)
Here:
$3,162
State:
$10,949
(% of AGI for various income ranges: 17.5% for AGIs below $25k, 17.2% for AGIs $25k-50k, 44.1% for AGIs $50k-75k, 66.2% for AGIs $75k-100k, 131.6% for AGIs $100k-200k, 2019.0% for AGIs over 200k)
Net capital gain/loss in AGI: +$10,186 (reported on 16.1% of returns)
Here:
+$10,186
State:
+$49,306
(% of AGI for various income ranges: 10.1% for AGIs below $25k, 20.4% for AGIs $25k-50k, 44.6% for AGIs $50k-75k, 105.2% for AGIs $75k-100k, 296.4% for AGIs $100k-200k, 11405.0% for AGIs over 200k)
Profit/loss from business: +$7,702 (reported on 18.8% of returns)
Here:
+$7,702
State:
+$15,671
(% of AGI for various income ranges: 205.2% for AGIs below $25k, 185.7% for AGIs $25k-50k, 210.9% for AGIs $50k-75k, 138.6% for AGIs $75k-100k, 346.5% for AGIs $100k-200k, 1016.0% for AGIs over 200k)
Taxable individual retirement arrangement distribution: $15,485 (reported on 5.7% of returns)
90502:
$15,485
California:
$23,505
(% of AGI for various income ranges: 47.1% for AGIs below $25k, 68.8% for AGIs $25k-50k, 145.5% for AGIs $50k-75k, 216.8% for AGIs $75k-100k, 335.1% for AGIs $100k-200k, 690.0% for AGIs over 200k)
Self-employed (Keogh) retirement plans: $19,950 (reported on 0.2% of returns)
90502:
$19,950
California:
$30,163
(% of AGI for various income ranges: 38.7% for AGIs $50k-75k)
Total itemized deductions: $28,885 (reported on 16.3% of returns)
Here:
$28,885
State:
$39,517
(% of AGI for various income ranges: 69.0% for AGIs below $25k, 234.2% for AGIs $25k-50k, 580.8% for AGIs $50k-75k, 1094.8% for AGIs $75k-100k, 2305.0% for AGIs $100k-200k, 7354.0% for AGIs over 200k)
Charity contributions: $5,367 (reported on 13.3% of returns)
Here:
$5,367
State:
$12,598
(% of AGI for various income ranges: 3.1% for AGIs below $25k, 24.8% for AGIs $25k-50k, 81.2% for AGIs $50k-75k, 154.2% for AGIs $75k-100k, 334.0% for AGIs $100k-200k, 1722.0% for AGIs over 200k)
Taxes paid: $8,610 (reported on 16.3% of returns)
90502:
$8,610
State:
$8,807
(% of AGI for various income ranges: 16.7% for AGIs below $25k, 64.8% for AGIs $25k-50k, 175.6% for AGIs $50k-75k, 374.3% for AGIs $75k-100k, 728.1% for AGIs $100k-200k, 1660.0% for AGIs over 200k)
Earned income credit: $1,784 (reported on 13.4% of returns)
Here:
$1,784
State:
$2,074
(% of AGI for various income ranges: 78.7% for AGIs below $25k, 50.9% for AGIs $25k-50k)
Percentage of individuals using paid preparers for their 2020 taxes: 91.6%
Here:
92%
State:
92%
(% for various income ranges: 90.9% for AGIs below $25k, 92.3% for AGIs $25k-50k, 91.9% for AGIs $50k-75k, 90.4% for AGIs $75k-100k, 92.1% for AGIs $100k-200k, 93.8% for AGIs over 200k)
Averages for the 2012 tax year for zip code 90502, filed in 2013:
Average Adjusted Gross Income (AGI) in 2012: $53,138 (Individual Income Tax Returns)
Here:
$53,138
State:
$72,726
Salary/wage: $51,360 (reported on 84.1% of returns)
Here:
$51,360
State:
$59,079
(% of AGI for various income ranges: 74.1% for AGIs below $25k, 83.7% for AGIs $25k-50k, 85.2% for AGIs $50k-75k, 85.2% for AGIs $75k-100k, 85.2% for AGIs $100k-200k, 60.3% for AGIs over 200k)
Taxable interest for individuals: $604 (reported on 34.9% of returns)
This zip code:
$604
California:
$2,146
(% of AGI for various income ranges: 0.7% for AGIs below $25k, 0.4% for AGIs $25k-50k, 0.4% for AGIs $50k-75k, 0.3% for AGIs $75k-100k, 0.3% for AGIs $100k-200k, 0.6% for AGIs over 200k)
Ordinary dividends: $3,154 (reported on 12.3% of returns)
Here:
$3,154
State:
$9,308
(% of AGI for various income ranges: 0.5% for AGIs below $25k, 0.3% for AGIs $25k-50k, 0.3% for AGIs $50k-75k, 0.3% for AGIs $75k-100k, 0.6% for AGIs $100k-200k, 3.1% for AGIs over 200k)
Net capital gain/loss in AGI: +$8,354 (reported on 9.0% of returns)
Here:
+$8,354
State:
+$30,460
(% of AGI for various income ranges: 0.3% for AGIs $100k-200k, 12.7% for AGIs over 200k)
Profit/loss from business: +$9,680 (reported on 17.0% of returns)
Here:
+$9,680
State:
+$17,064
(% of AGI for various income ranges: 13.4% for AGIs below $25k, 4.5% for AGIs $25k-50k, 1.9% for AGIs $50k-75k, 1.0% for AGIs $75k-100k, 1.3% for AGIs $100k-200k, 2.5% for AGIs over 200k)
Taxable individual retirement arrangement distribution: $14,460 (reported on 6.7% of returns)
90502:
$14,460
California:
$19,557
(% of AGI for various income ranges: 2.3% for AGIs below $25k, 1.4% for AGIs $25k-50k, 1.7% for AGIs $50k-75k, 2.0% for AGIs $75k-100k, 2.5% for AGIs $100k-200k)
Total itemized deductions: $24,471 (28% of AGI, reported on 40.2% of returns)
Here:
$24,471
State:
$34,004
Here:
27.8% of AGI
State:
22.7% of AGI
(% of AGI for various income ranges: 10.9% for AGIs below $25k, 14.9% for AGIs $25k-50k, 19.0% for AGIs $50k-75k, 19.6% for AGIs $75k-100k, 20.3% for AGIs $100k-200k, 23.1% for AGIs over 200k)
Charity contributions: $2,925 (reported on 33.3% of returns)
Here:
$2,925
State:
$4,659
(% of AGI for various income ranges: 0.6% for AGIs below $25k, 1.4% for AGIs $25k-50k, 2.2% for AGIs $50k-75k, 2.0% for AGIs $75k-100k, 2.2% for AGIs $100k-200k, 1.9% for AGIs over 200k)
Taxes paid: $7,931 (reported on 40.2% of returns)
90502:
$7,931
State:
$14,448
(% of AGI for various income ranges: 2.2% for AGIs below $25k, 3.4% for AGIs $25k-50k, 5.4% for AGIs $50k-75k, 6.5% for AGIs $75k-100k, 7.6% for AGIs $100k-200k, 9.4% for AGIs over 200k)
Earned income credit: $2,084 (reported on 17.3% of returns)
Here:
$2,084
State:
$2,286
(% of AGI for various income ranges: 5.8% for AGIs below $25k, 1.0% for AGIs $25k-50k)
Percentage of individuals using paid preparers for their 2012 taxes: 69.4%
Here:
69%
State:
64%
(% for various income ranges: 68.5% for AGIs below $25k, 69.1% for AGIs $25k-50k, 69.8% for AGIs $50k-75k, 69.5% for AGIs $75k-100k, 71.1% for AGIs $100k-200k, 76.9% for AGIs over 200k)
Averages for the 2004 tax year for zip code 90502, filed in 2005:
Average Adjusted Gross Income (AGI) in 2004: $44,419 (Individual Income Tax Returns)
Here:
$44,419
State:
$58,600
Salary/wage: $44,225 (reported on 85.4% of returns)
Here:
$44,225
State:
$49,455
(% of AGI for various income ranges: 183.8% for AGIs below $10k, 76.6% for AGIs $10k-25k, 87.5% for AGIs $25k-50k, 86.5% for AGIs $50k-75k, 87.5% for AGIs $75k-100k, 80.6% for AGIs over 100k)
Taxable interest for individuals: $747 (reported on 45.4% of returns)
This zip code:
$747
California:
$2,365
(% of AGI for various income ranges: 5.9% for AGIs below $10k, 1.3% for AGIs $10k-25k, 0.6% for AGIs $25k-50k, 0.8% for AGIs $50k-75k, 0.6% for AGIs $75k-100k, 0.7% for AGIs over 100k)
Taxable dividends: $980 (reported on 14.8% of returns)
Here:
$980
State:
$4,746
(% of AGI for various income ranges: 2.8% for AGIs below $10k, 0.5% for AGIs $10k-25k, 0.3% for AGIs $25k-50k, 0.3% for AGIs $50k-75k, 0.3% for AGIs $75k-100k, 0.3% for AGIs over 100k)
Net capital gain/loss: +$4,715 (reported on 12.2% of returns)
Here:
+$4,715
State:
+$23,418
(% of AGI for various income ranges: -1.4% for AGIs below $10k, -0.1% for AGIs $10k-25k, -0.2% for AGIs $25k-50k, 0.3% for AGIs $50k-75k, 0.5% for AGIs $75k-100k, 4.2% for AGIs over 100k)
Profit/loss from business: +$9,835 (reported on 15.9% of returns)
Here:
+$9,835
State:
+$16,826
(% of AGI for various income ranges: 30.3% for AGIs below $10k, 9.1% for AGIs $10k-25k, 3.7% for AGIs $25k-50k, 2.4% for AGIs $50k-75k, 2.8% for AGIs $75k-100k, 2.1% for AGIs over 100k)
IRA payment deduction: $2,954 (reported on 2.8% of returns)
90502:
$2,954
California:
$3,192
(% of AGI for various income ranges: 0.2% for AGIs $10k-25k, 0.3% for AGIs $25k-50k, 0.2% for AGIs $50k-75k, 0.2% for AGIs $75k-100k, 0.1% for AGIs over 100k)
Self-employed pension: $10,800 (reported on 0.5% of returns)
Here:
$10,800
California:
$17,688
(% of AGI for various income ranges: 0.2% for AGIs $50k-75k, 0.2% for AGIs $75k-100k, 0.2% for AGIs over 100k)
Total itemized deductions: $20,384 (29% of AGI, reported on 43.7% of returns)
Here:
$20,384
State:
$28,113
Here:
29.1% of AGI
State:
25.3% of AGI
(% of AGI for various income ranges: 28.2% for AGIs below $10k, 11.9% for AGIs $10k-25k, 19.4% for AGIs $25k-50k, 22.1% for AGIs $50k-75k, 23.7% for AGIs $75k-100k, 19.2% for AGIs over 100k)
Charity contributions deductions: $2,796 (4% of AGI, reported on 38.1% of returns)
Here:
$2,796
State:
$3,923
Here:
3.9% of AGI
State:
3.3% of AGI
(% of AGI for various income ranges: 1.5% for AGIs below $10k, 1.2% for AGIs $10k-25k, 2.2% for AGIs $25k-50k, 2.7% for AGIs $50k-75k, 2.9% for AGIs $75k-100k, 2.4% for AGIs over 100k)
Total tax: $5,800 (reported on 77.1% of returns)
90502:
$5,800
State:
$10,761
(% of AGI for various income ranges: 8.5% for AGIs below $10k, 4.2% for AGIs $10k-25k, 6.4% for AGIs $25k-50k, 8.9% for AGIs $50k-75k, 10.4% for AGIs $75k-100k, 15.6% for AGIs over 100k)
Earned income credit: $1,588 (reported on 14.8% of returns)
Here:
$1,588
State:
$1,763
Percentage of individuals using paid preparers for their 2004 taxes: 70.2%
Here:
70%
State:
66%
(% for various income ranges: 62.1% for AGIs below $10k, 71.4% for AGIs $10k-25k, 70.1% for AGIs $25k-50k, 73.1% for AGIs $50k-75k, 71.3% for AGIs $75k-100k, 75.9% for AGIs over 100k)
Likely homosexual households (counted as self-reported same-sex unmarried-partner households)
Lesbian couples: 0.1% of all households
Gay men: 0.2% of all households
Household received Food Stamps/SNAP in the past 12 months: 285 Household did not receive Food Stamps/SNAP in the past 12 months: 6,167
Women who had a birth in the past 12 months: 148 (80 now married, 69 unmarried) Women who did not have a birth in the past 12 months: 3,991 (1,553 now married, 2,439 unmarried)
Housing units in zip code 90502 with a mortgage: 3,082 (140 second mortgage, 95 both second mortgage and home equity loan) Houses without a mortgage: 165
Median monthly owner costs for units with a mortgage: $2,330 Median monthly owner costs for units without a mortgage: $587
Residents with income below the poverty level in 2022:
This zip code:
10.1%
Whole state:
12.2%
Residents with income below 50% of the poverty level in 2022:
This zip code:
6.3%
Whole state:
6.2%
Median number of rooms in houses and condos:
Here:
5.1
State:
6.0
Median number of rooms in apartments:
Here:
4.0
State:
3.9
Notable locations in this zip code not listed on our city pages
1,467 married couples with children.
539 single-parent households (133 men, 406 women).
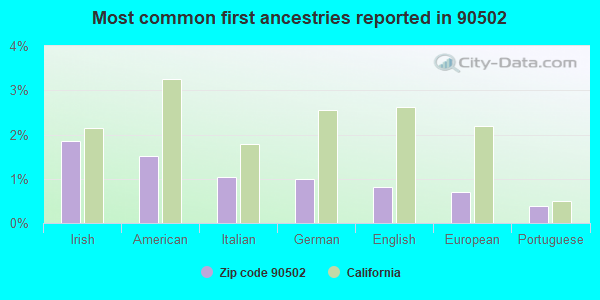
40.9% of residents of 90502 zip code speak English at home.
29.1% of residents speak Spanish at home (57% very well, 24% well, 16% not well, 3% not at all).
2.9% of residents speak other Indo-European language at home (73% very well, 24% well, 3% not well).
27.7% of residents speak Asian or Pacific Island language at home (54% very well, 31% well, 13% not well, 1% not at all).
0.2% of residents speak other language at home (67% very well, 33% well).
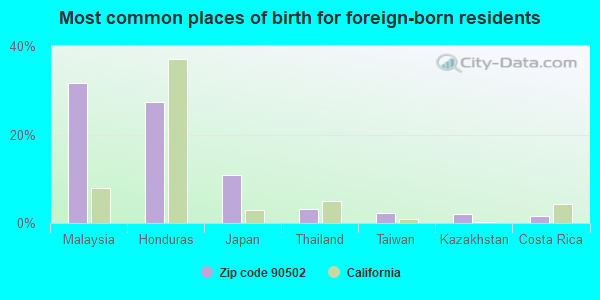
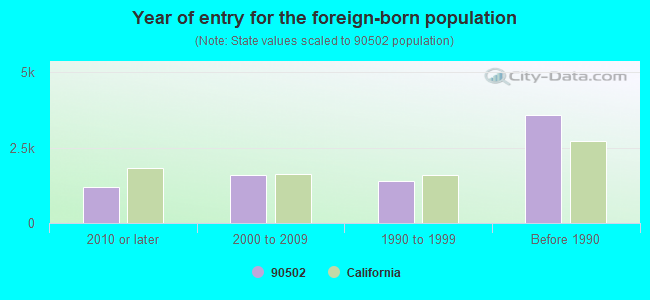
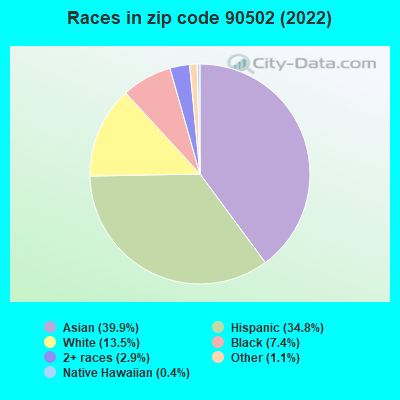
Foreign born population: 7,465 (40.8%) (68.8% of them are naturalized citizens)
Major facilities with environmental interests located in this zip code:
GERON FURNITURE INCORPORATED (19808 SOUTH NORMANDIE AVENUE in TORRANCE, CA)
(Integrated Compliance Information System) - ICIS-09-1994-0062, FORMAL ENFORCEMENT ACTION COMPLIANCE ACTIVITY (Tracking inspections of insecticide, fungicide, and rodenticide, and toxic substances) CRITERIA AND HAZARDOUS AIR POLLUTANT INVENTORY (Inventory of air pollution sources) HAZARDOUS WASTE BIENNIAL REPORTER (Resource Conservation and Recovery Act (tracking hazardous waste)) Large Quantity Generators, more that 1000 kg of hazardous waste/month (Resource Conservation and Recovery Act (tracking hazardous waste)) (Resource Conservation and Recovery Act (tracking hazardous waste)) TRI REPORTER (Tracking of toxic chemicals releasing facilities) Business SIC classification: WOOD OFFICE AND STORE FIXTURES, PARTITIONS, SHELVING, AND LOCKERS Business NAICS classification: NONUPHOLSTERED WOOD HOUSEHOLD FURNITURE MANUFACTURING. Organizations: LEGGETT & PLATT INCORPORATED (CONTACT/OWNER)
MONTROSE CHEMICAL CORPORATION (20201 SOUTH NORMANDIE AVENUE in TORRANCE, CA)
SUPERFUND NPL (Superfund database) (Integrated Compliance Information System) - ICIS-09-1997-0009, FORMAL ENFORCEMENT ACTION, ICIS-09-1990-0012, ICIS-09-1997-0048, ICIS-09-1998-0169, ICIS-09-2006-0025, ENFORCEMENT/COMPLIANCE ACTIVITY, ICIS-09-2003-0060, FORMAL ENFORCEMENT ACTION, ICIS-09-2003-0114, Large Quantity Generators, more that 1000 kg of hazardous waste/month (Resource Conservation and Recovery Act (tracking hazardous waste)) Large Quantity Generators, more that 1000 kg of hazardous waste/month (Resource Conservation and Recovery Act (tracking hazardous waste)) - notification Business SIC classification: INDUSTRIAL ORGANIC CHEMICALS; PESTICIDES AND AGRICULTURAL CHEMICALS; FARM SUPPLIES Organizations: MONTROSE CHEMICAL CORP. OF CALIFORNIA (CONTACT/OPERATOR)
, U S E P A (CONTACT/OWNER)
Alternative names: MONTROSE CHEM CORP OF CA, U S E P A MONTROSE SUPERFUND SITE
AMERICAN POLYSTYRENE CORPORATION (1225 WEST 196TH STREET in TORRANCE, CA)
STATE MASTER (California - Hazardous Waste Tracking) - HAZARDOU WASTE PROGRAM CRITERIA AND HAZARDOUS AIR POLLUTANT INVENTORY (Inventory of air pollution sources) Large Quantity Generators, more that 1000 kg of hazardous waste/month (Resource Conservation and Recovery Act (tracking hazardous waste)) TRI REPORTER (Tracking of toxic chemicals releasing facilities) Business SIC classification: INDUSTRIAL INORGANIC CHEMICALS; PLASTICS MATERIALS, SYNTHETIC RESINS, AND NONVULCANIZABLE ELASTOMERS Business NAICS classification: PLASTICS MATERIAL AND RESIN MANUFACTURING.; PLASTICS MATERIAL AND RESIN MANUFACTURING.
ACE CLEARWATER ENTERPRISES (19815 MAGELLAN DR in TORRANCE, CA)
STATE MASTER (California - Hazardous Waste Tracking) - HAZARDOU WASTE PROGRAM CRITERIA AND HAZARDOUS AIR POLLUTANT INVENTORY (Inventory of air pollution sources) HAZARDOUS WASTE BIENNIAL REPORTER (Resource Conservation and Recovery Act (tracking hazardous waste)) Small Quantity Generators, between 100 kg and 1000 kg of hazardous waste/month (Resource Conservation and Recovery Act (tracking hazardous waste)) Business SIC classification: POTATO CHIPS, CORN CHIPS, AND SIMILAR SNACKS; AIRCRAFT PARTS AND AUXILIARY EQUIPMENT Business NAICS classification: OTHER AIRCRAFT PARTS AND AUXILIARY EQUIPMENT MANUFACTURING.
HOUSING AUTHORITY CITY LA (19600 HAMILTON in TORRANCE, CA)
STATE MASTER (California - Hazardous Waste Tracking) - HAZARDOU WASTE PROGRAM HAZARDOUS WASTE BIENNIAL REPORTER (Resource Conservation and Recovery Act (tracking hazardous waste)) Small Quantity Generators, between 100 kg and 1000 kg of hazardous waste/month (Resource Conservation and Recovery Act (tracking hazardous waste))
ECOLOGY CONTROL INDUSTRIES (20846 S NORMANDIE AVE in TORRANCE, CA)
STATE MASTER (California - Hazardous Waste Tracking) - HAZARDOU WASTE PROGRAM Small Quantity Generators, between 100 kg and 1000 kg of hazardous waste/month (Resource Conservation and Recovery Act (tracking hazardous waste)) - notification TRI REPORTER (Tracking of toxic chemicals releasing facilities) Business SIC classification: PAINTS, VARNISHES, LACQUERS, ENAMELS, AND ALLIED PRODUCTS Organizations: ECOLOGY CONTROL INDUSTRY (CONTACT/OWNER)
Alternative names: AKZO COATINGS INC.
AERO ARC (22433 SOUTH VERMONT AVENUE in TORRANCE, CA)
STATE MASTER (California - Hazardous Waste Tracking) - HAZARDOU WASTE PROGRAM Small Quantity Generators, between 100 kg and 1000 kg of hazardous waste/month (Resource Conservation and Recovery Act (tracking hazardous waste)) - notification Alternative names: L K OVERSEAS INC
ANACOMP INC (19701 S HAMILTON AVE in TORRANCE, CA)
STATE MASTER (California - Hazardous Waste Tracking) - HAZARDOU WASTE PROGRAM Small Quantity Generators, between 100 kg and 1000 kg of hazardous waste/month (Resource Conservation and Recovery Act (tracking hazardous waste)) - notification
EFFECTIVE GRAPHICS (19515 S VERMONT AVE in TORRANCE, CA)
STATE MASTER (California - Hazardous Waste Tracking) - HAZARDOU WASTE PROGRAM Small Quantity Generators, between 100 kg and 1000 kg of hazardous waste/month (Resource Conservation and Recovery Act (tracking hazardous waste)) - notification Organizations: ROGER J SANDERS (CONTACT/OWNER)
HARBOR UCLA DIAGNOSTIC IMAGING (21828 S NORMANDIE AVE in TORRANCE, CA)
(Resource Conservation and Recovery Act (tracking hazardous waste)) Large Quantity Generators, more that 1000 kg of hazardous waste/month (Resource Conservation and Recovery Act (tracking hazardous waste)) Organizations: AMERICAN HEALTH SERVICES CORP (CONTACT/OWNER)
, SHARON SPERRY (CONTACT/OWNER)
Alternative names: HARBORUCLA PROFESSIONAL BLDG
NIFEC INC (23230 S NORMANDIE AVE in TORRANCE, CA)
STATE MASTER (California - Hazardous Waste Tracking) - HAZARDOU WASTE PROGRAM Small Quantity Generators, between 100 kg and 1000 kg of hazardous waste/month (Resource Conservation and Recovery Act (tracking hazardous waste)) Business NAICS classification: SEMICONDUCTOR AND RELATED DEVICE MANUFACTURING.
MEYLER STREET ELEMENTARY (1123 W. 223RD ST. in TORRANCE, CA)
(National Center for Education Statistics) - STATE ID-6018147 Organizations: LOS ANGELES UNIFIED (SCHOOL DISTRICT)
FIBRE GLAS FIN CO (23112 S. MARIPOSA AVE. in TORRANCE, CA)
CRITERIA AND HAZARDOUS AIR POLLUTANT INVENTORY (Inventory of air pollution sources) Small Quantity Generators, between 100 kg and 1000 kg of hazardous waste/month (Resource Conservation and Recovery Act (tracking hazardous waste)) TRI REPORTER (Tracking of toxic chemicals releasing facilities) Business SIC classification: MANUFACTURING INDUSTRIES; ROOFING, SIDING, AND INSULATION MATERIALS Organizations: MICHAEL G STAVRUS (CONTACT/OWNER)
Alternative names: FIBRE GLASS FIN CO
Housing units lacking complete plumbing facilities: 0.3% Housing units lacking complete kitchen facilities: 2.9%
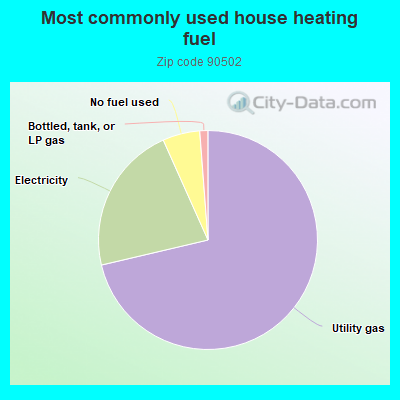
71.4%Utility gas
22.0%Electricity
5.5%No fuel used
1.2%Bottled, tank, or LP gas
Population in 1990: 15,963. Population change in the 1990s: +1,075 (+6.7%).
Place of birth for U.S.-born residents:
This state: 8,821
Northeast: 356
Midwest: 420
South: 350
West: 492
58% of the 90502 zip code residents lived in the same house 5 years ago. Out of people who lived in different houses, 88% lived in this county. Out of people who lived in different counties, 50% lived in California.
89% of the 90502 zip code residents lived in the same house 1 year ago. Out of people who lived in different houses, 73% moved from this county. Out of people who lived in different houses, 4% moved from different county within same state. Out of people who lived in different houses, 15% moved from different state. Out of people who lived in different houses, 6% moved from abroad.
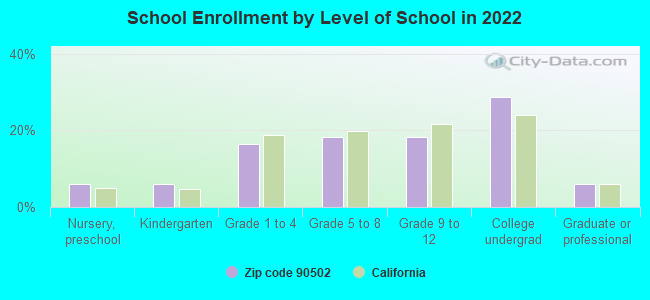
Private vs. public school enrollment:
Students in private schools in grades 1 to 8 (elementary and middle school): 85
Here:
7.2%
California:
10.5%
Students in private schools in grades 9 to 12 (high school): 32
Here:
5.2%
California:
8.5%
Students in private undergraduate colleges: 204
Here:
20.7%
California:
15.9%
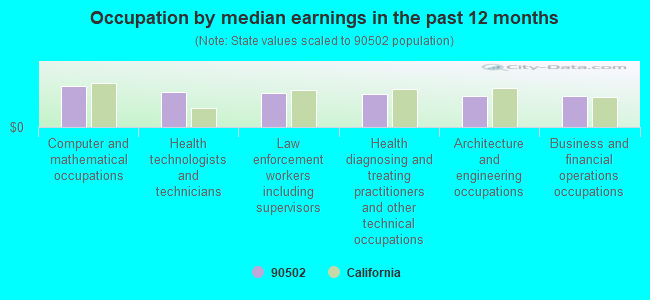
Occupation by median earnings in the past 12 months ($)
108,617Computer and mathematical occupations
92,972Health technologists and technicians
90,665Law enforcement workers including supervisors
88,459Health diagnosing and treating practitioners and other technical occupations
83,072Architecture and engineering occupations
82,935Business and financial operations occupations
Companies with federal contracts located in this zip code (TORRANCE, CA):
ACE CLEARWATER ENTERPRISES, IN (19815 MAGELLAN DR; small business) 1000 employees, $0 revenue. : $7,159,378 in 10 contractsfrom 2003 to 2006
Contracts for Miscellaneous Engine Accessories, Aircraft, Gas Turbines and Jet Engines, Aircraft; Prime Moving, and Components, Airframe Structural Components, Pipe, Tube and Rigid Tubing, and moreby Army, Defense Logistics Agency Signed by year:2000: $0; 2001: $0; 2002: $0; 2003: $6,232,398; 2004: $597,560; 2005: $269,570; 2006: $59,850.
Biggest contracts:
$5,985,960 with Army for Miscellaneous Engine Accessories, Aircraft. Signed on 2003-03-28. Completion date: 2004-04-05.
$326,800 with Army for Gas Turbines and Jet Engines, Aircraft; Prime Moving, and Components. Signed on 2004-09-29. Completion date: 2008-09-30.
$264,990, same as above.Signed on 2005-08-04. Completion date: 2008-09-30.
$246,438, same as above.Signed on 2003-12-18. Completion date: 2008-09-30.
DESKTALK SYSTEMS, INC (19191 S VERMONT AVENUE; small business) : $275,345 in 3 contractsfrom 1999 to 2001
$150,950 with Air Force for ADP Input/Output and Storage Devices. Signed on 2001-08-15. Completion date: 2001-08-02.
$62,810 with Navy for ADP Support Equipment. Taking place in DC. Signed on 1999-11-08. Completion date: 1999-12-20.
$61,585, same as above.Signed on 1999-11-30. Completion date: 1999-12-20.
SONIC INDUSTRIES INC (20030 S NORMANDIE AVE) : $193,759 in 8 contractsfrom 2002 to 2006
Contracts for Bolts, Hardware, Commercial, Nails, Machine Keys, and Pins by Defense Logistics Agency, Navy Signed by year:2000: $0; 2001: $0; 2002: $89,600; 2003: $0; 2004: $17,379; 2005: $35,980; 2006: $50,800.
Biggest contracts:
$89,600 with Defense Logistics Agency for Bolts. Taking place in CT. Signed on 2002-03-01. Completion date: 2002-06-01.
$50,800 with Defense Logistics Agency for Bolts. Signed on 2006-05-01. Completion date: 2006-09-30.
$32,980, same as above.Signed on 2005-02-11. Completion date: 2005-07-01.
$5,504 with Navy for Hardware, Commercial. Signed on 2004-12-07. Completion date: 2005-04-21.
TECHNICAL FABRICATION (22122 SOUTH VERMONT AVE U; small business) 50 employees, $0 revenue. Small Disadvantaged Business, Woman Owned Business: $159,316 in 4 contractsfrom 2003 to 2004
$55,270 with Navy for Miscellaneous Aircraft Accessories and Components. Signed on 2003-02-21. Completion date: 2003-12-26.
$46,736 with Navy for Aircraft Launching Equipment. Signed on 2004-03-31. Completion date: 2004-11-24.
$45,310 with Defense Logistics Agency for Hose, Pipe, Tube, Lubrication, and Railing Fittings. Signed on 2004-10-15. Completion date: 2005-01-15.
$12,000 with Navy for Miscellaneous Aircraft Accessories and Components. Signed on 2004-08-05. Completion date: 2004-08-09.
RUSHER AIR CONDITIONING (19626 S. NORMANDIE AVE.; small business)
$50,000 with Air Force for Maintenance, Repair or Alteration of Real Property -- Electronic and Communications Facilities. Taking place in HI. Signed on 2000-04-21. Completion date: 2000-05-15.
REMCO EQUIPMENT & SUPPLY, INC (19800 NORMANDIE AVE; small business) : $24,077 in 2 contractsin 2004
$16,466 with Navy for Hand Tools, Nonedged, Nonpowered. Signed on 2004-09-29. Completion date: 2004-10-13.
$7,611 with Navy for Pipe, Tube and Rigid Tubing. Signed on 2004-06-16. Completion date: 2004-06-24.
FULTON FINDINGS (1251 W SEPULVEDA BLVD #8; small business) : $22,478 in 2 contractsin 2005
$17,976 with Navy for Educational Services. Signed on 2005-07-22. Completion date: 2005-08-04.
$4,502 with Navy for Maintenance, Repair and Rebuilding of Equipment -- Automatic Data Processing Equipment (Including Firmware), Software, Supplies and Support Equipment. Signed on 2005-06-07. Completion date: 2006-05-31.
TOTALEXPO INC (22425 S VERMONT AVE; small business) : $21,917 in 2 contractsfrom 2004 to 2005
$14,885 with Army for Construction of Structures and Facilities -- Conference Space and Facilities. Signed on 2004-09-03. Completion date: 2004-10-10.
$7,032 with Army for Miscellaneous Furniture and Fixtures. Signed on 2005-09-26. Completion date: 2005-10-08.
STANDARD COMMUNICATIONS CORP (1111 KNOX STREET; small business)
$8,670 with Department of Defense for Antennas, Waveguides, and Related Equipment. Signed on 2003-04-30. Completion date: 2003-05-13.
Top industries in this zip code by the number of employees in 2005:
Health Care and Social Assistance: Offices of Physicians (except Mental Health Specialists) (500-999 employees: 1 establishment, 50-99 employees: 1 establishment, 5-9 employees: 1 establishment, 1-4 employees: 3 establishments)
Professional, Scientific, and Technical Services: Research and Development in the Physical, Engineering, and Life Sciences (500-999: 1, 10-19: 1, 5-9: 1, 1-4: 1)
Administrative and Support and Waste Management and Remediation Services: Facilities Support Services (500-999: 1)
Health Care and Social Assistance: Nursing Care Facilities (100-249: 3)
Wholesale Trade: Other Grocery and Related Products Merchant Wholesalers (250-499: 1, 20-49: 2)


 Nearest zip codes: 90501, 90745, 90710, 90248, 90717, 90746.