Lomita, California Submit your own pictures of this city and show them to the world
OSM Map
General Map
Google Map
MSN Map
OSM Map
General Map
Google Map
MSN Map
OSM Map
General Map
Google Map
MSN Map
OSM Map
General Map
Google Map
MSN Map
Please wait while loading the map...
Population in 2022: 20,053 (100% urban, 0% rural). Population change since 2000: +0.0%Males: 9,834 Females: 10,219
March 2022 cost of living index in Lomita: 141.1 (very high, U.S. average is 100) Percentage of residents living in poverty in 2022: 12.1%for White Non-Hispanic residents , 32.0% for Black residents , 14.7% for Hispanic or Latino residents , 32.4% for American Indian residents , 4.6% for other race residents , 6.0% for two or more races residents )
Profiles of local businesses
Business Search - 14 Million verified businesses
Data:
Median household income ($)
Median household income (% change since 2000)
Household income diversity
Ratio of average income to average house value (%)
Ratio of average income to average rent
Median household income ($) - White
Median household income ($) - Black or African American
Median household income ($) - Asian
Median household income ($) - Hispanic or Latino
Median household income ($) - American Indian and Alaska Native
Median household income ($) - Multirace
Median household income ($) - Other Race
Median household income for houses/condos with a mortgage ($)
Median household income for apartments without a mortgage ($)
Races - White alone (%)
Races - White alone (% change since 2000)
Races - Black alone (%)
Races - Black alone (% change since 2000)
Races - American Indian alone (%)
Races - American Indian alone (% change since 2000)
Races - Asian alone (%)
Races - Asian alone (% change since 2000)
Races - Hispanic (%)
Races - Hispanic (% change since 2000)
Races - Native Hawaiian and Other Pacific Islander alone (%)
Races - Native Hawaiian and Other Pacific Islander alone (% change since 2000)
Races - Two or more races (%)
Races - Two or more races (% change since 2000)
Races - Other race alone (%)
Races - Other race alone (% change since 2000)
Racial diversity
Unemployment (%)
Unemployment (% change since 2000)
Unemployment (%) - White
Unemployment (%) - Black or African American
Unemployment (%) - Asian
Unemployment (%) - Hispanic or Latino
Unemployment (%) - American Indian and Alaska Native
Unemployment (%) - Multirace
Unemployment (%) - Other Race
Population density (people per square mile)
Population - Males (%)
Population - Females (%)
Population - Males (%) - White
Population - Males (%) - Black or African American
Population - Males (%) - Asian
Population - Males (%) - Hispanic or Latino
Population - Males (%) - American Indian and Alaska Native
Population - Males (%) - Multirace
Population - Males (%) - Other Race
Population - Females (%) - White
Population - Females (%) - Black or African American
Population - Females (%) - Asian
Population - Females (%) - Hispanic or Latino
Population - Females (%) - American Indian and Alaska Native
Population - Females (%) - Multirace
Population - Females (%) - Other Race
Coronavirus confirmed cases (Apr 27, 2024)
Deaths caused by coronavirus (Apr 27, 2024)
Coronavirus confirmed cases (per 100k population) (Apr 27, 2024)
Deaths caused by coronavirus (per 100k population) (Apr 27, 2024)
Daily increase in number of cases (Apr 27, 2024)
Weekly increase in number of cases (Apr 27, 2024)
Cases doubled (in days) (Apr 27, 2024)
Hospitalized patients (Apr 18, 2022)
Negative test results (Apr 18, 2022)
Total test results (Apr 18, 2022)
COVID Vaccine doses distributed (per 100k population) (Sep 19, 2023)
COVID Vaccine doses administered (per 100k population) (Sep 19, 2023)
COVID Vaccine doses distributed (Sep 19, 2023)
COVID Vaccine doses administered (Sep 19, 2023)
Likely homosexual households (%)
Likely homosexual households (% change since 2000)
Likely homosexual households - Lesbian couples (%)
Likely homosexual households - Lesbian couples (% change since 2000)
Likely homosexual households - Gay men (%)
Likely homosexual households - Gay men (% change since 2000)
Cost of living index
Median gross rent ($)
Median contract rent ($)
Median monthly housing costs ($)
Median house or condo value ($)
Median house or condo value ($ change since 2000)
Mean house or condo value by units in structure - 1, detached ($)
Mean house or condo value by units in structure - 1, attached ($)
Mean house or condo value by units in structure - 2 ($)
Mean house or condo value by units in structure by units in structure - 3 or 4 ($)
Mean house or condo value by units in structure - 5 or more ($)
Mean house or condo value by units in structure - Boat, RV, van, etc. ($)
Mean house or condo value by units in structure - Mobile home ($)
Median house or condo value ($) - White
Median house or condo value ($) - Black or African American
Median house or condo value ($) - Asian
Median house or condo value ($) - Hispanic or Latino
Median house or condo value ($) - American Indian and Alaska Native
Median house or condo value ($) - Multirace
Median house or condo value ($) - Other Race
Median resident age
Resident age diversity
Median resident age - Males
Median resident age - Females
Median resident age - White
Median resident age - Black or African American
Median resident age - Asian
Median resident age - Hispanic or Latino
Median resident age - American Indian and Alaska Native
Median resident age - Multirace
Median resident age - Other Race
Median resident age - Males - White
Median resident age - Males - Black or African American
Median resident age - Males - Asian
Median resident age - Males - Hispanic or Latino
Median resident age - Males - American Indian and Alaska Native
Median resident age - Males - Multirace
Median resident age - Males - Other Race
Median resident age - Females - White
Median resident age - Females - Black or African American
Median resident age - Females - Asian
Median resident age - Females - Hispanic or Latino
Median resident age - Females - American Indian and Alaska Native
Median resident age - Females - Multirace
Median resident age - Females - Other Race
Commute - mean travel time to work (minutes)
Travel time to work - Less than 5 minutes (%)
Travel time to work - Less than 5 minutes (% change since 2000)
Travel time to work - 5 to 9 minutes (%)
Travel time to work - 5 to 9 minutes (% change since 2000)
Travel time to work - 10 to 19 minutes (%)
Travel time to work - 10 to 19 minutes (% change since 2000)
Travel time to work - 20 to 29 minutes (%)
Travel time to work - 20 to 29 minutes (% change since 2000)
Travel time to work - 30 to 39 minutes (%)
Travel time to work - 30 to 39 minutes (% change since 2000)
Travel time to work - 40 to 59 minutes (%)
Travel time to work - 40 to 59 minutes (% change since 2000)
Travel time to work - 60 to 89 minutes (%)
Travel time to work - 60 to 89 minutes (% change since 2000)
Travel time to work - 90 or more minutes (%)
Travel time to work - 90 or more minutes (% change since 2000)
Marital status - Never married (%)
Marital status - Now married (%)
Marital status - Separated (%)
Marital status - Widowed (%)
Marital status - Divorced (%)
Median family income ($)
Median family income (% change since 2000)
Median non-family income ($)
Median non-family income (% change since 2000)
Median per capita income ($)
Median per capita income (% change since 2000)
Median family income ($) - White
Median family income ($) - Black or African American
Median family income ($) - Asian
Median family income ($) - Hispanic or Latino
Median family income ($) - American Indian and Alaska Native
Median family income ($) - Multirace
Median family income ($) - Other Race
Median year house/condo built
Median year apartment built
Year house built - Built 2005 or later (%)
Year house built - Built 2000 to 2004 (%)
Year house built - Built 1990 to 1999 (%)
Year house built - Built 1980 to 1989 (%)
Year house built - Built 1970 to 1979 (%)
Year house built - Built 1960 to 1969 (%)
Year house built - Built 1950 to 1959 (%)
Year house built - Built 1940 to 1949 (%)
Year house built - Built 1939 or earlier (%)
Average household size
Household density (households per square mile)
Average household size - White
Average household size - Black or African American
Average household size - Asian
Average household size - Hispanic or Latino
Average household size - American Indian and Alaska Native
Average household size - Multirace
Average household size - Other Race
Occupied housing units (%)
Vacant housing units (%)
Owner occupied housing units (%)
Renter occupied housing units (%)
Vacancy status - For rent (%)
Vacancy status - For sale only (%)
Vacancy status - Rented or sold, not occupied (%)
Vacancy status - For seasonal, recreational, or occasional use (%)
Vacancy status - For migrant workers (%)
Vacancy status - Other vacant (%)
Residents with income below the poverty level (%)
Residents with income below 50% of the poverty level (%)
Children below poverty level (%)
Poor families by family type - Married-couple family (%)
Poor families by family type - Male, no wife present (%)
Poor families by family type - Female, no husband present (%)
Poverty status for native-born residents (%)
Poverty status for foreign-born residents (%)
Poverty among high school graduates not in families (%)
Poverty among people who did not graduate high school not in families (%)
Residents with income below the poverty level (%) - White
Residents with income below the poverty level (%) - Black or African American
Residents with income below the poverty level (%) - Asian
Residents with income below the poverty level (%) - Hispanic or Latino
Residents with income below the poverty level (%) - American Indian and Alaska Native
Residents with income below the poverty level (%) - Multirace
Residents with income below the poverty level (%) - Other Race
Air pollution - Air Quality Index (AQI)
Air pollution - CO
Air pollution - NO2
Air pollution - SO2
Air pollution - Ozone
Air pollution - PM10
Air pollution - PM25
Air pollution - Pb
Crime - Murders per 100,000 population
Crime - Rapes per 100,000 population
Crime - Robberies per 100,000 population
Crime - Assaults per 100,000 population
Crime - Burglaries per 100,000 population
Crime - Thefts per 100,000 population
Crime - Auto thefts per 100,000 population
Crime - Arson per 100,000 population
Crime - City-data.com crime index
Crime - Violent crime index
Crime - Property crime index
Crime - Murders per 100,000 population (5 year average)
Crime - Rapes per 100,000 population (5 year average)
Crime - Robberies per 100,000 population (5 year average)
Crime - Assaults per 100,000 population (5 year average)
Crime - Burglaries per 100,000 population (5 year average)
Crime - Thefts per 100,000 population (5 year average)
Crime - Auto thefts per 100,000 population (5 year average)
Crime - Arson per 100,000 population (5 year average)
Crime - City-data.com crime index (5 year average)
Crime - Violent crime index (5 year average)
Crime - Property crime index (5 year average)
1996 Presidential Elections Results (%) - Democratic Party (Clinton)
1996 Presidential Elections Results (%) - Republican Party (Dole)
1996 Presidential Elections Results (%) - Other
2000 Presidential Elections Results (%) - Democratic Party (Gore)
2000 Presidential Elections Results (%) - Republican Party (Bush)
2000 Presidential Elections Results (%) - Other
2004 Presidential Elections Results (%) - Democratic Party (Kerry)
2004 Presidential Elections Results (%) - Republican Party (Bush)
2004 Presidential Elections Results (%) - Other
2008 Presidential Elections Results (%) - Democratic Party (Obama)
2008 Presidential Elections Results (%) - Republican Party (McCain)
2008 Presidential Elections Results (%) - Other
2012 Presidential Elections Results (%) - Democratic Party (Obama)
2012 Presidential Elections Results (%) - Republican Party (Romney)
2012 Presidential Elections Results (%) - Other
2016 Presidential Elections Results (%) - Democratic Party (Clinton)
2016 Presidential Elections Results (%) - Republican Party (Trump)
2016 Presidential Elections Results (%) - Other
2020 Presidential Elections Results (%) - Democratic Party (Biden)
2020 Presidential Elections Results (%) - Republican Party (Trump)
2020 Presidential Elections Results (%) - Other
Ancestries Reported - Arab (%)
Ancestries Reported - Czech (%)
Ancestries Reported - Danish (%)
Ancestries Reported - Dutch (%)
Ancestries Reported - English (%)
Ancestries Reported - French (%)
Ancestries Reported - French Canadian (%)
Ancestries Reported - German (%)
Ancestries Reported - Greek (%)
Ancestries Reported - Hungarian (%)
Ancestries Reported - Irish (%)
Ancestries Reported - Italian (%)
Ancestries Reported - Lithuanian (%)
Ancestries Reported - Norwegian (%)
Ancestries Reported - Polish (%)
Ancestries Reported - Portuguese (%)
Ancestries Reported - Russian (%)
Ancestries Reported - Scotch-Irish (%)
Ancestries Reported - Scottish (%)
Ancestries Reported - Slovak (%)
Ancestries Reported - Subsaharan African (%)
Ancestries Reported - Swedish (%)
Ancestries Reported - Swiss (%)
Ancestries Reported - Ukrainian (%)
Ancestries Reported - United States (%)
Ancestries Reported - Welsh (%)
Ancestries Reported - West Indian (%)
Ancestries Reported - Other (%)
Educational Attainment - No schooling completed (%)
Educational Attainment - Less than high school (%)
Educational Attainment - High school or equivalent (%)
Educational Attainment - Less than 1 year of college (%)
Educational Attainment - 1 or more years of college (%)
Educational Attainment - Associate degree (%)
Educational Attainment - Bachelor's degree (%)
Educational Attainment - Master's degree (%)
Educational Attainment - Professional school degree (%)
Educational Attainment - Doctorate degree (%)
School Enrollment - Nursery, preschool (%)
School Enrollment - Kindergarten (%)
School Enrollment - Grade 1 to 4 (%)
School Enrollment - Grade 5 to 8 (%)
School Enrollment - Grade 9 to 12 (%)
School Enrollment - College undergrad (%)
School Enrollment - Graduate or professional (%)
School Enrollment - Not enrolled in school (%)
School enrollment - Public schools (%)
School enrollment - Private schools (%)
School enrollment - Not enrolled (%)
Median number of rooms in houses and condos
Median number of rooms in apartments
Housing units lacking complete plumbing facilities (%)
Housing units lacking complete kitchen facilities (%)
Density of houses
Urban houses (%)
Rural houses (%)
Households with people 60 years and over (%)
Households with people 65 years and over (%)
Households with people 75 years and over (%)
Households with one or more nonrelatives (%)
Households with no nonrelatives (%)
Population in households (%)
Family households (%)
Nonfamily households (%)
Population in families (%)
Family households with own children (%)
Median number of bedrooms in owner occupied houses
Mean number of bedrooms in owner occupied houses
Median number of bedrooms in renter occupied houses
Mean number of bedrooms in renter occupied houses
Median number of vehichles in owner occupied houses
Mean number of vehichles in owner occupied houses
Median number of vehichles in renter occupied houses
Mean number of vehichles in renter occupied houses
Mortgage status - with mortgage (%)
Mortgage status - with second mortgage (%)
Mortgage status - with home equity loan (%)
Mortgage status - with both second mortgage and home equity loan (%)
Mortgage status - without a mortgage (%)
Average family size
Average family size - White
Average family size - Black or African American
Average family size - Asian
Average family size - Hispanic or Latino
Average family size - American Indian and Alaska Native
Average family size - Multirace
Average family size - Other Race
Geographical mobility - Same house 1 year ago (%)
Geographical mobility - Moved within same county (%)
Geographical mobility - Moved from different county within same state (%)
Geographical mobility - Moved from different state (%)
Geographical mobility - Moved from abroad (%)
Place of birth - Born in state of residence (%)
Place of birth - Born in other state (%)
Place of birth - Native, outside of US (%)
Place of birth - Foreign born (%)
Housing units in structures - 1, detached (%)
Housing units in structures - 1, attached (%)
Housing units in structures - 2 (%)
Housing units in structures - 3 or 4 (%)
Housing units in structures - 5 to 9 (%)
Housing units in structures - 10 to 19 (%)
Housing units in structures - 20 to 49 (%)
Housing units in structures - 50 or more (%)
Housing units in structures - Mobile home (%)
Housing units in structures - Boat, RV, van, etc. (%)
House/condo owner moved in on average (years ago)
Renter moved in on average (years ago)
Year householder moved into unit - Moved in 1999 to March 2000 (%)
Year householder moved into unit - Moved in 1995 to 1998 (%)
Year householder moved into unit - Moved in 1990 to 1994 (%)
Year householder moved into unit - Moved in 1980 to 1989 (%)
Year householder moved into unit - Moved in 1970 to 1979 (%)
Year householder moved into unit - Moved in 1969 or earlier (%)
Means of transportation to work - Drove car alone (%)
Means of transportation to work - Carpooled (%)
Means of transportation to work - Public transportation (%)
Means of transportation to work - Bus or trolley bus (%)
Means of transportation to work - Streetcar or trolley car (%)
Means of transportation to work - Subway or elevated (%)
Means of transportation to work - Railroad (%)
Means of transportation to work - Ferryboat (%)
Means of transportation to work - Taxicab (%)
Means of transportation to work - Motorcycle (%)
Means of transportation to work - Bicycle (%)
Means of transportation to work - Walked (%)
Means of transportation to work - Other means (%)
Working at home (%)
Industry diversity
Most Common Industries - Agriculture, forestry, fishing and hunting, and mining (%)
Most Common Industries - Agriculture, forestry, fishing and hunting (%)
Most Common Industries - Mining, quarrying, and oil and gas extraction (%)
Most Common Industries - Construction (%)
Most Common Industries - Manufacturing (%)
Most Common Industries - Wholesale trade (%)
Most Common Industries - Retail trade (%)
Most Common Industries - Transportation and warehousing, and utilities (%)
Most Common Industries - Transportation and warehousing (%)
Most Common Industries - Utilities (%)
Most Common Industries - Information (%)
Most Common Industries - Finance and insurance, and real estate and rental and leasing (%)
Most Common Industries - Finance and insurance (%)
Most Common Industries - Real estate and rental and leasing (%)
Most Common Industries - Professional, scientific, and management, and administrative and waste management services (%)
Most Common Industries - Professional, scientific, and technical services (%)
Most Common Industries - Management of companies and enterprises (%)
Most Common Industries - Administrative and support and waste management services (%)
Most Common Industries - Educational services, and health care and social assistance (%)
Most Common Industries - Educational services (%)
Most Common Industries - Health care and social assistance (%)
Most Common Industries - Arts, entertainment, and recreation, and accommodation and food services (%)
Most Common Industries - Arts, entertainment, and recreation (%)
Most Common Industries - Accommodation and food services (%)
Most Common Industries - Other services, except public administration (%)
Most Common Industries - Public administration (%)
Occupation diversity
Most Common Occupations - Management, business, science, and arts occupations (%)
Most Common Occupations - Management, business, and financial occupations (%)
Most Common Occupations - Management occupations (%)
Most Common Occupations - Business and financial operations occupations (%)
Most Common Occupations - Computer, engineering, and science occupations (%)
Most Common Occupations - Computer and mathematical occupations (%)
Most Common Occupations - Architecture and engineering occupations (%)
Most Common Occupations - Life, physical, and social science occupations (%)
Most Common Occupations - Education, legal, community service, arts, and media occupations (%)
Most Common Occupations - Community and social service occupations (%)
Most Common Occupations - Legal occupations (%)
Most Common Occupations - Education, training, and library occupations (%)
Most Common Occupations - Arts, design, entertainment, sports, and media occupations (%)
Most Common Occupations - Healthcare practitioners and technical occupations (%)
Most Common Occupations - Health diagnosing and treating practitioners and other technical occupations (%)
Most Common Occupations - Health technologists and technicians (%)
Most Common Occupations - Service occupations (%)
Most Common Occupations - Healthcare support occupations (%)
Most Common Occupations - Protective service occupations (%)
Most Common Occupations - Fire fighting and prevention, and other protective service workers including supervisors (%)
Most Common Occupations - Law enforcement workers including supervisors (%)
Most Common Occupations - Food preparation and serving related occupations (%)
Most Common Occupations - Building and grounds cleaning and maintenance occupations (%)
Most Common Occupations - Personal care and service occupations (%)
Most Common Occupations - Sales and office occupations (%)
Most Common Occupations - Sales and related occupations (%)
Most Common Occupations - Office and administrative support occupations (%)
Most Common Occupations - Natural resources, construction, and maintenance occupations (%)
Most Common Occupations - Farming, fishing, and forestry occupations (%)
Most Common Occupations - Construction and extraction occupations (%)
Most Common Occupations - Installation, maintenance, and repair occupations (%)
Most Common Occupations - Production, transportation, and material moving occupations (%)
Most Common Occupations - Production occupations (%)
Most Common Occupations - Transportation occupations (%)
Most Common Occupations - Material moving occupations (%)
People in Group quarters - Institutionalized population (%)
People in Group quarters - Correctional institutions (%)
People in Group quarters - Federal prisons and detention centers (%)
People in Group quarters - Halfway houses (%)
People in Group quarters - Local jails and other confinement facilities (including police lockups) (%)
People in Group quarters - Military disciplinary barracks (%)
People in Group quarters - State prisons (%)
People in Group quarters - Other types of correctional institutions (%)
People in Group quarters - Nursing homes (%)
People in Group quarters - Hospitals/wards, hospices, and schools for the handicapped (%)
People in Group quarters - Hospitals/wards and hospices for chronically ill (%)
People in Group quarters - Hospices or homes for chronically ill (%)
People in Group quarters - Military hospitals or wards for chronically ill (%)
People in Group quarters - Other hospitals or wards for chronically ill (%)
People in Group quarters - Hospitals or wards for drug/alcohol abuse (%)
People in Group quarters - Mental (Psychiatric) hospitals or wards (%)
People in Group quarters - Schools, hospitals, or wards for the mentally retarded (%)
People in Group quarters - Schools, hospitals, or wards for the physically handicapped (%)
People in Group quarters - Institutions for the deaf (%)
People in Group quarters - Institutions for the blind (%)
People in Group quarters - Orthopedic wards and institutions for the physically handicapped (%)
People in Group quarters - Wards in general hospitals for patients who have no usual home elsewhere (%)
People in Group quarters - Wards in military hospitals for patients who have no usual home elsewhere (%)
People in Group quarters - Juvenile institutions (%)
People in Group quarters - Long-term care (%)
People in Group quarters - Homes for abused, dependent, and neglected children (%)
People in Group quarters - Residential treatment centers for emotionally disturbed children (%)
People in Group quarters - Training schools for juvenile delinquents (%)
People in Group quarters - Short-term care, detention or diagnostic centers for delinquent children (%)
People in Group quarters - Type of juvenile institution unknown (%)
People in Group quarters - Noninstitutionalized population (%)
People in Group quarters - College dormitories (includes college quarters off campus) (%)
People in Group quarters - Military quarters (%)
People in Group quarters - On base (%)
People in Group quarters - Barracks, unaccompanied personnel housing (UPH), (Enlisted/Officer), ;and similar group living quarters for military personnel (%)
People in Group quarters - Transient quarters for temporary residents (%)
People in Group quarters - Military ships (%)
People in Group quarters - Group homes (%)
People in Group quarters - Homes or halfway houses for drug/alcohol abuse (%)
People in Group quarters - Homes for the mentally ill (%)
People in Group quarters - Homes for the mentally retarded (%)
People in Group quarters - Homes for the physically handicapped (%)
People in Group quarters - Other group homes (%)
People in Group quarters - Religious group quarters (%)
People in Group quarters - Dormitories (%)
People in Group quarters - Agriculture workers' dormitories on farms (%)
People in Group quarters - Job Corps and vocational training facilities (%)
People in Group quarters - Other workers' dormitories (%)
People in Group quarters - Crews of maritime vessels (%)
People in Group quarters - Other nonhousehold living situations (%)
People in Group quarters - Other noninstitutional group quarters (%)
Residents speaking English at home (%)
Residents speaking English at home - Born in the United States (%)
Residents speaking English at home - Native, born elsewhere (%)
Residents speaking English at home - Foreign born (%)
Residents speaking Spanish at home (%)
Residents speaking Spanish at home - Born in the United States (%)
Residents speaking Spanish at home - Native, born elsewhere (%)
Residents speaking Spanish at home - Foreign born (%)
Residents speaking other language at home (%)
Residents speaking other language at home - Born in the United States (%)
Residents speaking other language at home - Native, born elsewhere (%)
Residents speaking other language at home - Foreign born (%)
Class of Workers - Employee of private company (%)
Class of Workers - Self-employed in own incorporated business (%)
Class of Workers - Private not-for-profit wage and salary workers (%)
Class of Workers - Local government workers (%)
Class of Workers - State government workers (%)
Class of Workers - Federal government workers (%)
Class of Workers - Self-employed workers in own not incorporated business and Unpaid family workers (%)
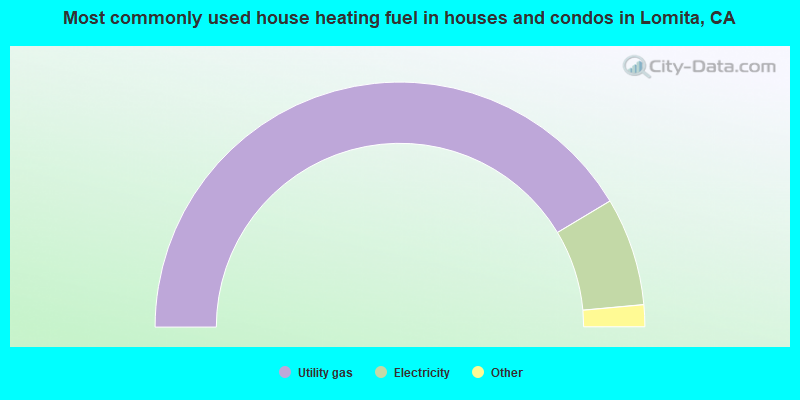
House heating fuel used in houses and condos - Utility gas (%)
House heating fuel used in houses and condos - Bottled, tank, or LP gas (%)
House heating fuel used in houses and condos - Electricity (%)
House heating fuel used in houses and condos - Fuel oil, kerosene, etc. (%)
House heating fuel used in houses and condos - Coal or coke (%)
House heating fuel used in houses and condos - Wood (%)
House heating fuel used in houses and condos - Solar energy (%)
House heating fuel used in houses and condos - Other fuel (%)
House heating fuel used in houses and condos - No fuel used (%)
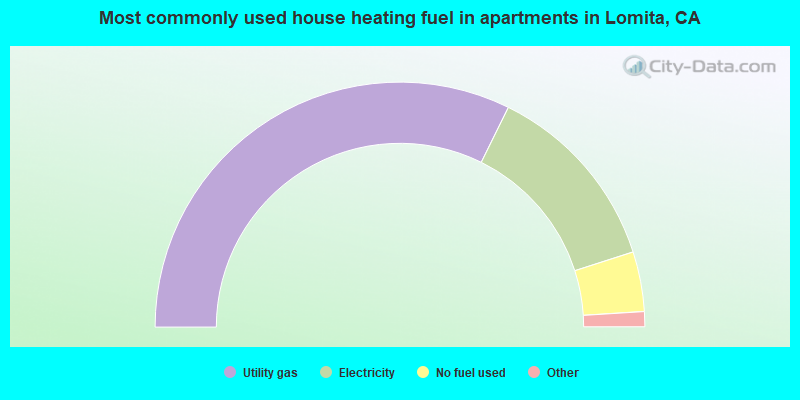
House heating fuel used in apartments - Utility gas (%)
House heating fuel used in apartments - Bottled, tank, or LP gas (%)
House heating fuel used in apartments - Electricity (%)
House heating fuel used in apartments - Fuel oil, kerosene, etc. (%)
House heating fuel used in apartments - Coal or coke (%)
House heating fuel used in apartments - Wood (%)
House heating fuel used in apartments - Solar energy (%)
House heating fuel used in apartments - Other fuel (%)
House heating fuel used in apartments - No fuel used (%)
Armed forces status - In Armed Forces (%)
Armed forces status - Civilian (%)
Armed forces status - Civilian - Veteran (%)
Armed forces status - Civilian - Nonveteran (%)
Fatal accidents locations in years 2005-2021
Fatal accidents locations in 2005
Fatal accidents locations in 2006
Fatal accidents locations in 2007
Fatal accidents locations in 2008
Fatal accidents locations in 2009
Fatal accidents locations in 2010
Fatal accidents locations in 2011
Fatal accidents locations in 2012
Fatal accidents locations in 2013
Fatal accidents locations in 2014
Fatal accidents locations in 2015
Fatal accidents locations in 2016
Fatal accidents locations in 2017
Fatal accidents locations in 2018
Fatal accidents locations in 2019
Fatal accidents locations in 2020
Fatal accidents locations in 2021
Alcohol use - People drinking some alcohol every month (%)
Alcohol use - People not drinking at all (%)
Alcohol use - Average days/month drinking alcohol
Alcohol use - Average drinks/week
Alcohol use - Average days/year people drink much
Audiometry - Average condition of hearing (%)
Audiometry - People that can hear a whisper from across a quiet room (%)
Audiometry - People that can hear normal voice from across a quiet room (%)
Audiometry - Ears ringing, roaring, buzzing (%)
Audiometry - Had a job exposure to loud noise (%)
Audiometry - Had off-work exposure to loud noise (%)
Blood Pressure & Cholesterol - Has high blood pressure (%)
Blood Pressure & Cholesterol - Checking blood pressure at home (%)
Blood Pressure & Cholesterol - Frequently checking blood cholesterol (%)
Blood Pressure & Cholesterol - Has high cholesterol level (%)
Consumer Behavior - Money monthly spent on food at supermarket/grocery store
Consumer Behavior - Money monthly spent on food at other stores
Consumer Behavior - Money monthly spent on eating out
Consumer Behavior - Money monthly spent on carryout/delivered foods
Consumer Behavior - Income spent on food at supermarket/grocery store (%)
Consumer Behavior - Income spent on food at other stores (%)
Consumer Behavior - Income spent on eating out (%)
Consumer Behavior - Income spent on carryout/delivered foods (%)
Current Health Status - General health condition (%)
Current Health Status - Blood donors (%)
Current Health Status - Has blood ever tested for HIV virus (%)
Current Health Status - Left-handed people (%)
Dermatology - People using sunscreen (%)
Diabetes - Diabetics (%)
Diabetes - Had a blood test for high blood sugar (%)
Diabetes - People taking insulin (%)
Diet Behavior & Nutrition - Diet health (%)
Diet Behavior & Nutrition - Milk product consumption (# of products/month)
Diet Behavior & Nutrition - Meals not home prepared (#/week)
Diet Behavior & Nutrition - Meals from fast food or pizza place (#/week)
Diet Behavior & Nutrition - Ready-to-eat foods (#/month)
Diet Behavior & Nutrition - Frozen meals/pizza (#/month)
Drug Use - People that ever used marijuana or hashish (%)
Drug Use - Ever used hard drugs (%)
Drug Use - Ever used any form of cocaine (%)
Drug Use - Ever used heroin (%)
Drug Use - Ever used methamphetamine (%)
Health Insurance - People covered by health insurance (%)
Kidney Conditions-Urology - Avg. # of times urinating at night
Medical Conditions - People with asthma (%)
Medical Conditions - People with anemia (%)
Medical Conditions - People with psoriasis (%)
Medical Conditions - People with overweight (%)
Medical Conditions - Elderly people having difficulties in thinking or remembering (%)
Medical Conditions - People who ever received blood transfusion (%)
Medical Conditions - People having trouble seeing even with glass/contacts (%)
Medical Conditions - People with arthritis (%)
Medical Conditions - People with gout (%)
Medical Conditions - People with congestive heart failure (%)
Medical Conditions - People with coronary heart disease (%)
Medical Conditions - People with angina pectoris (%)
Medical Conditions - People who ever had heart attack (%)
Medical Conditions - People who ever had stroke (%)
Medical Conditions - People with emphysema (%)
Medical Conditions - People with thyroid problem (%)
Medical Conditions - People with chronic bronchitis (%)
Medical Conditions - People with any liver condition (%)
Medical Conditions - People who ever had cancer or malignancy (%)
Mental Health - People who have little interest in doing things (%)
Mental Health - People feeling down, depressed, or hopeless (%)
Mental Health - People who have trouble sleeping or sleeping too much (%)
Mental Health - People feeling tired or having little energy (%)
Mental Health - People with poor appetite or overeating (%)
Mental Health - People feeling bad about themself (%)
Mental Health - People who have trouble concentrating on things (%)
Mental Health - People moving or speaking slowly or too fast (%)
Mental Health - People having thoughts they would be better off dead (%)
Oral Health - Average years since last visit a dentist
Oral Health - People embarrassed because of mouth (%)
Oral Health - People with gum disease (%)
Oral Health - General health of teeth and gums (%)
Oral Health - Average days a week using dental floss/device
Oral Health - Average days a week using mouthwash for dental problem
Oral Health - Average number of teeth
Pesticide Use - Households using pesticides to control insects (%)
Pesticide Use - Households using pesticides to kill weeds (%)
Physical Activity - People doing vigorous-intensity work activities (%)
Physical Activity - People doing moderate-intensity work activities (%)
Physical Activity - People walking or bicycling (%)
Physical Activity - People doing vigorous-intensity recreational activities (%)
Physical Activity - People doing moderate-intensity recreational activities (%)
Physical Activity - Average hours a day doing sedentary activities
Physical Activity - Average hours a day watching TV or videos
Physical Activity - Average hours a day using computer
Physical Functioning - People having limitations keeping them from working (%)
Physical Functioning - People limited in amount of work they can do (%)
Physical Functioning - People that need special equipment to walk (%)
Physical Functioning - People experiencing confusion/memory problems (%)
Physical Functioning - People requiring special healthcare equipment (%)
Prescription Medications - Average number of prescription medicines taking
Preventive Aspirin Use - Adults 40+ taking low-dose aspirin (%)
Reproductive Health - Vaginal deliveries (%)
Reproductive Health - Cesarean deliveries (%)
Reproductive Health - Deliveries resulted in a live birth (%)
Reproductive Health - Pregnancies resulted in a delivery (%)
Reproductive Health - Women breastfeeding newborns (%)
Reproductive Health - Women that had a hysterectomy (%)
Reproductive Health - Women that had both ovaries removed (%)
Reproductive Health - Women that have ever taken birth control pills (%)
Reproductive Health - Women taking birth control pills (%)
Reproductive Health - Women that have ever used Depo-Provera or injectables (%)
Reproductive Health - Women that have ever used female hormones (%)
Sexual Behavior - People 18+ that ever had sex (vaginal, anal, or oral) (%)
Sexual Behavior - Males 18+ that ever had vaginal sex with a woman (%)
Sexual Behavior - Males 18+ that ever performed oral sex on a woman (%)
Sexual Behavior - Males 18+ that ever had anal sex with a woman (%)
Sexual Behavior - Males 18+ that ever had any sex with a man (%)
Sexual Behavior - Females 18+ that ever had vaginal sex with a man (%)
Sexual Behavior - Females 18+ that ever performed oral sex on a man (%)
Sexual Behavior - Females 18+ that ever had anal sex with a man (%)
Sexual Behavior - Females 18+ that ever had any kind of sex with a woman (%)
Sexual Behavior - Average age people first had sex
Sexual Behavior - Average number of female sex partners in lifetime (males 18+)
Sexual Behavior - Average number of female vaginal sex partners in lifetime (males 18+)
Sexual Behavior - Average age people first performed oral sex on a woman (18+)
Sexual Behavior - Average number of woman performed oral sex on in lifetime (18+)
Sexual Behavior - Average number of male sex partners in lifetime (males 18+)
Sexual Behavior - Average number of male anal sex partners in lifetime (males 18+)
Sexual Behavior - Average age people first performed oral sex on a man (18+)
Sexual Behavior - Average number of male oral sex partners in lifetime (18+)
Sexual Behavior - People using protection when performing oral sex (%)
Sexual Behavior - Average number of times people have vaginal or anal sex a year
Sexual Behavior - People having sex without condom (%)
Sexual Behavior - Average number of male sex partners in lifetime (females 18+)
Sexual Behavior - Average number of male vaginal sex partners in lifetime (females 18+)
Sexual Behavior - Average number of female sex partners in lifetime (females 18+)
Sexual Behavior - Circumcised males 18+ (%)
Sleep Disorders - Average hours sleeping at night
Sleep Disorders - People that has trouble sleeping (%)
Smoking-Cigarette Use - People smoking cigarettes (%)
Taste & Smell - People 40+ having problems with smell (%)
Taste & Smell - People 40+ having problems with taste (%)
Taste & Smell - People 40+ that ever had wisdom teeth removed (%)
Taste & Smell - People 40+ that ever had tonsils teeth removed (%)
Taste & Smell - People 40+ that ever had a loss of consciousness because of a head injury (%)
Taste & Smell - People 40+ that ever had a broken nose or other serious injury to face or skull (%)
Taste & Smell - People 40+ that ever had two or more sinus infections (%)
Weight - Average height (inches)
Weight - Average weight (pounds)
Weight - Average BMI
Weight - People that are obese (%)
Weight - People that ever were obese (%)
Weight - People trying to lose weight (%)
7,357 36.4% White alone 6,788 33.6% Hispanic 3,618 17.9% Asian alone 1,257 6.2% Two or more races 935 4.6% Black alone 126 0.6% Native Hawaiian and Other 103 0.5% Other race alone 16 0.08% American Indian alone
According to our research of California and other state lists, there were 24 registered sex offenders living in Lomita, California as of April 27, 2024 . The ratio of all residents to sex offenders in Lomita is 867 to 1.The ratio of registered sex offenders to all residents in this city is near the state average.
Officers per 1,000 residents here:
0.05California average:
1.98
Latest news from Lomita, CA collected exclusively by city-data.com from local newspapers, TV, and radio stations
Ancestries: English (2.7%), Polish (2.6%), Irish (2.6%), German (2.5%), Italian (2.4%), Assyrian (1.4%).
Current Local Time:
Land area: 1.90 square miles.
Population density: 10,576 people per square mile (high).
5,484 residents are foreign born (12.4% Asia , 11.8% Latin America ).
This city:
27.1%California:
26.5%
Median real estate property taxes paid for housing units with mortgages in 2022: $6,452 (0.8%)Median real estate property taxes paid for housing units with no mortgage in 2022: $4,272 (0.6%)
Nearest city with pop. 50,000+: Torrance, CA
Nearest city with pop. 200,000+: Long Beach, CA
Nearest city with pop. 1,000,000+: Los Angeles, CA
Nearest cities:
Latitude: 33.79 N, Longitude: 118.32 W
Daytime population change due to commuting: -4,891 (-24.2%)Workers who live and work in this city: 2,150 (20.2%)
Property values in Lomita, CA
Single-family new house construction building permits:
2022: 19 buildings , average cost: $213,0002021: 5 buildings , average cost: $254,8002020: 5 buildings , average cost: $255,6002019: 16 buildings , average cost: $279,1002018: 2 buildings , average cost: $198,1002017: 2 buildings , average cost: $180,9002016: 6 buildings , average cost: $408,8002015: 20 buildings , average cost: $314,6002014: 16 buildings , average cost: $202,5002013: 7 buildings , average cost: $486,7002003: 5 buildings , average cost: $192,8002002: 9 buildings , average cost: $192,8002001: 9 buildings , average cost: $192,8002000: 11 buildings , average cost: $192,8001999: 21 buildings , average cost: $168,6001998: 18 buildings , average cost: $174,8001997: 17 buildings , average cost: $142,000Unemployment in December 2023:
Population change in the 1990s: +663 (+3.4%).
Most common occupations in Lomita, CA (%)
Both Males Females
Other management occupations, except farmers and farm managers (4.5%)
Other sales and related occupations, including supervisors (4.5%)
Other production occupations, including supervisors (3.6%)
Retail sales workers, except cashiers (3.5%)
Other office and administrative support workers, including supervisors (3.4%)
Sales representatives, services, wholesale and manufacturing (3.4%)
Material recording, scheduling, dispatching, and distributing workers (3.3%)
Other management occupations, except farmers and farm managers (5.3%)
Other production occupations, including supervisors (4.9%)
Electrical equipment mechanics and other installation, maintenance, and repair workers, including supervisors (4.7%)
Other sales and related occupations, including supervisors (4.3%)
Computer specialists (3.9%)
Material recording, scheduling, dispatching, and distributing workers (3.8%)
Building and grounds cleaning and maintenance occupations (3.6%)
Other office and administrative support workers, including supervisors (6.1%)
Secretaries and administrative assistants (5.9%)
Preschool, kindergarten, elementary, and middle school teachers (4.8%)
Other sales and related occupations, including supervisors (4.8%)
Information and record clerks, except customer service representatives (4.6%)
Bookkeeping, accounting, and auditing clerks (4.2%)
Sales representatives, services, wholesale and manufacturing (3.9%)
Earthquake activity:
Lomita-area historical earthquake activity is significantly above California state average. It is 6680% greater than the overall U.S. average. On 7/21/1952 at 11:52:14, a magnitude 7.7 (7.7 UK, Class: Major, Intensity: VIII - XII) earthquake occurred 92.1 miles away from Lomita center, causing $50,000,000 total damage On 6/28/1992 at 11:57:34, a magnitude 7.6 (6.2 MB, 7.6 MS, 7.3 MW, Depth: 0.7 mi) earthquake occurred 105.8 miles away from the city center, causing 3 deaths ( 1 shaking deaths, 2 other deaths) and 400 injuries, causing $100,000,000 total damage and $40,000,000 insured lossesOn 10/16/1999 at 09:46:44, a magnitude 7.4 (6.3 MB, 7.4 MS, 7.2 MW, 7.3 ML) earthquake occurred 118.7 miles away from Lomita center On 11/4/1927 at 13:51:53, a magnitude 7.5 (7.5 UK) earthquake occurred 173.3 miles away from Lomita center On 1/17/1994 at 12:30:55, a magnitude 6.8 (6.4 MB, 6.8 MS, 6.7 MW, Depth: 11.4 mi, Class: Strong, Intensity: VII - IX) earthquake occurred 29.1 miles away from the city center, causing 60 deaths ( 60 shaking deaths) and 7000 injuriesOn 4/21/1918 at 22:32:30, a magnitude 6.8 (6.8 UK) earthquake occurred 50.4 miles away from Lomita center Magnitude types: body-wave magnitude (MB), local magnitude (ML), surface-wave magnitude (MS), moment magnitude (MW) Natural disasters: The number of natural disasters in Los Angeles County (57) is a lot greater than the US average (15).Major Disasters (Presidential) Declared: 27Emergencies Declared: 3Fires: 37, Floods: 16, Storms: 9, Winter Storms: 6, Landslides: 5, Mudslides: 5, Earthquakes: 3, Freeze: 1, Heavy Rain: 1, Hurricane: 1, Snow: 1, Tornado: 1, Wind: 1, Other: 1 (Note: some incidents may be assigned to more than one category). Hospitals and medical centers in Lomita: ARLINGTON HOME #3 (24600 CYPRESS STREET) LOMITA POST-ACUTE CARE CENTER (1955 W. LOMITA BLVD)
PALOS VERDES HEALTH CARE CENTE (26303 WESTERN AVE.)
PACIFIC DIALYSIS SERVICES, INC. (1830 LOMITA BLVD.)
Amtrak stations near Lomita: 4 miles: SAN PEDRO (CATALINA TERMINAL, BERTH 95) - Bus Station Services: partially wheelchair accessible, enclosed waiting area, public restrooms, public payphones, snack bar, paid short-term parking, paid long-term parking, call for taxi service.
8 miles: LONG BEACH (601 N. LONG BEACH BLVD.) - Bus Station Services: fully wheelchair accessible, public restrooms, public payphones, full-service food facilities, paid short-term parking, paid long-term parking, call for taxi service, public transit connection.
19 miles: LOS ANGELES (800 N. ALAMEDA ST.) Services: ticket office, fully wheelchair accessible, enclosed waiting area, public restrooms, public payphones, snack bar, free short-term parking, paid long-term parking, car rental agency, taxi stand, public transit connection.
Colleges/universities with over 2000 students nearest to Lomita:
Los Angeles Harbor College (about 3 miles; Wilmington, CA ; Full-time enrollment: 5,285)
Wyotech-Long Beach (about 6 miles; Long Beach, CA ; FT enrollment: 2,453)
California State University-Dominguez Hills (about 6 miles; Carson, CA ; FT enrollment: 9,862)
El Camino Community College District (about 7 miles; Torrance, CA ; FT enrollment: 13,952)
El Camino College-Compton Center (about 9 miles; Compton, CA ; FT enrollment: 4,506)
Los Angeles Southwest College (about 10 miles; Los Angeles, CA ; FT enrollment: 3,247)
Long Beach City College (about 11 miles; Long Beach, CA ; FT enrollment: 15,602)
Private high school in Lomita: NISHIYAMATO ACADEMY OF CALIFORNIA Students: 158, Location: 2458 LOMITA BLVD, Grades: PK-9)
Public elementary/middle schools in Lomita:
Private elementary/middle schools in Lomita: ST MARGARET MARY SCHOOL Students: 308, Location: 25515 ESHELMAN AVE, Grades: KG-8)
HARBOR CHURCH SCHOOLS Students: 117, Location: 1716 254TH ST, Grades: PK-8)
PACIFIC COAST MONTESSORI Students: 28, Location: 2342 PACIFIC COAST HWY, Grades: PK-2)
SEEDS OF JOY VILLAGE Students: 21, Location: 2427 PACIFIC COAST HWY STE B, Grades: PK-T1)
See full list of schools located in Lomita User-submitted facts and corrections:
The nearest hospital with a real trauma center is Harbor General (UCLA) which is about 5 miles.
The nearest hospital with a real trauma center is Harbor General (UCLA) which is about 5 miles.
Torrance Memorial Medical Center is less than 1 mile from Lomita. It is a full service hospital with emergency room services. Address is 3440 Lomita Blvd in Torrance, CA.
Notable locations in Lomita: (A) , Lomita Railroad Museum (B) , Lomita City Hall (C) , Lomita Branch County of Los Angeles Public Library (D) , Lomita Sheriffs Station (E) . Display/hide their locations on the map
Churches in Lomita include: (A) , Community Bible Church (B) , First Born Chapel (C) , First Missionary Baptist Church of Lomita (D) , Lomita Christian Church (E) , Narbonne Avenue Baptist Church (F) , Saint Margaret Mary Catholic Church (G) , Saint Marks Presbyterian Church (H) , South Bay Free Methodist Church (I) . Display/hide their locations on the map
Parks in Lomita include: (1) , Hathaway Park (2) , Veterans Park (3) , Lomita Recreation Center (4) . Display/hide their locations on the map
Tourist attraction:
Hotels:
Birthplace of: Chad Qualls - 2005 Major League Baseball player (Houston Astros, born : Aug 17, 1978), Ted Lilly - 2005 Major League Baseball player (Toronto Blue Jays, born : Jan 4, 1976), Bill Stits - Football player, Erv Palica - Baseball player, Mike Busby - Major League Baseball pitcher.
Los Angeles County has a predicted average indoor radon screening level between 2 and 4 pCi/L (pico curies per liter) - Moderate Potential Average household size: This city:
2.5 peopleCalifornia:
2.9 people
Percentage of family households: This city:
62.6%Whole state:
68.7%
Percentage of households with unmarried partners: This city:
6.8%Whole state:
7.2%
Likely homosexual households (counted as self-reported same-sex unmarried-partner households)
Lesbian couples: 0.4% of all households Gay men: 0.3% of all households
People in group quarters in Lomita in 2010:
110 people in nursing facilities/skilled-nursing facilities
22 people in group homes intended for adults
13 people in emergency and transitional shelters (with sleeping facilities) for people experiencing homelessness
13 people in workers' group living quarters and job corps centers
9 people in other noninstitutional facilities
People in group quarters in Lomita in 2000:
104 people in nursing homes
18 people in homes for the physically handicapped
6 people in other noninstitutional group quarters
5 people in homes for the mentally retarded
Banks with branches in Lomita (2011 data):
OneWest Bank, FSB: 2177 Pacific Coast Highway Branch at 2177 Pacific Coast Highway, branch established on 1977/01/01. Info updated 2011/07/21: Bank assets: $26,181.3 mil, Deposits: $15,408.4 mil, headquarters in Pasadena, CA, positive income , 79 total offices
U.S. Bank National Association: Lomita Branch at 2270 Pacific Coast Highway, branch established on 1981/12/15. Info updated 2012/01/30: Bank assets: $330,470.8 mil, Deposits: $236,091.5 mil, headquarters in Cincinnati, OH, positive income , 3121 total offices , Holding Company: U.S. Bancorp
For population 15 years and over in Lomita:
Never married: 35.3%Now married: 47.8%Separated: 1.0%Widowed: 3.8%Divorced: 12.2% For population 25 years and over in Lomita:
High school or higher: 87.9%Bachelor's degree or higher: 39.1%Graduate or professional degree: 12.6%Unemployed: 5.6%Mean travel time to work (commute): 22.8 minutes
Education Gini index (Inequality in education) Here:
12.8California average:
15.5
Religion statistics for Lomita, CA (based on Los Angeles County data)
Religion Adherents Congregations Catholic 3,542,994 275 Evangelical Protestant 814,611 3,249 Other 451,594 1,023 Mainline Protestant 229,056 860 Black Protestant 112,338 290 Orthodox 63,517 76 None 4,604,495 -
Source: Clifford Grammich, Kirk Hadaway, Richard Houseal, Dale E.Jones, Alexei Krindatch, Richie Stanley and Richard H.Taylor. 2012. 2010 U.S.Religion Census: Religious Congregations & Membership Study. Association of Statisticians of American Religious Bodies. Jones, Dale E., et al. 2002. Congregations and Membership in the United States 2000. Nashville, TN: Glenmary Research Center. Graphs represent county-level data
Food Environment Statistics: Number of grocery stores : 2,084Los Angeles County :
2.12 / 10,000 pop.State :
2.14 / 10,000 pop.
Number of supercenters and club stores : 32This county :
0.03 / 10,000 pop.California :
0.04 / 10,000 pop.
Number of convenience stores (no gas) : 567Los Angeles County :
0.58 / 10,000 pop.California :
0.62 / 10,000 pop.
Number of convenience stores (with gas) : 1,206Here :
1.23 / 10,000 pop.California :
1.49 / 10,000 pop.
Number of full-service restaurants : 7,008This county :
7.15 / 10,000 pop.State :
7.42 / 10,000 pop.
Adult obesity rate : Los Angeles County :
20.4%California :
21.3%
Low-income preschool obesity rate : Los Angeles County :
18.6%California :
17.9%
Health and Nutrition: Healthy diet rate : This city:
50.2%California:
49.4%
Average overall health of teeth and gums : This city:
48.3%California:
48.0%
Average BMI : Lomita:
28.1California:
28.1
People feeling badly about themselves : Lomita:
19.7%California:
20.2%
People not drinking alcohol at all : Lomita:
11.8%California:
11.2%
Average hours sleeping at night : Overweight people : Lomita:
31.8%California:
31.5%
General health condition : This city:
56.8%State:
56.4%
Average condition of hearing : This city:
80.8%California:
80.9%
More about Health and Nutrition of Lomita, CA Residents
Local government employment and payroll (March 2022)
Function
Full-time employees
Monthly full-time payroll
Average yearly full-time wage
Part-time employees
Monthly part-time payroll
Other Government Administration
18 $126,666 $84,444 7 $18,489 Streets and Highways
10 $66,083 $79,300 0 $0 Parks and Recreation
10 $61,741 $74,089 17 $11,561 Financial Administration
6 $46,192 $92,384 0 $0 Water Supply
6 $37,461 $74,922 0 $0
Totals for Government
50 $338,144 $81,155 24 $30,050
Lomita government finances - Expenditure in 2017 (per resident):
Construction - Water Utilities: $2,871,000 ($143.17)
Central Staff Services: $1,456,000 ($72.61)Regular Highways: $756,000 ($37.70)Current Operations - Water Utilities: $4,326,000 ($215.73)
Police Protection: $3,047,000 ($151.95)Central Staff Services: $2,429,000 ($121.13)Regular Highways: $2,081,000 ($103.77)Parks and Recreation: $1,066,000 ($53.16)Housing and Community Development: $718,000 ($35.81)Health - Other: $337,000 ($16.81)Financial Administration: $274,000 ($13.66)Protective Inspection and Regulation - Other: $109,000 ($5.44)Other Capital Outlay - Parks and Recreation: $117,000 ($5.83)
Financial Administration: $98,000 ($4.89)Water Utilities - Interest on Debt: $248,000 ($12.37)
Lomita government finances - Revenue in 2017 (per resident):
Charges - Other: $847,000 ($42.24)
Parks and Recreation: $249,000 ($12.42)Federal Intergovernmental - General Local Government Support: $936,000 ($46.68)
Other: $311,000 ($15.51)Housing and Community Development: $122,000 ($6.08)Local Intergovernmental - Housing and Community Development: $30,000 ($1.50)
Miscellaneous - Rents: $490,000 ($24.44)
Fines and Forfeits: $387,000 ($19.30)Interest Earnings: $25,000 ($1.25)Revenue - Water Utilities: $4,895,000 ($244.10)
State Intergovernmental - Other: $2,274,000 ($113.40)
Water Utilities: $727,000 ($36.25)Highways: $389,000 ($19.40)General Local Government Support: $13,000 ($0.65)Tax - Property: $2,164,000 ($107.91)
General Sales and Gross Receipts: $1,626,000 ($81.09)Other License: $758,000 ($37.80)Occupation and Business License - Other: $544,000 ($27.13)Public Utilities Sales: $395,000 ($19.70)Other: $269,000 ($13.41)Other Selective Sales: $178,000 ($8.88)Documentary and Stock Transfer: $85,000 ($4.24)
Lomita government finances - Debt in 2017 (per resident):
Long Term Debt - Beginning Outstanding - Unspecified Public Purpose: $7,200,000 ($359.05)
Outstanding Unspecified Public Purpose: $6,985,000 ($348.33)Retired Unspecified Public Purpose: $215,000 ($10.72)
Lomita government finances - Cash and Securities in 2017 (per resident):
Bond Funds - Cash and Securities: $886,000 ($44.18)
Other Funds - Cash and Securities: $11,586,000 ($577.77)
2.98% of this county's 2021 resident taxpayers lived in other counties in 2020 ($81,235 average adjusted gross income )
Here:
2.98%California average:
5.19%
0.01% of residents moved from foreign countries ($155 average AGI )Los Angeles County:
0.01%California average:
0.03%
Top counties from which taxpayers relocated into this county between 2020 and 2021:
4.68% of this county's 2020 resident taxpayers moved to other counties in 2021 ($97,324 average adjusted gross income )
Here:
4.68%California average:
6.14%
0.01% of residents moved to foreign countries ($196 average AGI )Los Angeles County:
0.01%California average:
0.02%
Top counties to which taxpayers relocated from this county between 2020 and 2021:
Businesses in Lomita, CA
Name Count Name Count
7-Eleven 2 KFC 1 99 Cents Only Stores 1 Kroger 1 Albertsons 1 Little Caesars Pizza 1 AutoZone 1 MasterBrand Cabinets 2 CVS 2 Nike 1 Carl\s Jr. 1 Pizza Hut 1 Circle K 1 Quiznos 1 Cold Stone Creamery 1 Sprint Nextel 1 Curves 1 Starbucks 1 Decora Cabinetry 2 Subway 1 Domino's Pizza 1 Taco Bell 2 FedEx 3 The Room Place 1 H&R Block 1 U-Haul 1 Jack In The Box 2 UPS 2 Jones New York 3
Strongest AM radio stations in Lomita:
KNX (1070 AM; 50 kW; LOS ANGELES, CA; Owner: INFINITY BROADCASTING OPERATIONS, INC.)
KFI (640 AM; 50 kW; LOS ANGELES, CA; Owner: CAPSTAR TX LIMITED PARTNERSHIP)
KFWB (980 AM; 50 kW; LOS ANGELES, CA; Owner: INFINITY BROADCASTING OPERATIONS, INC.)
KLAC (570 AM; 50 kW; LOS ANGELES, CA; Owner: AMFM RADIO LICENSES, L.L.C.)
KSPN (710 AM; 50 kW; LOS ANGELES, CA; Owner: KABC-AM RADIO, INC.)
KBLA (1580 AM; 50 kW; SANTA MONICA, CA)
KTNQ (1020 AM; 50 kW; LOS ANGELES, CA; Owner: KTNQ-AM LICENSE CORP.)
KMPC (1540 AM; 50 kW; LOS ANGELES, CA; Owner: ROSE CITY RADIO CORPORATION)
KXTA (1150 AM; 50 kW; LOS ANGELES, CA; Owner: CITICASTERS LICENSES, L.P.)
KDIS (1110 AM; 50 kW; PASADENA, CA; Owner: ABC,INC.)
KFRN (1280 AM; 1 kW; LONG BEACH, CA; Owner: FAMILY STATIONS, INC.)
KXMX (1190 AM; 25 kW; ANAHEIM, CA; Owner: NEW INSPIRATION BROADCASTING COMPANY)
KRLA (870 AM; 20 kW; GLENDALE, CA; Owner: NEW INSPIRATION BROADCASTING COMPANY)
Strongest FM radio stations in Lomita:
KZAB (93.5 FM; REDONDO BEACH, CA; Owner: KZAB LICENSING, INC.)
KKBT (100.3 FM; LOS ANGELES, CA; Owner: RADIO ONE LICENSES, LLC)
KZLA-FM (93.9 FM; LOS ANGELES, CA; Owner: EMMIS RADIO LICENSE CORPORATION)
KPWR (105.9 FM; LOS ANGELES, CA; Owner: EMMIS RADIO LICENSE CORPORATION)
KLSX (97.1 FM; LOS ANGELES, CA; Owner: INFINITY BROADCASTING OPERATIONS, INC.)
KUSC (91.5 FM; LOS ANGELES, CA; Owner: UNIVERSITY OF SOUTHERN CALIFORNIA)
KRTH-FM (101.1 FM; LOS ANGELES, CA; Owner: INFINITY BROADCASTING OPERATIONS, INC.)
KKLA-FM (99.5 FM; LOS ANGELES, CA; Owner: NEW INSPIRATION BROADCASTING CO., INC.)
KBUE (105.5 FM; LONG BEACH, CA; Owner: LBI RADIO LICENSE CORP.)
KLAX-FM (97.9 FM; EAST LOS ANGELES, CA; Owner: KLAX LICENSING, INC.)
KCBS-FM (93.1 FM; LOS ANGELES, CA; Owner: INFINITY BROADCASTING OPERATIONS, INC.)
KSCA (101.9 FM; GLENDALE, CA; Owner: HBC LICENSE CORPORATION)
KLOS (95.5 FM; LOS ANGELES, CA; Owner: KLOS-FM RADIO, INC.)
K212FA (90.3 FM; TEMPLE CITY, CA; Owner: EDUCATIONAL MEDIA FOUNDATION)
KOST (103.5 FM; LOS ANGELES, CA; Owner: CAPSTAR TX LIMITED PARTNERSHIP)
KLVE (107.5 FM; LOS ANGELES, CA; Owner: KLVE-FM LICENSE CORP.)
KIIS-FM (102.7 FM; LOS ANGELES, CA; Owner: CITICASTERS LICENSES, L.P.)
KPCC (89.3 FM; PASADENA, CA; Owner: PASADENA AREA COMMUNITY COLLEGE DISTRICT)
KHHT (92.3 FM; LOS ANGELES, CA; Owner: AMFM RADIO LICENSES, L.L.C.)
KBIG-FM (104.3 FM; LOS ANGELES, CA; Owner: AMFM RADIO LICENSES, L.L.C.)
TV broadcast stations around Lomita:
KTRO-LP (Channel 50; LANCASTER, CA; Owner: ROBERT D. ADELMAN)
KCBS-TV (Channel 2; LOS ANGELES, CA; Owner: CBS BROADCASTING INC.)
FCC Registered Antenna Towers: 26 (
See the full list of FCC Registered Antenna Towers in Lomita )
FCC Registered Broadcast Land Mobile Towers: 11 (
See the full list of FCC Registered Broadcast Land Mobile Towers in Lomita, CA )
FCC Registered Microwave Towers: 4
CA-LOS3764A, 24823 Western Ave (Lat: 33.798694 Lon: -118.309111), Type: Pole, Structure height: 15.2 m, Call Sign: WQLU870, Assigned Frequencies: 21925.0 MHz, Grant Date: 06/16/2020, Expiration Date: 04/29/2030, Cancellation Date: 06/24/2021, Certifier: Nadja S Sodos-Wallace, Registrant: Sprint Corporation, 12502 Sunrise Valley Drive, M/S: Varesa0209, Reston, VA 20196, Phone: (800) 572-8256, Fax: (703) 433-4483, Email:
CA-LOS2125C, 24205 Narbonne (Lat: 33.805444 Lon: -118.320139), Type: Bant, Structure height: 9.8 m, Overall height: 11.8 m, Call Sign: WQLV289, Assigned Frequencies: 21825.0 MHz, Grant Date: 06/23/2020, Expiration Date: 04/30/2030, Cancellation Date: 05/10/2023, Certifier: Nadja S Sodos-Wallace, Registrant: T-Mobile Usa, Inc., 12920 Se 38th Street, Bellevue, WA 98006, Phone: (425) 383-8401, Email:
CA-LOS2148B, 25835 Narbonne Ave (Lat: 33.788556 Lon: -118.321000), Type: Bant, Structure height: 7.6 m, Overall height: 10.1 m, Call Sign: WQMH335, Assigned Frequencies: 22025.0 MHz, Grant Date: 09/15/2020, Expiration Date: 08/06/2030, Cancellation Date: 09/13/2021, Certifier: Nadja S Sodos-Wallace, Registrant: T-Mobile Usa, Inc., 12920 Se 38th Street, Bellevue, WA 98006, Phone: (425) 383-8402, Fax: (425) 383-4840, Email:
LMT, 26133 S Narbonne Ave (Lat: 33.785722 Lon: -118.320944), Type: Ltower, Structure height: 30.8 m, Call Sign: WAZ429, Assigned Frequencies: 19385.0 MHz, 11195.0 MHz, 10795.0 MHz, Grant Date: 02/09/2021, Expiration Date: 03/13/2031, Registrant: County Of Los Angeles, 1110 N Eastern Ave, Los Angeles, CA 90063, Phone: (323) 267-3429, Email:
FCC Registered Paging Towers: 1
25624 Walnut Street (Lat: 33.791111 Lon: -118.311722), Overall height: 14.9 m, Call Sign: KSV983, Assigned Frequencies: 152.840 MHz, Grant Date: 08/03/1998, Expiration Date: 07/01/2008, Cancellation Date: 11/03/2004, Certifier: Tommy L Cook, Registrant: Cook Telecom, Inc., 2960 Kerner Blvd., San Rafael, CA 94901-5583, Phone: (415) 460-4901, Fax: (415) 456-5566, Email:
FCC Registered Amateur Radio Licenses: 186 (
See the full list of FCC Registered Amateur Radio Licenses in Lomita )
FAA Registered Aircraft: 32 (
See the full list of FAA Registered Aircraft in Lomita )
Home Mortgage Disclosure Act Aggregated Statistics For Year 2009(Based on 4 full tracts) A) FHA, FSA/RHS & VA B) Conventional C) Refinancings D) Home Improvement Loans E) Loans on Dwellings For 5+ Families F) Non-occupant Loans on Number Average Value Number Average Value Number Average Value Number Average Value Number Average Value Number Average Value
LOANS ORIGINATED 25 $396,280 71 $326,662 331 $293,520 23 $215,087 3 $990,000 22 $248,591 APPLICATIONS APPROVED, NOT ACCEPTED 0 $0 7 $267,714 50 $339,380 3 $15,667 0 $0 2 $472,500 APPLICATIONS DENIED 7 $328,000 15 $340,000 109 $354,862 5 $119,800 1 $1,400,000 12 $370,667 APPLICATIONS WITHDRAWN 7 $426,000 10 $340,400 68 $314,721 4 $160,000 0 $0 5 $264,200 FILES CLOSED FOR INCOMPLETENESS 2 $471,500 1 $500,000 19 $374,263 2 $75,000 0 $0 0 $0
Aggregated Statistics For Year 2008(Based on 4 full tracts) A) FHA, FSA/RHS & VA B) Conventional C) Refinancings D) Home Improvement Loans E) Loans on Dwellings For 5+ Families F) Non-occupant Loans on G) Loans On Manufactured Number Average Value Number Average Value Number Average Value Number Average Value Number Average Value Number Average Value Number Average Value
LOANS ORIGINATED 8 $474,500 76 $353,039 131 $330,443 12 $168,083 3 $1,162,000 26 $332,615 3 $32,667 APPLICATIONS APPROVED, NOT ACCEPTED 0 $0 20 $305,050 45 $333,511 3 $212,000 0 $0 9 $325,333 7 $111,571 APPLICATIONS DENIED 3 $531,333 21 $382,286 91 $380,462 16 $162,375 0 $0 17 $335,588 3 $37,667 APPLICATIONS WITHDRAWN 3 $554,667 11 $349,636 48 $340,271 6 $225,333 0 $0 4 $253,250 1 $45,000 FILES CLOSED FOR INCOMPLETENESS 0 $0 6 $417,500 14 $443,286 1 $150,000 0 $0 1 $150,000 0 $0
Aggregated Statistics For Year 2007(Based on 4 full tracts) B) Conventional C) Refinancings D) Home Improvement Loans E) Loans on Dwellings For 5+ Families F) Non-occupant Loans on G) Loans On Manufactured Number Average Value Number Average Value Number Average Value Number Average Value Number Average Value Number Average Value
LOANS ORIGINATED 150 $362,527 287 $357,509 34 $272,059 6 $1,111,167 56 $365,821 0 $0 APPLICATIONS APPROVED, NOT ACCEPTED 37 $308,297 74 $369,392 13 $259,308 0 $0 11 $240,182 3 $85,333 APPLICATIONS DENIED 61 $359,787 170 $421,000 21 $176,857 0 $0 19 $330,211 7 $64,714 APPLICATIONS WITHDRAWN 22 $365,455 58 $348,103 13 $336,615 2 $500,000 6 $427,667 2 $110,500 FILES CLOSED FOR INCOMPLETENESS 4 $494,500 34 $436,412 1 $492,000 0 $0 2 $532,000 0 $0
Aggregated Statistics For Year 2006(Based on 4 full tracts) A) FHA, FSA/RHS & VA B) Conventional C) Refinancings D) Home Improvement Loans E) Loans on Dwellings For 5+ Families F) Non-occupant Loans on G) Loans On Manufactured Number Average Value Number Average Value Number Average Value Number Average Value Number Average Value Number Average Value Number Average Value
LOANS ORIGINATED 0 $0 233 $337,442 375 $350,200 51 $191,745 9 $1,606,667 46 $378,870 0 $0 APPLICATIONS APPROVED, NOT ACCEPTED 1 $313,000 42 $317,619 85 $342,329 12 $223,750 0 $0 11 $474,818 3 $59,667 APPLICATIONS DENIED 0 $0 87 $348,253 125 $408,704 21 $238,905 1 $700,000 14 $451,429 2 $163,000 APPLICATIONS WITHDRAWN 0 $0 53 $375,132 103 $375,359 13 $242,462 1 $850,000 8 $554,500 0 $0 FILES CLOSED FOR INCOMPLETENESS 0 $0 19 $356,579 25 $370,160 1 $81,000 0 $0 6 $457,167 1 $50,000
Aggregated Statistics For Year 2005(Based on 4 full tracts) B) Conventional C) Refinancings D) Home Improvement Loans E) Loans on Dwellings For 5+ Families F) Non-occupant Loans on G) Loans On Manufactured Number Average Value Number Average Value Number Average Value Number Average Value Number Average Value Number Average Value
LOANS ORIGINATED 287 $357,878 462 $336,149 78 $207,385 7 $1,296,000 64 $357,469 5 $104,200 APPLICATIONS APPROVED, NOT ACCEPTED 65 $304,338 68 $318,147 11 $153,364 0 $0 10 $332,900 7 $55,286 APPLICATIONS DENIED 96 $353,531 162 $357,117 22 $192,682 0 $0 25 $440,040 7 $54,571 APPLICATIONS WITHDRAWN 69 $349,406 146 $337,534 23 $215,391 2 $3,480,000 16 $380,750 1 $41,000 FILES CLOSED FOR INCOMPLETENESS 22 $332,227 37 $406,703 4 $135,000 0 $0 0 $0 0 $0
Aggregated Statistics For Year 2004(Based on 4 full tracts) B) Conventional C) Refinancings D) Home Improvement Loans E) Loans on Dwellings For 5+ Families F) Non-occupant Loans on G) Loans On Manufactured Number Average Value Number Average Value Number Average Value Number Average Value Number Average Value Number Average Value
LOANS ORIGINATED 268 $310,078 602 $263,880 62 $189,177 8 $1,163,000 78 $275,692 0 $0 APPLICATIONS APPROVED, NOT ACCEPTED 57 $266,772 115 $270,513 7 $291,857 0 $0 17 $277,294 2 $34,500 APPLICATIONS DENIED 50 $324,120 153 $259,863 35 $118,486 1 $75,000 18 $202,444 5 $43,800 APPLICATIONS WITHDRAWN 24 $304,542 169 $281,089 12 $145,750 0 $0 6 $265,333 0 $0 FILES CLOSED FOR INCOMPLETENESS 13 $245,077 43 $314,767 5 $69,600 0 $0 1 $200,000 0 $0
Aggregated Statistics For Year 2003(Based on 4 full tracts) A) FHA, FSA/RHS & VA B) Conventional C) Refinancings D) Home Improvement Loans E) Loans on Dwellings For 5+ Families F) Non-occupant Loans on Number Average Value Number Average Value Number Average Value Number Average Value Number Average Value Number Average Value
LOANS ORIGINATED 2 $234,500 310 $251,297 1,337 $220,997 30 $87,400 15 $1,586,933 121 $220,702 APPLICATIONS APPROVED, NOT ACCEPTED 0 $0 56 $271,929 218 $225,092 8 $107,750 0 $0 20 $261,700 APPLICATIONS DENIED 0 $0 53 $210,132 255 $237,886 13 $55,769 2 $662,500 19 $244,684 APPLICATIONS WITHDRAWN 0 $0 42 $287,762 220 $226,032 7 $98,286 0 $0 19 $209,947 FILES CLOSED FOR INCOMPLETENESS 0 $0 13 $266,615 55 $231,127 6 $26,667 1 $1,500,000 6 $242,667
Aggregated Statistics For Year 2002(Based on 4 full tracts) A) FHA, FSA/RHS & VA B) Conventional C) Refinancings D) Home Improvement Loans E) Loans on Dwellings For 5+ Families F) Non-occupant Loans on Number Average Value Number Average Value Number Average Value Number Average Value Number Average Value Number Average Value
LOANS ORIGINATED 4 $207,750 336 $202,994 867 $210,412 14 $75,714 14 $633,500 64 $203,344 APPLICATIONS APPROVED, NOT ACCEPTED 2 $58,000 36 $197,806 163 $207,742 5 $21,800 0 $0 20 $178,700 APPLICATIONS DENIED 0 $0 64 $199,375 161 $212,056 16 $24,312 1 $325,000 18 $253,333 APPLICATIONS WITHDRAWN 1 $261,000 36 $201,778 154 $214,078 9 $55,222 2 $642,500 10 $226,200 FILES CLOSED FOR INCOMPLETENESS 0 $0 9 $203,222 59 $219,169 1 $20,000 1 $2,700,000 3 $74,333
Aggregated Statistics For Year 2001(Based on 4 full tracts) A) FHA, FSA/RHS & VA B) Conventional C) Refinancings D) Home Improvement Loans E) Loans on Dwellings For 5+ Families F) Non-occupant Loans on Number Average Value Number Average Value Number Average Value Number Average Value Number Average Value Number Average Value
LOANS ORIGINATED 8 $164,375 314 $181,111 617 $191,849 27 $45,370 3 $1,550,000 52 $180,231 APPLICATIONS APPROVED, NOT ACCEPTED 0 $0 39 $224,897 97 $190,567 7 $26,571 0 $0 10 $210,600 APPLICATIONS DENIED 1 $389,000 44 $200,455 179 $190,715 16 $26,750 0 $0 13 $218,615 APPLICATIONS WITHDRAWN 0 $0 35 $247,200 124 $189,581 7 $65,714 1 $3,500,000 10 $138,100 FILES CLOSED FOR INCOMPLETENESS 0 $0 9 $171,333 47 $215,340 1 $7,000 5 $1,615,000 3 $172,000
Aggregated Statistics For Year 2000(Based on 4 full tracts) A) FHA, FSA/RHS & VA B) Conventional C) Refinancings D) Home Improvement Loans E) Loans on Dwellings For 5+ Families F) Non-occupant Loans on Number Average Value Number Average Value Number Average Value Number Average Value Number Average Value Number Average Value
LOANS ORIGINATED 17 $194,353 260 $167,069 145 $151,462 26 $29,000 9 $684,667 25 $191,800 APPLICATIONS APPROVED, NOT ACCEPTED 1 $218,000 39 $193,205 33 $143,485 11 $48,455 0 $0 5 $141,200 APPLICATIONS DENIED 1 $141,000 53 $172,604 91 $147,659 21 $30,286 5 $292,000 13 $158,000 APPLICATIONS WITHDRAWN 6 $186,167 33 $217,939 46 $127,196 8 $45,250 1 $844,000 2 $175,500 FILES CLOSED FOR INCOMPLETENESS 0 $0 7 $165,429 21 $178,190 0 $0 0 $0 2 $145,500
Aggregated Statistics For Year 1999(Based on 1 full and 3 partial tracts) A) FHA, FSA/RHS & VA B) Conventional C) Refinancings D) Home Improvement Loans E) Loans on Dwellings For 5+ Families F) Non-occupant Loans on Number Average Value Number Average Value Number Average Value Number Average Value Number Average Value Number Average Value
LOANS ORIGINATED 26 $193,740 263 $162,735 324 $160,181 22 $26,351 8 $327,030 51 $153,460 APPLICATIONS APPROVED, NOT ACCEPTED 0 $0 32 $149,154 58 $170,817 8 $19,321 0 $0 11 $136,888 APPLICATIONS DENIED 3 $272,813 63 $174,857 87 $144,571 14 $36,357 2 $360,570 10 $189,809 APPLICATIONS WITHDRAWN 5 $184,062 38 $175,911 72 $166,593 7 $69,270 3 $462,407 4 $306,705 FILES CLOSED FOR INCOMPLETENESS 1 $165,950 7 $190,229 36 $189,469 3 $25,113 8 $813,025 4 $188,365
Detailed HMDA statistics for the following Tracts:
6700.01
, 6700.02 , 6700.03 , 6701.00
Private Mortgage Insurance Companies Aggregated Statistics For Year 2009(Based on 4 full tracts) A) Conventional B) Refinancings Number Average Value Number Average Value
LOANS ORIGINATED 14 $368,786 3 $348,667 APPLICATIONS APPROVED, NOT ACCEPTED 3 $449,000 2 $412,500 APPLICATIONS DENIED 0 $0 0 $0 APPLICATIONS WITHDRAWN 1 $383,000 0 $0 FILES CLOSED FOR INCOMPLETENESS 0 $0 0 $0
Aggregated Statistics For Year 2008(Based on 4 full tracts) A) Conventional B) Refinancings Number Average Value Number Average Value
LOANS ORIGINATED 15 $437,000 3 $443,667 APPLICATIONS APPROVED, NOT ACCEPTED 7 $409,429 2 $280,000 APPLICATIONS DENIED 1 $360,000 1 $577,000 APPLICATIONS WITHDRAWN 0 $0 0 $0 FILES CLOSED FOR INCOMPLETENESS 0 $0 0 $0
Aggregated Statistics For Year 2007(Based on 4 full tracts) A) Conventional B) Refinancings Number Average Value Number Average Value
LOANS ORIGINATED 5 $479,000 4 $492,500 APPLICATIONS APPROVED, NOT ACCEPTED 0 $0 2 $578,000 APPLICATIONS DENIED 0 $0 0 $0 APPLICATIONS WITHDRAWN 1 $408,000 1 $525,000 FILES CLOSED FOR INCOMPLETENESS 0 $0 0 $0
Aggregated Statistics For Year 2006(Based on 1 full tract) A) Conventional B) Refinancings Number Average Value Number Average Value
LOANS ORIGINATED 1 $280,000 1 $389,000 APPLICATIONS APPROVED, NOT ACCEPTED 0 $0 0 $0 APPLICATIONS DENIED 0 $0 0 $0 APPLICATIONS WITHDRAWN 0 $0 0 $0 FILES CLOSED FOR INCOMPLETENESS 0 $0 0 $0
Aggregated Statistics For Year 2005(Based on 2 full tracts) A) Conventional C) Non-occupant Loans on Number Average Value Number Average Value
LOANS ORIGINATED 7 $362,857 1 $382,000 APPLICATIONS APPROVED, NOT ACCEPTED 0 $0 0 $0 APPLICATIONS DENIED 0 $0 0 $0 APPLICATIONS WITHDRAWN 0 $0 0 $0 FILES CLOSED FOR INCOMPLETENESS 0 $0 0 $0
Aggregated Statistics For Year 2004(Based on 4 full tracts) A) Conventional B) Refinancings C) Non-occupant Loans on Number Average Value Number Average Value Number Average Value
LOANS ORIGINATED 6 $429,167 3 $303,667 0 $0 APPLICATIONS APPROVED, NOT ACCEPTED 2 $394,500 3 $352,000 0 $0 APPLICATIONS DENIED 1 $540,000 0 $0 0 $0 APPLICATIONS WITHDRAWN 2 $376,000 0 $0 1 $540,000 FILES CLOSED FOR INCOMPLETENESS 0 $0 0 $0 0 $0
Aggregated Statistics For Year 2003(Based on 4 full tracts) A) Conventional B) Refinancings C) Non-occupant Loans on Number Average Value Number Average Value Number Average Value
LOANS ORIGINATED 18 $277,667 12 $293,500 1 $270,000 APPLICATIONS APPROVED, NOT ACCEPTED 7 $239,000 8 $293,000 0 $0 APPLICATIONS DENIED 0 $0 0 $0 0 $0 APPLICATIONS WITHDRAWN 1 $197,000 0 $0 0 $0 FILES CLOSED FOR INCOMPLETENESS 0 $0 1 $171,000 0 $0
Aggregated Statistics For Year 2002(Based on 4 full tracts) A) Conventional B) Refinancings C) Non-occupant Loans on Number Average Value Number Average Value Number Average Value
LOANS ORIGINATED 29 $253,483 25 $252,000 1 $256,000 APPLICATIONS APPROVED, NOT ACCEPTED 10 $254,800 6 $295,333 1 $161,000 APPLICATIONS DENIED 2 $168,000 1 $272,000 0 $0 APPLICATIONS WITHDRAWN 2 $161,500 0 $0 0 $0 FILES CLOSED FOR INCOMPLETENESS 0 $0 0 $0 0 $0
Aggregated Statistics For Year 2001(Based on 4 full tracts) A) Conventional B) Refinancings C) Non-occupant Loans on Number Average Value Number Average Value Number Average Value
LOANS ORIGINATED 38 $243,184 17 $231,529 0 $0 APPLICATIONS APPROVED, NOT ACCEPTED 14 $233,786 5 $251,600 0 $0 APPLICATIONS DENIED 0 $0 0 $0 0 $0 APPLICATIONS WITHDRAWN 2 $245,000 1 $133,000 1 $133,000 FILES CLOSED FOR INCOMPLETENESS 0 $0 0 $0 0 $0
Aggregated Statistics For Year 2000(Based on 4 full tracts) A) Conventional B) Refinancings C) Non-occupant Loans on Number Average Value Number Average Value Number Average Value
LOANS ORIGINATED 53 $216,283 13 $246,077 1 $167,000 APPLICATIONS APPROVED, NOT ACCEPTED 9 $222,222 5 $251,000 0 $0 APPLICATIONS DENIED 7 $234,571 2 $169,500 1 $176,000 APPLICATIONS WITHDRAWN 3 $195,667 0 $0 0 $0 FILES CLOSED FOR INCOMPLETENESS 0 $0 0 $0 0 $0
Aggregated Statistics For Year 1999(Based on 1 full and 3 partial tracts) A) Conventional B) Refinancings C) Non-occupant Loans on Number Average Value Number Average Value Number Average Value
LOANS ORIGINATED 46 $195,242 24 $186,417 3 $207,120 APPLICATIONS APPROVED, NOT ACCEPTED 7 $177,581 5 $222,252 1 $127,400 APPLICATIONS DENIED 3 $244,457 5 $217,174 0 $0 APPLICATIONS WITHDRAWN 2 $245,265 1 $205,860 1 $292,910 FILES CLOSED FOR INCOMPLETENESS 0 $0 0 $0 0 $0
Detailed PMIC statistics for the following Tracts:
6700.01
, 6700.02 , 6700.03 , 6701.00
Most common first names in Lomita, CA among deceased individuals Name Count Lived (average)
John 166 72.8 years Mary 133 79.3 years William 122 70.9 years James 80 70.2 years Robert 78 71.1 years Charles 72 73.2 years George 70 71.5 years Helen 64 80.4 years Dorothy 57 76.6 years Joseph 57 75.4 years
Most common last names in Lomita, CA among deceased individuals Last name Count Lived (average)
Johnson 42 72.5 years Smith 41 74.7 years Anderson 30 76.9 years Davis 25 74.3 years Brown 25 74.5 years Clark 22 74.7 years Williams 22 71.0 years Thompson 20 77.0 years Miller 20 73.6 years Jones 19 74.0 years
Lomita compared to California state average:
Unemployed percentage below state average. Median age above state average. Length of stay since moving in significantly above state average. Percentage of population with a bachelor's degree or higher above state average.
#23 on the list of "Top 101 cities with the most residents born in Japan (population 500+)"
#1 on the list of "Top 101 counties with the most Evangelical Protestant congregations"
#1 on the list of "Top 101 counties with the most Mainline Protestant congregations"
#1 on the list of "Top 101 counties with the most Orthodox adherents"
#1 on the list of "Top 101 counties with the highest ground withdrawal of fresh water for public supply (pop. 50,000+)"
#1 on the list of "Top 101 counties with the most Catholic adherents (pop. 50,000+)"
Top Patent Applicants
Kevin Yang (14)
William A. Parkyn (14)
Anthony Jeremiah Bayne (12)
Gabriel Gallegos-Lopez (10)
William A. Parkyn, Jr. (6)
John G. Vollmer (4)
John A. Brown (4)
Anthony R. Brandelli (4)
Matthew H. Martin (3)
Chia-Chou Yeh (3)
Total of 136 patent applications in 2008-2024.
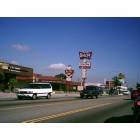
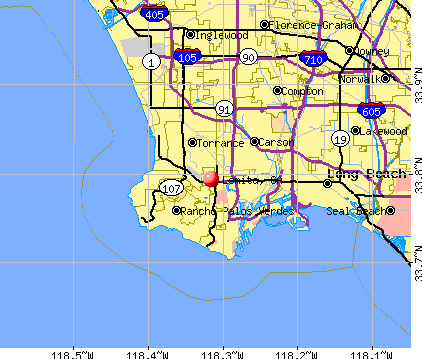


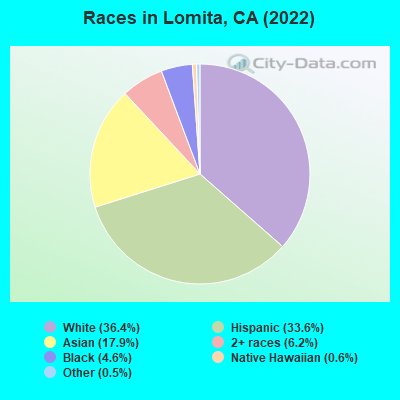
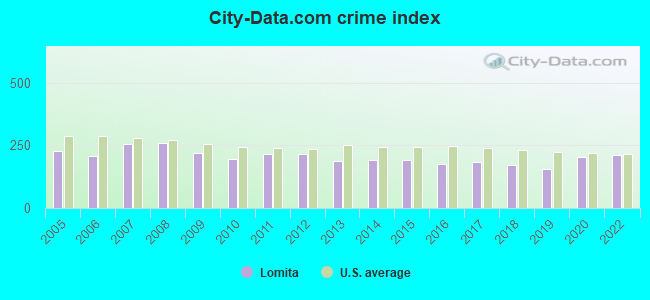
 Recent articles from our blog. Our writers, many of them Ph.D. graduates or candidates, create easy-to-read articles on a wide variety of topics.

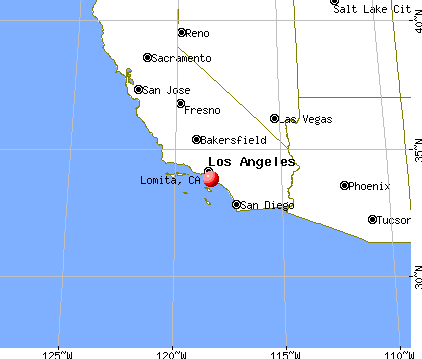
 (3.2 miles
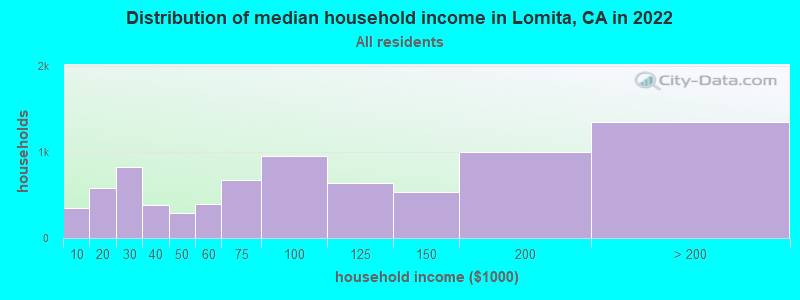
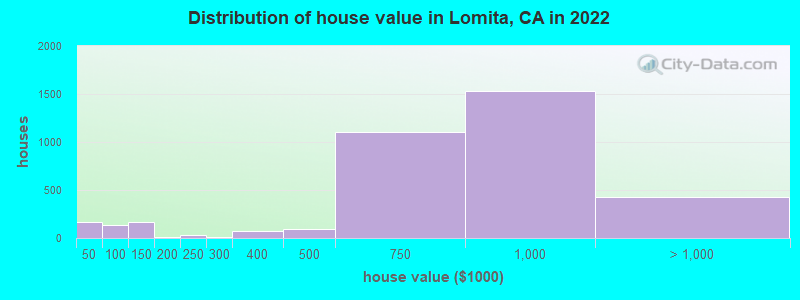
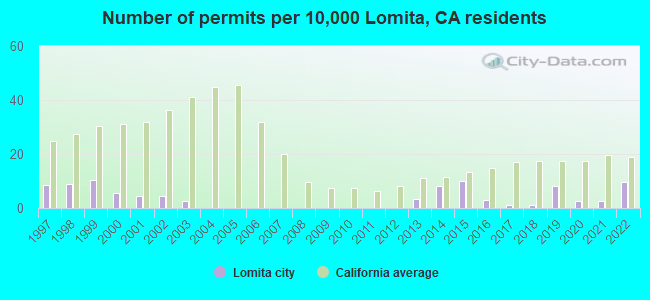
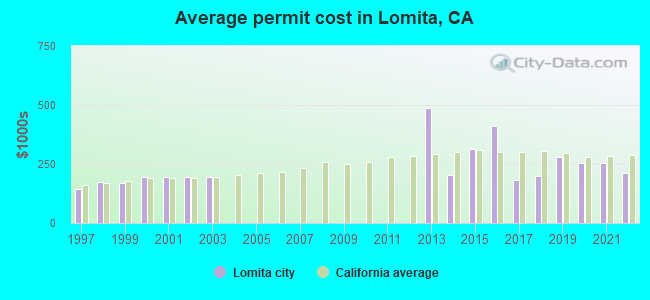
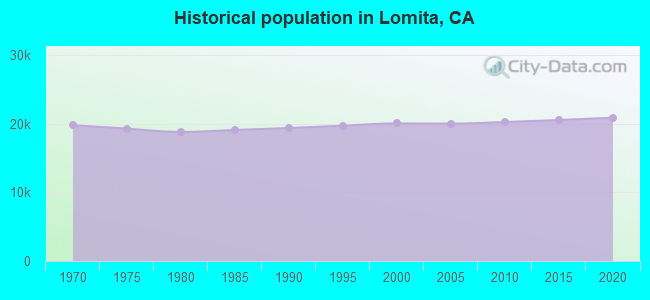
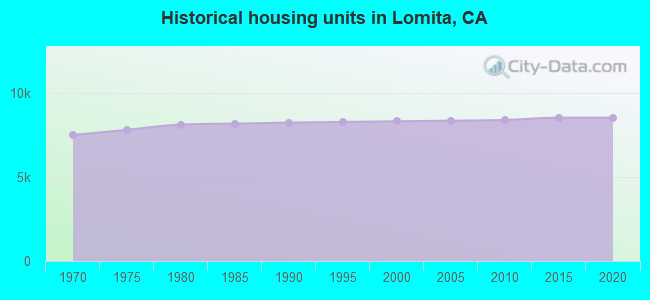
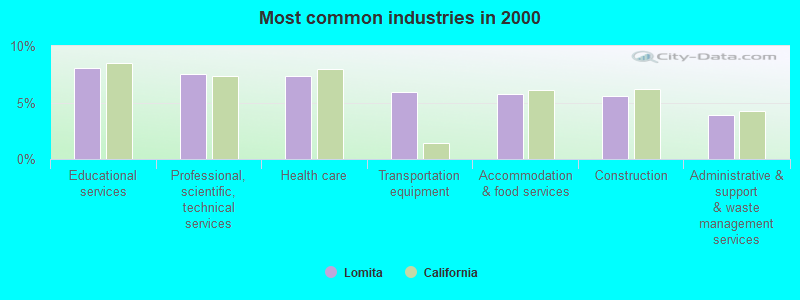
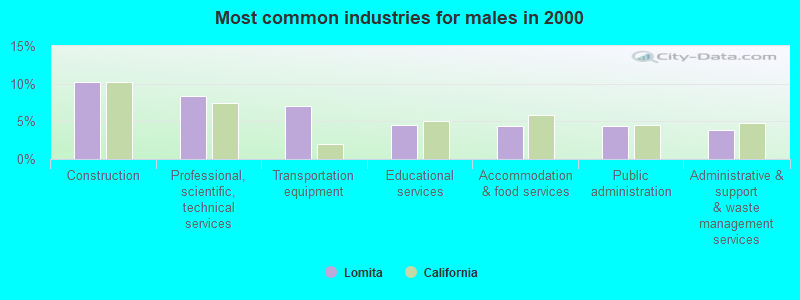
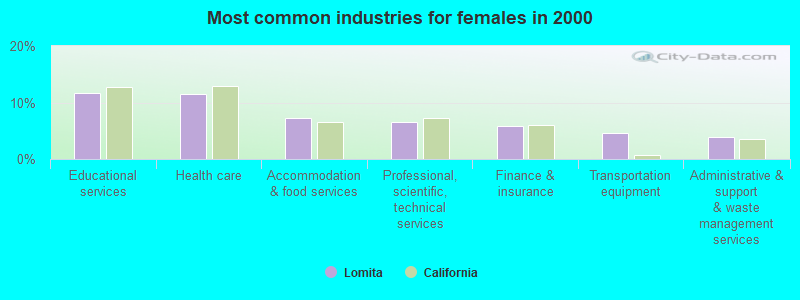
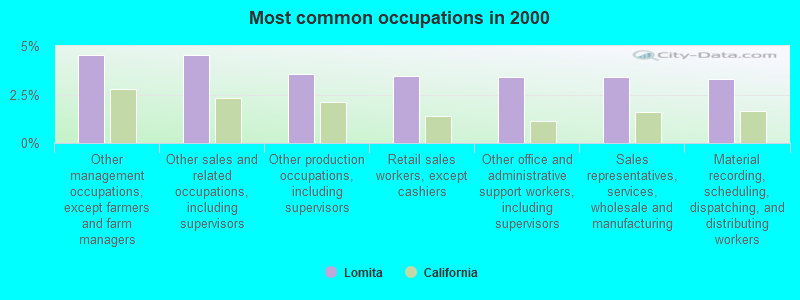
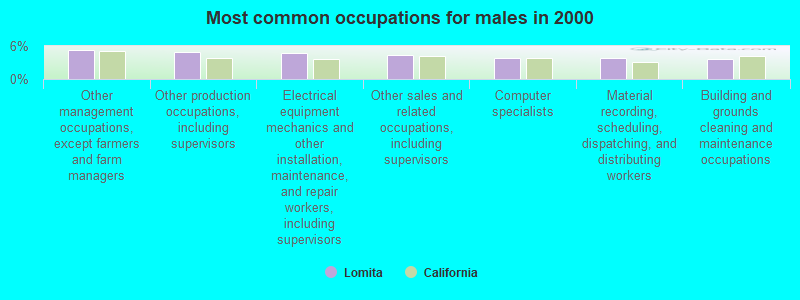
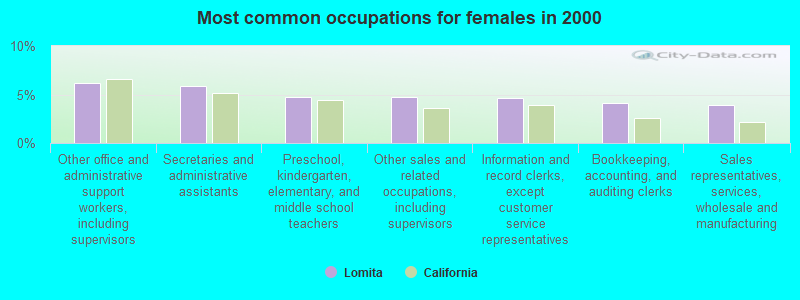
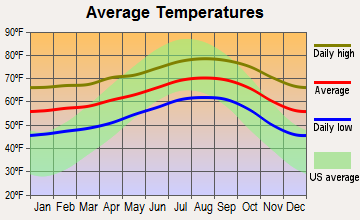
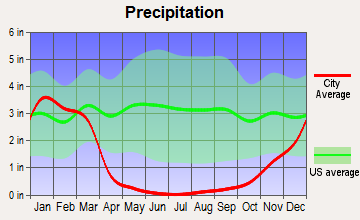
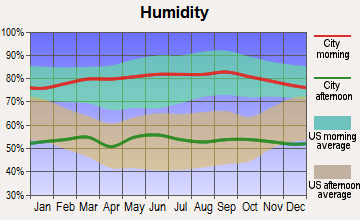
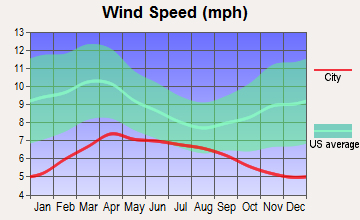
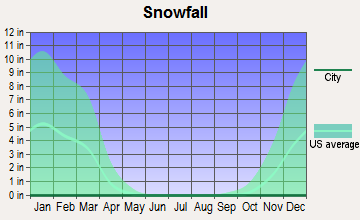
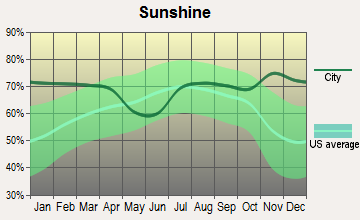
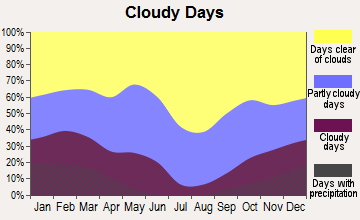
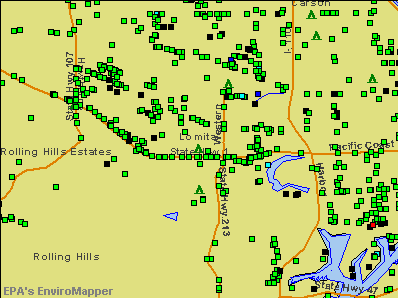

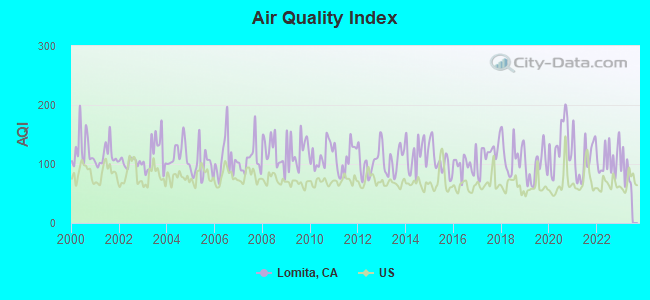
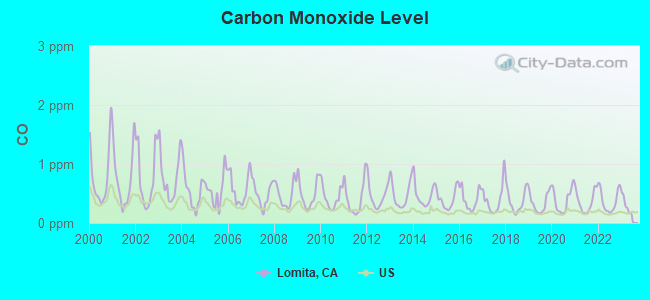
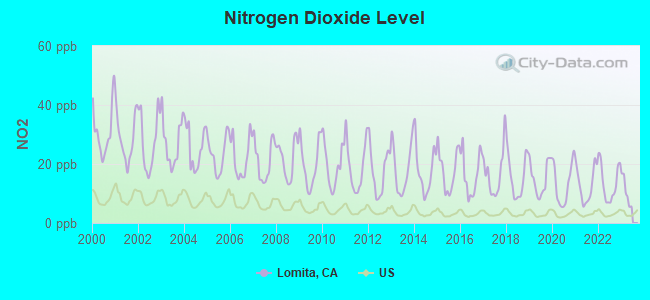
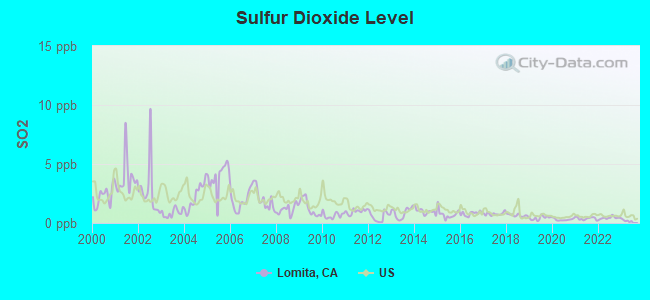
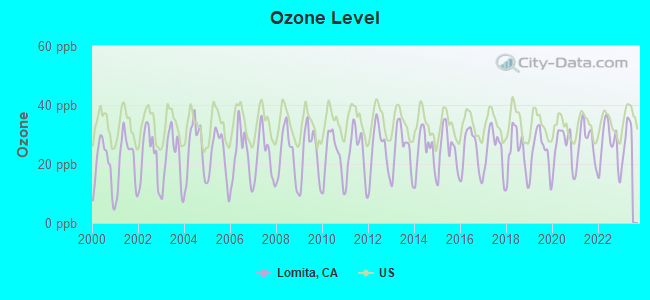
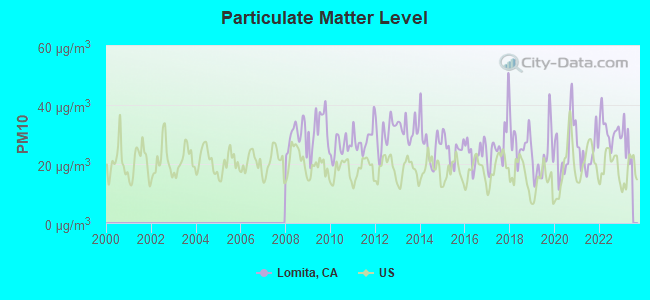
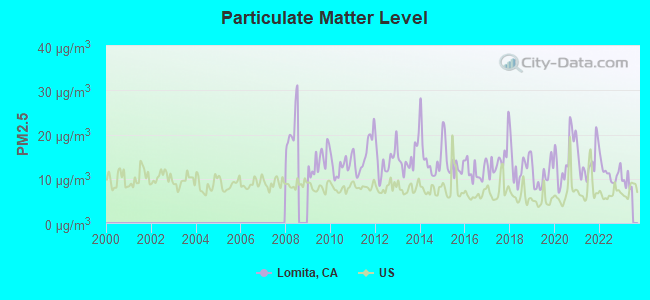
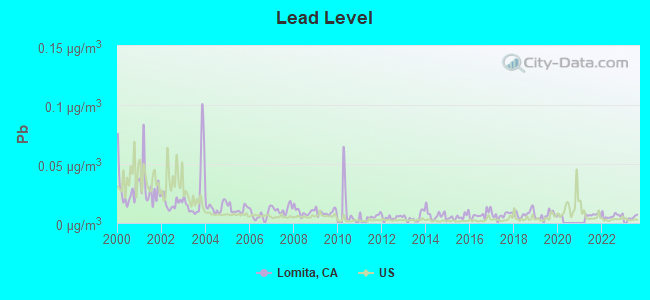
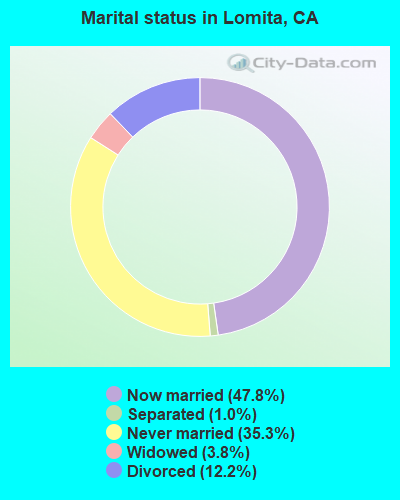
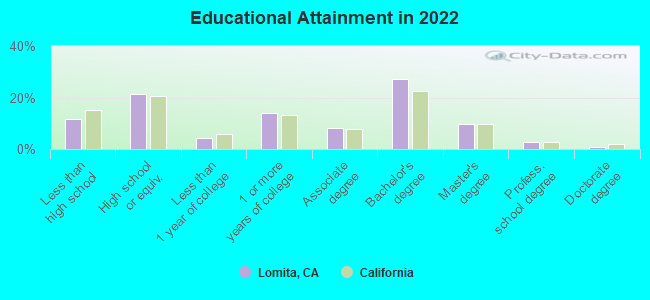
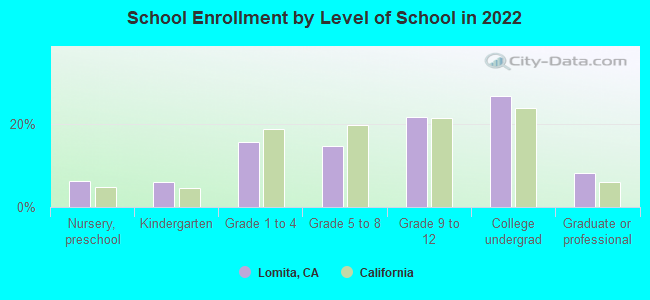
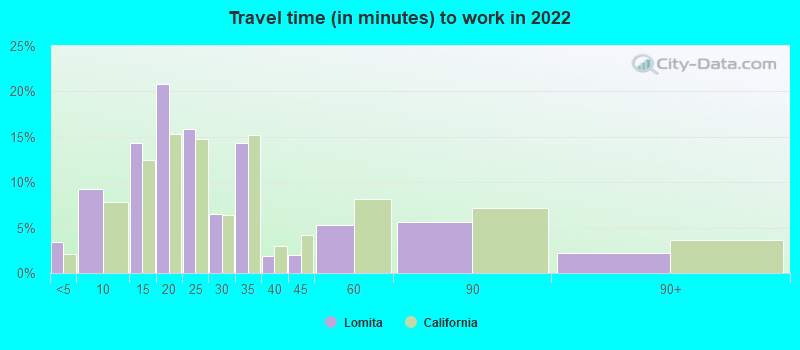
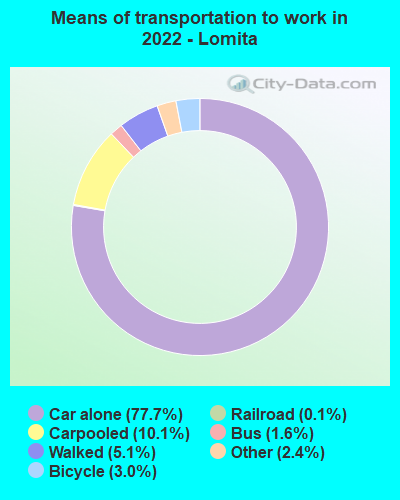


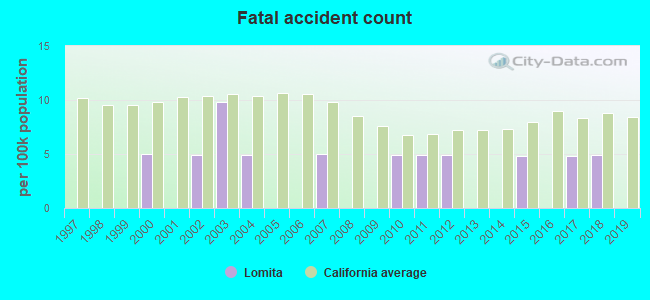
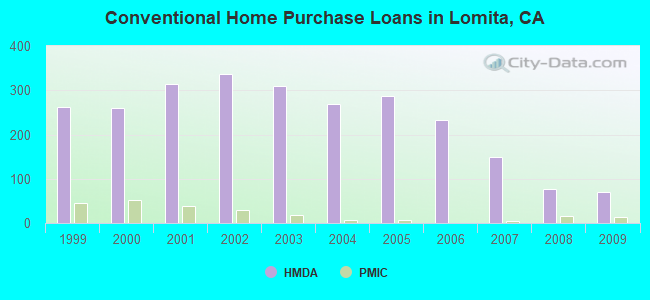
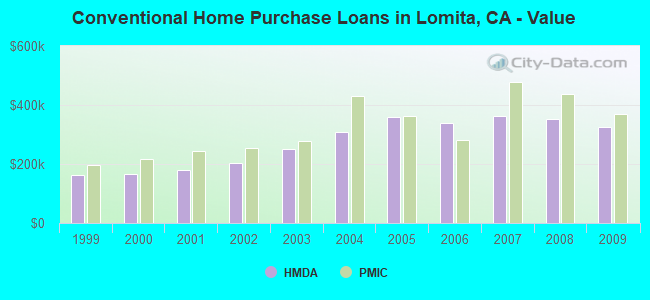
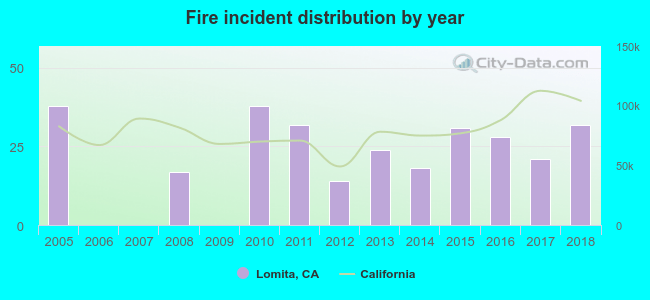 Based on the data from the years 2005 - 2018 the average number of fires per year is 21. The highest number of reported fires - 38 took place in 2005, and the least - 0 in 2006. The data has a declining trend.
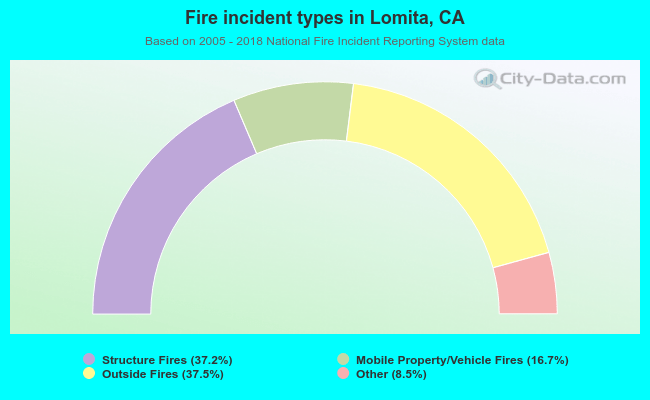 When looking into fire subcategories, the most reports belonged to: Outside Fires (37.5%), and Structure Fires (37.2%).