Rolling Hills, California
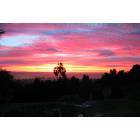
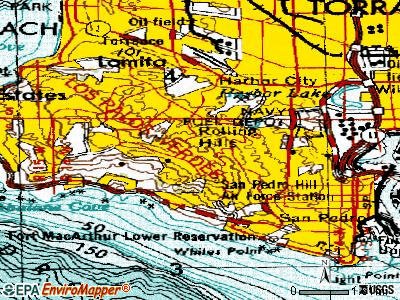
Rolling Hills: Rolling Hills over looking L.A. harbour
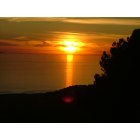
Rolling Hills: Photo taken on horseback riding along Crest Rd., actual colors, not altered.
- add
your
Submit your own pictures of this city and show them to the world
- OSM Map
- General Map
- Google Map
- MSN Map
Population change since 2000: -10.4%
 |
| Males: 835 | |
| Females: 841 |
| Median resident age: | 58.2 years |
| California median age: | 37.9 years |
Zip codes: 90274.
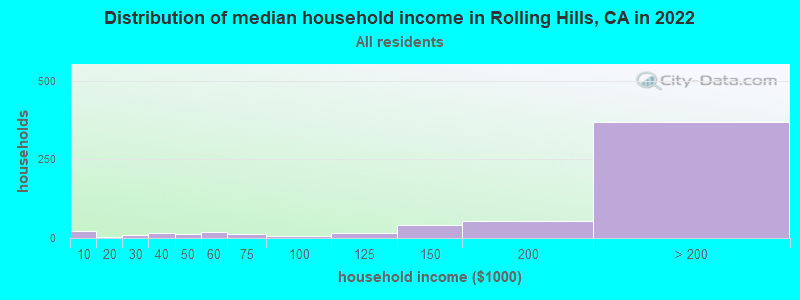
| Rolling Hills: | over $200,000 |
| CA: | $91,551 |
Estimated per capita income in 2022: $193,305 (it was $111,031 in 2000)
Rolling Hills city income, earnings, and wages data
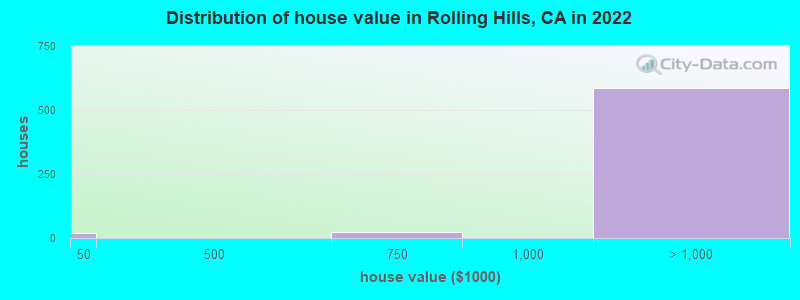
Estimated median house or condo value in 2022: over $1,000,000 (it was over $1,000,000 in 2000)
| Rolling Hills: | over $1,000,000 |
| CA: | $715,900 |
Mean prices in 2022: all housing units: over $1,000,000; detached houses: over $1,000,000; townhouses or other attached units: over $1,000,000
Median gross rent in 2022: $3,501.
(5.5% for White Non-Hispanic residents, 35.6% for Hispanic or Latino residents, 13.1% for two or more races residents)
Detailed information about poverty and poor residents in Rolling Hills, CA

Compare current foreclosures near Rolling Hills, CA:
| Photo | Address | Area | Beds / Baths | Price | Details |
|---|---|---|---|---|---|

|
#1
Mira Mar Ave
Long Beach, CA 90814
|
1,902 sq. feet
|
2 baths 4 beds |
show details | |

|
#2
W Arbor St # 57
Long Beach, CA 90805
|
1,585 sq. feet
|
2 baths 3 beds |
show details | |

|
#3
Redondo Avenue, Units 5-8
Long Beach, CA 90804
|
3,360 sq. feet
|
4 baths 8 beds |
show details | |

|
#4
W 110th St
Inglewood, CA 90303
|
3,481 sq. feet
|
4 baths 6 beds |
show details | |

|
#5
E 60th St
Los Angeles, CA 90001
|
1,883 sq. feet
|
3 baths 5 beds |
show details | |

|
#6
Norwalk Blvd Apt
Hawaiian Gardens, CA 90716
|
800 sq. feet
|
2 baths 1 beds |
show details | |

|
#7
Dunrobin Ave
Downey, CA 90242
|
3,000 sq. feet
|
4 baths 8 beds |
show details | |

|
#8
Elburg St Unit A
Paramount, CA 90723
|
1,131 sq. feet
|
2 baths 3 beds |
show details | |

|
#9
Marina City Dr Unit 116
Marina Del Rey, CA 90292
|
1,722 sq. feet
|
2 baths 3 beds |
show details | |

|
#10
Village Way
Signal Hill, CA 90755
|
1,524 sq. feet
|
3 baths 3 beds |
show details |
| Photo | Address | Area | Beds / Baths | Price | Details |
|---|---|---|---|---|---|

|
#11
Claretta Ave
Lakewood, CA 90715
|
1,074 sq. feet
|
1 baths 3 beds |
show details | |

|
#12
Johnson Ave
Long Beach, CA 90805
|
1,252 sq. feet
|
2 baths 3 beds |
show details | |

|
#13
4th Ave
Los Angeles, CA 90043
|
1,536 sq. feet
|
2 baths 4 beds |
show details | |

|
#14
E Stockwell St
Compton, CA 90222
|
848 sq. feet
|
2 baths 4 beds |
show details | |

|
#15
Stevens Ave
Culver City, CA 90230
|
1,638 sq. feet
|
2 baths 4 beds |
show details | |

|
#16
W 83rd St
Inglewood, CA 90305
|
1,374 sq. feet
|
2 baths 3 beds |
show details | |

|
#17
E 59th St
Long Beach, CA 90805
|
1,036 sq. feet
|
1 baths 2 beds |
show details | |

|
#18
W 94th St
Los Angeles, CA 90044
|
1,322 sq. feet
|
2 baths 3 beds |
show details | |

|
#19
S Broadway
Los Angeles, CA 90061
|
1,620 sq. feet
|
3 baths 4 beds |
show details | |

|
#20
Josephine St
Lynwood, CA 90262
|
1,414 sq. feet
|
1 baths 3 beds |
show details |
| Photo | Address | Area | Beds / Baths | Price | Details |
|---|---|---|---|---|---|

|
#21
S Gramercy Pl
Los Angeles, CA 90047
|
1,800 sq. feet
|
2 baths 3 beds |
show details | |

|
#22
E Lincoln St
Carson, CA 90745
|
1,422 sq. feet
|
2 baths 5 beds |
show details | |

|
#23
Virginia St
Lynwood, CA 90262
|
1,548 sq. feet
|
2 baths 3 beds |
show details | |

|
#24
Saint Albans Dr
Los Alamitos, CA 90720
|
- sq. feet
|
5 baths 5 beds |
show details | |

|
#25
Missouri Ave
South Gate, CA 90280
|
1,441 sq. feet
|
2 baths 3 beds |
show details | |

|
#26
Elderhall Ave
Lakewood, CA 90712
|
1,638 sq. feet
|
2 baths 3 beds |
show details | |

|
#27
W Home St
Long Beach, CA 90805
|
1,628 sq. feet
|
2 baths 3 beds |
show details | |

|
#28
Faust Ave
Long Beach, CA 90808
|
1,434 sq. feet
|
2 baths 3 beds |
show details | |

|
#29
W 112th St
Los Angeles, CA 90047
|
1,208 sq. feet
|
1 baths 3 beds |
show details | |

|
#30
Walnut Dr
Los Angeles, CA 90001
|
944 sq. feet
|
1 baths 3 beds |
show details |
| Photo | Address | Area | Beds / Baths | Price | Details |
|---|---|---|---|---|---|

|
#31
Alviso Ave
Los Angeles, CA 90043
|
1,330 sq. feet
|
1 baths 3 beds |
show details | |

|
#32
E Poppy St
Long Beach, CA 90805
|
1,091 sq. feet
|
2 baths 2 beds |
show details | |

|
#33
Hathaway Ave Unit 26
Long Beach, CA 90815
|
957 sq. feet
|
2 baths 2 beds |
show details | |

|
#34
Windspun Dr
Huntington Beach, CA 92649
|
1,872 sq. feet
|
3 baths 3 beds |
show details | |

|
#35
S Gramercy Pl
Los Angeles, CA 90062
|
- sq. feet
|
2 baths 4 beds |
show details | |

|
#36
Cook St
Los Angeles, CA 90061
|
1,204 sq. feet
|
2 baths 4 beds |
show details | |

|
#37
W 58th Pl
Los Angeles, CA 90043
|
2,417 sq. feet
|
3 baths 4 beds |
show details | |

|
#38
Hawaiian Ave
Lakewood, CA 90715
|
1,048 sq. feet
|
1 baths 3 beds |
show details | |

|
#39
Santa Fe Ave
Lynwood, CA 90262
|
1,124 sq. feet
|
2 baths 3 beds |
show details | |

|
#40
Marbella Ave
Carson, CA 90745
|
1,348 sq. feet
|
2 baths 3 beds |
show details |
| Photo | Address | Area | Beds / Baths | Price | Details |
|---|---|---|---|---|---|

|
#41
E Hatchway St
Compton, CA 90222
|
634 sq. feet
|
1 baths 2 beds |
show details | |

|
#42
Veragua Dr
Playa Del Rey, CA 90293
|
6,881 sq. feet
|
5 baths 5 beds |
show details | |

|
#43
N Adelon Ln
Compton, CA 90221
|
1,900 sq. feet
|
3 baths 3 beds |
show details | |

|
#44
5th Ave
Los Angeles, CA 90043
|
1,315 sq. feet
|
2 baths 3 beds |
show details | |

|
#45
E Keynote St
Long Beach, CA 90808
|
1,064 sq. feet
|
1 baths 2 beds |
show details | |

|
#46
Walnut Ave
Long Beach, CA 90807
|
1,912 sq. feet
|
3 baths 2 beds |
show details | |

|
#47
Denrock Ave
Los Angeles, CA 90045
|
3,720 sq. feet
|
5 baths 4 beds |
show details | |

|
#48
Wilmington Ave
Los Angeles, CA 90059
|
850 sq. feet
|
1 baths 2 beds |
show details | |

|
#49
Ardath Ave
Gardena, CA 90249
|
1,304 sq. feet
|
2 baths 3 beds |
show details | |

|
Check over 1 million property listings on Foreclosure.com!
|
browse all offers | |||


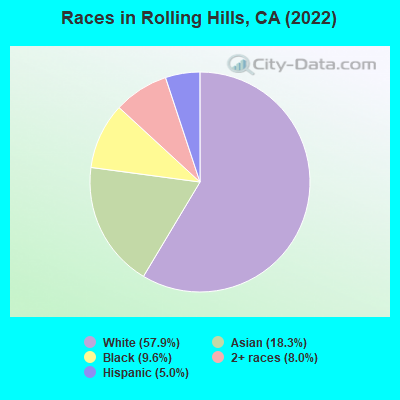
- 82257.9%White alone
- 26018.3%Asian alone
- 1369.6%Black alone
- 1138.0%Two or more races
- 715.0%Hispanic
Type |
2009 |
2010 |
2011 |
2012 |
2013 |
2014 |
2015 |
2016 |
2017 |
2018 |
2019 |
2020 |
2022 |
|---|---|---|---|---|---|---|---|---|---|---|---|---|---|
| Murders (per 100,000) | 0 (0.0) | 0 (0.0) | 0 (0.0) | 0 (0.0) | 0 (0.0) | 0 (0.0) | 0 (0.0) | 0 (0.0) | 0 (0.0) | 0 (0.0) | 0 (0.0) | 0 (0.0) | 0 (0.0) |
| Rapes (per 100,000) | 0 (0.0) | 0 (0.0) | 0 (0.0) | 0 (0.0) | 0 (0.0) | 0 (0.0) | 0 (0.0) | 0 (0.0) | 0 (0.0) | 0 (0.0) | 0 (0.0) | 0 (0.0) | 0 (0.0) |
| Robberies (per 100,000) | 0 (0.0) | 0 (0.0) | 0 (0.0) | 0 (0.0) | 0 (0.0) | 0 (0.0) | 0 (0.0) | 0 (0.0) | 0 (0.0) | 0 (0.0) | 0 (0.0) | 0 (0.0) | 0 (0.0) |
| Assaults (per 100,000) | 2 (104.6) | 4 (215.1) | 0 (0.0) | 0 (0.0) | 0 (0.0) | 1 (52.7) | 1 (52.3) | 0 (0.0) | 0 (0.0) | 0 (0.0) | 1 (53.5) | 0 (0.0) | 0 (0.0) |
| Burglaries (per 100,000) | 1 (52.3) | 5 (268.8) | 7 (371.9) | 9 (475.9) | 5 (264.0) | 9 (474.7) | 9 (470.7) | 3 (158.0) | 1 (52.9) | 1 (53.1) | 6 (321.2) | 3 (162.8) | 4 (240.0) |
| Thefts (per 100,000) | 7 (366.1) | 3 (161.3) | 6 (318.8) | 17 (899.0) | 6 (316.8) | 8 (421.9) | 4 (209.2) | 8 (421.3) | 5 (264.4) | 4 (212.2) | 2 (107.1) | 3 (162.8) | 4 (240.0) |
| Auto thefts (per 100,000) | 1 (52.3) | 0 (0.0) | 1 (53.1) | 1 (52.9) | 0 (0.0) | 1 (52.7) | 0 (0.0) | 0 (0.0) | 0 (0.0) | 0 (0.0) | 0 (0.0) | 0 (0.0) | 0 (0.0) |
| Arson (per 100,000) | 0 (0.0) | 0 (0.0) | 0 (0.0) | 0 (0.0) | 0 (0.0) | 1 (52.7) | 0 (0.0) | 1 (52.7) | 0 (0.0) | 0 (0.0) | 0 (0.0) | 0 (0.0) | 0 (0.0) |
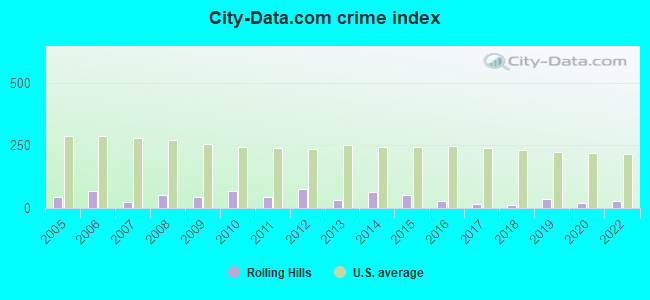
| City-Data.com crime index | 43.4 | 68.3 | 43.0 | 73.5 | 31.2 | 64.9 | 51.8 | 27.9 | 14.3 | 12.2 | 37.5 | 17.9 | 26.4 |
The City-Data.com crime index weighs serious crimes and violent crimes more heavily. Higher means more crime, U.S. average is 246.1. It adjusts for the number of visitors and daily workers commuting into cities.
Crime rate in Rolling Hills detailed stats: murders, rapes, robberies, assaults, burglaries, thefts, arson
Full-time law enforcement employees in 2015, including police officers: 1 (1 officers - 1 male; 0 female).
| Officers per 1,000 residents here: | 0.52 |
| California average: | 1.98 |
 Recent articles from our blog. Our writers, many of them Ph.D. graduates or candidates, create easy-to-read articles on a wide variety of topics.


Latest news from Rolling Hills, CA collected exclusively by city-data.com from local newspapers, TV, and radio stations
Ancestries: Iranian (7.5%), English (5.7%), German (5.7%), British (4.9%), European (4.6%), Irish (3.3%).
Current Local Time: PST time zone
Land area: 3.08 square miles.
Population density: 544 people per square mile (low).
308 residents are foreign born (16.6% Asia, 2.5% Europe).
| This city: | 21.7% |
| California: | 26.5% |
Median real estate property taxes paid for housing units with mortgages in 2022: $10,281 (0.5%)
Median real estate property taxes paid for housing units with no mortgage in 2022: $10,472 (0.5%)
Nearest city with pop. 50,000+: Palos Verdes, CA  (2.5 miles , pop. 89,786).
Nearest city with pop. 200,000+: Long Beach, CA (11.0 miles , pop. 461,522).
Nearest city with pop. 1,000,000+: Los Angeles, CA (22.7 miles , pop. 3,694,820).
Nearest cities:
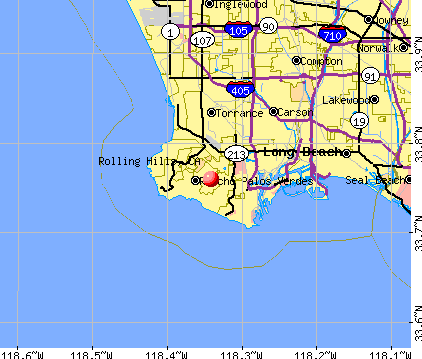
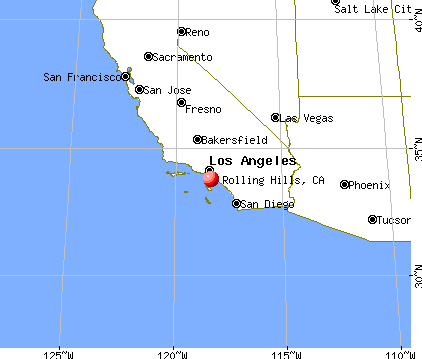
Latitude: 33.76 N, Longitude: 118.34 W
Area code commonly used in this area: 310
Property values in Rolling Hills, CA
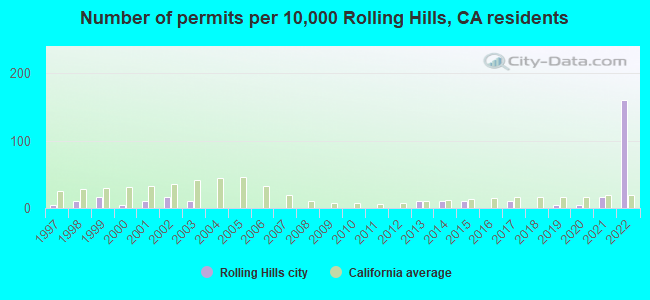
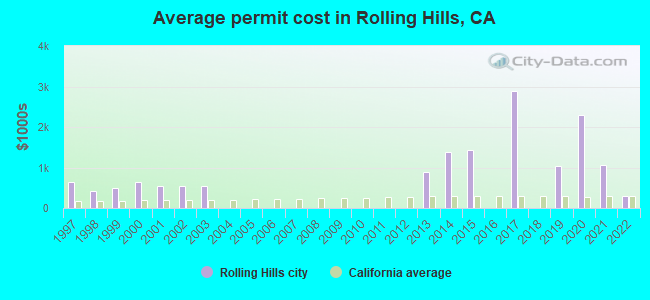
Single-family new house construction building permits:
- 2022: 30 buildings, average cost: $285,700
- 2021: 3 buildings, average cost: $1,056,300
- 2020: 1 building, cost: $2,300,000
- 2019: 1 building, cost: $1,040,000
- 2017: 2 buildings, average cost: $2,899,500
- 2015: 2 buildings, average cost: $1,423,000
- 2014: 2 buildings, average cost: $1,387,500
- 2013: 2 buildings, average cost: $897,100
- 2003: 2 buildings, average cost: $547,700
- 2002: 3 buildings, average cost: $547,700
- 2001: 2 buildings, average cost: $547,700
- 2000: 1 building, cost: $650,000
- 1999: 3 buildings, average cost: $487,300
- 1998: 2 buildings, average cost: $415,500
- 1997: 1 building, cost: $631,000
| Here: | 5.0% |
| California: | 5.1% |
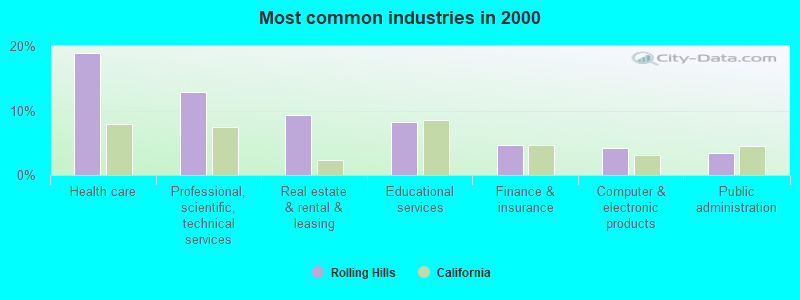
- Health care (18.9%)
- Professional, scientific, technical services (12.9%)
- Real estate & rental & leasing (9.3%)
- Educational services (8.2%)
- Finance & insurance (4.7%)
- Computer & electronic products (4.2%)
- Public administration (3.4%)
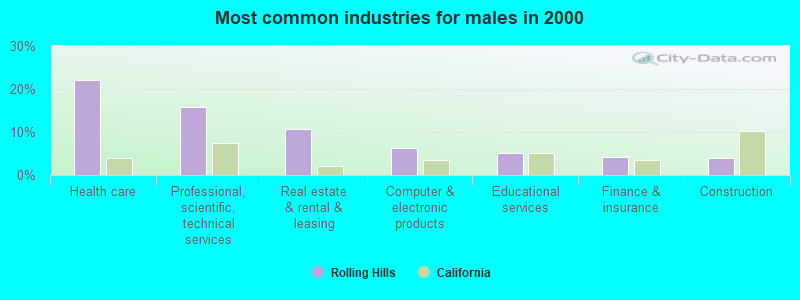
- Health care (22.0%)
- Professional, scientific, technical services (15.9%)
- Real estate & rental & leasing (10.6%)
- Computer & electronic products (6.3%)
- Educational services (5.1%)
- Finance & insurance (4.1%)
- Construction (3.9%)
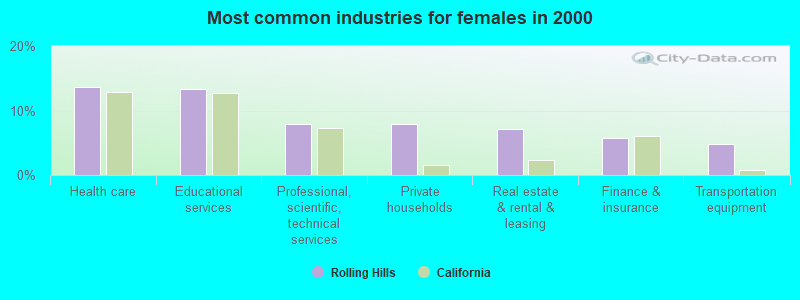
- Health care (13.7%)
- Educational services (13.3%)
- Professional, scientific, technical services (7.8%)
- Private households (7.8%)
- Real estate & rental & leasing (7.2%)
- Finance & insurance (5.8%)
- Transportation equipment (4.8%)
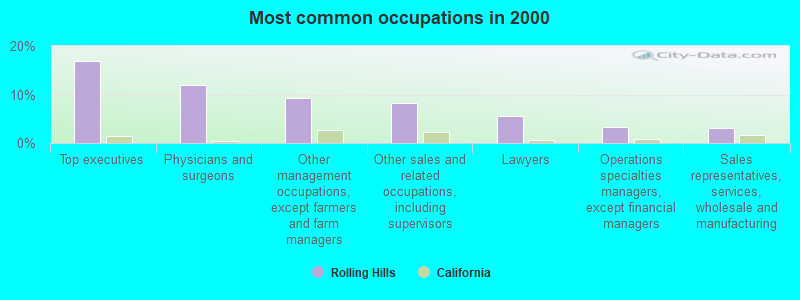
- Top executives (16.8%)
- Physicians and surgeons (12.0%)
- Other management occupations, except farmers and farm managers (9.3%)
- Other sales and related occupations, including supervisors (8.2%)
- Lawyers (5.5%)
- Operations specialties managers, except financial managers (3.3%)
- Sales representatives, services, wholesale and manufacturing (3.1%)
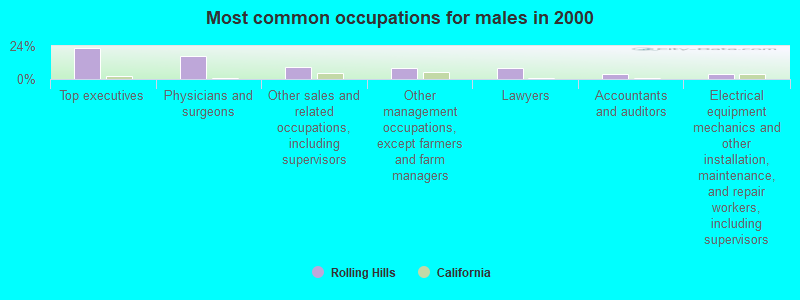
- Top executives (22.2%)
- Physicians and surgeons (16.9%)
- Other sales and related occupations, including supervisors (9.0%)
- Other management occupations, except farmers and farm managers (8.4%)
- Lawyers (7.7%)
- Accountants and auditors (3.9%)
- Electrical equipment mechanics and other installation, maintenance, and repair workers, including supervisors (3.9%)
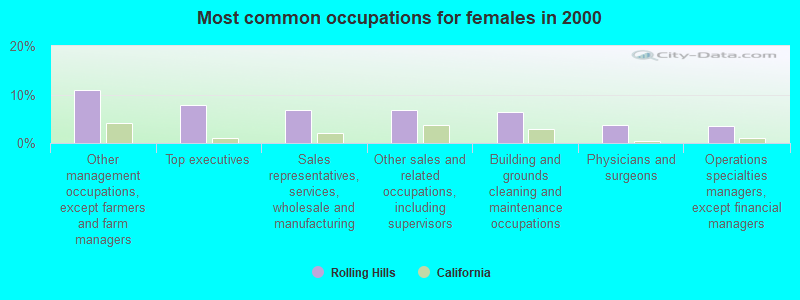
- Other management occupations, except farmers and farm managers (10.9%)
- Top executives (7.8%)
- Sales representatives, services, wholesale and manufacturing (6.8%)
- Other sales and related occupations, including supervisors (6.8%)
- Building and grounds cleaning and maintenance occupations (6.5%)
- Physicians and surgeons (3.8%)
- Operations specialties managers, except financial managers (3.4%)
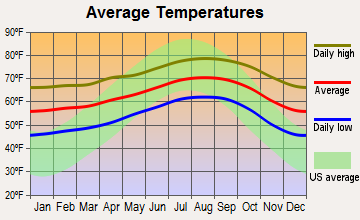
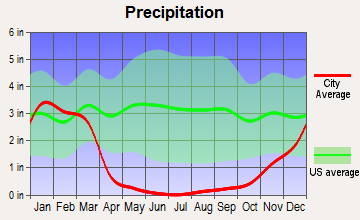
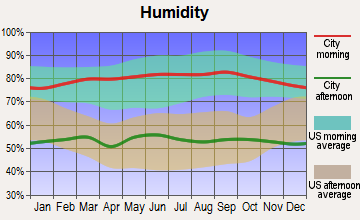
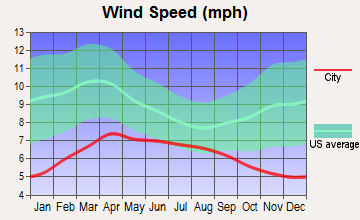
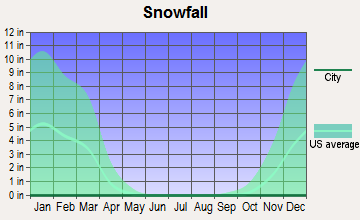
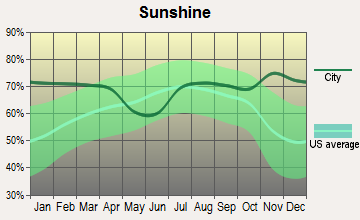
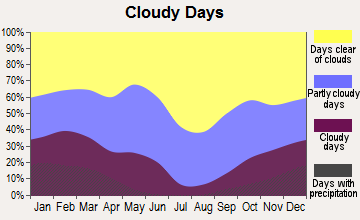
Average climate in Rolling Hills, California
Based on data reported by over 4,000 weather stations
|
|


(lower is better)
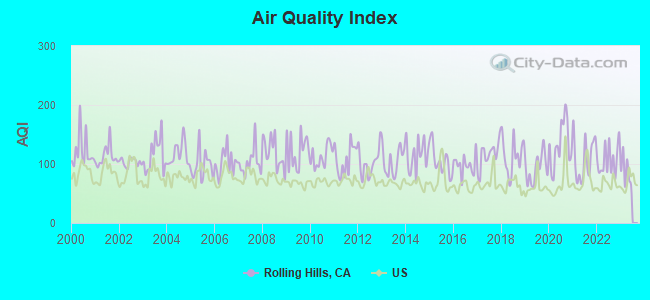
Air Quality Index (AQI) level in 2022 was 107. This is significantly worse than average.
| City: | 107 |
| U.S.: | 73 |
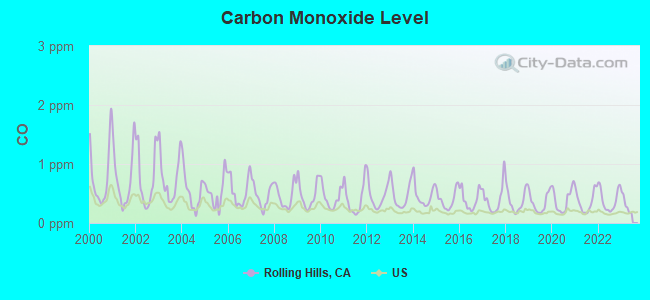
Carbon Monoxide (CO) [ppm] level in 2022 was 0.391. This is significantly worse than average. Closest monitor was 5.8 miles away from the city center.
| City: | 0.391 |
| U.S.: | 0.251 |
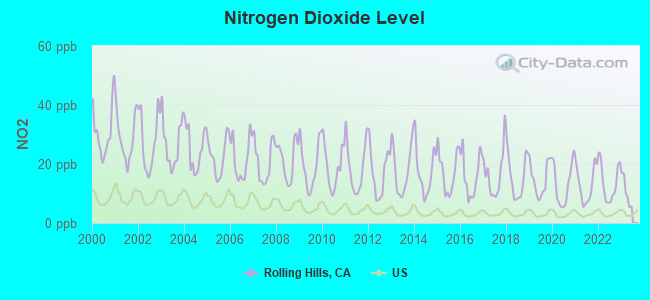
Nitrogen Dioxide (NO2) [ppb] level in 2022 was 13.7. This is significantly worse than average. Closest monitor was 5.1 miles away from the city center.
| City: | 13.7 |
| U.S.: | 5.1 |
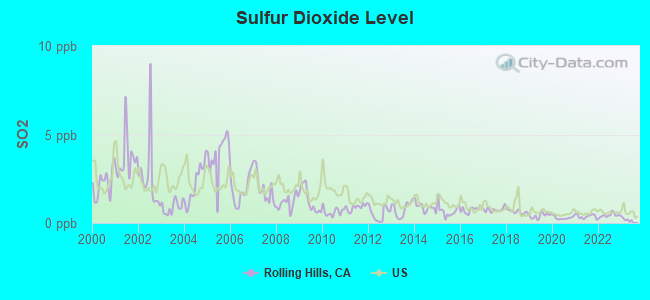
Sulfur Dioxide (SO2) [ppb] level in 2022 was 0.431. This is significantly better than average. Closest monitor was 5.1 miles away from the city center.
| City: | 0.431 |
| U.S.: | 1.515 |
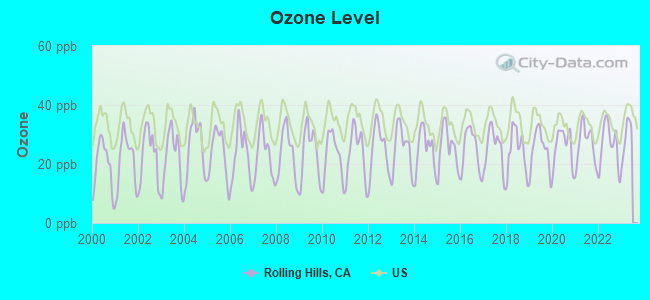
Ozone [ppb] level in 2022 was 26.3. This is better than average. Closest monitor was 5.8 miles away from the city center.
| City: | 26.3 |
| U.S.: | 33.3 |
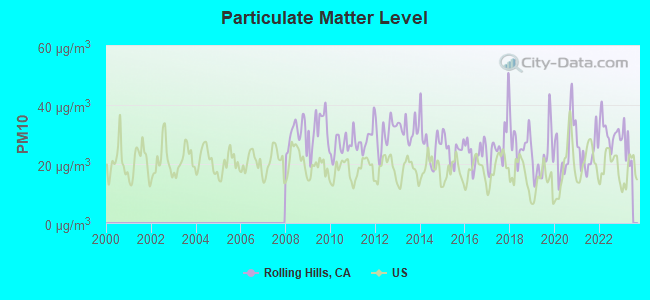
Particulate Matter (PM10) [µg/m3] level in 2022 was 31.0. This is significantly worse than average. Closest monitor was 7.6 miles away from the city center.
| City: | 31.0 |
| U.S.: | 19.2 |
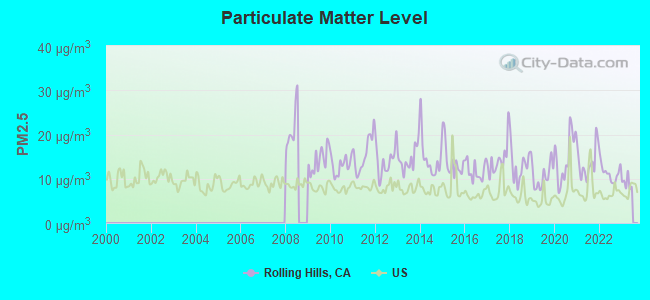
Particulate Matter (PM2.5) [µg/m3] level in 2022 was 11.4. This is significantly worse than average. Closest monitor was 9.8 miles away from the city center.
| City: | 11.4 |
| U.S.: | 8.1 |
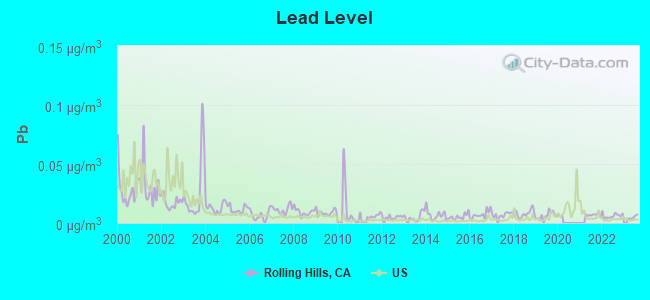
Lead (Pb) [µg/m3] level in 2022 was 0.00604. This is significantly better than average. Closest monitor was 5.1 miles away from the city center.
| City: | 0.00604 |
| U.S.: | 0.00931 |
Earthquake activity:
Rolling Hills-area historical earthquake activity is significantly above California state average. It is 6624% greater than the overall U.S. average.On 7/21/1952 at 11:52:14, a magnitude 7.7 (7.7 UK, Class: Major, Intensity: VIII - XII) earthquake occurred 93.7 miles away from Rolling Hills center, causing $50,000,000 total damage
On 6/28/1992 at 11:57:34, a magnitude 7.6 (6.2 MB, 7.6 MS, 7.3 MW, Depth: 0.7 mi) earthquake occurred 107.9 miles away from Rolling Hills center, causing 3 deaths (1 shaking deaths, 2 other deaths) and 400 injuries, causing $100,000,000 total damage and $40,000,000 insured losses
On 10/16/1999 at 09:46:44, a magnitude 7.4 (6.3 MB, 7.4 MS, 7.2 MW, 7.3 ML) earthquake occurred 121.0 miles away from the city center
On 11/4/1927 at 13:51:53, a magnitude 7.5 (7.5 UK) earthquake occurred 173.1 miles away from the city center
On 1/17/1994 at 12:30:55, a magnitude 6.8 (6.4 MB, 6.8 MS, 6.7 MW, Depth: 11.4 mi, Class: Strong, Intensity: VII - IX) earthquake occurred 30.5 miles away from the city center, causing 60 deaths (60 shaking deaths) and 7000 injuries
On 4/21/1918 at 22:32:30, a magnitude 6.8 (6.8 UK) earthquake occurred 52.0 miles away from the city center
Magnitude types: body-wave magnitude (MB), local magnitude (ML), surface-wave magnitude (MS), moment magnitude (MW)
Natural disasters:
The number of natural disasters in Los Angeles County (57) is a lot greater than the US average (15).Major Disasters (Presidential) Declared: 27
Emergencies Declared: 3
Causes of natural disasters: Fires: 37, Floods: 16, Storms: 9, Winter Storms: 6, Landslides: 5, Mudslides: 5, Earthquakes: 3, Freeze: 1, Heavy Rain: 1, Hurricane: 1, Snow: 1, Tornado: 1, Wind: 1, Other: 1 (Note: some incidents may be assigned to more than one category).
Hospitals and medical centers near Rolling Hills:
- PECK HOUSE (Hospital, about 3 miles away; TORRANCE, CA)
- CANTERBURY,THE (Nursing Home, about 3 miles away; RANCHO PALOS VERDES, CA)
- LOS PALOS CONVALESCENT HOSP (Nursing Home, about 3 miles away; SAN PEDRO, CA)
- SEACREST CONVALESCENT HOSPITAL (Nursing Home, about 3 miles away; SAN PEDRO, CA)
- TRINITYCARE HOSPICE (Hospital, about 3 miles away; TORRANCE, CA)
- PALOS VERDES HEALTH CARE CENTE (Nursing Home, about 3 miles away; LOMITA, CA)
- PROVIDENCE LITTLE CO OF MARY MED CTR SAN PEDRO Acute Care Hospitals (about 3 miles away; SAN PEDRO, CA)
Amtrak stations near Rolling Hills:
- 4 miles: SAN PEDRO (CATALINA TERMINAL, BERTH 95) - Bus Station . Services: partially wheelchair accessible, enclosed waiting area, public restrooms, public payphones, snack bar, paid short-term parking, paid long-term parking, call for taxi service.
- 9 miles: LONG BEACH (601 N. LONG BEACH BLVD.) - Bus Station . Services: fully wheelchair accessible, public restrooms, public payphones, full-service food facilities, paid short-term parking, paid long-term parking, call for taxi service, public transit connection.
Colleges/universities with over 2000 students nearest to Rolling Hills:
- Los Angeles Harbor College (about 4 miles; Wilmington, CA; Full-time enrollment: 5,285)
- Wyotech-Long Beach (about 8 miles; Long Beach, CA; FT enrollment: 2,453)
- California State University-Dominguez Hills (about 9 miles; Carson, CA; FT enrollment: 9,862)
- El Camino Community College District (about 9 miles; Torrance, CA; FT enrollment: 13,952)
- El Camino College-Compton Center (about 12 miles; Compton, CA; FT enrollment: 4,506)
- Los Angeles Southwest College (about 12 miles; Los Angeles, CA; FT enrollment: 3,247)
- Long Beach City College (about 13 miles; Long Beach, CA; FT enrollment: 15,602)
Public high school in Rolling Hills:
- RANCHO DEL MAR HIGH (CONTINUATION) (Students: 25, Location: 38 CREST RD. W., Grades: 10-12)
Points of interest:
Notable location: Los Angeles County Fire Department Station 56 (A). Display/hide its location on the map
Birthplace of: Colin Baxter - Football player, Erik Lorig - Football player.
| This city: | 2.8 people |
| California: | 2.9 people |
| This city: | 81.3% |
| Whole state: | 68.7% |
| This city: | 3.0% |
| Whole state: | 7.2% |
Likely homosexual households (counted as self-reported same-sex unmarried-partner households)
- Lesbian couples: 0.8% of all households
- Gay men: 0.6% of all households
Banks with branches in Rolling Hills (2011 data):
- Farmers and Merchants Bank of Long Beach: Rolling Hills Branch at 27525 Indian Peak Road, branch established on 2001/12/13. Info updated 2006/11/03: Bank assets: $4,659.3 mil, Deposits: $3,393.5 mil, headquarters in Long Beach, CA, positive income, Commercial Lending Specialization, 22 total offices, Holding Company: Palomar Enterprises, Llc
- JPMorgan Chase Bank, National Association: 27319 Hawthorne Blvd Branch at 27319 Hawthorne Blvd, branch established on 1889/01/01. Info updated 2011/11/10: Bank assets: $1,811,678.0 mil, Deposits: $1,190,738.0 mil, headquarters in Columbus, OH, positive income, International Specialization, 5577 total offices, Holding Company: Jpmorgan Chase & Co.
For population 15 years and over in Rolling Hills:
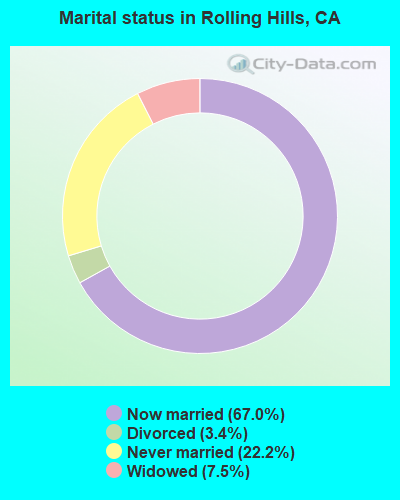
- Never married: 22.2%
- Now married: 67.0%
- Separated: 0.0%
- Widowed: 7.5%
- Divorced: 3.4%
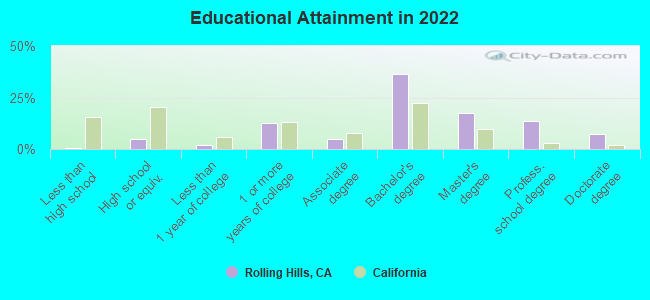
For population 25 years and over in Rolling Hills:
- High school or higher: 99.4%
- Bachelor's degree or higher: 73.8%
- Graduate or professional degree: 37.5%
- Unemployed: 0.8%
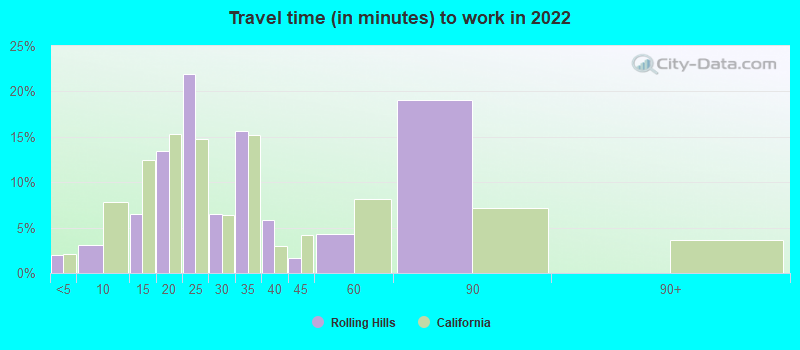
- Mean travel time to work (commute): 31.9 minutes
| Here: | 8.7 |
| California average: | 15.5 |


Graphs represent county-level data. Detailed 2008 Election Results
Religion statistics for Rolling Hills, CA (based on Los Angeles County data)


| Religion | Adherents | Congregations |
|---|---|---|
| Catholic | 3,542,994 | 275 |
| Evangelical Protestant | 814,611 | 3,249 |
| Other | 451,594 | 1,023 |
| Mainline Protestant | 229,056 | 860 |
| Black Protestant | 112,338 | 290 |
| Orthodox | 63,517 | 76 |
| None | 4,604,495 | - |
Food Environment Statistics:
| Los Angeles County: | 2.12 / 10,000 pop. |
| California: | 2.14 / 10,000 pop. |
| Los Angeles County: | 0.03 / 10,000 pop. |
| California: | 0.04 / 10,000 pop. |
| This county: | 0.58 / 10,000 pop. |
| California: | 0.62 / 10,000 pop. |
| Los Angeles County: | 1.23 / 10,000 pop. |
| California: | 1.49 / 10,000 pop. |
| Los Angeles County: | 7.15 / 10,000 pop. |
| California: | 7.42 / 10,000 pop. |
| Here: | 7.5% |
| State: | 7.3% |
| Los Angeles County: | 20.4% |
| State: | 21.3% |
| Los Angeles County: | 18.6% |
| California: | 17.9% |
Health and Nutrition:
| This city: | 60.1% |
| California: | 49.4% |
| This city: | 58.3% |
| State: | 48.0% |
| Rolling Hills: | 27.6 |
| California: | 28.1 |
| Rolling Hills: | 15.1% |
| California: | 20.2% |
| Rolling Hills: | 11.4% |
| California: | 11.2% |
| Rolling Hills: | 7.0 |
| California: | 6.8 |
| Here: | 34.3% |
| California: | 31.5% |
| This city: | 62.7% |
| State: | 56.4% |
| Rolling Hills: | 78.8% |
| California: | 80.9% |
More about Health and Nutrition of Rolling Hills, CA Residents
| Local government employment and payroll (March 2022) | |||||
| Function | Full-time employees | Monthly full-time payroll | Average yearly full-time wage | Part-time employees | Monthly part-time payroll |
|---|---|---|---|---|---|
| Other Government Administration | 4 | $42,711 | $128,133 | 0 | $0 |
| Totals for Government | 4 | $42,711 | $128,133 | 0 | $0 |
Rolling Hills government finances - Expenditure in 2017 (per resident):
- Current Operations - Central Staff Services: $1,427,000 ($851.43)
Solid Waste Management: $762,000 ($454.65)
Police Protection: $396,000 ($236.28)
Transit Utilities: $140,000 ($83.53)
Financial Administration: $110,000 ($65.63)
Protective Inspection and Regulation - Other: $96,000 ($57.28)
Regular Highways: $51,000 ($30.43)
Health - Other: $2,000 ($1.19)
- Other Capital Outlay - Regular Highways: $3,000 ($1.79)
Central Staff Services: $2,000 ($1.19)
Rolling Hills government finances - Revenue in 2017 (per resident):
- Charges - Solid Waste Management: $781,000 ($465.99)
Other: $1,000 ($0.60)
- Federal Intergovernmental - Other: $111,000 ($66.23)
- Miscellaneous - General Revenue - Other: $87,000 ($51.91)
Rents: $61,000 ($36.40)
Interest Earnings: $38,000 ($22.67)
Fines and Forfeits: $14,000 ($8.35)
- State Intergovernmental - Other: $130,000 ($77.57)
General Local Government Support: $6,000 ($3.58)
- Tax - Property: $1,198,000 ($714.80)
Other License: $645,000 ($384.84)
General Sales and Gross Receipts: $71,000 ($42.36)
Documentary and Stock Transfer: $39,000 ($23.27)
Public Utilities Sales: $20,000 ($11.93)
Rolling Hills government finances - Cash and Securities in 2017 (per resident):
- Bond Funds - Cash and Securities: $1,486,000 ($886.63)
- Other Funds - Cash and Securities: $5,390,000 ($3215.99)
2.98% of this county's 2021 resident taxpayers lived in other counties in 2020 ($81,235 average adjusted gross income)
| Here: | 2.98% |
| California average: | 5.19% |
0.01% of residents moved from foreign countries ($155 average AGI)
Los Angeles County: 0.01% California average: 0.03%
Top counties from which taxpayers relocated into this county between 2020 and 2021:
| from Orange County, CA | |
| from San Bernardino County, CA | |
| from Riverside County, CA |
4.68% of this county's 2020 resident taxpayers moved to other counties in 2021 ($97,324 average adjusted gross income)
| Here: | 4.68% |
| California average: | 6.14% |
0.01% of residents moved to foreign countries ($196 average AGI)
Los Angeles County: 0.01% California average: 0.02%
Top counties to which taxpayers relocated from this county between 2020 and 2021:
| to Orange County, CA | |
| to San Bernardino County, CA | |
| to Riverside County, CA |
| Businesses in Rolling Hills, CA | ||||
| Name | Count | Name | Count | |
|---|---|---|---|---|
| Abercrombie & Fitch | 1 | MasterBrand Cabinets | 1 | |
| Baskin-Robbins | 1 | Panda Express | 1 | |
| Decora Cabinetry | 1 | RadioShack | 1 | |
| Domino's Pizza | 1 | Starbucks | 1 | |
| GNC | 1 | Toys"R"Us | 1 | |
Strongest AM radio stations in Rolling Hills:
- KNX (1070 AM; 50 kW; LOS ANGELES, CA; Owner: INFINITY BROADCASTING OPERATIONS, INC.)
- KFI (640 AM; 50 kW; LOS ANGELES, CA; Owner: CAPSTAR TX LIMITED PARTNERSHIP)
- KFWB (980 AM; 50 kW; LOS ANGELES, CA; Owner: INFINITY BROADCASTING OPERATIONS, INC.)
- KLAC (570 AM; 50 kW; LOS ANGELES, CA; Owner: AMFM RADIO LICENSES, L.L.C.)
- KSPN (710 AM; 50 kW; LOS ANGELES, CA; Owner: KABC-AM RADIO, INC.)
- KTNQ (1020 AM; 50 kW; LOS ANGELES, CA; Owner: KTNQ-AM LICENSE CORP.)
- KBLA (1580 AM; 50 kW; SANTA MONICA, CA)
- KMPC (1540 AM; 50 kW; LOS ANGELES, CA; Owner: ROSE CITY RADIO CORPORATION)
- KXTA (1150 AM; 50 kW; LOS ANGELES, CA; Owner: CITICASTERS LICENSES, L.P.)
- KDIS (1110 AM; 50 kW; PASADENA, CA; Owner: ABC,INC.)
- KXMX (1190 AM; 25 kW; ANAHEIM, CA; Owner: NEW INSPIRATION BROADCASTING COMPANY)
- KPLS (830 AM; 50 kW; ORANGE, CA; Owner: CRN LICENSES, LLC)
- KRLA (870 AM; 20 kW; GLENDALE, CA; Owner: NEW INSPIRATION BROADCASTING COMPANY)
Strongest FM radio stations in Rolling Hills:
- KZAB (93.5 FM; REDONDO BEACH, CA; Owner: KZAB LICENSING, INC.)
- KKBT (100.3 FM; LOS ANGELES, CA; Owner: RADIO ONE LICENSES, LLC)
- KZLA-FM (93.9 FM; LOS ANGELES, CA; Owner: EMMIS RADIO LICENSE CORPORATION)
- KPWR (105.9 FM; LOS ANGELES, CA; Owner: EMMIS RADIO LICENSE CORPORATION)
- KLSX (97.1 FM; LOS ANGELES, CA; Owner: INFINITY BROADCASTING OPERATIONS, INC.)
- KRTH-FM (101.1 FM; LOS ANGELES, CA; Owner: INFINITY BROADCASTING OPERATIONS, INC.)
- KUSC (91.5 FM; LOS ANGELES, CA; Owner: UNIVERSITY OF SOUTHERN CALIFORNIA)
- KKLA-FM (99.5 FM; LOS ANGELES, CA; Owner: NEW INSPIRATION BROADCASTING CO., INC.)
- KCBS-FM (93.1 FM; LOS ANGELES, CA; Owner: INFINITY BROADCASTING OPERATIONS, INC.)
- KSCA (101.9 FM; GLENDALE, CA; Owner: HBC LICENSE CORPORATION)
- KLOS (95.5 FM; LOS ANGELES, CA; Owner: KLOS-FM RADIO, INC.)
- K212FA (90.3 FM; TEMPLE CITY, CA; Owner: EDUCATIONAL MEDIA FOUNDATION)
- KOST (103.5 FM; LOS ANGELES, CA; Owner: CAPSTAR TX LIMITED PARTNERSHIP)
- KLAX-FM (97.9 FM; EAST LOS ANGELES, CA; Owner: KLAX LICENSING, INC.)
- KLVE (107.5 FM; LOS ANGELES, CA; Owner: KLVE-FM LICENSE CORP.)
- KIIS-FM (102.7 FM; LOS ANGELES, CA; Owner: CITICASTERS LICENSES, L.P.)
- KPCC (89.3 FM; PASADENA, CA; Owner: PASADENA AREA COMMUNITY COLLEGE DISTRICT)
- KHHT (92.3 FM; LOS ANGELES, CA; Owner: AMFM RADIO LICENSES, L.L.C.)
- KBIG-FM (104.3 FM; LOS ANGELES, CA; Owner: AMFM RADIO LICENSES, L.L.C.)
- KMZT-FM (105.1 FM; LOS ANGELES, CA; Owner: MOUNT WILSON FM BROADCASTERS, INC.)
TV broadcast stations around Rolling Hills:
- KTRO-LP (Channel 50; LANCASTER, CA; Owner: ROBERT D. ADELMAN)
- KCBS-TV (Channel 2; LOS ANGELES, CA; Owner: CBS BROADCASTING INC.)
Rolling Hills fatal accident list:
Aug 17, 2008 01:45 AM, Crest Rd E, Lat: 33.752070, Lon: -118.346740, Vehicles: 1, Persons: 1, Fatalities: 1, Drunk persons involved: 1
Aug 30, 2008 02:12 AM, Saddleback Rd, Lat: 33.771250, Lon: -118.342460, Vehicles: 1, Persons: 1, Fatalities: 1
Aug 22, 1987 06:40 PM, Crest Road, Vehicles: 1, Persons: 1, Fatalities: 1, Drunk persons involved: 1
Nov 13, 1985 11:33 AM, Prtugsebnd, Vehicles: 1, Persons: 1, Fatalities: 1, Drunk persons involved: 1
FCC Registered Cell Phone Towers:
1 (See the full list of FCC Registered Cell Phone Towers in Rolling Hills)FCC Registered Antenna Towers:
46 (See the full list of FCC Registered Antenna Towers)FCC Registered Broadcast Land Mobile Towers:
19 (See the full list of FCC Registered Broadcast Land Mobile Towers in Rolling Hills, CA)FCC Registered Microwave Towers:
10 (See the full list of FCC Registered Microwave Towers in this town)FCC Registered Paging Towers:
3 (See the full list of FCC Registered Paging Towers)FCC Registered Amateur Radio Licenses:
39 (See the full list of FCC Registered Amateur Radio Licenses in Rolling Hills)FAA Registered Aircraft:
7- Aircraft: CESSNA 172M (Category: Land, Seats: 4, Weight: Up to 12,499 Pounds, Speed: 108 mph), Engine: LYCOMING 0-320 SERIES (180 HP) (4 Cycle)
N-Number: 13206, N13206, N-13206, Serial Number: 17262573, Year manufactured: 1973, Airworthiness Date: 11/20/1973, Certificate Issue Date: 02/03/2011
Registrant (Individual): Ronald E Bishop, 12 Bowie Rd, Rolling Hills, CA 90274 - Aircraft: CESSNA 150G (Category: Land, Seats: 2, Weight: Up to 12,499 Pounds, Speed: 90 mph), Engine: CONT MOTOR 0-200 SERIES (100 HP) (4 Cycle)
N-Number: 3005S, N3005S, N-3005S, Serial Number: 15066905, Year manufactured: 1967, Airworthiness Date: 06/23/1967, Certificate Issue Date: 02/24/2014
Registrant (Individual): Peter Jr Spennato, 5 Ringbit Rd E, Rolling Hills, CA 90274 - Aircraft: COSTRUZIONI AERONAUTICHE TECNA P2008 (Category: Land, Seats: 2, Weight: Up to 12,499 Pounds), Engine: AMA/EXPR UNKNOWN ENG (4 Cycle)
N-Number: 432DT, N432DT, N-432DT, Serial Number: 106, Year manufactured: 2016, Airworthiness Date: 03/24/2016, Certificate Issue Date: 06/24/2019
Registrant (Individual): Mario E Ramirez, 23 Chuckwagon Rd, Rolling Hills, CA 90274 - Aircraft: YAKOVLEV YAK-50 (Category: Land, Weight: Up to 12,499 Pounds), Engine: VEDENEYEV M14P (350 HP) (Reciprocating)
N-Number: 50RK, N50RK, N-50RK, Serial Number: 812001, Year manufactured: 1981, Airworthiness Date: 06/20/2013, Certificate Issue Date: 05/20/2011
Registrant (Individual): Craig T Ekberg, 35 Crest Rd E, Rolling Hills, CA 90274 - Aircraft: NANCHANG CHINA CJ-6A (Category: Land, Seats: 2, Weight: Up to 12,499 Pounds), Engine: VEDENEYEV M14P (350 HP) (Reciprocating)
N-Number: 556TR, N556TR, N-556TR, Serial Number: 2432060, Year manufactured: 1968, Airworthiness Date: 06/20/2013, Certificate Issue Date: 01/22/2004
Registrant (Individual): Craig T Ekberg, 35 E Crest Rd, Rolling Hills, CA 90274 - Aircraft: PIPER PA-23-160 (Category: Land, Engines: 2, Seats: 5, Weight: Up to 12,499 Pounds, Speed: 150 mph), Engine: LYCOMING 0-320 SERIES (180 HP) (Reciprocating)
N-Number: 3313P, N3313P, N-3313P, Serial Number: 23-1264, Year manufactured: 1958
Registrant (Individual): Thomas L Montgomery, 2743 Deerhill Dr, Rolling Hills, CA 90274
Deregistered: Cancel Date: 06/26/2020 - Aircraft: CESSNA 172M (Category: Land, Seats: 4, Weight: Up to 12,499 Pounds, Speed: 108 mph), Engine: LYCOMING 0-320 SERIES (180 HP) (4 Cycle)
N-Number: 9592V, N9592V, N-9592V, Serial Number: 17264394, Year manufactured: 1974, Airworthiness Date: 11/21/1974, Certificate Issue Date: 09/23/1976
Registrant (Co-Owned): Louis J Vandenberg, 8 Silver Spring Drive, Rolling Hills, CA 90274, Other Owners: Mary E Vandenberg
Deregistered: Cancel Date: 12/09/2016, Exported to: Philippines
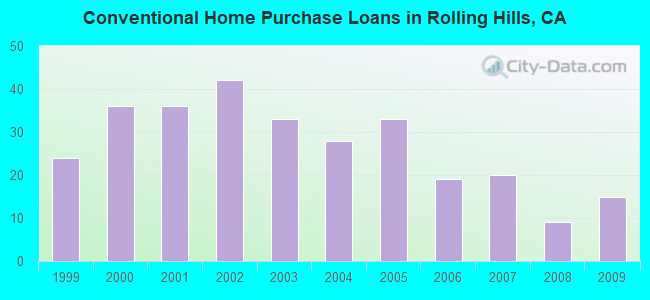
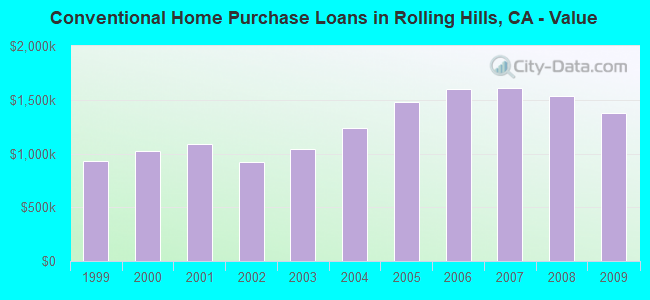
| Home Mortgage Disclosure Act Aggregated Statistics For Year 2009 (Based on 1 full tract) | ||||||||
| B) Conventional Home Purchase Loans | C) Refinancings | D) Home Improvement Loans | F) Non-occupant Loans on < 5 Family Dwellings (A B C & D) | |||||
|---|---|---|---|---|---|---|---|---|
| Number | Average Value | Number | Average Value | Number | Average Value | Number | Average Value | |
| LOANS ORIGINATED | 15 | $1,381,267 | 67 | $949,642 | 2 | $1,756,000 | 2 | $1,506,500 |
| APPLICATIONS APPROVED, NOT ACCEPTED | 0 | $0 | 5 | $411,400 | 0 | $0 | 0 | $0 |
| APPLICATIONS DENIED | 4 | $826,250 | 18 | $1,437,833 | 0 | $0 | 1 | $1,500,000 |
| APPLICATIONS WITHDRAWN | 3 | $840,000 | 13 | $1,056,769 | 0 | $0 | 0 | $0 |
| FILES CLOSED FOR INCOMPLETENESS | 0 | $0 | 5 | $683,600 | 0 | $0 | 0 | $0 |
Detailed HMDA statistics for the following Tracts: 6705.00
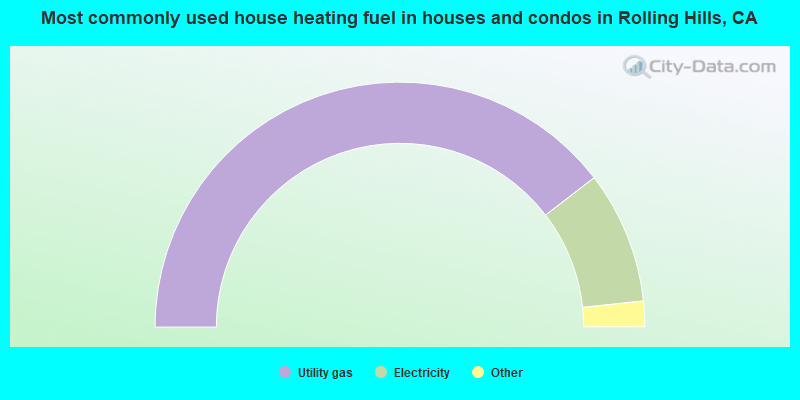
- 79.4%Utility gas
- 17.5%Electricity
- 2.7%Solar energy
- 0.4%Bottled, tank, or LP gas
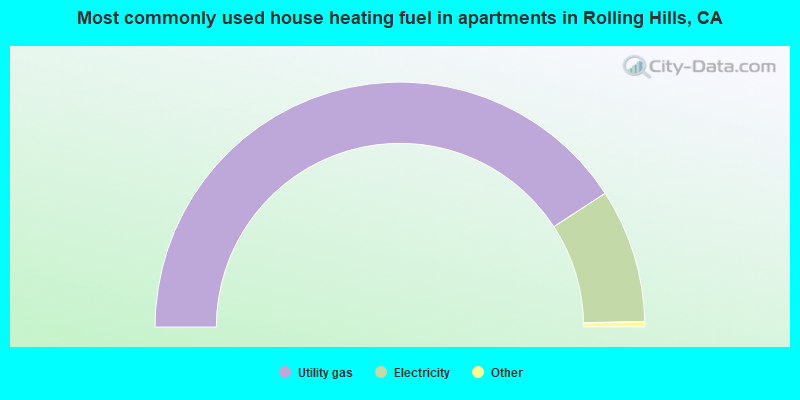
- 82.2%Utility gas
- 17.8%Electricity
Rolling Hills compared to California state average:
- Median household income above state average.
- Median house value significantly above state average.
- Unemployed percentage significantly below state average.
- Hispanic race population percentage significantly below state average.
- Median age significantly above state average.
- Foreign-born population percentage below state average.
- Renting percentage significantly below state average.
- Number of rooms per house significantly above state average.
- Number of college students below state average.
- Percentage of population with a bachelor's degree or higher significantly above state average.
Rolling Hills on our top lists:
- #25 on the list of "Top 101 cities with the most people having professional degrees (population 500+)"
- #48 on the list of "Top 101 cities with the most residents born in Japan (population 500+)"
- #54 on the list of "Top 100 cities with highest median household income"
- #79 on the list of "Top 100 cities with highest median house value"
- #47 (90274) on the list of "Top 101 zip codes with the largest percentage of taxpayers reporting taxable interest in 2012 (pop 5,000+)"
- #60 (90274) on the list of "Top 101 zip codes with the highest 2012 average Adjusted Gross Income (AGI) for individuals (pop 5,000+)"
- #68 (90274) on the list of "Top 101 zip codes with the largest percentage of taxpayers using charity contributions deductions in 2012 (pop 5,000+)"
- #76 (90274) on the list of "Top 101 zip codes with the largest percentage of taxpayers reporting net capital gain/loss in 2012 (pop 5,000+)"
- #81 (90274) on the list of "Top 101 zip codes with the highest 2012 average reported profit/loss from business (pop 5,000+)"
- #92 (90274) on the list of "Top 101 zip codes with the highest average reported salary/wage in 2012 (pop 5,000+)"
- #1 on the list of "Top 101 counties with the most Evangelical Protestant congregations"
- #1 on the list of "Top 101 counties with the most Mainline Protestant congregations"
- #1 on the list of "Top 101 counties with the most Orthodox adherents"
- #1 on the list of "Top 101 counties with the highest ground withdrawal of fresh water for public supply (pop. 50,000+)"
- #1 on the list of "Top 101 counties with the most Catholic adherents (pop. 50,000+)"
State forum archive:
- California Pages: 2 3 4 5 6 7 8 9 10 11 12 13 14 15 16 17 18 19 20 21 22 23 24 25 26 27 28 29 30 31 32 33 34 35 36 37 38 39 40 41 42 43 44 45 46 47 48 49 50 51 52 53 54 55 56 57 58 59 60 61 62 63 64 65 66 67 68 69 70 71 72 73 74 75 76 77 78 79
- Los Angeles Pages: 2 3 4 5 6 7 8 9 10 11 12 13 14 15 16 17 18 19 20 21 22 23 24 25 26 27 28 29 30 31 32 33 34 35 36 37 38 39 40 41 42 43 44 45 46 47 48 49 50 51 52 53 54 55 56 57 58 59 60 61 62 63 64 65 66 67 68 69 70 71 72 73 74 75 76 77 78 79 80 81 82 83 84 85 86 87 88 89 90 91 92 93 94 95 96 97 98 99 100 101 102 103 104 105 106 107 108 109 110 111 112 113 114 115 116 117 118 119 120 121 122 123
- Monterey County Pages: 2 3
- Orange County Pages: 2 3 4 5 6 7 8 9 10 11 12 13 14 15 16 17 18 19 20 21 22 23 24 25 26 27 28 29 30 31 32 33 34 35 36
- Sacramento Pages: 2 3 4 5 6 7 8 9 10 11 12 13 14 15 16 17 18 19 20 21 22 23 24 25 26 27 28 29 30 31 32
- San Bernardino and Riverside Counties Pages: 2 3 4 5 6 7 8 9 10 11 12 13 14 15 16 17 18 19 20 21 22 23
- San Diego Pages: 2 3 4 5 6 7 8 9 10 11 12 13 14 15 16 17 18 19 20 21 22 23 24 25 26 27 28 29 30 31 32 33 34 35 36 37 38 39 40 41 42 43 44 45 46 47 48 49 50 51 52 53 54 55 56 57 58 59 60 61 62 63 64 65 66 67 68 69 70 71 72 73 74 75 76
- San Francisco - Oakland Pages: 2 3 4 5 6 7 8 9 10 11 12 13 14 15 16 17 18 19 20 21 22 23 24 25 26 27 28 29 30 31 32 33 34 35 36 37 38 39 40 41 42 43 44 45 46 47 48 49 50 51 52 53 54 55 56 57 58 59 60 61 62 63 64 65 66 67 68 69 70 71 72
- San Jose Pages: 2 3 4 5 6 7 8 9 10 11 12 13 14 15 16 17 18 19 20 21 22 23 24
- Ventura County Pages: 2 3 4 5 6 7

|
|
Total of 93 patent applications in 2008-2024.