Redondo Beach, California Submit your own pictures of this city and show them to the world
OSM Map
General Map
Google Map
MSN Map
OSM Map
General Map
Google Map
MSN Map
OSM Map
General Map
Google Map
MSN Map
OSM Map
General Map
Google Map
MSN Map
Please wait while loading the map...
Population in 2022: 68,918 (100% urban, 0% rural). Population change since 2000: +8.9%Males: 36,074 Females: 32,844
March 2022 cost of living index in Redondo Beach: 143.2 (very high, U.S. average is 100) Percentage of residents living in poverty in 2022: 5.9%for White Non-Hispanic residents , 13.0% for Black residents , 8.5% for Hispanic or Latino residents , 22.4% for American Indian residents , 35.9% for Native Hawaiian and other Pacific Islander residents , 20.4% for other race residents , 6.0% for two or more races residents )
Profiles of local businesses
Business Search - 14 Million verified businesses
Data:
Median household income ($)
Median household income (% change since 2000)
Household income diversity
Ratio of average income to average house value (%)
Ratio of average income to average rent
Median household income ($) - White
Median household income ($) - Black or African American
Median household income ($) - Asian
Median household income ($) - Hispanic or Latino
Median household income ($) - American Indian and Alaska Native
Median household income ($) - Multirace
Median household income ($) - Other Race
Median household income for houses/condos with a mortgage ($)
Median household income for apartments without a mortgage ($)
Races - White alone (%)
Races - White alone (% change since 2000)
Races - Black alone (%)
Races - Black alone (% change since 2000)
Races - American Indian alone (%)
Races - American Indian alone (% change since 2000)
Races - Asian alone (%)
Races - Asian alone (% change since 2000)
Races - Hispanic (%)
Races - Hispanic (% change since 2000)
Races - Native Hawaiian and Other Pacific Islander alone (%)
Races - Native Hawaiian and Other Pacific Islander alone (% change since 2000)
Races - Two or more races (%)
Races - Two or more races (% change since 2000)
Races - Other race alone (%)
Races - Other race alone (% change since 2000)
Racial diversity
Unemployment (%)
Unemployment (% change since 2000)
Unemployment (%) - White
Unemployment (%) - Black or African American
Unemployment (%) - Asian
Unemployment (%) - Hispanic or Latino
Unemployment (%) - American Indian and Alaska Native
Unemployment (%) - Multirace
Unemployment (%) - Other Race
Population density (people per square mile)
Population - Males (%)
Population - Females (%)
Population - Males (%) - White
Population - Males (%) - Black or African American
Population - Males (%) - Asian
Population - Males (%) - Hispanic or Latino
Population - Males (%) - American Indian and Alaska Native
Population - Males (%) - Multirace
Population - Males (%) - Other Race
Population - Females (%) - White
Population - Females (%) - Black or African American
Population - Females (%) - Asian
Population - Females (%) - Hispanic or Latino
Population - Females (%) - American Indian and Alaska Native
Population - Females (%) - Multirace
Population - Females (%) - Other Race
Coronavirus confirmed cases (Apr 25, 2024)
Deaths caused by coronavirus (Apr 25, 2024)
Coronavirus confirmed cases (per 100k population) (Apr 25, 2024)
Deaths caused by coronavirus (per 100k population) (Apr 25, 2024)
Daily increase in number of cases (Apr 25, 2024)
Weekly increase in number of cases (Apr 25, 2024)
Cases doubled (in days) (Apr 25, 2024)
Hospitalized patients (Apr 18, 2022)
Negative test results (Apr 18, 2022)
Total test results (Apr 18, 2022)
COVID Vaccine doses distributed (per 100k population) (Sep 19, 2023)
COVID Vaccine doses administered (per 100k population) (Sep 19, 2023)
COVID Vaccine doses distributed (Sep 19, 2023)
COVID Vaccine doses administered (Sep 19, 2023)
Likely homosexual households (%)
Likely homosexual households (% change since 2000)
Likely homosexual households - Lesbian couples (%)
Likely homosexual households - Lesbian couples (% change since 2000)
Likely homosexual households - Gay men (%)
Likely homosexual households - Gay men (% change since 2000)
Cost of living index
Median gross rent ($)
Median contract rent ($)
Median monthly housing costs ($)
Median house or condo value ($)
Median house or condo value ($ change since 2000)
Mean house or condo value by units in structure - 1, detached ($)
Mean house or condo value by units in structure - 1, attached ($)
Mean house or condo value by units in structure - 2 ($)
Mean house or condo value by units in structure by units in structure - 3 or 4 ($)
Mean house or condo value by units in structure - 5 or more ($)
Mean house or condo value by units in structure - Boat, RV, van, etc. ($)
Mean house or condo value by units in structure - Mobile home ($)
Median house or condo value ($) - White
Median house or condo value ($) - Black or African American
Median house or condo value ($) - Asian
Median house or condo value ($) - Hispanic or Latino
Median house or condo value ($) - American Indian and Alaska Native
Median house or condo value ($) - Multirace
Median house or condo value ($) - Other Race
Median resident age
Resident age diversity
Median resident age - Males
Median resident age - Females
Median resident age - White
Median resident age - Black or African American
Median resident age - Asian
Median resident age - Hispanic or Latino
Median resident age - American Indian and Alaska Native
Median resident age - Multirace
Median resident age - Other Race
Median resident age - Males - White
Median resident age - Males - Black or African American
Median resident age - Males - Asian
Median resident age - Males - Hispanic or Latino
Median resident age - Males - American Indian and Alaska Native
Median resident age - Males - Multirace
Median resident age - Males - Other Race
Median resident age - Females - White
Median resident age - Females - Black or African American
Median resident age - Females - Asian
Median resident age - Females - Hispanic or Latino
Median resident age - Females - American Indian and Alaska Native
Median resident age - Females - Multirace
Median resident age - Females - Other Race
Commute - mean travel time to work (minutes)
Travel time to work - Less than 5 minutes (%)
Travel time to work - Less than 5 minutes (% change since 2000)
Travel time to work - 5 to 9 minutes (%)
Travel time to work - 5 to 9 minutes (% change since 2000)
Travel time to work - 10 to 19 minutes (%)
Travel time to work - 10 to 19 minutes (% change since 2000)
Travel time to work - 20 to 29 minutes (%)
Travel time to work - 20 to 29 minutes (% change since 2000)
Travel time to work - 30 to 39 minutes (%)
Travel time to work - 30 to 39 minutes (% change since 2000)
Travel time to work - 40 to 59 minutes (%)
Travel time to work - 40 to 59 minutes (% change since 2000)
Travel time to work - 60 to 89 minutes (%)
Travel time to work - 60 to 89 minutes (% change since 2000)
Travel time to work - 90 or more minutes (%)
Travel time to work - 90 or more minutes (% change since 2000)
Marital status - Never married (%)
Marital status - Now married (%)
Marital status - Separated (%)
Marital status - Widowed (%)
Marital status - Divorced (%)
Median family income ($)
Median family income (% change since 2000)
Median non-family income ($)
Median non-family income (% change since 2000)
Median per capita income ($)
Median per capita income (% change since 2000)
Median family income ($) - White
Median family income ($) - Black or African American
Median family income ($) - Asian
Median family income ($) - Hispanic or Latino
Median family income ($) - American Indian and Alaska Native
Median family income ($) - Multirace
Median family income ($) - Other Race
Median year house/condo built
Median year apartment built
Year house built - Built 2005 or later (%)
Year house built - Built 2000 to 2004 (%)
Year house built - Built 1990 to 1999 (%)
Year house built - Built 1980 to 1989 (%)
Year house built - Built 1970 to 1979 (%)
Year house built - Built 1960 to 1969 (%)
Year house built - Built 1950 to 1959 (%)
Year house built - Built 1940 to 1949 (%)
Year house built - Built 1939 or earlier (%)
Average household size
Household density (households per square mile)
Average household size - White
Average household size - Black or African American
Average household size - Asian
Average household size - Hispanic or Latino
Average household size - American Indian and Alaska Native
Average household size - Multirace
Average household size - Other Race
Occupied housing units (%)
Vacant housing units (%)
Owner occupied housing units (%)
Renter occupied housing units (%)
Vacancy status - For rent (%)
Vacancy status - For sale only (%)
Vacancy status - Rented or sold, not occupied (%)
Vacancy status - For seasonal, recreational, or occasional use (%)
Vacancy status - For migrant workers (%)
Vacancy status - Other vacant (%)
Residents with income below the poverty level (%)
Residents with income below 50% of the poverty level (%)
Children below poverty level (%)
Poor families by family type - Married-couple family (%)
Poor families by family type - Male, no wife present (%)
Poor families by family type - Female, no husband present (%)
Poverty status for native-born residents (%)
Poverty status for foreign-born residents (%)
Poverty among high school graduates not in families (%)
Poverty among people who did not graduate high school not in families (%)
Residents with income below the poverty level (%) - White
Residents with income below the poverty level (%) - Black or African American
Residents with income below the poverty level (%) - Asian
Residents with income below the poverty level (%) - Hispanic or Latino
Residents with income below the poverty level (%) - American Indian and Alaska Native
Residents with income below the poverty level (%) - Multirace
Residents with income below the poverty level (%) - Other Race
Air pollution - Air Quality Index (AQI)
Air pollution - CO
Air pollution - NO2
Air pollution - SO2
Air pollution - Ozone
Air pollution - PM10
Air pollution - PM25
Air pollution - Pb
Crime - Murders per 100,000 population
Crime - Rapes per 100,000 population
Crime - Robberies per 100,000 population
Crime - Assaults per 100,000 population
Crime - Burglaries per 100,000 population
Crime - Thefts per 100,000 population
Crime - Auto thefts per 100,000 population
Crime - Arson per 100,000 population
Crime - City-data.com crime index
Crime - Violent crime index
Crime - Property crime index
Crime - Murders per 100,000 population (5 year average)
Crime - Rapes per 100,000 population (5 year average)
Crime - Robberies per 100,000 population (5 year average)
Crime - Assaults per 100,000 population (5 year average)
Crime - Burglaries per 100,000 population (5 year average)
Crime - Thefts per 100,000 population (5 year average)
Crime - Auto thefts per 100,000 population (5 year average)
Crime - Arson per 100,000 population (5 year average)
Crime - City-data.com crime index (5 year average)
Crime - Violent crime index (5 year average)
Crime - Property crime index (5 year average)
1996 Presidential Elections Results (%) - Democratic Party (Clinton)
1996 Presidential Elections Results (%) - Republican Party (Dole)
1996 Presidential Elections Results (%) - Other
2000 Presidential Elections Results (%) - Democratic Party (Gore)
2000 Presidential Elections Results (%) - Republican Party (Bush)
2000 Presidential Elections Results (%) - Other
2004 Presidential Elections Results (%) - Democratic Party (Kerry)
2004 Presidential Elections Results (%) - Republican Party (Bush)
2004 Presidential Elections Results (%) - Other
2008 Presidential Elections Results (%) - Democratic Party (Obama)
2008 Presidential Elections Results (%) - Republican Party (McCain)
2008 Presidential Elections Results (%) - Other
2012 Presidential Elections Results (%) - Democratic Party (Obama)
2012 Presidential Elections Results (%) - Republican Party (Romney)
2012 Presidential Elections Results (%) - Other
2016 Presidential Elections Results (%) - Democratic Party (Clinton)
2016 Presidential Elections Results (%) - Republican Party (Trump)
2016 Presidential Elections Results (%) - Other
2020 Presidential Elections Results (%) - Democratic Party (Biden)
2020 Presidential Elections Results (%) - Republican Party (Trump)
2020 Presidential Elections Results (%) - Other
Ancestries Reported - Arab (%)
Ancestries Reported - Czech (%)
Ancestries Reported - Danish (%)
Ancestries Reported - Dutch (%)
Ancestries Reported - English (%)
Ancestries Reported - French (%)
Ancestries Reported - French Canadian (%)
Ancestries Reported - German (%)
Ancestries Reported - Greek (%)
Ancestries Reported - Hungarian (%)
Ancestries Reported - Irish (%)
Ancestries Reported - Italian (%)
Ancestries Reported - Lithuanian (%)
Ancestries Reported - Norwegian (%)
Ancestries Reported - Polish (%)
Ancestries Reported - Portuguese (%)
Ancestries Reported - Russian (%)
Ancestries Reported - Scotch-Irish (%)
Ancestries Reported - Scottish (%)
Ancestries Reported - Slovak (%)
Ancestries Reported - Subsaharan African (%)
Ancestries Reported - Swedish (%)
Ancestries Reported - Swiss (%)
Ancestries Reported - Ukrainian (%)
Ancestries Reported - United States (%)
Ancestries Reported - Welsh (%)
Ancestries Reported - West Indian (%)
Ancestries Reported - Other (%)
Educational Attainment - No schooling completed (%)
Educational Attainment - Less than high school (%)
Educational Attainment - High school or equivalent (%)
Educational Attainment - Less than 1 year of college (%)
Educational Attainment - 1 or more years of college (%)
Educational Attainment - Associate degree (%)
Educational Attainment - Bachelor's degree (%)
Educational Attainment - Master's degree (%)
Educational Attainment - Professional school degree (%)
Educational Attainment - Doctorate degree (%)
School Enrollment - Nursery, preschool (%)
School Enrollment - Kindergarten (%)
School Enrollment - Grade 1 to 4 (%)
School Enrollment - Grade 5 to 8 (%)
School Enrollment - Grade 9 to 12 (%)
School Enrollment - College undergrad (%)
School Enrollment - Graduate or professional (%)
School Enrollment - Not enrolled in school (%)
School enrollment - Public schools (%)
School enrollment - Private schools (%)
School enrollment - Not enrolled (%)
Median number of rooms in houses and condos
Median number of rooms in apartments
Housing units lacking complete plumbing facilities (%)
Housing units lacking complete kitchen facilities (%)
Density of houses
Urban houses (%)
Rural houses (%)
Households with people 60 years and over (%)
Households with people 65 years and over (%)
Households with people 75 years and over (%)
Households with one or more nonrelatives (%)
Households with no nonrelatives (%)
Population in households (%)
Family households (%)
Nonfamily households (%)
Population in families (%)
Family households with own children (%)
Median number of bedrooms in owner occupied houses
Mean number of bedrooms in owner occupied houses
Median number of bedrooms in renter occupied houses
Mean number of bedrooms in renter occupied houses
Median number of vehichles in owner occupied houses
Mean number of vehichles in owner occupied houses
Median number of vehichles in renter occupied houses
Mean number of vehichles in renter occupied houses
Mortgage status - with mortgage (%)
Mortgage status - with second mortgage (%)
Mortgage status - with home equity loan (%)
Mortgage status - with both second mortgage and home equity loan (%)
Mortgage status - without a mortgage (%)
Average family size
Average family size - White
Average family size - Black or African American
Average family size - Asian
Average family size - Hispanic or Latino
Average family size - American Indian and Alaska Native
Average family size - Multirace
Average family size - Other Race
Geographical mobility - Same house 1 year ago (%)
Geographical mobility - Moved within same county (%)
Geographical mobility - Moved from different county within same state (%)
Geographical mobility - Moved from different state (%)
Geographical mobility - Moved from abroad (%)
Place of birth - Born in state of residence (%)
Place of birth - Born in other state (%)
Place of birth - Native, outside of US (%)
Place of birth - Foreign born (%)
Housing units in structures - 1, detached (%)
Housing units in structures - 1, attached (%)
Housing units in structures - 2 (%)
Housing units in structures - 3 or 4 (%)
Housing units in structures - 5 to 9 (%)
Housing units in structures - 10 to 19 (%)
Housing units in structures - 20 to 49 (%)
Housing units in structures - 50 or more (%)
Housing units in structures - Mobile home (%)
Housing units in structures - Boat, RV, van, etc. (%)
House/condo owner moved in on average (years ago)
Renter moved in on average (years ago)
Year householder moved into unit - Moved in 1999 to March 2000 (%)
Year householder moved into unit - Moved in 1995 to 1998 (%)
Year householder moved into unit - Moved in 1990 to 1994 (%)
Year householder moved into unit - Moved in 1980 to 1989 (%)
Year householder moved into unit - Moved in 1970 to 1979 (%)
Year householder moved into unit - Moved in 1969 or earlier (%)
Means of transportation to work - Drove car alone (%)
Means of transportation to work - Carpooled (%)
Means of transportation to work - Public transportation (%)
Means of transportation to work - Bus or trolley bus (%)
Means of transportation to work - Streetcar or trolley car (%)
Means of transportation to work - Subway or elevated (%)
Means of transportation to work - Railroad (%)
Means of transportation to work - Ferryboat (%)
Means of transportation to work - Taxicab (%)
Means of transportation to work - Motorcycle (%)
Means of transportation to work - Bicycle (%)
Means of transportation to work - Walked (%)
Means of transportation to work - Other means (%)
Working at home (%)
Industry diversity
Most Common Industries - Agriculture, forestry, fishing and hunting, and mining (%)
Most Common Industries - Agriculture, forestry, fishing and hunting (%)
Most Common Industries - Mining, quarrying, and oil and gas extraction (%)
Most Common Industries - Construction (%)
Most Common Industries - Manufacturing (%)
Most Common Industries - Wholesale trade (%)
Most Common Industries - Retail trade (%)
Most Common Industries - Transportation and warehousing, and utilities (%)
Most Common Industries - Transportation and warehousing (%)
Most Common Industries - Utilities (%)
Most Common Industries - Information (%)
Most Common Industries - Finance and insurance, and real estate and rental and leasing (%)
Most Common Industries - Finance and insurance (%)
Most Common Industries - Real estate and rental and leasing (%)
Most Common Industries - Professional, scientific, and management, and administrative and waste management services (%)
Most Common Industries - Professional, scientific, and technical services (%)
Most Common Industries - Management of companies and enterprises (%)
Most Common Industries - Administrative and support and waste management services (%)
Most Common Industries - Educational services, and health care and social assistance (%)
Most Common Industries - Educational services (%)
Most Common Industries - Health care and social assistance (%)
Most Common Industries - Arts, entertainment, and recreation, and accommodation and food services (%)
Most Common Industries - Arts, entertainment, and recreation (%)
Most Common Industries - Accommodation and food services (%)
Most Common Industries - Other services, except public administration (%)
Most Common Industries - Public administration (%)
Occupation diversity
Most Common Occupations - Management, business, science, and arts occupations (%)
Most Common Occupations - Management, business, and financial occupations (%)
Most Common Occupations - Management occupations (%)
Most Common Occupations - Business and financial operations occupations (%)
Most Common Occupations - Computer, engineering, and science occupations (%)
Most Common Occupations - Computer and mathematical occupations (%)
Most Common Occupations - Architecture and engineering occupations (%)
Most Common Occupations - Life, physical, and social science occupations (%)
Most Common Occupations - Education, legal, community service, arts, and media occupations (%)
Most Common Occupations - Community and social service occupations (%)
Most Common Occupations - Legal occupations (%)
Most Common Occupations - Education, training, and library occupations (%)
Most Common Occupations - Arts, design, entertainment, sports, and media occupations (%)
Most Common Occupations - Healthcare practitioners and technical occupations (%)
Most Common Occupations - Health diagnosing and treating practitioners and other technical occupations (%)
Most Common Occupations - Health technologists and technicians (%)
Most Common Occupations - Service occupations (%)
Most Common Occupations - Healthcare support occupations (%)
Most Common Occupations - Protective service occupations (%)
Most Common Occupations - Fire fighting and prevention, and other protective service workers including supervisors (%)
Most Common Occupations - Law enforcement workers including supervisors (%)
Most Common Occupations - Food preparation and serving related occupations (%)
Most Common Occupations - Building and grounds cleaning and maintenance occupations (%)
Most Common Occupations - Personal care and service occupations (%)
Most Common Occupations - Sales and office occupations (%)
Most Common Occupations - Sales and related occupations (%)
Most Common Occupations - Office and administrative support occupations (%)
Most Common Occupations - Natural resources, construction, and maintenance occupations (%)
Most Common Occupations - Farming, fishing, and forestry occupations (%)
Most Common Occupations - Construction and extraction occupations (%)
Most Common Occupations - Installation, maintenance, and repair occupations (%)
Most Common Occupations - Production, transportation, and material moving occupations (%)
Most Common Occupations - Production occupations (%)
Most Common Occupations - Transportation occupations (%)
Most Common Occupations - Material moving occupations (%)
People in Group quarters - Institutionalized population (%)
People in Group quarters - Correctional institutions (%)
People in Group quarters - Federal prisons and detention centers (%)
People in Group quarters - Halfway houses (%)
People in Group quarters - Local jails and other confinement facilities (including police lockups) (%)
People in Group quarters - Military disciplinary barracks (%)
People in Group quarters - State prisons (%)
People in Group quarters - Other types of correctional institutions (%)
People in Group quarters - Nursing homes (%)
People in Group quarters - Hospitals/wards, hospices, and schools for the handicapped (%)
People in Group quarters - Hospitals/wards and hospices for chronically ill (%)
People in Group quarters - Hospices or homes for chronically ill (%)
People in Group quarters - Military hospitals or wards for chronically ill (%)
People in Group quarters - Other hospitals or wards for chronically ill (%)
People in Group quarters - Hospitals or wards for drug/alcohol abuse (%)
People in Group quarters - Mental (Psychiatric) hospitals or wards (%)
People in Group quarters - Schools, hospitals, or wards for the mentally retarded (%)
People in Group quarters - Schools, hospitals, or wards for the physically handicapped (%)
People in Group quarters - Institutions for the deaf (%)
People in Group quarters - Institutions for the blind (%)
People in Group quarters - Orthopedic wards and institutions for the physically handicapped (%)
People in Group quarters - Wards in general hospitals for patients who have no usual home elsewhere (%)
People in Group quarters - Wards in military hospitals for patients who have no usual home elsewhere (%)
People in Group quarters - Juvenile institutions (%)
People in Group quarters - Long-term care (%)
People in Group quarters - Homes for abused, dependent, and neglected children (%)
People in Group quarters - Residential treatment centers for emotionally disturbed children (%)
People in Group quarters - Training schools for juvenile delinquents (%)
People in Group quarters - Short-term care, detention or diagnostic centers for delinquent children (%)
People in Group quarters - Type of juvenile institution unknown (%)
People in Group quarters - Noninstitutionalized population (%)
People in Group quarters - College dormitories (includes college quarters off campus) (%)
People in Group quarters - Military quarters (%)
People in Group quarters - On base (%)
People in Group quarters - Barracks, unaccompanied personnel housing (UPH), (Enlisted/Officer), ;and similar group living quarters for military personnel (%)
People in Group quarters - Transient quarters for temporary residents (%)
People in Group quarters - Military ships (%)
People in Group quarters - Group homes (%)
People in Group quarters - Homes or halfway houses for drug/alcohol abuse (%)
People in Group quarters - Homes for the mentally ill (%)
People in Group quarters - Homes for the mentally retarded (%)
People in Group quarters - Homes for the physically handicapped (%)
People in Group quarters - Other group homes (%)
People in Group quarters - Religious group quarters (%)
People in Group quarters - Dormitories (%)
People in Group quarters - Agriculture workers' dormitories on farms (%)
People in Group quarters - Job Corps and vocational training facilities (%)
People in Group quarters - Other workers' dormitories (%)
People in Group quarters - Crews of maritime vessels (%)
People in Group quarters - Other nonhousehold living situations (%)
People in Group quarters - Other noninstitutional group quarters (%)
Residents speaking English at home (%)
Residents speaking English at home - Born in the United States (%)
Residents speaking English at home - Native, born elsewhere (%)
Residents speaking English at home - Foreign born (%)
Residents speaking Spanish at home (%)
Residents speaking Spanish at home - Born in the United States (%)
Residents speaking Spanish at home - Native, born elsewhere (%)
Residents speaking Spanish at home - Foreign born (%)
Residents speaking other language at home (%)
Residents speaking other language at home - Born in the United States (%)
Residents speaking other language at home - Native, born elsewhere (%)
Residents speaking other language at home - Foreign born (%)
Class of Workers - Employee of private company (%)
Class of Workers - Self-employed in own incorporated business (%)
Class of Workers - Private not-for-profit wage and salary workers (%)
Class of Workers - Local government workers (%)
Class of Workers - State government workers (%)
Class of Workers - Federal government workers (%)
Class of Workers - Self-employed workers in own not incorporated business and Unpaid family workers (%)
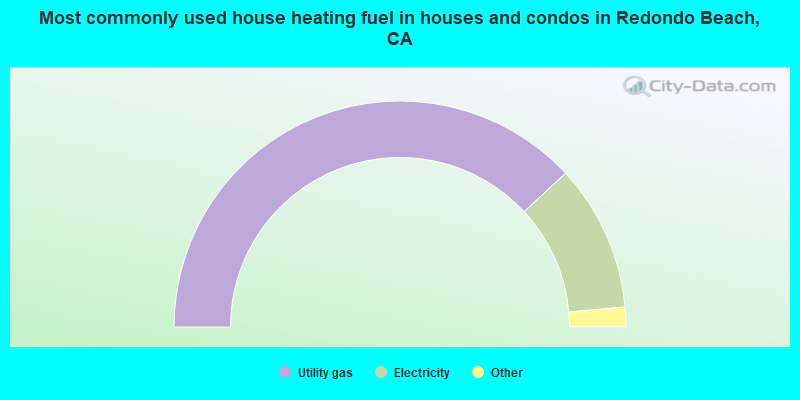
House heating fuel used in houses and condos - Utility gas (%)
House heating fuel used in houses and condos - Bottled, tank, or LP gas (%)
House heating fuel used in houses and condos - Electricity (%)
House heating fuel used in houses and condos - Fuel oil, kerosene, etc. (%)
House heating fuel used in houses and condos - Coal or coke (%)
House heating fuel used in houses and condos - Wood (%)
House heating fuel used in houses and condos - Solar energy (%)
House heating fuel used in houses and condos - Other fuel (%)
House heating fuel used in houses and condos - No fuel used (%)
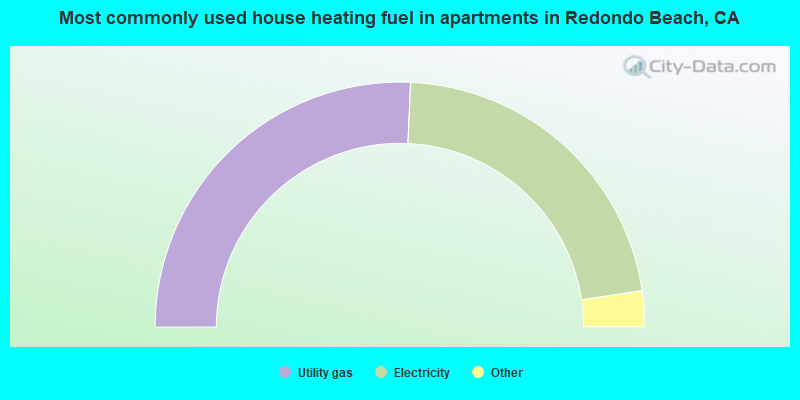
House heating fuel used in apartments - Utility gas (%)
House heating fuel used in apartments - Bottled, tank, or LP gas (%)
House heating fuel used in apartments - Electricity (%)
House heating fuel used in apartments - Fuel oil, kerosene, etc. (%)
House heating fuel used in apartments - Coal or coke (%)
House heating fuel used in apartments - Wood (%)
House heating fuel used in apartments - Solar energy (%)
House heating fuel used in apartments - Other fuel (%)
House heating fuel used in apartments - No fuel used (%)
Armed forces status - In Armed Forces (%)
Armed forces status - Civilian (%)
Armed forces status - Civilian - Veteran (%)
Armed forces status - Civilian - Nonveteran (%)
Fatal accidents locations in years 2005-2021
Fatal accidents locations in 2005
Fatal accidents locations in 2006
Fatal accidents locations in 2007
Fatal accidents locations in 2008
Fatal accidents locations in 2009
Fatal accidents locations in 2010
Fatal accidents locations in 2011
Fatal accidents locations in 2012
Fatal accidents locations in 2013
Fatal accidents locations in 2014
Fatal accidents locations in 2015
Fatal accidents locations in 2016
Fatal accidents locations in 2017
Fatal accidents locations in 2018
Fatal accidents locations in 2019
Fatal accidents locations in 2020
Fatal accidents locations in 2021
Alcohol use - People drinking some alcohol every month (%)
Alcohol use - People not drinking at all (%)
Alcohol use - Average days/month drinking alcohol
Alcohol use - Average drinks/week
Alcohol use - Average days/year people drink much
Audiometry - Average condition of hearing (%)
Audiometry - People that can hear a whisper from across a quiet room (%)
Audiometry - People that can hear normal voice from across a quiet room (%)
Audiometry - Ears ringing, roaring, buzzing (%)
Audiometry - Had a job exposure to loud noise (%)
Audiometry - Had off-work exposure to loud noise (%)
Blood Pressure & Cholesterol - Has high blood pressure (%)
Blood Pressure & Cholesterol - Checking blood pressure at home (%)
Blood Pressure & Cholesterol - Frequently checking blood cholesterol (%)
Blood Pressure & Cholesterol - Has high cholesterol level (%)
Consumer Behavior - Money monthly spent on food at supermarket/grocery store
Consumer Behavior - Money monthly spent on food at other stores
Consumer Behavior - Money monthly spent on eating out
Consumer Behavior - Money monthly spent on carryout/delivered foods
Consumer Behavior - Income spent on food at supermarket/grocery store (%)
Consumer Behavior - Income spent on food at other stores (%)
Consumer Behavior - Income spent on eating out (%)
Consumer Behavior - Income spent on carryout/delivered foods (%)
Current Health Status - General health condition (%)
Current Health Status - Blood donors (%)
Current Health Status - Has blood ever tested for HIV virus (%)
Current Health Status - Left-handed people (%)
Dermatology - People using sunscreen (%)
Diabetes - Diabetics (%)
Diabetes - Had a blood test for high blood sugar (%)
Diabetes - People taking insulin (%)
Diet Behavior & Nutrition - Diet health (%)
Diet Behavior & Nutrition - Milk product consumption (# of products/month)
Diet Behavior & Nutrition - Meals not home prepared (#/week)
Diet Behavior & Nutrition - Meals from fast food or pizza place (#/week)
Diet Behavior & Nutrition - Ready-to-eat foods (#/month)
Diet Behavior & Nutrition - Frozen meals/pizza (#/month)
Drug Use - People that ever used marijuana or hashish (%)
Drug Use - Ever used hard drugs (%)
Drug Use - Ever used any form of cocaine (%)
Drug Use - Ever used heroin (%)
Drug Use - Ever used methamphetamine (%)
Health Insurance - People covered by health insurance (%)
Kidney Conditions-Urology - Avg. # of times urinating at night
Medical Conditions - People with asthma (%)
Medical Conditions - People with anemia (%)
Medical Conditions - People with psoriasis (%)
Medical Conditions - People with overweight (%)
Medical Conditions - Elderly people having difficulties in thinking or remembering (%)
Medical Conditions - People who ever received blood transfusion (%)
Medical Conditions - People having trouble seeing even with glass/contacts (%)
Medical Conditions - People with arthritis (%)
Medical Conditions - People with gout (%)
Medical Conditions - People with congestive heart failure (%)
Medical Conditions - People with coronary heart disease (%)
Medical Conditions - People with angina pectoris (%)
Medical Conditions - People who ever had heart attack (%)
Medical Conditions - People who ever had stroke (%)
Medical Conditions - People with emphysema (%)
Medical Conditions - People with thyroid problem (%)
Medical Conditions - People with chronic bronchitis (%)
Medical Conditions - People with any liver condition (%)
Medical Conditions - People who ever had cancer or malignancy (%)
Mental Health - People who have little interest in doing things (%)
Mental Health - People feeling down, depressed, or hopeless (%)
Mental Health - People who have trouble sleeping or sleeping too much (%)
Mental Health - People feeling tired or having little energy (%)
Mental Health - People with poor appetite or overeating (%)
Mental Health - People feeling bad about themself (%)
Mental Health - People who have trouble concentrating on things (%)
Mental Health - People moving or speaking slowly or too fast (%)
Mental Health - People having thoughts they would be better off dead (%)
Oral Health - Average years since last visit a dentist
Oral Health - People embarrassed because of mouth (%)
Oral Health - People with gum disease (%)
Oral Health - General health of teeth and gums (%)
Oral Health - Average days a week using dental floss/device
Oral Health - Average days a week using mouthwash for dental problem
Oral Health - Average number of teeth
Pesticide Use - Households using pesticides to control insects (%)
Pesticide Use - Households using pesticides to kill weeds (%)
Physical Activity - People doing vigorous-intensity work activities (%)
Physical Activity - People doing moderate-intensity work activities (%)
Physical Activity - People walking or bicycling (%)
Physical Activity - People doing vigorous-intensity recreational activities (%)
Physical Activity - People doing moderate-intensity recreational activities (%)
Physical Activity - Average hours a day doing sedentary activities
Physical Activity - Average hours a day watching TV or videos
Physical Activity - Average hours a day using computer
Physical Functioning - People having limitations keeping them from working (%)
Physical Functioning - People limited in amount of work they can do (%)
Physical Functioning - People that need special equipment to walk (%)
Physical Functioning - People experiencing confusion/memory problems (%)
Physical Functioning - People requiring special healthcare equipment (%)
Prescription Medications - Average number of prescription medicines taking
Preventive Aspirin Use - Adults 40+ taking low-dose aspirin (%)
Reproductive Health - Vaginal deliveries (%)
Reproductive Health - Cesarean deliveries (%)
Reproductive Health - Deliveries resulted in a live birth (%)
Reproductive Health - Pregnancies resulted in a delivery (%)
Reproductive Health - Women breastfeeding newborns (%)
Reproductive Health - Women that had a hysterectomy (%)
Reproductive Health - Women that had both ovaries removed (%)
Reproductive Health - Women that have ever taken birth control pills (%)
Reproductive Health - Women taking birth control pills (%)
Reproductive Health - Women that have ever used Depo-Provera or injectables (%)
Reproductive Health - Women that have ever used female hormones (%)
Sexual Behavior - People 18+ that ever had sex (vaginal, anal, or oral) (%)
Sexual Behavior - Males 18+ that ever had vaginal sex with a woman (%)
Sexual Behavior - Males 18+ that ever performed oral sex on a woman (%)
Sexual Behavior - Males 18+ that ever had anal sex with a woman (%)
Sexual Behavior - Males 18+ that ever had any sex with a man (%)
Sexual Behavior - Females 18+ that ever had vaginal sex with a man (%)
Sexual Behavior - Females 18+ that ever performed oral sex on a man (%)
Sexual Behavior - Females 18+ that ever had anal sex with a man (%)
Sexual Behavior - Females 18+ that ever had any kind of sex with a woman (%)
Sexual Behavior - Average age people first had sex
Sexual Behavior - Average number of female sex partners in lifetime (males 18+)
Sexual Behavior - Average number of female vaginal sex partners in lifetime (males 18+)
Sexual Behavior - Average age people first performed oral sex on a woman (18+)
Sexual Behavior - Average number of woman performed oral sex on in lifetime (18+)
Sexual Behavior - Average number of male sex partners in lifetime (males 18+)
Sexual Behavior - Average number of male anal sex partners in lifetime (males 18+)
Sexual Behavior - Average age people first performed oral sex on a man (18+)
Sexual Behavior - Average number of male oral sex partners in lifetime (18+)
Sexual Behavior - People using protection when performing oral sex (%)
Sexual Behavior - Average number of times people have vaginal or anal sex a year
Sexual Behavior - People having sex without condom (%)
Sexual Behavior - Average number of male sex partners in lifetime (females 18+)
Sexual Behavior - Average number of male vaginal sex partners in lifetime (females 18+)
Sexual Behavior - Average number of female sex partners in lifetime (females 18+)
Sexual Behavior - Circumcised males 18+ (%)
Sleep Disorders - Average hours sleeping at night
Sleep Disorders - People that has trouble sleeping (%)
Smoking-Cigarette Use - People smoking cigarettes (%)
Taste & Smell - People 40+ having problems with smell (%)
Taste & Smell - People 40+ having problems with taste (%)
Taste & Smell - People 40+ that ever had wisdom teeth removed (%)
Taste & Smell - People 40+ that ever had tonsils teeth removed (%)
Taste & Smell - People 40+ that ever had a loss of consciousness because of a head injury (%)
Taste & Smell - People 40+ that ever had a broken nose or other serious injury to face or skull (%)
Taste & Smell - People 40+ that ever had two or more sinus infections (%)
Weight - Average height (inches)
Weight - Average weight (pounds)
Weight - Average BMI
Weight - People that are obese (%)
Weight - People that ever were obese (%)
Weight - People trying to lose weight (%)
36,817 53.4% White alone 14,152 20.5% Asian alone 7,611 11.0% Hispanic 6,850 9.9% Two or more races 2,406 3.5% Black alone 745 1.1% Other race alone 248 0.4% American Indian alone 79 0.1% Native Hawaiian and Other
According to our research of California and other state lists, there were 37 registered sex offenders living in Redondo Beach, California as of April 25, 2024 . The ratio of all residents to sex offenders in Redondo Beach is 1,843 to 1.The ratio of registered sex offenders to all residents in this city is much lower than the state average.
The City-Data.com crime index weighs serious crimes and violent crimes more heavily. Higher means more crime, U.S. average is 246.1. It adjusts for the number of visitors and daily workers commuting into cities.
- means the value is smaller than the state average.
- means the value is about the same as the state average.
- means the value is bigger than the state average.
- means the value is much bigger than the state average.
Crime rate in Redondo Beach detailed stats: murders, rapes, robberies, assaults, burglaries, thefts, arson Officers per 1,000 residents here:
1.35California average:
2.30
Latest news from Redondo Beach, CA collected exclusively by city-data.com from local newspapers, TV, and radio stations
Ancestries: English (5.4%), American (4.8%), Italian (4.7%), Irish (4.6%), European (4.3%), German (3.5%).
Current Local Time:
Land area: 6.28 square miles.
Population density: 10,965 people per square mile (high).
13,745 residents are foreign born (9.2% Asia , 4.6% Latin America , 4.5% Europe ).
This city:
19.9%California:
26.5%
Median real estate property taxes paid for housing units with mortgages in 2022: $9,291 (0.7%)Median real estate property taxes paid for housing units with no mortgage in 2022: $6,743 (0.5%)
Nearest city with pop. 200,000+: Long Beach, CA
Nearest city with pop. 1,000,000+: Los Angeles, CA
Nearest cities:
Latitude: 33.86 N, Longitude: 118.38 W
Daytime population change due to commuting: +1,383 (+2.0%)Workers who live and work in this city: 16,887 (48.9%)
Area code commonly used in this area: 310
Property values in Redondo Beach, CA
Redondo Beach tourist attractions:
Single-family new house construction building permits:
2022: 120 buildings , average cost: $268,7002021: 76 buildings , average cost: $368,2002020: 34 buildings , average cost: $372,6002019: 94 buildings , average cost: $357,4002018: 105 buildings , average cost: $355,3002017: 160 buildings , average cost: $296,0002016: 123 buildings , average cost: $324,7002015: 143 buildings , average cost: $327,8002014: 102 buildings , average cost: $337,1002013: 70 buildings , average cost: $315,4002012: 67 buildings , average cost: $264,4002011: 58 buildings , average cost: $292,1002010: 45 buildings , average cost: $285,3002009: 34 buildings , average cost: $312,0002008: 87 buildings , average cost: $271,8002007: 149 buildings , average cost: $278,9002006: 291 buildings , average cost: $228,9002005: 412 buildings , average cost: $180,4002004: 307 buildings , average cost: $248,0002003: 191 buildings , average cost: $257,7002002: 173 buildings , average cost: $275,2002001: 189 buildings , average cost: $249,8002000: 317 buildings , average cost: $225,7001999: 313 buildings , average cost: $235,2001998: 218 buildings , average cost: $252,1001997: 138 buildings , average cost: $239,300Unemployment in December 2023:
Population change in the 1990s: +2,535 (+4.2%).
Most common occupations in Redondo Beach, CA (%)
Both Males Females
Other management occupations, except farmers and farm managers (10.3%)
Engineers (4.6%)
Cooks and food preparation workers (3.6%)
Computer specialists (3.5%)
Top executives (3.0%)
Retail sales workers, except cashiers (2.9%)
Advertising, marketing, promotions, public relations, and sales managers (2.8%)
Other management occupations, except farmers and farm managers (11.9%)
Engineers (6.8%)
Top executives (4.7%)
Computer specialists (4.2%)
Retail sales workers, except cashiers (3.1%)
Advertising, marketing, promotions, public relations, and sales managers (3.0%)
Cooks and food preparation workers (2.8%)
Other management occupations, except farmers and farm managers (8.5%)
Cooks and food preparation workers (4.4%)
Registered nurses (3.4%)
Customer service representatives (3.2%)
Other office and administrative support workers, including supervisors (3.1%)
Computer specialists (2.7%)
Therapists (2.7%)
Earthquake activity:
Redondo Beach-area historical earthquake activity is significantly above California state average. It is 6723% greater than the overall U.S. average. On 7/21/1952 at 11:52:14, a magnitude 7.7 (7.7 UK, Class: Major, Intensity: VIII - XII) earthquake occurred 86.7 miles away from Redondo Beach center, causing $50,000,000 total damage On 6/28/1992 at 11:57:34, a magnitude 7.6 (6.2 MB, 7.6 MS, 7.3 MW, Depth: 0.7 mi) earthquake occurred 108.2 miles away from Redondo Beach center, causing 3 deaths ( 1 shaking deaths, 2 other deaths) and 400 injuries, causing $100,000,000 total damage and $40,000,000 insured lossesOn 10/16/1999 at 09:46:44, a magnitude 7.4 (6.3 MB, 7.4 MS, 7.2 MW, 7.3 ML) earthquake occurred 120.1 miles away from Redondo Beach center On 11/4/1927 at 13:51:53, a magnitude 7.5 (7.5 UK) earthquake occurred 168.2 miles away from the city center On 1/17/1994 at 12:30:55, a magnitude 6.8 (6.4 MB, 6.8 MS, 6.7 MW, Depth: 11.4 mi, Class: Strong, Intensity: VII - IX) earthquake occurred 23.6 miles away from the city center, causing 60 deaths ( 60 shaking deaths) and 7000 injuriesOn 4/21/1918 at 22:32:30, a magnitude 6.8 (6.8 UK) earthquake occurred 53.9 miles away from the city center Magnitude types: body-wave magnitude (MB), local magnitude (ML), surface-wave magnitude (MS), moment magnitude (MW) Natural disasters: The number of natural disasters in Los Angeles County (57) is a lot greater than the US average (15).Major Disasters (Presidential) Declared: 27Emergencies Declared: 3Fires: 37, Floods: 16, Storms: 9, Winter Storms: 6, Landslides: 5, Mudslides: 5, Earthquakes: 3, Freeze: 1, Heavy Rain: 1, Hurricane: 1, Snow: 1, Tornado: 1, Wind: 1, Other: 1 (Note: some incidents may be assigned to more than one category). Hospitals and medical centers in Redondo Beach: AMI SOUTH BAY HOSPITAL (provides emergency services, 514 N PROSPECT AVE) SOUTH BAY MEDICAL CENTER SNF/DP (514 N PROSPECT)
COASTAL DIALYSIS CENTER (514 N. PROSPECT AVENUE)
Amtrak stations near Redondo Beach: 10 miles: SAN PEDRO (CATALINA TERMINAL, BERTH 95) - Bus Station Services: partially wheelchair accessible, enclosed waiting area, public restrooms, public payphones, snack bar, paid short-term parking, paid long-term parking, call for taxi service.
13 miles: LONG BEACH (601 N. LONG BEACH BLVD.) - Bus Station Services: fully wheelchair accessible, public restrooms, public payphones, full-service food facilities, paid short-term parking, paid long-term parking, call for taxi service, public transit connection.
16 miles: LOS ANGELES (800 N. ALAMEDA ST.) Services: ticket office, fully wheelchair accessible, enclosed waiting area, public restrooms, public payphones, snack bar, free short-term parking, paid long-term parking, car rental agency, taxi stand, public transit connection.
Colleges/universities with over 2000 students nearest to Redondo Beach:
El Camino Community College District (about 4 miles; Torrance, CA ; Full-time enrollment: 13,952)
Los Angeles Southwest College (about 7 miles; Los Angeles, CA ; FT enrollment: 3,247)
California State University-Dominguez Hills (about 7 miles; Carson, CA ; FT enrollment: 9,862)
Los Angeles Harbor College (about 8 miles; Wilmington, CA ; FT enrollment: 5,285)
Loyola Marymount University (about 9 miles; Los Angeles, CA ; FT enrollment: 7,720)
El Camino College-Compton Center (about 10 miles; Compton, CA ; FT enrollment: 4,506)
Wyotech-Long Beach (about 11 miles; Long Beach, CA ; FT enrollment: 2,453)
Public high schools in Redondo Beach:
Private high school in Redondo Beach: SOUTH BAY FAITH ACADEMY Students: 485, Location: 101 S PACIFIC COAST HWY, Grades: KG-12)
Biggest public elementary/middle schools in Redondo Beach: PARRAS (NICK G.) MIDDLE Students: 834, Location: 200 N. LUCIA, Grades: 6-8)ADAMS MIDDLE Students: 786, Location: 2600 RIPLEY AVE., Grades: 6-8)JEFFERSON ELEMENTARY Students: 434, Location: 600 HARKNESS LN., Grades: KG-5)WASHINGTON ELEMENTARY Students: 378, Location: 1100 LILIENTHAL LN., Grades: KG-5)ALTA VISTA ELEMENTARY Students: 355, Location: 815 KNOB HILL AVE., Grades: KG-5)TULITA ELEMENTARY Students: 268, Location: 1520 PROSPECT AVE., Grades: KG-5)BERYL HEIGHTS ELEMENTARY Students: 215, Location: 920 BERYL ST., Grades: KG-5)BIRNEY ELEMENTARY Location: 1600 GREEN LN., Grades: KG-5)
LINCOLN ELEMENTARY Location: 2223 PLANT AVE., Grades: KG-6)
MADISON ELEMENTARY Location: 2200 MACKAY LN., Grades: KG-5)
Private elementary/middle schools in Redondo Beach: ST LAWRENCE MARTYR ELEMENTARY SCHOOL Students: 298, Location: 1950 S PROSPECT AVE, Grades: KG-8)
RIVIERA HALL LUTHERAN SCHOOL Students: 228, Location: 330 PALOS VERDES BLVD, Grades: KG-8)
COAST CHRISTIAN SCHOOL Students: 160, Location: 525 EARLE LN, Grades: PK-8)
CARDEN DOMINION SCHOOL Students: 60, Location: 706 KNOB HILL AVE, Grades: PK-5)
See full list of schools located in Redondo Beach Library in Redondo Beach: REDONDO BEACH PUBLIC LIBRARY Operating income: $3,933,360; Location: 303 N. PACIFIC COAST HWY; 204,389 books ; 370 e-books ; 15,654 audio materials ; 18,850 video materials ; 15 local licensed databases ; 286 print serial subscriptions )
Notable locations in Redondo Beach: (A) , Redondo Beach Public Library (B) , Redondo Beach City Hall (C) , South Bay Ambulance (D) , Redondo Beach Fire Department Station 2 (E) , Redondo Beach Fire Department Station 1 Headquarters (F) , Redondo Generating Station (G) . Display/hide their locations on the map
Shopping Centers: (1) , South Bay Shopping Center (2) , The Pier Shopping Center (3) . Display/hide their locations on the map
Churches in Redondo Beach include: (A) , Christ Episcopal Church (B) , First Baptist Church (C) , First Church of Christ Scientist (D) , First Congregational Church (E) , First United Methodist Church (F) , Seventh Day Adventist Church (G) , South Bay Christian Church (H) . Display/hide their locations on the map
Cemetery: (1) . Display/hide its location on the map
Parks in Redondo Beach include: (1) , Belfo Park (2) , Perry Park (3) , Redondo Beach (4) , Sea Hawk Stadium (5) , Dale Page Park (6) , Glen Anderson Park (7) , Miramar Park (8) , Veterans Park (9) . Display/hide their locations on the map
Tourist attractions:
Hotels:
Birthplace of: Doug Aitken - Multimedia artist, Bob Morales - Bicycle motocross rider, Jeffrey Vallance - Artist, Scott MacIntyre - Singer, Eric Norris - Busch series NASCAR driver (born : May 20, 1965), Sarah Hammer - Racing cyclist., Adam Zahn - College basketball player (Oregon Ducks), Amy White - Former swimmer and Olympic silver medalist., Charlie Wade - Volleyball coach, Conn Jackson - Television personality.
Los Angeles County has a predicted average indoor radon screening level between 2 and 4 pCi/L (pico curies per liter) - Moderate Potential Average household size: This city:
2.3 peopleCalifornia:
2.9 people
Percentage of family households: This city:
55.9%Whole state:
68.7%
Percentage of households with unmarried partners: This city:
7.2%Whole state:
7.2%
Likely homosexual households (counted as self-reported same-sex unmarried-partner households)
Lesbian couples: 0.3% of all households Gay men: 0.3% of all households
People in group quarters in Redondo Beach in 2010:
304 people in other noninstitutional facilities
64 people in nursing facilities/skilled-nursing facilities
31 people in group homes intended for adults
26 people in emergency and transitional shelters (with sleeping facilities) for people experiencing homelessness
4 people in workers' group living quarters and job corps centers
2 people in residential treatment centers for adults
People in group quarters in Redondo Beach in 2000:
88 people in training schools for juvenile delinquents
65 people in other noninstitutional group quarters
18 people in homes or halfway houses for drug/alcohol abuse
8 people in religious group quarters
5 people in nursing homes
3 people in unknown juvenile institutions
Banks with branches in Redondo Beach (2011 data):
Bank of America, National Association: Redondo Beach Branch, South Bay Galleria, Riviera Village Branch. Info updated 2009/11/18: Bank assets: $1,451,969.3 mil, Deposits: $1,077,176.8 mil, headquarters in Charlotte, NC, positive income , 5782 total offices , Holding Company: Bank Of America Corporation
Wells Fargo Bank, National Association: Inglewood & Marine Branch, Redondo Beach, Riviera Village Branch. Info updated 2011/04/05: Bank assets: $1,161,490.0 mil, Deposits: $905,653.0 mil, headquarters in Sioux Falls, SD, positive income , 6395 total offices , Holding Company: Wells Fargo & Company
OneWest Bank, FSB: Redondo Beach Branch at 2233 Artesia Boulevard, branch established on 1978/01/01; Riviera Village at 1870 S. Elena Ave., branch established on 2010/05/17. Info updated 2011/07/21: Bank assets: $26,181.3 mil, Deposits: $15,408.4 mil, headquarters in Pasadena, CA, positive income , 79 total offices
JPMorgan Chase Bank, National Association: 1600 S Pacific Coast Hwy Branch at 1600 S Pacific Coast Hwy, branch established on 1988/12/27. Info updated 2011/11/10: Bank assets: $1,811,678.0 mil, Deposits: $1,190,738.0 mil, headquarters in Columbus, OH, positive income , International Specialization, 5577 total offices , Holding Company: Jpmorgan Chase & Co.
U.S. Bank National Association: Redondo Beach Branch at 1217 North Catalina Avenue, branch established on 1953/09/26. Info updated 2012/01/30: Bank assets: $330,470.8 mil, Deposits: $236,091.5 mil, headquarters in Cincinnati, OH, positive income , 3121 total offices , Holding Company: U.S. Bancorp
Bank of the West: Redondo Beach Branch at 3500 Aviation Boulevard, branch established on 1970/10/02. Info updated 2009/11/16: Bank assets: $62,408.3 mil, Deposits: $43,995.2 mil, headquarters in San Francisco, CA, positive income , 647 total offices , Holding Company: Bnp Paribas
Comerica Bank: Redondo Beach Banking Center at 1212 S. Pacific Coast Hwy, Suite 102, branch established on 2010/01/26. Info updated 2011/07/29: Bank assets: $60,970.5 mil, Deposits: $48,300.9 mil, headquarters in Dallas, TX, positive income , Commercial Lending Specialization, 497 total offices , Holding Company: Comerica Incorporated
Union Bank, National Association: Redondo Beach Instore Branch at 1413 Hawthorne Blvd, branch established on 1990/11/26. Info updated 2011/09/01: Bank assets: $88,967.5 mil, Deposits: $65,286.4 mil, headquarters in San Francisco, CA, positive income , Commercial Lending Specialization, 403 total offices , Holding Company: Mitsubishi Ufj Financial Group, Inc.
For population 15 years and over in Redondo Beach:
Never married: 32.8%Now married: 52.9%Separated: 0.6%Widowed: 3.9%Divorced: 9.8% For population 25 years and over in Redondo Beach:
High school or higher: 98.4%Bachelor's degree or higher: 67.8%Graduate or professional degree: 27.0%Unemployed: 3.6%Mean travel time to work (commute): 15.2 minutes
Education Gini index (Inequality in education) Here:
8.9California average:
15.5
Religion statistics for Redondo Beach, CA (based on Los Angeles County data)
Religion Adherents Congregations Catholic 3,542,994 275 Evangelical Protestant 814,611 3,249 Other 451,594 1,023 Mainline Protestant 229,056 860 Black Protestant 112,338 290 Orthodox 63,517 76 None 4,604,495 -
Source: Clifford Grammich, Kirk Hadaway, Richard Houseal, Dale E.Jones, Alexei Krindatch, Richie Stanley and Richard H.Taylor. 2012. 2010 U.S.Religion Census: Religious Congregations & Membership Study. Association of Statisticians of American Religious Bodies. Jones, Dale E., et al. 2002. Congregations and Membership in the United States 2000. Nashville, TN: Glenmary Research Center. Graphs represent county-level data
Food Environment Statistics: Number of grocery stores : 2,084Here :
2.12 / 10,000 pop.State :
2.14 / 10,000 pop.
Number of supercenters and club stores : 32Los Angeles County :
0.03 / 10,000 pop.California :
0.04 / 10,000 pop.
Number of convenience stores (no gas) : 567Here :
0.58 / 10,000 pop.California :
0.62 / 10,000 pop.
Number of convenience stores (with gas) : 1,206Here :
1.23 / 10,000 pop.California :
1.49 / 10,000 pop.
Number of full-service restaurants : 7,008This county :
7.15 / 10,000 pop.State :
7.42 / 10,000 pop.
Adult diabetes rate : Los Angeles County :
7.5%California :
7.3%
Adult obesity rate : Los Angeles County :
20.4%California :
21.3%
Low-income preschool obesity rate : Los Angeles County :
18.6%State :
17.9%
Health and Nutrition: Healthy diet rate : Redondo Beach:
55.2%California:
49.4%
Average overall health of teeth and gums : This city:
56.2%California:
48.0%
People feeling badly about themselves : Redondo Beach:
18.2%State:
20.2%
People not drinking alcohol at all : This city:
8.7%California:
11.2%
Average hours sleeping at night : Redondo Beach:
6.9California:
6.8
Overweight people : This city:
31.8%State:
31.5%
General health condition : Here:
62.8%California:
56.4%
Average condition of hearing : Redondo Beach:
83.4%California:
80.9%
More about Health and Nutrition of Redondo Beach, CA Residents
Local government employment and payroll (March 2022)
Function
Full-time employees
Monthly full-time payroll
Average yearly full-time wage
Part-time employees
Monthly part-time payroll
Police Protection - Officers
86 $1,242,059 $173,311 9 $14,949 Firefighters
55 $879,501 $191,891 1 $408 Police - Other
51 $413,113 $97,203 24 $36,155 Financial Administration
27 $259,211 $115,205 0 $0 Streets and Highways
26 $214,584 $99,039 3 $6,873 Parks and Recreation
25 $204,651 $98,232 72 $100,666 Housing and Community Development (Local)
24 $209,002 $104,501 3 $9,360 Water Transport and Terminals
22 $154,464 $84,253 4 $7,232 Solid Waste Management
15 $99,313 $79,450 0 $0 Other Government Administration
14 $114,983 $98,557 0 $0 Local Libraries
12 $87,216 $87,216 30 $44,476 Judicial and Legal
11 $161,867 $176,582 0 $0 Sewerage
8 $73,964 $110,946 0 $0 Fire - Other
7 $109,437 $187,606 0 $0
Totals for Government
383 $4,223,365 $132,325 146 $220,118
Redondo Beach government finances - Expenditure in 2017 (per resident):
Construction - Sea and Inland Port Facilities: $3,566,000 ($51.74)
Transit Utilities: $2,379,000 ($34.52)Sewerage: $995,000 ($14.44)Local Fire Protection: $701,000 ($10.17)Parks and Recreation: $391,000 ($5.67)Regular Highways: $343,000 ($4.98)Police Protection: $258,000 ($3.74)Housing and Community Development: $39,000 ($0.57)Current Operations - Police Protection: $35,556,000 ($515.92)
Local Fire Protection: $11,966,000 ($173.63)Central Staff Services: $11,698,000 ($169.74)Sea and Inland Port Facilities: $9,973,000 ($144.71)Parks and Recreation: $8,827,000 ($128.08)Regular Highways: $7,196,000 ($104.41)Housing and Community Development: $6,713,000 ($97.41)Transit Utilities: $6,437,000 ($93.40)Health - Other: $5,403,000 ($78.40)Libraries: $4,504,000 ($65.35)Solid Waste Management: $3,960,000 ($57.46)Protective Inspection and Regulation - Other: $3,749,000 ($54.40)Financial Administration: $2,587,000 ($37.54)Sewerage: $2,432,000 ($35.29)General - Other: $11,000 ($0.16)General - Interest on Debt: $798,000 ($11.58)
Other Capital Outlay - Sewerage: $665,000 ($9.65)
Central Staff Services: $117,000 ($1.70)Solid Waste Management: $40,000 ($0.58)Protective Inspection and Regulation - Other: $38,000 ($0.55)Total Salaries and Wages: $291,000 ($4.22)
Redondo Beach government finances - Revenue in 2017 (per resident):
Charges - Sea and Inland Port Facilities: $12,115,000 ($175.79)
Housing and Community Development: $6,129,000 ($88.93)Sewerage: $5,546,000 ($80.47)Other: $4,252,000 ($61.70)Solid Waste Management: $3,957,000 ($57.42)Parks and Recreation: $2,550,000 ($37.00)Parking Facilities: $2,302,000 ($33.40)Regular Highways: $1,513,000 ($21.95)Federal Intergovernmental - Housing and Community Development: $628,000 ($9.11)
Other: $89,000 ($1.29)Local Intergovernmental - Transit Utilities: $677,000 ($9.82)
Miscellaneous - General Revenue - Other: $9,860,000 ($143.07)
Rents: $1,928,000 ($27.98)Fines and Forfeits: $1,537,000 ($22.30)Interest Earnings: $441,000 ($6.40)Special Assessments: $326,000 ($4.73)Donations From Private Sources: $62,000 ($0.90)Sale of Property: $8,000 ($0.12)Revenue - Transit Utilities: $3,826,000 ($55.52)
State Intergovernmental - Other: $2,124,000 ($30.82)
Transit Utilities: $1,916,000 ($27.80)Highways: $1,311,000 ($19.02)General Local Government Support: $145,000 ($2.10)Tax - Property: $31,798,000 ($461.39)
General Sales and Gross Receipts: $10,059,000 ($145.96)Public Utilities Sales: $8,791,000 ($127.56)Other Selective Sales: $7,690,000 ($111.58)Documentary and Stock Transfer: $2,433,000 ($35.30)Other License: $1,976,000 ($28.67)Occupation and Business License - Other: $1,201,000 ($17.43)Other: $34,000 ($0.49)
Redondo Beach government finances - Debt in 2017 (per resident):
Long Term Debt - Beginning Outstanding - Unspecified Public Purpose: $19,396,000 ($281.44)
Outstanding Unspecified Public Purpose: $17,640,000 ($255.96)Beginning Outstanding - Public Debt for Private Purpose: $15,519,000 ($225.18)Outstanding Nonguaranteed - Industrial Revenue: $14,406,000 ($209.03)Retired Unspecified Public Purpose: $1,756,000 ($25.48)Retired Nonguaranteed - Public Debt for Private Purpose: $1,113,000 ($16.15)
Redondo Beach government finances - Cash and Securities in 2017 (per resident):
Bond Funds - Cash and Securities: $12,575,000 ($182.46)
Other Funds - Cash and Securities: $72,897,000 ($1057.74)
Sinking Funds - Cash and Securities: $16,869,000 ($244.77)
2.98% of this county's 2021 resident taxpayers lived in other counties in 2020 ($81,235 average adjusted gross income )
Here:
2.98%California average:
5.19%
0.01% of residents moved from foreign countries ($155 average AGI )Los Angeles County:
0.01%California average:
0.03%
Top counties from which taxpayers relocated into this county between 2020 and 2021:
4.68% of this county's 2020 resident taxpayers moved to other counties in 2021 ($97,324 average adjusted gross income )
Here:
4.68%California average:
6.14%
0.01% of residents moved to foreign countries ($196 average AGI )Los Angeles County:
0.01%California average:
0.02%
Top counties to which taxpayers relocated from this county between 2020 and 2021:
Businesses in Redondo Beach, CA
Name Count Name Count
7-Eleven 4 Kroger 1 99 Cents Only Stores 1 Lane Bryant 1 ALDO 1 Lane Furniture 1 Abercrombie & Fitch 1 LensCrafters 2 Abercrombie Kids 1 Little Caesars Pizza 1 Albertsons 3 Macy's 1 Ann Taylor 1 MasterBrand Cabinets 7 Arby's 1 McDonald's 2 Bakers 1 Men's Wearhouse 1 Banana Republic 1 Motherhood Maternity 1 Baskin-Robbins 3 New Balance 4 Bath & Body Works 1 Nike 15 Bebe 1 Nordstrom 1 Best Western 3 Pac Sun 1 Blockbuster 1 Panda Express 2 Burger King 1 Payless 1 CVS 2 Penske 1 Cache 1 Quiznos 1 Carl\s Jr. 2 RadioShack 2 Chick-Fil-A 1 Ramada 1 Cinnabon 1 Red Robin 1 DHL 1 Rite Aid 2 Dairy Queen 1 Safeway 3 Decora Cabinetry 1 Skechers USA 1 Dennys 1 Spencer Gifts 1 Domino's Pizza 1 Sprint Nextel 1 El Pollo Loco 1 Starbucks 6 Express 1 T-Mobile 3 FedEx 12 T.J.Maxx 1 Firestone Complete Auto Care 1 Taco Bell 1 Foot Locker 1 Target 1 Forever 21 1 The Cheesecake Factory 1 GNC 4 The Limited 1 GameStop 1 The Room Place 1 Gap 1 Torrid 1 Gymboree 1 Toys"R"Us 1 H&R Block 1 True Value 2 Holiday Inn 1 U-Haul 2 Hot Topic 1 UPS 9 Jamba Juice 1 Vans 3 Johnny Rockets 1 Victoria's Secret 1 Jones New York 5 Vons 3 Justice 1 Walgreens 1 Kohl's 1 Whole Foods Market 1
Strongest AM radio stations in Redondo Beach:
KNX (1070 AM; 50 kW; LOS ANGELES, CA; Owner: INFINITY BROADCASTING OPERATIONS, INC.)
KFI (640 AM; 50 kW; LOS ANGELES, CA; Owner: CAPSTAR TX LIMITED PARTNERSHIP)
KFWB (980 AM; 50 kW; LOS ANGELES, CA; Owner: INFINITY BROADCASTING OPERATIONS, INC.)
KSPN (710 AM; 50 kW; LOS ANGELES, CA; Owner: KABC-AM RADIO, INC.)
KBLA (1580 AM; 50 kW; SANTA MONICA, CA)
KLAC (570 AM; 50 kW; LOS ANGELES, CA; Owner: AMFM RADIO LICENSES, L.L.C.)
KMPC (1540 AM; 50 kW; LOS ANGELES, CA; Owner: ROSE CITY RADIO CORPORATION)
KTNQ (1020 AM; 50 kW; LOS ANGELES, CA; Owner: KTNQ-AM LICENSE CORP.)
KXTA (1150 AM; 50 kW; LOS ANGELES, CA; Owner: CITICASTERS LICENSES, L.P.)
KXMX (1190 AM; 25 kW; ANAHEIM, CA; Owner: NEW INSPIRATION BROADCASTING COMPANY)
KDIS (1110 AM; 50 kW; PASADENA, CA; Owner: ABC,INC.)
KRLA (870 AM; 20 kW; GLENDALE, CA; Owner: NEW INSPIRATION BROADCASTING COMPANY)
KFOX (1650 AM; 10 kW; TORRANCE, CA; Owner: CHAGAL COMMUNICATIONS, INC.)
Strongest FM radio stations in Redondo Beach:
KZAB (93.5 FM; REDONDO BEACH, CA; Owner: KZAB LICENSING, INC.)
KKBT (100.3 FM; LOS ANGELES, CA; Owner: RADIO ONE LICENSES, LLC)
KZLA-FM (93.9 FM; LOS ANGELES, CA; Owner: EMMIS RADIO LICENSE CORPORATION)
KPWR (105.9 FM; LOS ANGELES, CA; Owner: EMMIS RADIO LICENSE CORPORATION)
KLSX (97.1 FM; LOS ANGELES, CA; Owner: INFINITY BROADCASTING OPERATIONS, INC.)
KRTH-FM (101.1 FM; LOS ANGELES, CA; Owner: INFINITY BROADCASTING OPERATIONS, INC.)
KUSC (91.5 FM; LOS ANGELES, CA; Owner: UNIVERSITY OF SOUTHERN CALIFORNIA)
KKLA-FM (99.5 FM; LOS ANGELES, CA; Owner: NEW INSPIRATION BROADCASTING CO., INC.)
KCBS-FM (93.1 FM; LOS ANGELES, CA; Owner: INFINITY BROADCASTING OPERATIONS, INC.)
KSCA (101.9 FM; GLENDALE, CA; Owner: HBC LICENSE CORPORATION)
K212FA (90.3 FM; TEMPLE CITY, CA; Owner: EDUCATIONAL MEDIA FOUNDATION)
KLOS (95.5 FM; LOS ANGELES, CA; Owner: KLOS-FM RADIO, INC.)
KOST (103.5 FM; LOS ANGELES, CA; Owner: CAPSTAR TX LIMITED PARTNERSHIP)
KLVE (107.5 FM; LOS ANGELES, CA; Owner: KLVE-FM LICENSE CORP.)
KIIS-FM (102.7 FM; LOS ANGELES, CA; Owner: CITICASTERS LICENSES, L.P.)
KPCC (89.3 FM; PASADENA, CA; Owner: PASADENA AREA COMMUNITY COLLEGE DISTRICT)
KHHT (92.3 FM; LOS ANGELES, CA; Owner: AMFM RADIO LICENSES, L.L.C.)
KBIG-FM (104.3 FM; LOS ANGELES, CA; Owner: AMFM RADIO LICENSES, L.L.C.)
KMZT-FM (105.1 FM; LOS ANGELES, CA; Owner: MOUNT WILSON FM BROADCASTERS, INC.)
KPFK (90.7 FM; LOS ANGELES, CA; Owner: PACIFICA FOUNDATION, INC)
TV broadcast stations around Redondo Beach:
KTRO-LP (Channel 50; LANCASTER, CA; Owner: ROBERT D. ADELMAN)
KCBS-TV (Channel 2; LOS ANGELES, CA; Owner: CBS BROADCASTING INC.)
KNBC (Channel 4; LOS ANGELES, CA; Owner: NBC SUBSIDIARY (KNBC-TV), INC.)
National Bridge Inventory (NBI) Statistics 3 Number of bridges20ft / 6.1m Total length307,392 Total average daily traffic15,334 Total average daily truck traffic
Home Mortgage Disclosure Act Aggregated Statistics For Year 2009(Based on 12 full and 1 partial tracts) A) FHA, FSA/RHS & VA B) Conventional C) Refinancings D) Home Improvement Loans E) Loans on Dwellings For 5+ Families F) Non-occupant Loans on Number Average Value Number Average Value Number Average Value Number Average Value Number Average Value Number Average Value
LOANS ORIGINATED 128 $557,554 582 $478,934 2,375 $376,225 108 $282,054 6 $1,542,850 191 $397,584 APPLICATIONS APPROVED, NOT ACCEPTED 8 $529,250 77 $507,323 256 $415,479 8 $322,375 1 $1,450,000 17 $304,999 APPLICATIONS DENIED 35 $546,123 104 $496,165 630 $461,610 24 $201,497 1 $752,000 64 $426,933 APPLICATIONS WITHDRAWN 26 $513,685 83 $451,762 348 $411,389 20 $238,216 1 $4,310,100 37 $376,476 FILES CLOSED FOR INCOMPLETENESS 6 $555,500 17 $526,871 116 $415,512 4 $275,110 0 $0 13 $382,545
Aggregated Statistics For Year 2008(Based on 12 full and 1 partial tracts) A) FHA, FSA/RHS & VA B) Conventional C) Refinancings D) Home Improvement Loans E) Loans on Dwellings For 5+ Families F) Non-occupant Loans on G) Loans On Manufactured Number Average Value Number Average Value Number Average Value Number Average Value Number Average Value Number Average Value Number Average Value
LOANS ORIGINATED 32 $596,252 653 $479,657 887 $407,775 52 $250,857 26 $1,334,720 152 $410,890 3 $96,437 APPLICATIONS APPROVED, NOT ACCEPTED 2 $515,000 128 $529,251 200 $426,321 9 $140,000 0 $0 33 $440,564 13 $92,424 APPLICATIONS DENIED 15 $492,600 193 $519,045 396 $481,970 41 $312,989 1 $930,000 68 $441,537 10 $61,144 APPLICATIONS WITHDRAWN 6 $473,000 134 $478,942 213 $429,151 21 $345,830 0 $0 42 $462,293 0 $0 FILES CLOSED FOR INCOMPLETENESS 4 $625,250 32 $552,697 74 $493,296 12 $292,583 1 $500,000 10 $409,275 0 $0
Aggregated Statistics For Year 2007(Based on 12 full and 1 partial tracts) A) FHA, FSA/RHS & VA B) Conventional C) Refinancings D) Home Improvement Loans E) Loans on Dwellings For 5+ Families F) Non-occupant Loans on G) Loans On Manufactured Number Average Value Number Average Value Number Average Value Number Average Value Number Average Value Number Average Value Number Average Value
LOANS ORIGINATED 0 $0 1,068 $501,688 1,240 $474,457 110 $323,903 27 $1,964,974 256 $513,204 1 $101,000 APPLICATIONS APPROVED, NOT ACCEPTED 0 $0 207 $512,118 258 $486,410 27 $330,110 0 $0 50 $559,567 6 $63,667 APPLICATIONS DENIED 0 $0 228 $574,430 525 $526,649 67 $294,100 2 $962,500 91 $531,231 3 $148,000 APPLICATIONS WITHDRAWN 1 $104,000 117 $484,429 233 $482,527 19 $421,575 4 $2,387,252 47 $480,296 0 $0 FILES CLOSED FOR INCOMPLETENESS 0 $0 28 $605,298 90 $558,318 4 $291,072 0 $0 13 $706,751 0 $0
Aggregated Statistics For Year 2006(Based on 12 full and 1 partial tracts) B) Conventional C) Refinancings D) Home Improvement Loans E) Loans on Dwellings For 5+ Families F) Non-occupant Loans on G) Loans On Manufactured Number Average Value Number Average Value Number Average Value Number Average Value Number Average Value Number Average Value
LOANS ORIGINATED 1,209 $500,459 1,515 $454,543 195 $311,695 32 $1,240,813 305 $500,098 1 $19,000 APPLICATIONS APPROVED, NOT ACCEPTED 191 $455,441 270 $460,864 43 $322,232 0 $0 45 $463,677 8 $84,486 APPLICATIONS DENIED 252 $525,181 506 $497,606 77 $336,772 1 $650,000 83 $552,370 4 $74,750 APPLICATIONS WITHDRAWN 165 $487,808 369 $434,667 24 $406,235 3 $1,338,000 43 $535,733 3 $353,000 FILES CLOSED FOR INCOMPLETENESS 50 $512,285 105 $472,221 3 $374,677 0 $0 17 $536,672 0 $0
Aggregated Statistics For Year 2005(Based on 12 full and 1 partial tracts) A) FHA, FSA/RHS & VA B) Conventional C) Refinancings D) Home Improvement Loans E) Loans on Dwellings For 5+ Families F) Non-occupant Loans on G) Loans On Manufactured Number Average Value Number Average Value Number Average Value Number Average Value Number Average Value Number Average Value Number Average Value
LOANS ORIGINATED 1 $129,000 1,483 $509,646 2,023 $420,305 203 $298,398 31 $1,013,298 345 $457,439 3 $69,290 APPLICATIONS APPROVED, NOT ACCEPTED 0 $0 215 $492,078 280 $404,000 28 $223,875 0 $0 37 $434,261 3 $63,667 APPLICATIONS DENIED 0 $0 298 $476,341 589 $450,198 75 $284,430 3 $1,016,667 84 $543,335 6 $128,333 APPLICATIONS WITHDRAWN 0 $0 235 $463,066 438 $409,461 56 $285,103 2 $649,440 40 $526,636 1 $311,530 FILES CLOSED FOR INCOMPLETENESS 0 $0 58 $474,705 163 $448,337 11 $253,788 0 $0 10 $486,442 0 $0
Aggregated Statistics For Year 2004(Based on 12 full and 1 partial tracts) B) Conventional C) Refinancings D) Home Improvement Loans E) Loans on Dwellings For 5+ Families F) Non-occupant Loans on G) Loans On Manufactured Number Average Value Number Average Value Number Average Value Number Average Value Number Average Value Number Average Value
LOANS ORIGINATED 1,478 $458,207 2,873 $364,426 180 $262,119 48 $1,220,416 394 $396,472 6 $68,333 APPLICATIONS APPROVED, NOT ACCEPTED 258 $429,489 458 $368,964 41 $217,513 0 $0 58 $318,044 1 $41,000 APPLICATIONS DENIED 239 $460,721 582 $403,806 75 $179,277 5 $998,600 66 $409,536 4 $47,290 APPLICATIONS WITHDRAWN 237 $434,061 581 $375,583 33 $180,493 1 $701,000 66 $400,481 4 $149,000 FILES CLOSED FOR INCOMPLETENESS 49 $482,159 154 $363,528 23 $162,941 0 $0 23 $381,296 1 $46,000
Aggregated Statistics For Year 2003(Based on 12 full and 1 partial tracts) A) FHA, FSA/RHS & VA B) Conventional C) Refinancings D) Home Improvement Loans E) Loans on Dwellings For 5+ Families F) Non-occupant Loans on Number Average Value Number Average Value Number Average Value Number Average Value Number Average Value Number Average Value
LOANS ORIGINATED 0 $0 1,695 $368,881 6,892 $288,028 67 $122,399 43 $1,889,864 686 $302,499 APPLICATIONS APPROVED, NOT ACCEPTED 1 $93,000 254 $370,828 858 $299,448 27 $144,838 2 $565,000 82 $301,153 APPLICATIONS DENIED 1 $200,000 266 $346,188 875 $321,653 35 $98,581 0 $0 110 $324,967 APPLICATIONS WITHDRAWN 1 $218,000 198 $368,254 1,014 $297,792 24 $106,828 1 $750,000 69 $303,928 FILES CLOSED FOR INCOMPLETENESS 0 $0 56 $442,768 296 $303,266 12 $93,083 0 $0 35 $265,543
Aggregated Statistics For Year 2002(Based on 12 full and 1 partial tracts) A) FHA, FSA/RHS & VA B) Conventional C) Refinancings D) Home Improvement Loans E) Loans on Dwellings For 5+ Families F) Non-occupant Loans on Number Average Value Number Average Value Number Average Value Number Average Value Number Average Value Number Average Value
LOANS ORIGINATED 2 $163,500 1,862 $299,696 4,837 $277,394 52 $94,796 41 $976,100 417 $270,866 APPLICATIONS APPROVED, NOT ACCEPTED 3 $88,963 248 $305,742 751 $276,432 23 $70,406 1 $800,000 61 $294,133 APPLICATIONS DENIED 0 $0 247 $298,933 674 $289,644 38 $68,652 4 $714,450 78 $317,415 APPLICATIONS WITHDRAWN 2 $138,000 174 $306,967 654 $274,638 21 $70,958 3 $569,667 50 $298,039 FILES CLOSED FOR INCOMPLETENESS 0 $0 71 $319,552 251 $291,357 2 $65,000 3 $2,368,333 20 $240,518
Aggregated Statistics For Year 2001(Based on 12 full and 1 partial tracts) A) FHA, FSA/RHS & VA B) Conventional C) Refinancings D) Home Improvement Loans E) Loans on Dwellings For 5+ Families F) Non-occupant Loans on Number Average Value Number Average Value Number Average Value Number Average Value Number Average Value Number Average Value
LOANS ORIGINATED 8 $209,750 1,904 $248,221 3,085 $245,994 96 $52,032 25 $992,744 319 $260,220 APPLICATIONS APPROVED, NOT ACCEPTED 0 $0 225 $215,195 496 $247,523 27 $77,746 0 $0 49 $250,657 APPLICATIONS DENIED 3 $213,333 223 $280,854 680 $248,401 39 $40,645 2 $583,500 56 $266,609 APPLICATIONS WITHDRAWN 2 $186,500 236 $251,108 608 $239,642 34 $65,716 4 $1,348,195 47 $270,230 FILES CLOSED FOR INCOMPLETENESS 1 $187,000 56 $262,379 175 $261,425 4 $41,382 5 $2,739,566 14 $254,677
Aggregated Statistics For Year 2000(Based on 12 full and 1 partial tracts) A) FHA, FSA/RHS & VA B) Conventional C) Refinancings D) Home Improvement Loans E) Loans on Dwellings For 5+ Families F) Non-occupant Loans on Number Average Value Number Average Value Number Average Value Number Average Value Number Average Value Number Average Value
LOANS ORIGINATED 11 $170,559 1,806 $244,147 703 $237,613 126 $50,771 18 $1,161,505 184 $261,673 APPLICATIONS APPROVED, NOT ACCEPTED 1 $187,000 261 $207,817 123 $219,452 54 $64,492 0 $0 25 $232,815 APPLICATIONS DENIED 2 $184,000 311 $253,107 368 $205,108 44 $62,775 2 $1,097,500 43 $252,189 APPLICATIONS WITHDRAWN 5 $151,000 194 $246,030 189 $170,372 16 $58,510 0 $0 15 $281,245 FILES CLOSED FOR INCOMPLETENESS 0 $0 55 $246,781 90 $253,443 6 $38,333 4 $1,552,182 13 $246,941
Aggregated Statistics For Year 1999(Based on 6 full and 7 partial tracts) A) FHA, FSA/RHS & VA B) Conventional C) Refinancings D) Home Improvement Loans E) Loans on Dwellings For 5+ Families F) Non-occupant Loans on Number Average Value Number Average Value Number Average Value Number Average Value Number Average Value Number Average Value
LOANS ORIGINATED 23 $180,843 1,873 $226,815 1,576 $211,339 91 $36,723 24 $695,378 254 $220,636 APPLICATIONS APPROVED, NOT ACCEPTED 0 $0 196 $254,797 322 $221,190 35 $34,459 2 $1,038,010 28 $232,947 APPLICATIONS DENIED 2 $167,335 292 $235,271 503 $226,008 52 $38,901 7 $754,303 62 $238,782 APPLICATIONS WITHDRAWN 10 $203,669 268 $236,371 374 $210,638 15 $74,695 3 $2,019,547 32 $223,939 FILES CLOSED FOR INCOMPLETENESS 1 $127,600 51 $278,672 121 $223,007 5 $24,780 9 $1,930,914 7 $235,184
Detailed mortgage data for all 13 tracts in Redondo Beach, CA
Private Mortgage Insurance Companies Aggregated Statistics For Year 2009(Based on 11 full and 1 partial tracts) A) Conventional B) Refinancings Number Average Value Number Average Value
LOANS ORIGINATED 40 $477,404 12 $450,417 APPLICATIONS APPROVED, NOT ACCEPTED 8 $565,500 4 $444,720 APPLICATIONS DENIED 9 $465,000 12 $466,833 APPLICATIONS WITHDRAWN 3 $501,333 2 $444,000 FILES CLOSED FOR INCOMPLETENESS 4 $619,250 0 $0
Aggregated Statistics For Year 2008(Based on 10 full and 1 partial tracts) A) Conventional B) Refinancings C) Non-occupant Loans on Number Average Value Number Average Value Number Average Value
LOANS ORIGINATED 77 $486,215 6 $575,167 2 $449,000 APPLICATIONS APPROVED, NOT ACCEPTED 17 $471,560 5 $375,000 0 $0 APPLICATIONS DENIED 17 $528,795 3 $516,667 1 $402,000 APPLICATIONS WITHDRAWN 3 $489,333 3 $600,000 0 $0 FILES CLOSED FOR INCOMPLETENESS 1 $459,090 1 $630,000 0 $0
Aggregated Statistics For Year 2007(Based on 8 full and 1 partial tracts) A) Conventional B) Refinancings C) Non-occupant Loans on Number Average Value Number Average Value Number Average Value
LOANS ORIGINATED 7 $538,836 7 $587,589 1 $363,000 APPLICATIONS APPROVED, NOT ACCEPTED 0 $0 1 $414,000 0 $0 APPLICATIONS DENIED 0 $0 0 $0 0 $0 APPLICATIONS WITHDRAWN 1 $468,000 0 $0 0 $0 FILES CLOSED FOR INCOMPLETENESS 0 $0 0 $0 0 $0
Aggregated Statistics For Year 2006(Based on 5 full and 1 partial tracts) A) Conventional B) Refinancings C) Non-occupant Loans on Number Average Value Number Average Value Number Average Value
LOANS ORIGINATED 3 $509,703 1 $650,000 1 $493,000 APPLICATIONS APPROVED, NOT ACCEPTED 0 $0 1 $615,000 0 $0 APPLICATIONS DENIED 1 $926,000 0 $0 0 $0 APPLICATIONS WITHDRAWN 1 $516,000 0 $0 0 $0 FILES CLOSED FOR INCOMPLETENESS 0 $0 0 $0 0 $0
Aggregated Statistics For Year 2005(Based on 5 full tracts) A) Conventional B) Refinancings C) Non-occupant Loans on Number Average Value Number Average Value Number Average Value
LOANS ORIGINATED 4 $576,750 1 $612,000 2 $562,000 APPLICATIONS APPROVED, NOT ACCEPTED 0 $0 1 $494,000 0 $0 APPLICATIONS DENIED 0 $0 2 $670,000 0 $0 APPLICATIONS WITHDRAWN 0 $0 0 $0 0 $0 FILES CLOSED FOR INCOMPLETENESS 0 $0 0 $0 0 $0
Aggregated Statistics For Year 2004(Based on 8 full and 1 partial tracts) A) Conventional B) Refinancings C) Non-occupant Loans on Number Average Value Number Average Value Number Average Value
LOANS ORIGINATED 12 $443,504 3 $456,547 2 $470,500 APPLICATIONS APPROVED, NOT ACCEPTED 5 $384,400 7 $433,571 0 $0 APPLICATIONS DENIED 0 $0 0 $0 0 $0 APPLICATIONS WITHDRAWN 2 $417,000 0 $0 0 $0 FILES CLOSED FOR INCOMPLETENESS 0 $0 1 $381,000 0 $0
Aggregated Statistics For Year 2003(Based on 12 full and 1 partial tracts) A) Conventional B) Refinancings C) Non-occupant Loans on Number Average Value Number Average Value Number Average Value
LOANS ORIGINATED 33 $409,025 23 $316,016 2 $197,500 APPLICATIONS APPROVED, NOT ACCEPTED 15 $333,867 16 $333,000 1 $300,000 APPLICATIONS DENIED 2 $683,500 3 $377,333 0 $0 APPLICATIONS WITHDRAWN 5 $696,200 5 $332,036 1 $479,000 FILES CLOSED FOR INCOMPLETENESS 0 $0 0 $0 0 $0
Aggregated Statistics For Year 2002(Based on 11 full and 1 partial tracts) A) Conventional B) Refinancings C) Non-occupant Loans on Number Average Value Number Average Value Number Average Value
LOANS ORIGINATED 72 $341,541 39 $322,891 6 $264,423 APPLICATIONS APPROVED, NOT ACCEPTED 30 $323,254 34 $306,194 1 $269,000 APPLICATIONS DENIED 2 $301,500 2 $399,500 0 $0 APPLICATIONS WITHDRAWN 3 $377,333 4 $310,500 0 $0 FILES CLOSED FOR INCOMPLETENESS 2 $320,765 0 $0 0 $0
Aggregated Statistics For Year 2001(Based on 12 full and 1 partial tracts) A) Conventional B) Refinancings C) Non-occupant Loans on Number Average Value Number Average Value Number Average Value
LOANS ORIGINATED 129 $289,212 55 $275,360 5 $275,400 APPLICATIONS APPROVED, NOT ACCEPTED 36 $289,880 23 $294,132 2 $277,270 APPLICATIONS DENIED 5 $305,800 8 $339,651 0 $0 APPLICATIONS WITHDRAWN 5 $344,600 3 $211,260 3 $328,593 FILES CLOSED FOR INCOMPLETENESS 2 $323,000 0 $0 0 $0
Aggregated Statistics For Year 2000(Based on 12 full and 1 partial tracts) A) Conventional B) Refinancings C) Non-occupant Loans on Number Average Value Number Average Value Number Average Value
LOANS ORIGINATED 198 $285,137 33 $289,278 4 $394,000 APPLICATIONS APPROVED, NOT ACCEPTED 46 $289,816 15 $273,733 0 $0 APPLICATIONS DENIED 7 $315,571 5 $239,722 1 $140,000 APPLICATIONS WITHDRAWN 8 $305,199 1 $371,000 0 $0 FILES CLOSED FOR INCOMPLETENESS 1 $237,000 0 $0 0 $0
Aggregated Statistics For Year 1999(Based on 6 full and 7 partial tracts) A) Conventional B) Refinancings C) Non-occupant Loans on Number Average Value Number Average Value Number Average Value
LOANS ORIGINATED 267 $260,221 58 $257,036 7 $190,089 APPLICATIONS APPROVED, NOT ACCEPTED 30 $254,872 34 $247,964 3 $247,230 APPLICATIONS DENIED 13 $258,266 6 $234,178 2 $301,530 APPLICATIONS WITHDRAWN 11 $263,325 5 $230,786 0 $0 FILES CLOSED FOR INCOMPLETENESS 2 $246,000 2 $235,675 1 $192,000
Fire-safe hotels and motels in Redondo Beach, California:
The Redondo Beach Hotel, 400 N Harbor Dr, Redondo Beach, California 90277 Phone: (310) 376-0746, Fax: (310) 376-7384
Residence Inn by Marriott Los Angeles Redondo Beach, 2420 Marine Ave, Redondo Beach, California 90278 Phone: (310) 725-0108, Fax: (310) 725-0109
Hilton Garden Inn Los Angeles/Redondo Beach, 2410 Marine Ave, Redondo Beach, California 90278 Phone: (310) 727-9999, Fax: (310) 727-9998
Homewood Suites by Hilton Los Angeles/Redondo Beach, 2430 Marine Ave, Redondo beach, California 90278 Phone: (310) 536-1209
All 4 fire-safe hotels and motels in Redondo Beach, California
Most common first names in Redondo Beach, CA among deceased individuals Name Count Lived (average)
John 365 72.2 years Mary 319 79.2 years William 282 73.2 years Robert 242 70.6 years James 213 72.0 years Helen 171 78.7 years George 166 75.6 years Charles 163 75.3 years Joseph 149 74.9 years Ruth 135 79.6 years
Most common last names in Redondo Beach, CA among deceased individuals Last name Count Lived (average)
Smith 108 77.3 years Johnson 74 75.9 years Brown 66 73.4 years Miller 52 78.3 years Williams 47 71.5 years Anderson 46 79.4 years Jones 44 80.1 years Wilson 44 77.3 years Nelson 41 76.6 years Moore 40 76.1 years
Redondo Beach compared to California state average:
Median household income above state average. Median house value above state average. Unemployed percentage significantly below state average. Hispanic race population percentage significantly below state average. Median age above state average. Percentage of population with a bachelor's degree or higher significantly above state average. Redondo Beach on our top lists :
#1 on the list of "Top 101 cities with largest percentage of females in occupations: management occupations (population 50,000+)"
#8 on the list of "Top 101 cities with largest percentage of females in industries: real estate and rental and leasing (population 50,000+)"
#16 on the list of "Top 101 cities with largest percentage of females in industries: information (population 50,000+)"
#21 on the list of "Top 101 cities with largest percentage of males in occupations: management occupations (population 50,000+)"
#22 on the list of "Top 101 cities with largest percentage of females in industries: manufacturing (population 50,000+)"
#24 on the list of "Top 100 cities with highest median house value (pop. 50,000+)"
#26 on the list of "Top 101 cities with the smallest temperature differences during a year (population 50,000+)"
#31 on the list of "Top 101 cities with the least people below the poverty level (population 50,000+)"
#33 on the list of "Top 101 cities with largest percentage of males in occupations: architecture and engineering occupations (population 50,000+)"
#35 on the list of "Top 101 cities with largest percentage of females in industries: professional, scientific, and technical services (population 50,000+)"
#38 on the list of "Top 101 cities with largest percentage of females in occupations: life, physical, and social science occupations (population 50,000+)"
#40 on the list of "Top 101 larger cities with the highest increase in house/condo value from 2000 (population 50,000+)"
#41 on the list of "Top 101 cities with largest percentage of males in occupations: arts, design, entertainment, sports, and media occupations (population 50,000+)"
#53 on the list of "Top 100 cities with highest median household income (pop. 50,000+)"
#57 on the list of "Top 101 cities with largest percentage of females in industries: wholesale trade (population 50,000+)"
#58 on the list of "Top 101 cities with largest percentage of males in industries: professional, scientific, and technical services (population 50,000+)"
#59 on the list of "Top 101 cities with the most people having Master's or Doctorate degrees (population 50,000+)"
#62 on the list of "Top 100 cities with highest ratio of median house value to median household income (pop. 50,000+)"
#67 on the list of "Top 101 cities with the most people having Doctorate degrees (population 50,000+)"
#68 on the list of "Top 101 cities with largest percentage of females in occupations: transportation occupations (population 50,000+)"
#1 on the list of "Top 101 counties with the most Evangelical Protestant congregations"
#1 on the list of "Top 101 counties with the most Mainline Protestant congregations"
#1 on the list of "Top 101 counties with the most Orthodox adherents"
#1 on the list of "Top 101 counties with the highest ground withdrawal of fresh water for public supply (pop. 50,000+)"
#1 on the list of "Top 101 counties with the most Catholic adherents (pop. 50,000+)"
Top Patent Applicants
Silva Hiti (70)
Ian S. Robinson (44)
Terence G. Ward (29)
David A. Ferrera (23)
George R. Woody (19)
Seth Coe-Sullivan (18)
Alana Nakata (18)
Kyle L. Baltz (17)
Henning M. Hauenstein (17)
Niraj V. Nayak (17)
Total of 1834 patent applications in 2008-2024.

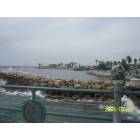
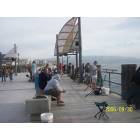
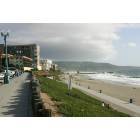
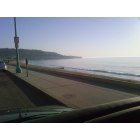
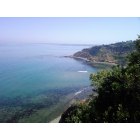

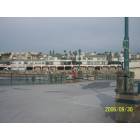
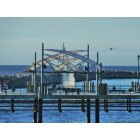
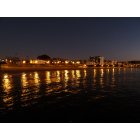

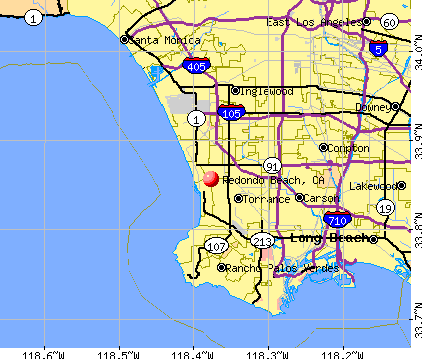


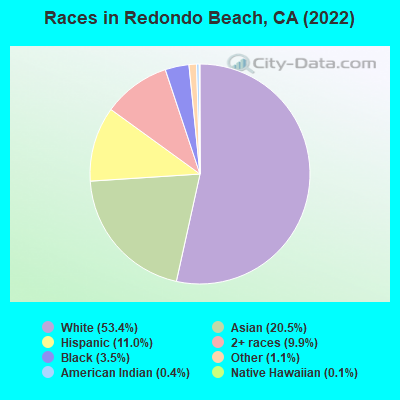
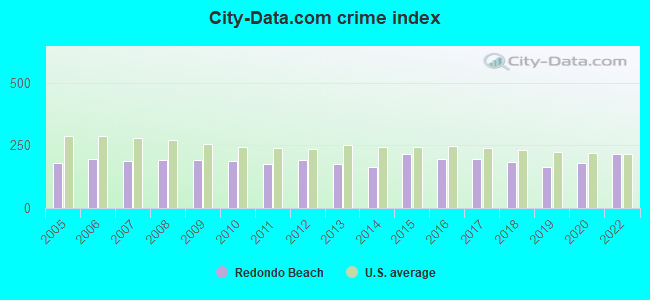
 Recent articles from our blog. Our writers, many of them Ph.D. graduates or candidates, create easy-to-read articles on a wide variety of topics.

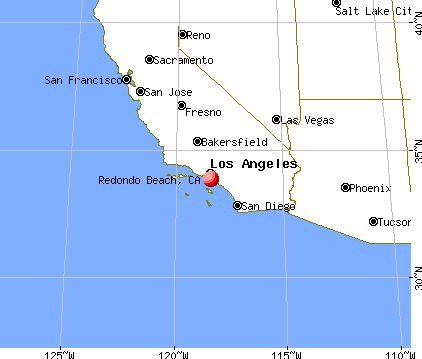
 (13.1 miles
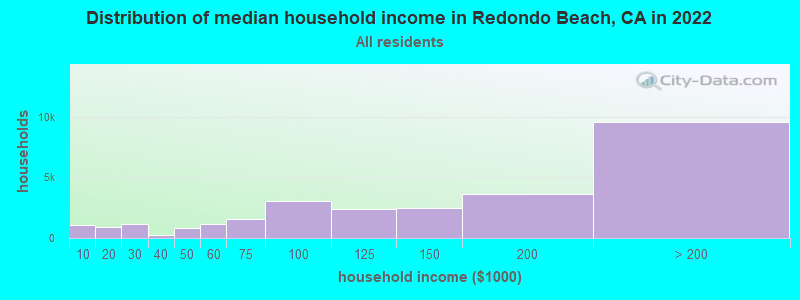
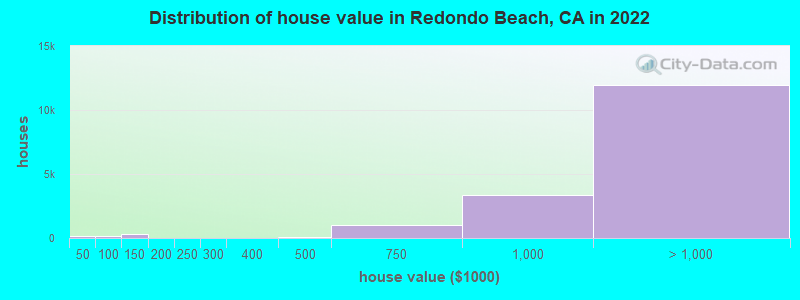

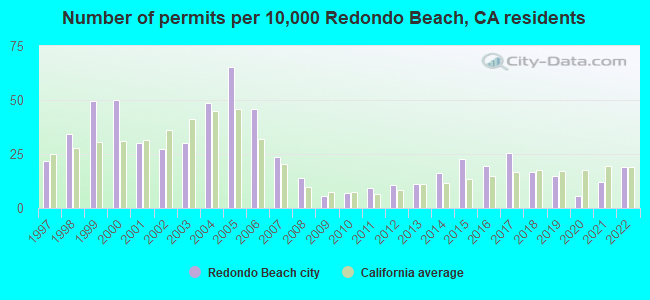
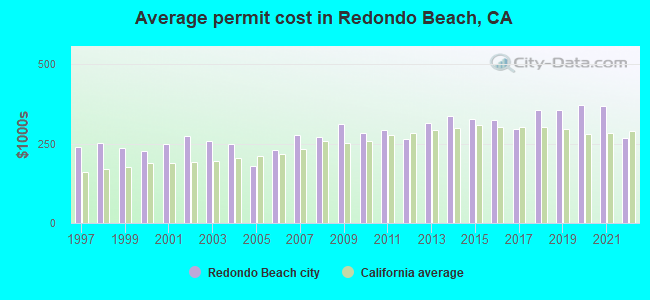
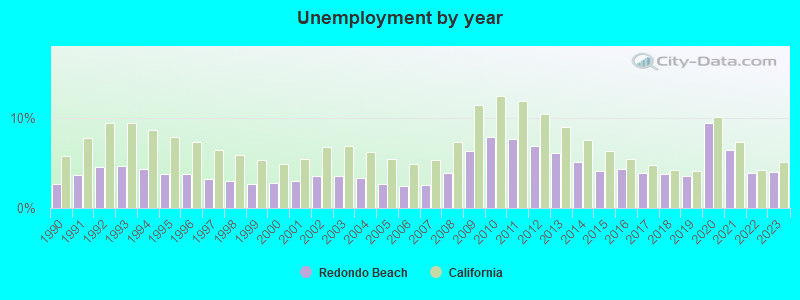
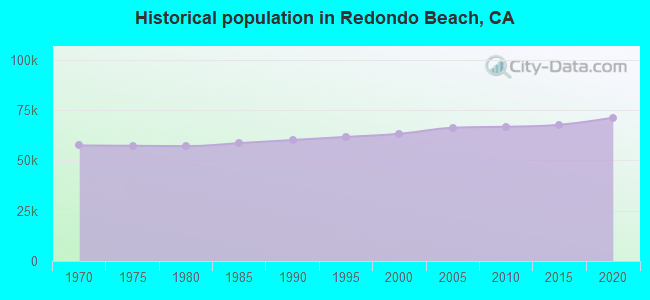
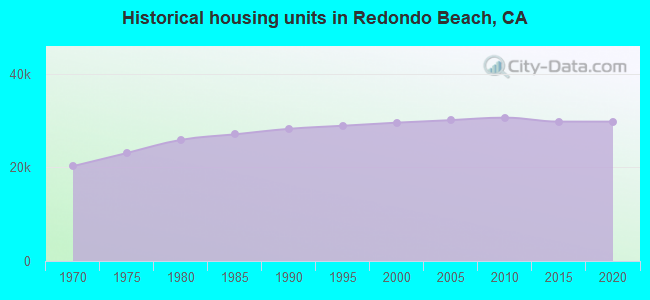
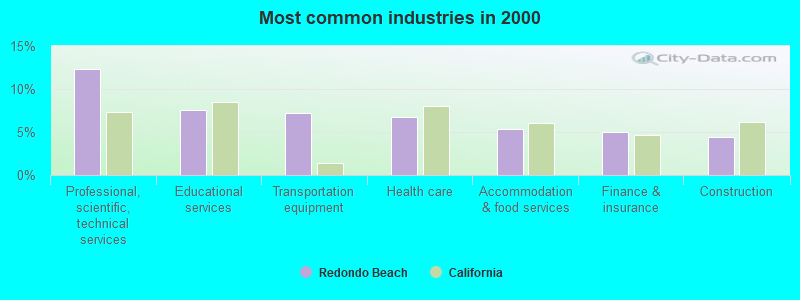
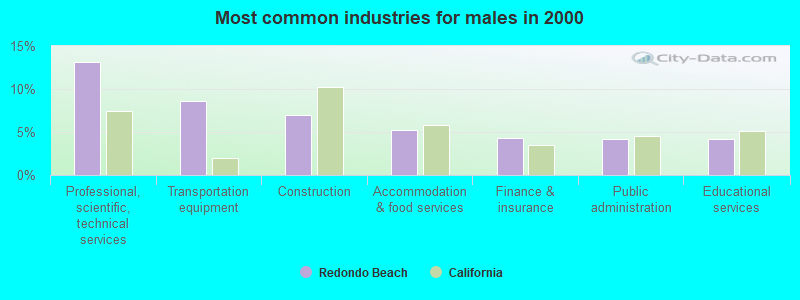
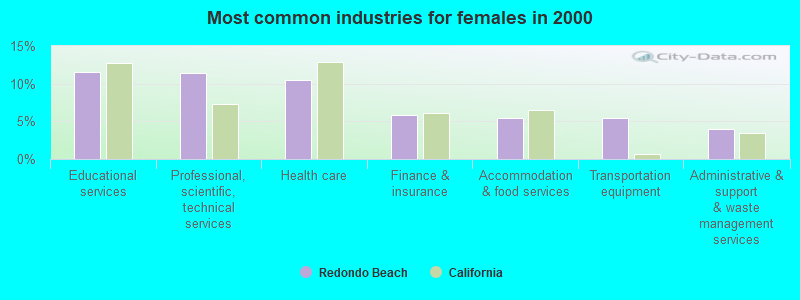
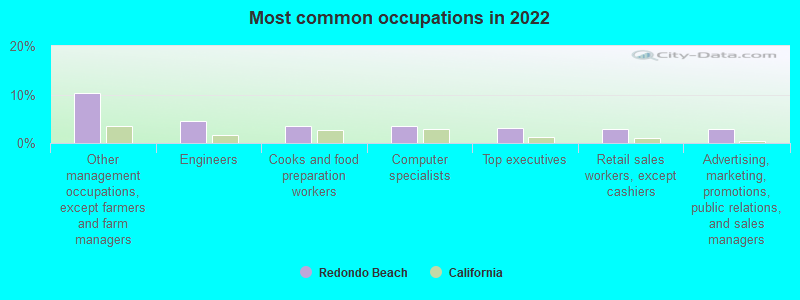
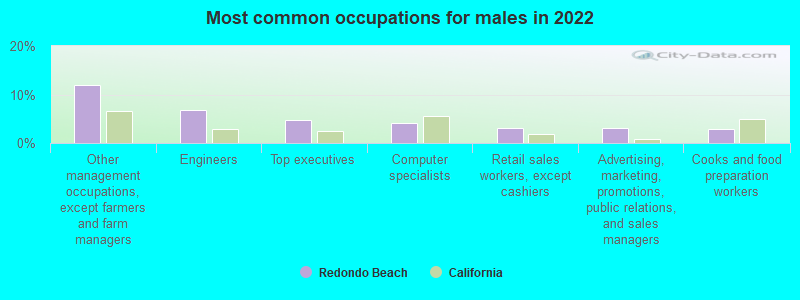
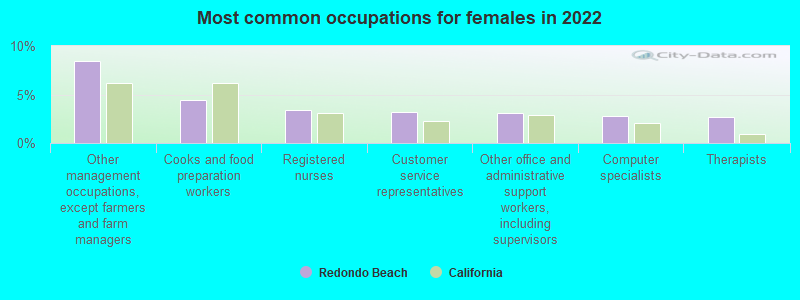
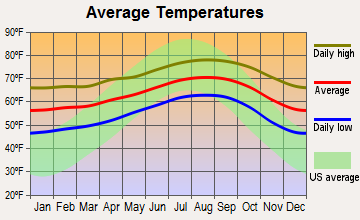
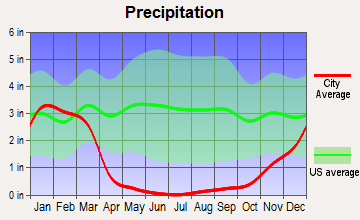
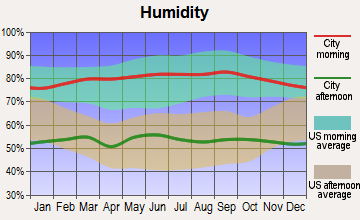
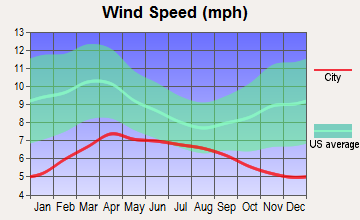
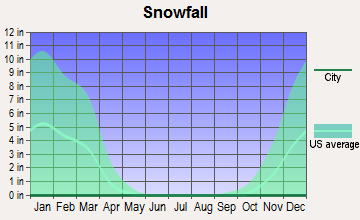
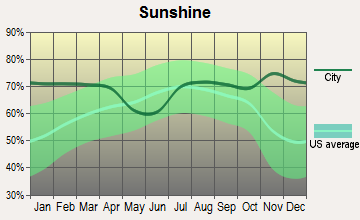
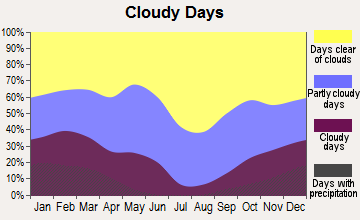


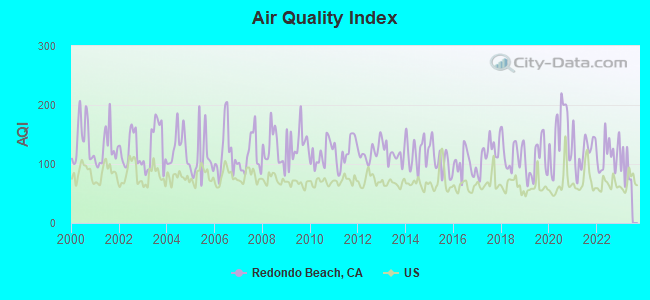
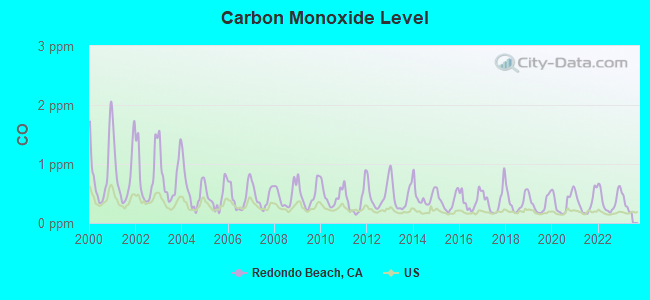
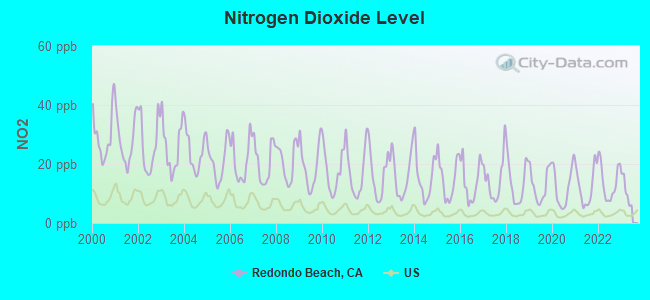
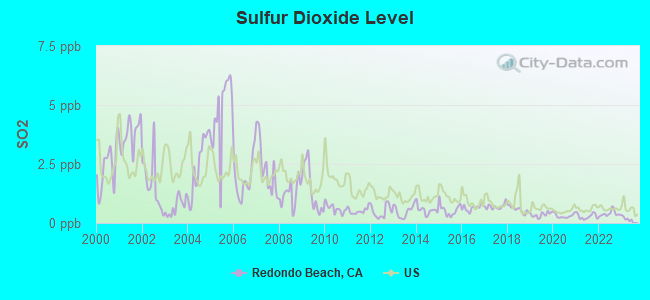
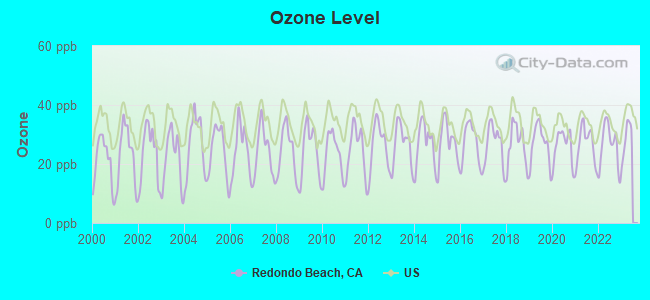
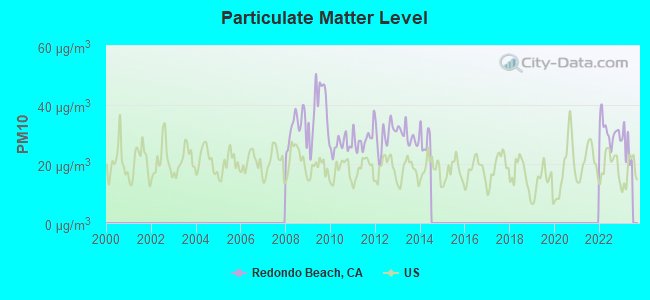
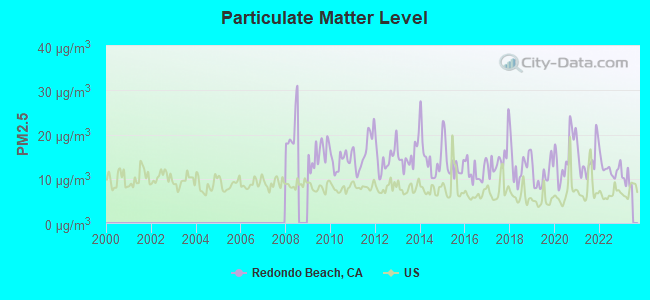
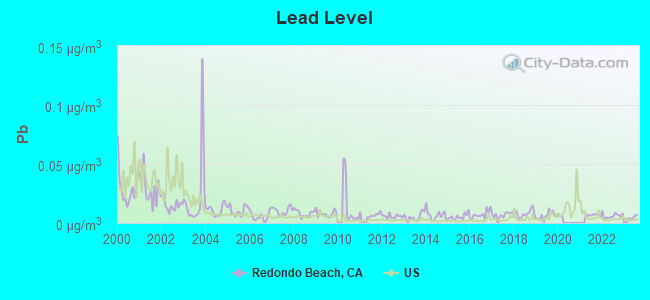
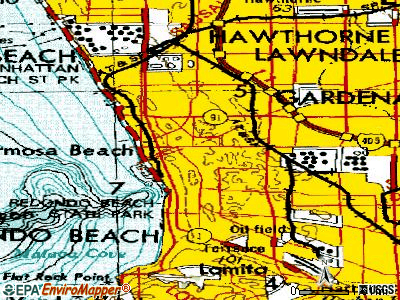
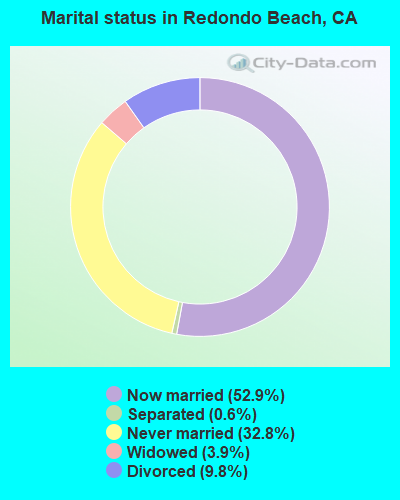
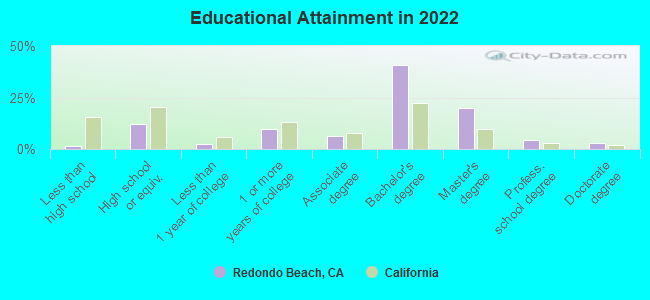
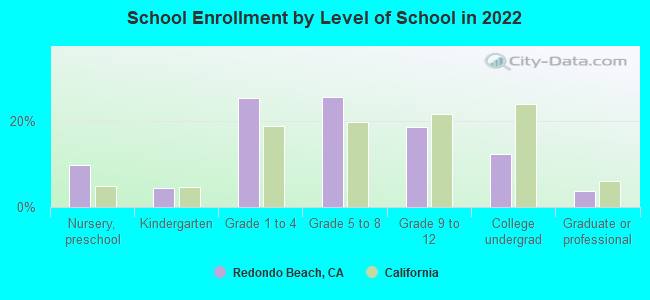
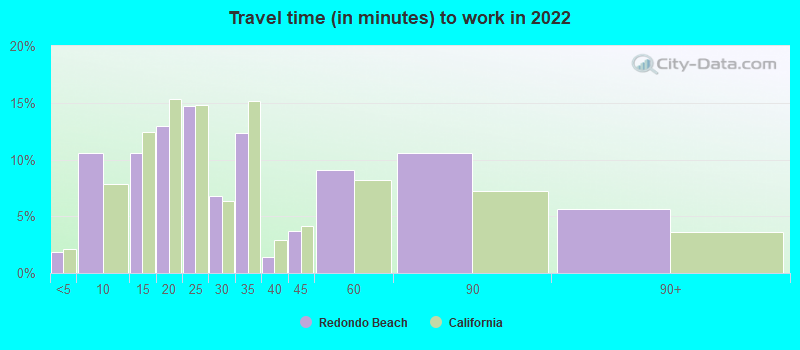
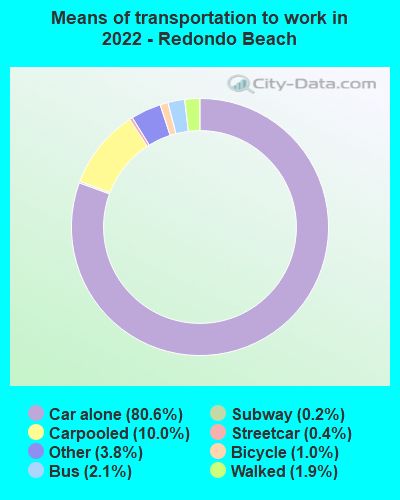


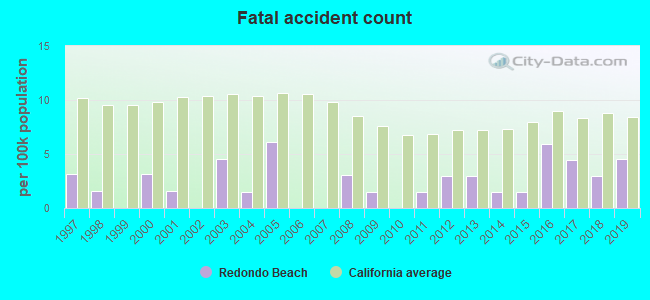
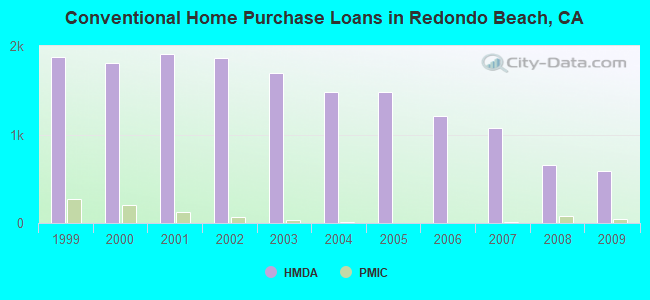
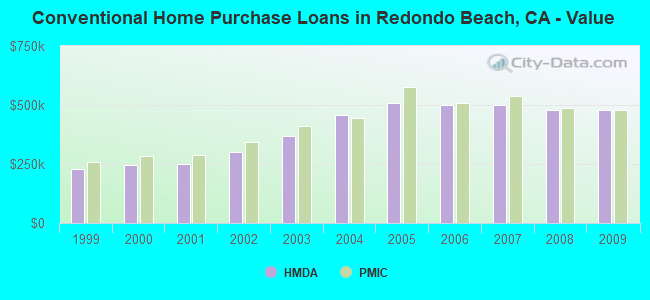
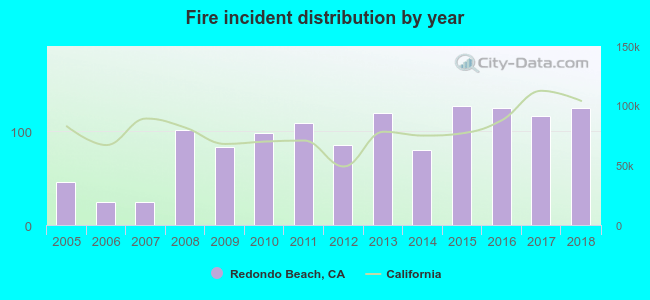 Based on the data from the years 2005 - 2018 the average number of fires per year is 90. The highest number of fires - 127 took place in 2015, and the least - 24 in 2007. The data has a rising trend.
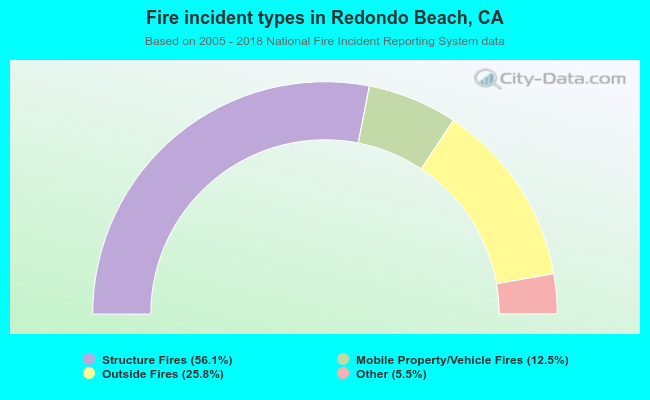 When looking into fire subcategories, the most incidents belonged to: Structure Fires (56.1%), and Outside Fires (25.8%).