Estimated zip code population in 2022: 36,037 Zip code population in 2010: 35,293 Zip code population in 2000: 34,174
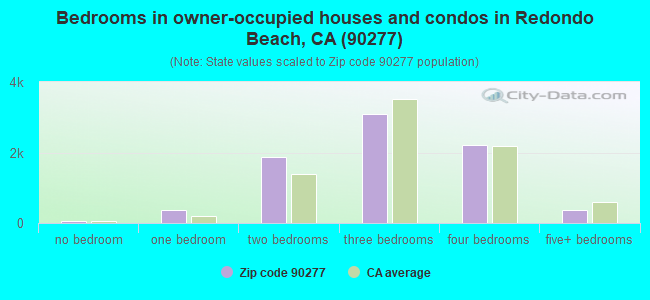
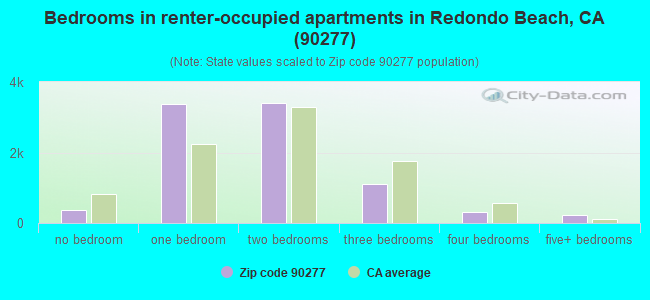
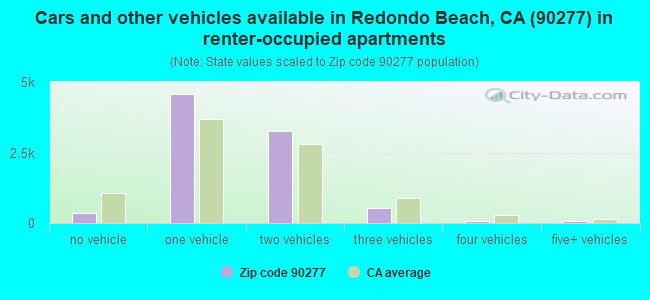
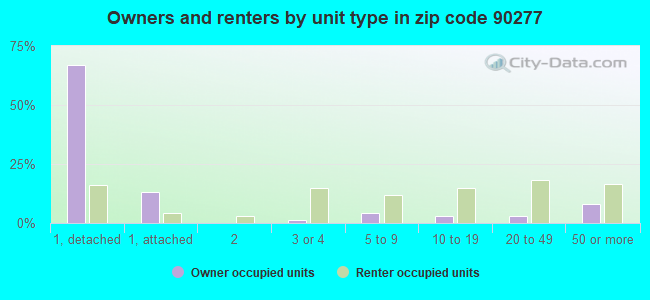
Houses and condos: 18,288 Renter-occupied apartments: 8,833
% of renters here:
53%
State:
44%
March 2022 cost of living index in zip code 90277: 141.8 (very high, U.S. average is 100)
Land area: 3.6 sq. mi. Water area: 1.4 sq. mi.
Population density: 10,058 people per square mile
(high).
OSM Map
General Map
Google Map
MSN Map
OSM Map
General Map
Google Map
MSN Map
OSM Map
General Map
Google Map
MSN Map
OSM Map
General Map
Google Map
MSN Map
Please wait while loading the map...
Real estate property taxes paid for housing units in 2022:
This zip code:
0.6% ($8,595)
California:
0.7% ($4,831)
Median real estate property taxes paid for housing units with mortgages in 2022: $9,807 (0.7%) Median real estate property taxes paid for housing units with no mortgage in 2022: $7,047 (0.5%)
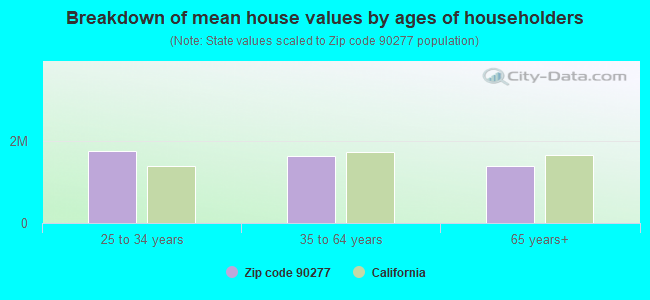
Estimated median house/condo value in 2022: $1,430,606
90277:
$1,430,606
California:
$715,900
According to our research of California and other state lists, there were 15 registered sex offenders living in 90277 zip code as of April 27, 2024. The ratio of all residents to sex offenders in zip code 90277 is 2,381 to 1. The ratio of registered sex offenders to all residents in this zip code is much lower than the state average.
Median resident age:
This zip code:
45.2 years
California median age:
37.9 years
Average household size:
This zip code:
2.1 people
California:
2.8 people
Averages for the 2020 tax year for zip code 90277, filed in 2021:
Average Adjusted Gross Income (AGI) in 2020: $154,760 (Individual Income Tax Returns)
Here:
$154,760
State:
$95,910
Salary/wage: $130,532 (reported on 75.1% of returns)
Here:
$130,532
State:
$77,331
(% of AGI for various income ranges: 1146.1% for AGIs below $25k, 3757.2% for AGIs $25k-50k, 7158.7% for AGIs $50k-75k, 10519.1% for AGIs $75k-100k, 20384.0% for AGIs $100k-200k, 111613.2% for AGIs over 200k)
Taxable interest for individuals: $3,097 (reported on 50.6% of returns)
This zip code:
$3,097
California:
$2,294
(% of AGI for various income ranges: 58.1% for AGIs below $25k, 78.6% for AGIs $25k-50k, 111.4% for AGIs $50k-75k, 165.3% for AGIs $75k-100k, 296.1% for AGIs $100k-200k, 1751.2% for AGIs over 200k)
Ordinary dividends: $10,011 (reported on 41.5% of returns)
Here:
$10,011
State:
$10,949
(% of AGI for various income ranges: 94.5% for AGIs below $25k, 159.4% for AGIs $25k-50k, 270.4% for AGIs $50k-75k, 424.4% for AGIs $75k-100k, 684.9% for AGIs $100k-200k, 5096.3% for AGIs over 200k)
Net capital gain/loss in AGI: +$40,121 (reported on 39.5% of returns)
Here:
+$40,121
State:
+$49,306
(% of AGI for various income ranges: 51.5% for AGIs below $25k, 119.9% for AGIs $25k-50k, 219.1% for AGIs $50k-75k, 330.3% for AGIs $75k-100k, 898.9% for AGIs $100k-200k, 27104.4% for AGIs over 200k)
Profit/loss from business: +$21,503 (reported on 23.1% of returns)
Here:
+$21,503
State:
+$15,671
(% of AGI for various income ranges: 286.7% for AGIs below $25k, 503.9% for AGIs $25k-50k, 510.5% for AGIs $50k-75k, 536.0% for AGIs $75k-100k, 957.2% for AGIs $100k-200k, 4726.3% for AGIs over 200k)
Taxable individual retirement arrangement distribution: $31,509 (reported on 11.8% of returns)
90277:
$31,509
California:
$23,505
(% of AGI for various income ranges: 107.2% for AGIs below $25k, 205.5% for AGIs $25k-50k, 360.2% for AGIs $50k-75k, 565.2% for AGIs $75k-100k, 1079.0% for AGIs $100k-200k, 3044.8% for AGIs over 200k)
Self-employed (Keogh) retirement plans: $29,000 (reported on 2.4% of returns)
90277:
$29,000
California:
$30,163
(% of AGI for various income ranges: 4.1% for AGIs below $25k, 11.6% for AGIs $25k-50k, 20.8% for AGIs $50k-75k, 39.3% for AGIs $75k-100k, 91.3% for AGIs $100k-200k, 1011.0% for AGIs over 200k)
Total itemized deductions: $39,890 (reported on 27.1% of returns)
Here:
$39,890
State:
$39,517
(% of AGI for various income ranges: 299.9% for AGIs below $25k, 486.0% for AGIs $25k-50k, 775.2% for AGIs $50k-75k, 1159.1% for AGIs $75k-100k, 2381.0% for AGIs $100k-200k, 11627.3% for AGIs over 200k)
Charity contributions: $10,134 (reported on 23.4% of returns)
Here:
$10,134
State:
$12,598
(% of AGI for various income ranges: 11.9% for AGIs below $25k, 38.5% for AGIs $25k-50k, 73.1% for AGIs $50k-75k, 147.0% for AGIs $75k-100k, 309.1% for AGIs $100k-200k, 3470.6% for AGIs over 200k)
Taxes paid: $9,290 (reported on 27.1% of returns)
90277:
$9,290
State:
$8,807
(% of AGI for various income ranges: 60.4% for AGIs below $25k, 112.1% for AGIs $25k-50k, 188.9% for AGIs $50k-75k, 330.1% for AGIs $75k-100k, 690.7% for AGIs $100k-200k, 2342.5% for AGIs over 200k)
Earned income credit: $1,237 (reported on 5.5% of returns)
Here:
$1,237
State:
$2,074
(% of AGI for various income ranges: 47.2% for AGIs below $25k, 25.8% for AGIs $25k-50k)
Percentage of individuals using paid preparers for their 2020 taxes: 92.6%
Here:
93%
State:
92%
(% for various income ranges: 89.8% for AGIs below $25k, 90.4% for AGIs $25k-50k, 92.1% for AGIs $50k-75k, 93.8% for AGIs $75k-100k, 93.7% for AGIs $100k-200k, 95.3% for AGIs over 200k)
Averages for the 2012 tax year for zip code 90277, filed in 2013:
Average Adjusted Gross Income (AGI) in 2012: $110,446 (Individual Income Tax Returns)
Here:
$110,446
State:
$72,726
Salary/wage: $94,359 (reported on 78.2% of returns)
Here:
$94,359
State:
$59,079
(% of AGI for various income ranges: 61.8% for AGIs below $25k, 70.8% for AGIs $25k-50k, 74.0% for AGIs $50k-75k, 74.2% for AGIs $75k-100k, 74.7% for AGIs $100k-200k, 59.3% for AGIs over 200k)
Taxable interest for individuals: $2,191 (reported on 50.2% of returns)
This zip code:
$2,191
California:
$2,146
(% of AGI for various income ranges: 2.5% for AGIs below $25k, 1.2% for AGIs $25k-50k, 1.0% for AGIs $50k-75k, 0.9% for AGIs $75k-100k, 0.9% for AGIs $100k-200k, 1.0% for AGIs over 200k)
Ordinary dividends: $7,930 (reported on 34.5% of returns)
Here:
$7,930
State:
$9,308
(% of AGI for various income ranges: 3.6% for AGIs below $25k, 2.0% for AGIs $25k-50k, 1.9% for AGIs $50k-75k, 1.8% for AGIs $75k-100k, 1.9% for AGIs $100k-200k, 3.0% for AGIs over 200k)
Net capital gain/loss in AGI: +$25,716 (reported on 31.1% of returns)
Here:
+$25,716
State:
+$30,460
(% of AGI for various income ranges: 0.4% for AGIs $25k-50k, 0.5% for AGIs $50k-75k, 0.9% for AGIs $75k-100k, 1.4% for AGIs $100k-200k, 14.2% for AGIs over 200k)
Profit/loss from business: +$20,074 (reported on 23.5% of returns)
Here:
+$20,074
State:
+$17,064
(% of AGI for various income ranges: 17.5% for AGIs below $25k, 8.6% for AGIs $25k-50k, 5.3% for AGIs $50k-75k, 4.2% for AGIs $75k-100k, 4.2% for AGIs $100k-200k, 2.9% for AGIs over 200k)
Taxable individual retirement arrangement distribution: $23,281 (reported on 12.6% of returns)
90277:
$23,281
California:
$19,557
(% of AGI for various income ranges: 5.3% for AGIs below $25k, 3.4% for AGIs $25k-50k, 3.7% for AGIs $50k-75k, 3.5% for AGIs $75k-100k, 3.4% for AGIs $100k-200k, 1.7% for AGIs over 200k)
Self-employment retirement plans: $23,286 (reported on 2.3% of returns)
90277:
$23,286
California:
$24,530
(% of AGI for various income ranges: 0.3% for AGIs $25k-50k, 0.3% for AGIs $50k-75k, 0.3% for AGIs $75k-100k, 0.3% for AGIs $100k-200k, 0.7% for AGIs over 200k)
Total itemized deductions: $36,850 (21% of AGI, reported on 52.7% of returns)
Here:
$36,850
State:
$34,004
Here:
21.3% of AGI
State:
22.7% of AGI
(% of AGI for various income ranges: 21.3% for AGIs below $25k, 15.7% for AGIs $25k-50k, 14.9% for AGIs $50k-75k, 16.9% for AGIs $75k-100k, 19.4% for AGIs $100k-200k, 17.2% for AGIs over 200k)
Charity contributions: $3,833 (reported on 44.7% of returns)
Here:
$3,833
State:
$4,659
(% of AGI for various income ranges: 1.2% for AGIs below $25k, 1.2% for AGIs $25k-50k, 1.5% for AGIs $50k-75k, 1.5% for AGIs $75k-100k, 1.6% for AGIs $100k-200k, 1.6% for AGIs over 200k)
Taxes paid: $17,350 (reported on 52.7% of returns)
90277:
$17,350
State:
$14,448
(% of AGI for various income ranges: 4.6% for AGIs below $25k, 3.7% for AGIs $25k-50k, 4.5% for AGIs $50k-75k, 6.4% for AGIs $75k-100k, 8.4% for AGIs $100k-200k, 10.0% for AGIs over 200k)
Earned income credit: $1,272 (reported on 6.8% of returns)
Here:
$1,272
State:
$2,286
(% of AGI for various income ranges: 2.5% for AGIs below $25k, 0.3% for AGIs $25k-50k)
Percentage of individuals using paid preparers for their 2012 taxes: 63.1%
Here:
63%
State:
64%
(% for various income ranges: 57.2% for AGIs below $25k, 58.5% for AGIs $25k-50k, 60.5% for AGIs $50k-75k, 64.1% for AGIs $75k-100k, 67.2% for AGIs $100k-200k, 76.2% for AGIs over 200k)
Averages for the 2004 tax year for zip code 90277, filed in 2005:
Average Adjusted Gross Income (AGI) in 2004: $84,527 (Individual Income Tax Returns)
Here:
$84,527
State:
$58,600
Salary/wage: $72,532 (reported on 79.4% of returns)
Here:
$72,532
State:
$49,455
(% of AGI for various income ranges: 66.0% for AGIs $10k-25k, 78.2% for AGIs $25k-50k, 79.3% for AGIs $50k-75k, 78.1% for AGIs $75k-100k, 62.0% for AGIs over 100k)
Taxable interest for individuals: $2,799 (reported on 59.3% of returns)
This zip code:
$2,799
California:
$2,365
(% of AGI for various income ranges: 3.8% for AGIs $10k-25k, 1.9% for AGIs $25k-50k, 1.7% for AGIs $50k-75k, 1.6% for AGIs $75k-100k, 1.8% for AGIs over 100k)
Taxable dividends: $3,727 (reported on 37.5% of returns)
Here:
$3,727
State:
$4,746
(% of AGI for various income ranges: 3.0% for AGIs $10k-25k, 1.4% for AGIs $25k-50k, 1.5% for AGIs $50k-75k, 1.1% for AGIs $75k-100k, 1.7% for AGIs over 100k)
Net capital gain/loss: +$23,250 (reported on 33.6% of returns)
Here:
+$23,250
State:
+$23,418
(% of AGI for various income ranges: -0.1% for AGIs $10k-25k, 0.4% for AGIs $25k-50k, 0.8% for AGIs $50k-75k, 1.2% for AGIs $75k-100k, 14.0% for AGIs over 100k)
Profit/loss from business: +$20,985 (reported on 22.6% of returns)
Here:
+$20,985
State:
+$16,826
(% of AGI for various income ranges: 13.0% for AGIs $10k-25k, 7.0% for AGIs $25k-50k, 4.6% for AGIs $50k-75k, 5.7% for AGIs $75k-100k, 5.2% for AGIs over 100k)
IRA payment deduction: $3,242 (reported on 4.0% of returns)
90277:
$3,242
California:
$3,192
(% of AGI for various income ranges: 0.4% for AGIs $10k-25k, 0.3% for AGIs $25k-50k, 0.2% for AGIs $50k-75k, 0.2% for AGIs $75k-100k, 0.1% for AGIs over 100k)
Self-employed pension: $16,479 (reported on 3.1% of returns)
Here:
$16,479
California:
$17,688
(% of AGI for various income ranges: 0.3% for AGIs $10k-25k, 0.4% for AGIs $25k-50k, 0.4% for AGIs $50k-75k, 0.5% for AGIs $75k-100k, 0.7% for AGIs over 100k)
Total itemized deductions: $30,037 (22% of AGI, reported on 51.7% of returns)
Here:
$30,037
State:
$28,113
Here:
22.3% of AGI
State:
25.3% of AGI
(% of AGI for various income ranges: 18.9% for AGIs $10k-25k, 16.3% for AGIs $25k-50k, 17.3% for AGIs $50k-75k, 21.2% for AGIs $75k-100k, 18.0% for AGIs over 100k)
Charity contributions deductions: $3,253 (2% of AGI, reported on 46.7% of returns)
Here:
$3,253
State:
$3,923
Here:
2.3% of AGI
State:
3.3% of AGI
(% of AGI for various income ranges: 1.6% for AGIs $10k-25k, 1.8% for AGIs $25k-50k, 1.8% for AGIs $50k-75k, 2.0% for AGIs $75k-100k, 1.7% for AGIs over 100k)
Total tax: $15,746 (reported on 87.4% of returns)
90277:
$15,746
State:
$10,761
(% of AGI for various income ranges: 6.3% for AGIs $10k-25k, 9.4% for AGIs $25k-50k, 12.1% for AGIs $50k-75k, 12.7% for AGIs $75k-100k, 19.1% for AGIs over 100k)
Earned income credit: $1,053 (reported on 5.7% of returns)
Here:
$1,053
State:
$1,763
Percentage of individuals using paid preparers for their 2004 taxes: 65.4%
Here:
65%
State:
66%
(% for various income ranges: 59.7% for AGIs below $10k, 63.2% for AGIs $10k-25k, 62.2% for AGIs $25k-50k, 64.1% for AGIs $50k-75k, 67.0% for AGIs $75k-100k, 73.4% for AGIs over 100k)
Likely homosexual households (counted as self-reported same-sex unmarried-partner households)
Lesbian couples: 0.2% of all households
Gay men: 0.3% of all households
Household received Food Stamps/SNAP in the past 12 months: 562 Household did not receive Food Stamps/SNAP in the past 12 months: 15,925
Women who had a birth in the past 12 months: 286 (257 now married, 28 unmarried) Women who did not have a birth in the past 12 months: 7,352 (3,429 now married, 3,902 unmarried)
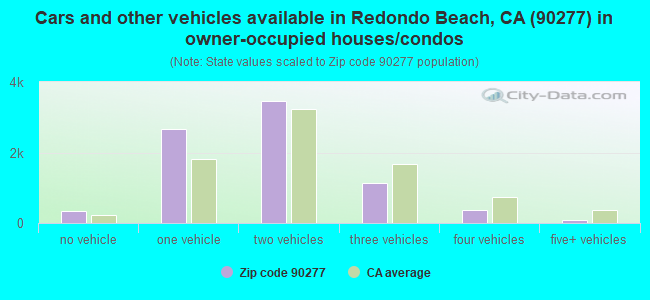
Housing units in zip code 90277 with a mortgage: 5,333 (682 second mortgage, 22 home equity loan, 610 both second mortgage and home equity loan) Houses without a mortgage: 29
Median monthly owner costs for units with a mortgage: $3,876 Median monthly owner costs for units without a mortgage: $1,077
Residents with income below the poverty level in 2022:
This zip code:
5.7%
Whole state:
12.2%
Residents with income below 50% of the poverty level in 2022:
This zip code:
2.0%
Whole state:
6.2%
Median number of rooms in houses and condos:
Here:
5.9
State:
6.0
Median number of rooms in apartments:
Here:
3.8
State:
3.9
Notable locations in this zip code not listed on our city pages
Notable locations in zip code 90277: King Harbor (A), Redondo Beach Municipal Pier (B), Monstad Pier (C), King Harbor Marina (D), Redondo Beach Public Library (E), Redondo Beach City Hall (F), El Retiro Branch Torrance Public Library (G), Redondo Beach Fire Department Station 1 Headquarters (H), Redondo Generating Station (I). Display/hide their locations on the map
Churches in zip code 90277 include: Berean Tabernacle (A), Christ Episcopal Church (B), First Baptist Church (C), First Church of Christ Scientist (D), First Congregational Church (E), First United Methodist Church (F), Seventh Day Adventist Church (G), South Bay Christian Church (H), Riviera Methodist Church (I). Display/hide their locations on the map
Parks in zip code 90277 include: Redondo Beach (1), Sea Hawk Stadium (2), Miramar Park (3), Veterans Park (4), F E Hopkins Wilderness Park (5), Alta Vista Park (6), El Retiro Park (7), Vincent Park (8), Redondo Beach Original Townsite Historic District (9). Display/hide their locations on the map
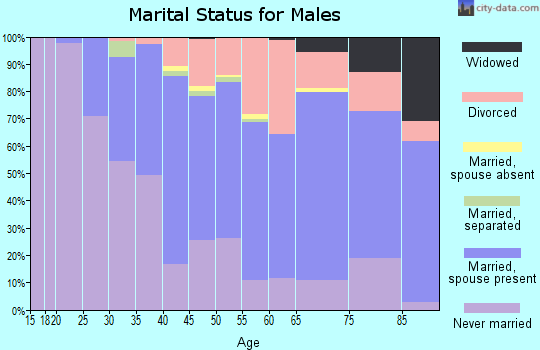
5,675 married couples with children.
813 single-parent households (329 men, 484 women).
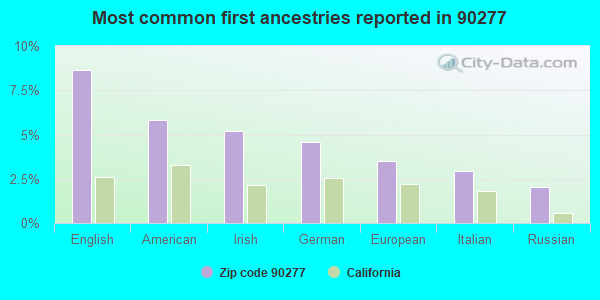
74.4% of residents of 90277 zip code speak English at home.
8.9% of residents speak Spanish at home (72% very well, 18% well, 10% not well).
8.0% of residents speak other Indo-European language at home (78% very well, 8% well, 13% not well, 1% not at all).
8.0% of residents speak Asian or Pacific Island language at home (55% very well, 29% well, 12% not well, 4% not at all).
0.8% of residents speak other language at home (69% very well, 28% well, 3% not well).
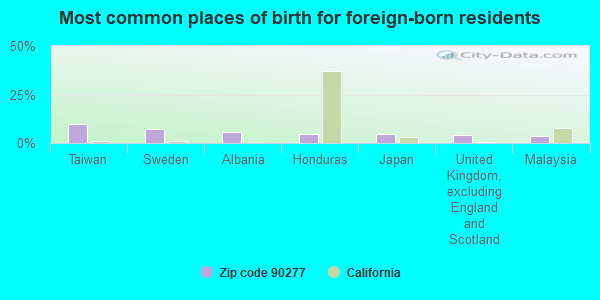
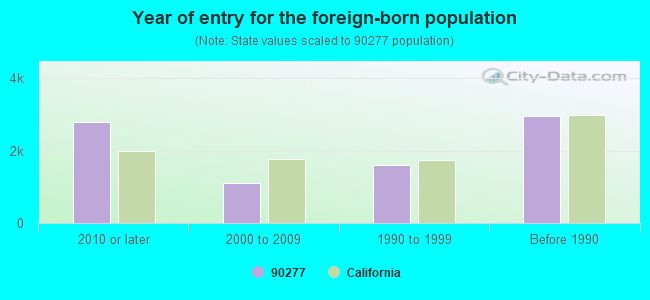
Foreign born population: 7,870 (21.8%) (62.5% of them are naturalized citizens)
Major facilities with environmental interests located in this zip code:
FIRESTONE STORE #2766 (500 N PACIFIC COAST HWY in REDONDO BEACH, CA)
STATE MASTER (California - Hazardous Waste Tracking) - HAZARDOU WASTE PROGRAM Small Quantity Generators, between 100 kg and 1000 kg of hazardous waste/month (Resource Conservation and Recovery Act (tracking hazardous waste)) - notification STATE MASTER (California - Used Oil Recycling System ) - USED OIL RECYCLING, USED OIL PROGRAM Organizations: FIRESTONE TIRE CO (CONTACT/OWNER)
Alternative names: FIRESTONE STORE #67T4, FIRESTONE STORE #71C6
CHEVRON STATION NO 93777 (1630 S ELENA AVE in REDONDO BEACH, CA)
STATE MASTER (California - Hazardous Waste Tracking) - HAZARDOU WASTE PROGRAM HAZARDOUS WASTE BIENNIAL REPORTER (Resource Conservation and Recovery Act (tracking hazardous waste)) Large Quantity Generators, more that 1000 kg of hazardous waste/month (Resource Conservation and Recovery Act (tracking hazardous waste)) Small Quantity Generators, between 100 kg and 1000 kg of hazardous waste/month (Resource Conservation and Recovery Act (tracking hazardous waste)) - notification Organizations: CHEVRON PRODUCTS CO (CONTACT/OWNER)
Alternative names: CHEVRON NO 93777
H&H BODY SHOP (713 TORRANCE BLVD in REDONDO BEACH, CA)
STATE MASTER (California - Hazardous Waste Tracking) - HAZARDOU WASTE PROGRAM Small Quantity Generators, between 100 kg and 1000 kg of hazardous waste/month (Resource Conservation and Recovery Act (tracking hazardous waste)) Business NAICS classification: AUTOMOTIVE BODY, PAINT, AND INTERIOR REPAIR AND MAINTENANCE.
LAND ROVER SOUTH BAY (900 N PACIFIC COAST HWY in REDONDO BEACH, CA)
STATE MASTER (California - Hazardous Waste Tracking) - HAZARDOU WASTE PROGRAM Small Quantity Generators, between 100 kg and 1000 kg of hazardous waste/month (Resource Conservation and Recovery Act (tracking hazardous waste)) - notification Organizations: CARWELL L L C (CONTACT/OWNER)
CENTURY CLEANERS (223 PATOS VERDES BLVD in REDONDO BEACH, CA)
STATE MASTER (California - Hazardous Waste Tracking) - HAZARDOU WASTE PROGRAM Small Quantity Generators, between 100 kg and 1000 kg of hazardous waste/month (Resource Conservation and Recovery Act (tracking hazardous waste))
ALTA VISTA ELEMENTARY (815 KNOB HILL AVE. in REDONDO BEACH, CA)
(National Center for Education Statistics) - STATE ID-6022008 Organizations: REDONDO BEACH UNIFIED (SCHOOL DISTRICT)
MICROTRONICS INC (116 S CATALINA AVE in REDONDO BEACH, CA)
(Resource Conservation and Recovery Act (tracking hazardous waste)) Business NAICS classification: OTHER ELECTRONIC COMPONENT MANUFACTURING. Organizations: GERALD F HAMMEL (CONTACT/OWNER)
MG S CLEANERS (234 S PACIFIC COAST HWY in REDONDO BEACH, CA)
Small Quantity Generators, between 100 kg and 1000 kg of hazardous waste/month (Resource Conservation and Recovery Act (tracking hazardous waste)) - notification Organizations: ENK CLEANERS INC (CONTACT/OWNER)
NORTHROP CORP AIRCRAFT DIV (4030 FREEMAN BLVD in REDONDO BEACH, CA)
ACCESS CREATIVE COMMUNICATIONS (210 AVENUE I STE E in REDONDO BEACH, CA)
Small Quantity Generators, between 100 kg and 1000 kg of hazardous waste/month (Resource Conservation and Recovery Act (tracking hazardous waste)) - notification Organizations: WENDY LARSON (CONTACT/OWNER)
ADVANCED HEALING ARTS CENTER (210 AVE I STE C in REDONDO BEACH, CA)
Small Quantity Generators, between 100 kg and 1000 kg of hazardous waste/month (Resource Conservation and Recovery Act (tracking hazardous waste)) - notification Organizations: ADVANCED HEALING ARTS CTR (CONTACT/OWNER)
FRANK F GOETZ MD (1921 S CATALINA AVE in REDONDO BEACH, CA)
Small Quantity Generators, between 100 kg and 1000 kg of hazardous waste/month (Resource Conservation and Recovery Act (tracking hazardous waste)) - notification
HYTON CLEANERS (1550 S PACIFIC COAST HWY in REDONDO BEACH, CA)
Small Quantity Generators, between 100 kg and 1000 kg of hazardous waste/month (Resource Conservation and Recovery Act (tracking hazardous waste)) - notification Organizations: SCOTT PARK (CONTACT/OWNER)
Housing units lacking complete plumbing facilities: 0.2% Housing units lacking complete kitchen facilities: 2.8%
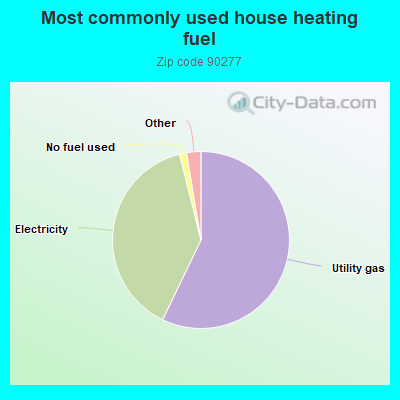
57.2%Utility gas
39.0%Electricity
1.3%No fuel used
0.9%Bottled, tank, or LP gas
0.7%Solar energy
Population in 1990: 33,102. Population change in the 1990s: +1,072 (+3.2%).
Place of birth for U.S.-born residents:
This state: 17,079
Northeast: 3,228
Midwest: 3,438
South: 2,259
West: 1,500
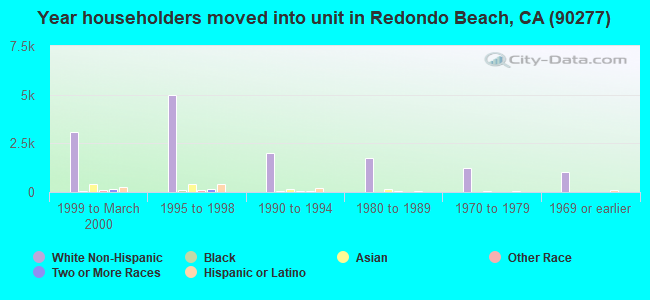
48% of the 90277 zip code residents lived in the same house 5 years ago. Out of people who lived in different houses, 67% lived in this county. Out of people who lived in different counties, 50% lived in California.
86% of the 90277 zip code residents lived in the same house 1 year ago. Out of people who lived in different houses, 60% moved from this county. Out of people who lived in different houses, 13% moved from different county within same state. Out of people who lived in different houses, 18% moved from different state. Out of people who lived in different houses, 8% moved from abroad.
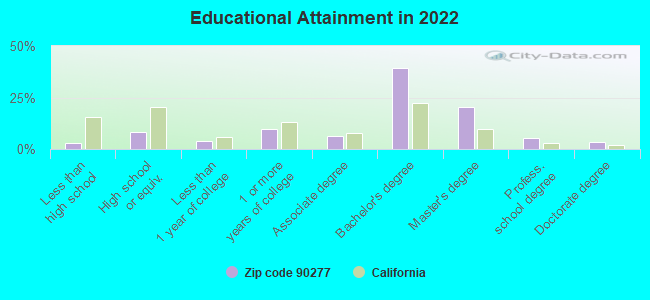
Private vs. public school enrollment:
Students in private schools in grades 1 to 8 (elementary and middle school): 326
Here:
11.5%
California:
10.5%
Students in private schools in grades 9 to 12 (high school): 198
Here:
11.1%
California:
8.5%
Students in private undergraduate colleges: 263
Here:
21.3%
California:
15.9%
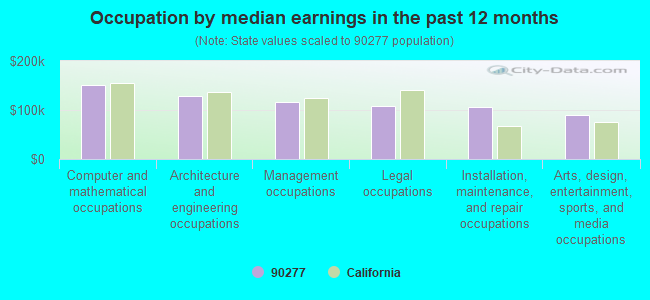
Occupation by median earnings in the past 12 months ($)
150,609Computer and mathematical occupations
127,714Architecture and engineering occupations
116,698Management occupations
108,768Legal occupations
105,990Installation, maintenance, and repair occupations
90,156Arts, design, entertainment, sports, and media occupations
Companies with biggest federal contracts located in this zip code (REDONDO BEACH, CA):
ADVANCED ARM DYNAMICS INC (123 W TORRANCE BLVD , STE; small business) : $33,266,209 in 115 contractsfrom 2003 to 2006
Contracts for Medical and Surgical Instruments, Equipment, and Supplies, Surgery Services, Education Services by Army Signed by year:2000: $0; 2001: $0; 2002: $0; 2003: $3,520,719; 2004: $12,126,840; 2005: $13,645,391; 2006: $3,973,259.
Biggest contracts:
$1,403,758 with Army for Medical and Surgical Instruments, Equipment, and Supplies. Taking place in DC. Signed on 2005-03-02. Completion date: 2005-02-25.
$992,242, same as above.Signed on 2005-10-21. Completion date: 2005-10-21.
$936,946 with Army for Medical and Surgical Instruments, Equipment, and Supplies. Signed on 2004-12-16. Completion date: 2004-11-18.
$917,691, same as above.Signed on 2004-06-01. Completion date: 2004-06-03.
REDONDO OPTICS (811 N CATALINA AVE, SUITE; small business) : $1,142,017 in 7 contractsfrom 2004 to 2006
Contracts for Other Research and Development -- Basic Research (R&D), Other Defense -- Basic Research (R&D), Other Defense -- Operational Systems Development (R&D) by Army, Air Force Signed by year:2000: $0; 2001: $0; 2002: $0; 2003: $0; 2004: $169,763; 2005: $518,629; 2006: $453,625.
Biggest contracts:
$428,625 with Army for Other Research and Development -- Basic Research (R&D). Signed on 2006-04-27. Completion date: 2007-04-24.
$399,795 with Army for Other Defense -- Basic Research (R&D). Signed on 2005-12-13. Completion date: 2007-12-13.
$99,897 with Air Force for Other Defense -- Operational Systems Development (R&D). Signed on 2004-05-18. Completion date: 2005-02-19.
$69,866 with Army for Other Defense -- Basic Research (R&D). Signed on 2004-12-17. Completion date: 2005-06-20.
FULL CIRCLE RESEARCH, INC (204 N IRENA AVE # A; small business) : $855,333 in 4 contractsfrom 2000 to 2005
$400,000 with Department of Defense for Other Defense -- Applied Research and Exploratory Development (R&D). Signed on 2002-09-19. Completion date: 2004-09-17.
$291,382, same as above.Signed on 2003-08-15. Completion date: 2004-09-17.
$99,796 with Army for Defense Missile and Space Systems -- Advanced Development (R&D). Signed on 2005-02-15. Completion date: 2005-08-15.
$64,155 with Department of Defense for Other Defense -- Applied Research and Exploratory Development (R&D). Signed on 2000-05-02. Completion date: 2000-10-29.
REAL LIFE NUTRITION, INC (518B NORTH IRENA AVENUE; small business) : $371,504 in 5 contractsfrom 2000 to 2005
Contracts for General Health Care Services, Nursing Services by Air Force Signed by year:2000: $75,025; 2001: $0; 2002: $79,513; 2003: $83,480; 2004: $88,486; 2005: $45,000; 2006: $0.
Biggest contracts:
$88,486 with Air Force for General Health Care Services. Signed on 2004-09-23. Completion date: 2004-09-24.
$83,480, same as above.Signed on 2003-09-02. Completion date: 2004-09-24.
$79,513, same as above.Signed on 2002-08-27. Completion date: 2003-09-24.
$75,025 with Air Force for Nursing Services. Signed on 2000-09-25. Completion date: 2001-09-24.
RALYNN EQUIPMENT CORP (693 THE VLG; small business)
$33,741 with Navy for Safety and Rescue Equipment. Signed on 1999-11-30. Completion date: 1999-12-17.
BRAND CENTRAL PROMOTIONS LLC (1223 AMETHYST ST APT A; small business) : $24,287 in 4 contractsfrom 2004 to 2006
$12,778 with Navy for Mini and Micro Computer Control Devices. Signed on 2006-02-09. Completion date: 2006-03-01.
$5,000 with Army for Office Supplies. Signed on 2005-07-07. Completion date: 2005-08-12.
$4,010 with Air Force for Books and Pamphlets. Signed on 2005-06-07. Completion date: 2005-06-24.
$2,499 with Public Buildings Service for Maintenance, Repair or Alteration of Real Property -- Office Buildings. Signed on 2004-10-08. Completion date: 2004-10-29.
EMERSON COMPANY (326 SOUTH PACIFIC COAST HI; small business) : $20,901 in 5 contractsin 2006
Contracts for Bolts, Nuts and Washers, Nails, Machine Keys, and Pins, Coil, Flat, Leaf, and Wire Springs by Defense Logistics Agency Signed by year:2000: $0; 2001: $0; 2002: $0; 2003: $0; 2004: $0; 2005: $0; 2006: $20,901.
Biggest contracts:
$7,420 with Defense Logistics Agency for Bolts. Signed on 2006-04-26. Completion date: 2006-10-24.
$4,041 with Defense Logistics Agency for Nuts and Washers. Signed on 2006-04-26. Completion date: 2006-08-29.
$4,030 with Defense Logistics Agency for Nails, Machine Keys, and Pins. Signed on 2006-04-19. Completion date: 2006-08-18.
$2,792 with Defense Logistics Agency for Coil, Flat, Leaf, and Wire Springs. Signed on 2006-06-08. Completion date: 2006-10-12.
ANGELA E OH (201 CALLE DE SIRENAS; small business) : $12,681 in 3 contractsfrom 2003 to 2005
$5,000 with NASA for . Signed on 2004-05-24. Completion date: 2004-07-07.
$5,000 with Equal Employment Opportunity Commission for Other Education and Training Services. Signed on 2003-12-02. Completion date: 2004-09-30.
$2,681 with Army for Educational Services. Signed on 2005-05-05. Completion date: 2005-05-12.
GONZALO GOMEZ (313 AVE H, UNIT B; small business) : $10,033 in 2 contractsin 2006
$7,238 with Defense Logistics Agency for Screws. Signed on 2006-04-06. Completion date: 2006-07-03.
$2,795 with Defense Logistics Agency for Vehicular Cab, Body, and Frame Structural Components. Signed on 2006-04-17. Completion date: 2006-07-16.
TENAYA SYSTEMS GROUP INC (545 AVENUE B; small business)
$3,935 with Navy for Relays and Solenoids. Signed on 2006-06-30. Completion date: 2006-08-11.
Top industries in this zip code by the number of employees in 2005:
Health Care and Social Assistance: Offices of Physicians (except Mental Health Specialists) (100-249: 1, 50-99: 1, 20-49: 2, 10-19: 6, 5-9: 11, 1-4: 37)
Accommodation and Food Services: Hotels (except Casino Hotels) and Motels (100-249: 2, 20-49: 3, 5-9: 1, 1-4: 2)
Professional, Scientific, and Technical Services: Administrative Management and General Management Consulting Services (250-499: 1, 5-9: 2, 1-4: 13)
2005 - 2018 National Fire Incident Reporting System (NFIRS) incidents
According to the data from the years 2005 - 2018 the average number of fires per year is 51. The highest number of fire incidents - 76 took place in 2013, and the least - 10 in 2006. The data has a rising trend.
When looking into fire subcategories, the most reports belonged to: Structure Fires (51.4%), and Outside Fires (30.0%).
Fire incident types reported to NFIRS in Zip Code 90277

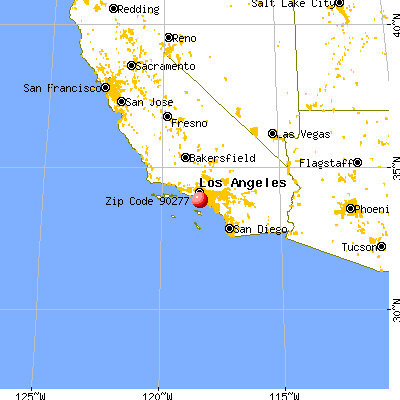


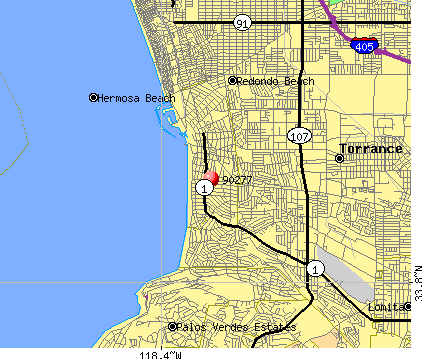 Nearest zip codes: 90503, 90254, 90505, 90278, 90274, 90266.


 According to the data from the years 2005 - 2018 the average number of fires per year is 51. The highest number of fire incidents - 76 took place in 2013, and the least - 10 in 2006. The data has a rising trend.
 When looking into fire subcategories, the most reports belonged to: Structure Fires (51.4%), and Outside Fires (30.0%).