Estimated zip code population in 2022: 19,388 Zip code population in 2010: 19,506 Zip code population in 2000: 18,682
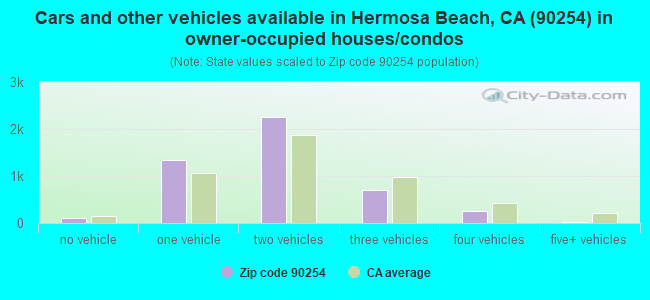
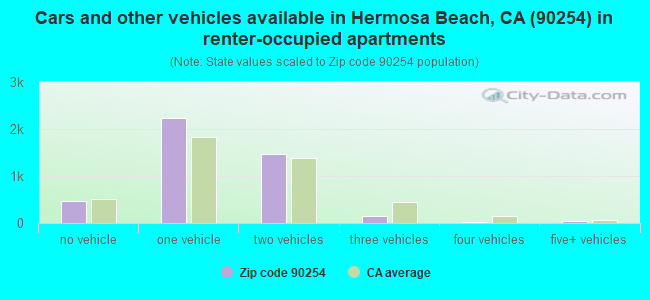
Houses and condos: 10,473 Renter-occupied apartments: 4,373
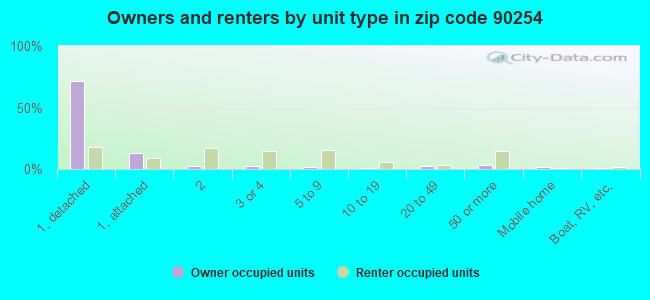
% of renters here:
48%
State:
44%
March 2022 cost of living index in zip code 90254: 144.9 (very high, U.S. average is 100)
Land area: 1.4 sq. mi. Water area: 0.6 sq. mi.
Population density: 13,582 people per square mile
(very high).
OSM Map
General Map
Google Map
MSN Map
OSM Map
General Map
Google Map
MSN Map
OSM Map
General Map
Google Map
MSN Map
OSM Map
General Map
Google Map
MSN Map
Please wait while loading the map...
Real estate property taxes paid for housing units in 2022:
This zip code:
0.5% ($10,292)
California:
0.7% ($4,831)
Median real estate property taxes paid for housing units with mortgages in 2022: $10,330 (0.5%) Median real estate property taxes paid for housing units with no mortgage in 2022: $4,652 (0.3%)
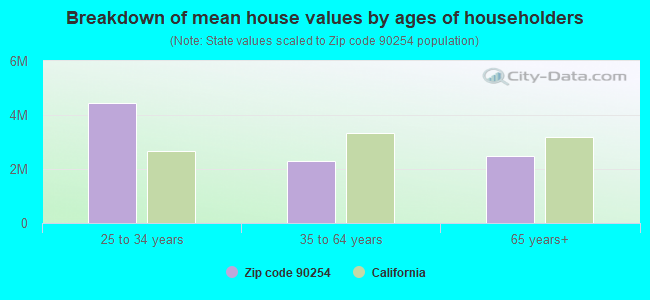
Estimated median house/condo value in 2022: $2,022,284
90254:
$2,022,284
California:
$715,900
According to our research of California and other state lists, there were 5 registered sex offenders living in 90254 zip code as of April 27, 2024. The ratio of all residents to sex offenders in zip code 90254 is 4,002 to 1. The ratio of registered sex offenders to all residents in this zip code is much lower than the state average.
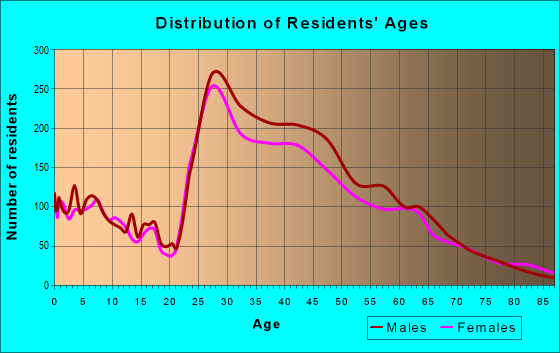
Median resident age:
This zip code:
40.8 years
California median age:
37.9 years
Average household size:
This zip code:
2.1 people
California:
2.8 people
Averages for the 2020 tax year for zip code 90254, filed in 2021:
Average Adjusted Gross Income (AGI) in 2020: $239,399 (Individual Income Tax Returns)
Here:
$239,399
State:
$95,910
Salary/wage: $170,259 (reported on 77.5% of returns)
Here:
$170,259
State:
$77,331
(% of AGI for various income ranges: 1178.6% for AGIs below $25k, 4106.2% for AGIs $25k-50k, 6982.6% for AGIs $50k-75k, 10778.7% for AGIs $75k-100k, 20926.5% for AGIs $100k-200k, 149734.5% for AGIs over 200k)
Taxable interest for individuals: $4,459 (reported on 52.0% of returns)
This zip code:
$4,459
California:
$2,294
(% of AGI for various income ranges: 67.1% for AGIs below $25k, 100.3% for AGIs $25k-50k, 81.0% for AGIs $50k-75k, 159.3% for AGIs $75k-100k, 227.8% for AGIs $100k-200k, 2870.8% for AGIs over 200k)
Ordinary dividends: $32,626 (reported on 47.6% of returns)
Here:
$32,626
State:
$10,949
(% of AGI for various income ranges: 130.5% for AGIs below $25k, 221.7% for AGIs $25k-50k, 186.3% for AGIs $50k-75k, 392.7% for AGIs $75k-100k, 630.6% for AGIs $100k-200k, 22859.5% for AGIs over 200k)
Net capital gain/loss in AGI: +$101,062 (reported on 45.9% of returns)
Here:
+$101,062
State:
+$49,306
(% of AGI for various income ranges: 81.5% for AGIs below $25k, 239.3% for AGIs $25k-50k, 179.9% for AGIs $50k-75k, 567.8% for AGIs $75k-100k, 904.1% for AGIs $100k-200k, 71985.2% for AGIs over 200k)
Profit/loss from business: +$31,515 (reported on 23.5% of returns)
Here:
+$31,515
State:
+$15,671
(% of AGI for various income ranges: 272.4% for AGIs below $25k, 617.2% for AGIs $25k-50k, 610.6% for AGIs $50k-75k, 722.2% for AGIs $75k-100k, 1099.5% for AGIs $100k-200k, 7421.5% for AGIs over 200k)
Taxable individual retirement arrangement distribution: $36,094 (reported on 9.5% of returns)
90254:
$36,094
California:
$23,505
(% of AGI for various income ranges: 97.2% for AGIs below $25k, 249.9% for AGIs $25k-50k, 288.6% for AGIs $50k-75k, 402.7% for AGIs $75k-100k, 797.8% for AGIs $100k-200k, 2949.7% for AGIs over 200k)
Self-employed (Keogh) retirement plans: $31,258 (reported on 3.4% of returns)
90254:
$31,258
California:
$30,163
(% of AGI for various income ranges: 61.8% for AGIs $50k-75k, 105.4% for AGIs $100k-200k, 1467.4% for AGIs over 200k)
Total itemized deductions: $58,442 (reported on 27.9% of returns)
Here:
$58,442
State:
$39,517
(% of AGI for various income ranges: 331.1% for AGIs below $25k, 543.9% for AGIs $25k-50k, 603.3% for AGIs $50k-75k, 938.2% for AGIs $75k-100k, 2008.1% for AGIs $100k-200k, 19981.8% for AGIs over 200k)
Charity contributions: $18,062 (reported on 24.8% of returns)
Here:
$18,062
State:
$12,598
(% of AGI for various income ranges: 17.1% for AGIs below $25k, 48.3% for AGIs $25k-50k, 57.6% for AGIs $50k-75k, 100.9% for AGIs $75k-100k, 263.7% for AGIs $100k-200k, 6501.1% for AGIs over 200k)
Taxes paid: $9,409 (reported on 27.9% of returns)
90254:
$9,409
State:
$8,807
(% of AGI for various income ranges: 60.7% for AGIs below $25k, 128.8% for AGIs $25k-50k, 155.1% for AGIs $50k-75k, 270.0% for AGIs $75k-100k, 574.4% for AGIs $100k-200k, 2518.2% for AGIs over 200k)
Earned income credit: $1,047 (reported on 4.1% of returns)
Here:
$1,047
State:
$2,074
(% of AGI for various income ranges: 34.1% for AGIs below $25k, 18.7% for AGIs $25k-50k)
Percentage of individuals using paid preparers for their 2020 taxes: 92.9%
Here:
93%
State:
92%
(% for various income ranges: 89.2% for AGIs below $25k, 92.2% for AGIs $25k-50k, 92.7% for AGIs $50k-75k, 93.0% for AGIs $75k-100k, 94.0% for AGIs $100k-200k, 95.0% for AGIs over 200k)
Averages for the 2012 tax year for zip code 90254, filed in 2013:
Average Adjusted Gross Income (AGI) in 2012: $142,090 (Individual Income Tax Returns)
Here:
$142,090
State:
$72,726
Salary/wage: $118,182 (reported on 81.2% of returns)
Here:
$118,182
State:
$59,079
(% of AGI for various income ranges: 65.0% for AGIs below $25k, 76.5% for AGIs $25k-50k, 79.4% for AGIs $50k-75k, 80.1% for AGIs $75k-100k, 77.1% for AGIs $100k-200k, 60.7% for AGIs over 200k)
Taxable interest for individuals: $3,062 (reported on 50.4% of returns)
This zip code:
$3,062
California:
$2,146
(% of AGI for various income ranges: 2.9% for AGIs below $25k, 1.0% for AGIs $25k-50k, 0.9% for AGIs $50k-75k, 0.9% for AGIs $75k-100k, 0.9% for AGIs $100k-200k, 1.2% for AGIs over 200k)
Ordinary dividends: $10,662 (reported on 38.1% of returns)
Here:
$10,662
State:
$9,308
(% of AGI for various income ranges: 5.2% for AGIs below $25k, 1.9% for AGIs $25k-50k, 1.6% for AGIs $50k-75k, 1.6% for AGIs $75k-100k, 1.8% for AGIs $100k-200k, 3.5% for AGIs over 200k)
Net capital gain/loss in AGI: +$26,683 (reported on 35.0% of returns)
Here:
+$26,683
State:
+$30,460
(% of AGI for various income ranges: 0.4% for AGIs $25k-50k, 0.6% for AGIs $50k-75k, 0.7% for AGIs $75k-100k, 1.3% for AGIs $100k-200k, 10.4% for AGIs over 200k)
Profit/loss from business: +$26,026 (reported on 23.4% of returns)
Here:
+$26,026
State:
+$17,064
(% of AGI for various income ranges: 19.2% for AGIs below $25k, 7.6% for AGIs $25k-50k, 6.0% for AGIs $50k-75k, 3.4% for AGIs $75k-100k, 4.2% for AGIs $100k-200k, 3.6% for AGIs over 200k)
Taxable individual retirement arrangement distribution: $24,967 (reported on 10.0% of returns)
90254:
$24,967
California:
$19,557
(% of AGI for various income ranges: 4.4% for AGIs below $25k, 2.9% for AGIs $25k-50k, 2.4% for AGIs $50k-75k, 2.7% for AGIs $75k-100k, 3.1% for AGIs $100k-200k, 0.9% for AGIs over 200k)
Self-employment retirement plans: $27,938 (reported on 3.0% of returns)
90254:
$27,938
California:
$24,530
(% of AGI for various income ranges: 0.5% for AGIs $25k-50k, 0.3% for AGIs $75k-100k, 0.4% for AGIs $100k-200k, 0.7% for AGIs over 200k)
Total itemized deductions: $43,513 (20% of AGI, reported on 56.5% of returns)
Here:
$43,513
State:
$34,004
Here:
19.9% of AGI
State:
22.7% of AGI
(% of AGI for various income ranges: 25.4% for AGIs below $25k, 15.1% for AGIs $25k-50k, 13.8% for AGIs $50k-75k, 15.6% for AGIs $75k-100k, 19.4% for AGIs $100k-200k, 17.1% for AGIs over 200k)
Charity contributions: $5,203 (reported on 47.8% of returns)
Here:
$5,203
State:
$4,659
(% of AGI for various income ranges: 1.1% for AGIs below $25k, 1.1% for AGIs $25k-50k, 1.1% for AGIs $50k-75k, 1.3% for AGIs $75k-100k, 1.5% for AGIs $100k-200k, 2.0% for AGIs over 200k)
Taxes paid: $22,016 (reported on 56.3% of returns)
90254:
$22,016
State:
$14,448
(% of AGI for various income ranges: 6.1% for AGIs below $25k, 3.2% for AGIs $25k-50k, 4.2% for AGIs $50k-75k, 6.4% for AGIs $75k-100k, 8.5% for AGIs $100k-200k, 10.1% for AGIs over 200k)
Earned income credit: $1,047 (reported on 5.4% of returns)
Here:
$1,047
State:
$2,286
(% of AGI for various income ranges: 1.9% for AGIs below $25k, 0.2% for AGIs $25k-50k)
Percentage of individuals using paid preparers for their 2012 taxes: 63.3%
Here:
63%
State:
64%
(% for various income ranges: 57.1% for AGIs below $25k, 54.5% for AGIs $25k-50k, 58.3% for AGIs $50k-75k, 59.7% for AGIs $75k-100k, 69.3% for AGIs $100k-200k, 80.1% for AGIs over 200k)
Averages for the 2004 tax year for zip code 90254, filed in 2005:
Average Adjusted Gross Income (AGI) in 2004: $103,307 (Individual Income Tax Returns)
Here:
$103,307
State:
$58,600
Salary/wage: $90,425 (reported on 83.0% of returns)
Here:
$90,425
State:
$49,455
(% of AGI for various income ranges: 71.4% for AGIs $10k-25k, 83.5% for AGIs $25k-50k, 84.6% for AGIs $50k-75k, 83.9% for AGIs $75k-100k, 67.2% for AGIs over 100k)
Taxable interest for individuals: $2,952 (reported on 57.8% of returns)
This zip code:
$2,952
California:
$2,365
(% of AGI for various income ranges: 3.2% for AGIs $10k-25k, 1.4% for AGIs $25k-50k, 1.2% for AGIs $50k-75k, 1.2% for AGIs $75k-100k, 1.7% for AGIs over 100k)
Taxable dividends: $7,184 (reported on 40.7% of returns)
Here:
$7,184
State:
$4,746
(% of AGI for various income ranges: 2.9% for AGIs $10k-25k, 1.3% for AGIs $25k-50k, 1.2% for AGIs $50k-75k, 1.2% for AGIs $75k-100k, 3.4% for AGIs over 100k)
Net capital gain/loss: +$17,162 (reported on 37.2% of returns)
Here:
+$17,162
State:
+$23,418
(% of AGI for various income ranges: -0.3% for AGIs $10k-25k, 0.6% for AGIs $25k-50k, 0.7% for AGIs $50k-75k, 1.1% for AGIs $75k-100k, 8.4% for AGIs over 100k)
Profit/loss from business: +$21,173 (reported on 22.7% of returns)
Here:
+$21,173
State:
+$16,826
(% of AGI for various income ranges: 13.0% for AGIs $10k-25k, 5.8% for AGIs $25k-50k, 4.1% for AGIs $50k-75k, 4.1% for AGIs $75k-100k, 4.4% for AGIs over 100k)
IRA payment deduction: $3,234 (reported on 4.0% of returns)
90254:
$3,234
California:
$3,192
(% of AGI for various income ranges: 0.6% for AGIs $10k-25k, 0.4% for AGIs $25k-50k, 0.2% for AGIs $50k-75k, 0.2% for AGIs $75k-100k, 0.1% for AGIs over 100k)
Self-employed pension: $19,465 (reported on 3.5% of returns)
Here:
$19,465
California:
$17,688
(% of AGI for various income ranges: 0.5% for AGIs $10k-25k, 0.3% for AGIs $25k-50k, 0.3% for AGIs $50k-75k, 0.2% for AGIs $75k-100k, 0.8% for AGIs over 100k)
Total itemized deductions: $33,488 (21% of AGI, reported on 55.4% of returns)
Here:
$33,488
State:
$28,113
Here:
20.8% of AGI
State:
25.3% of AGI
(% of AGI for various income ranges: 22.7% for AGIs $10k-25k, 15.7% for AGIs $25k-50k, 16.5% for AGIs $50k-75k, 21.2% for AGIs $75k-100k, 17.5% for AGIs over 100k)
Charity contributions deductions: $3,678 (2% of AGI, reported on 50.2% of returns)
Here:
$3,678
State:
$3,923
Here:
2.2% of AGI
State:
3.3% of AGI
(% of AGI for various income ranges: 1.5% for AGIs $10k-25k, 1.5% for AGIs $25k-50k, 1.7% for AGIs $50k-75k, 1.9% for AGIs $75k-100k, 1.8% for AGIs over 100k)
Total tax: $21,800 (reported on 89.4% of returns)
90254:
$21,800
State:
$10,761
(% of AGI for various income ranges: 6.7% for AGIs $10k-25k, 10.1% for AGIs $25k-50k, 13.2% for AGIs $50k-75k, 13.6% for AGIs $75k-100k, 21.5% for AGIs over 100k)
Earned income credit: $748 (reported on 3.9% of returns)
Here:
$748
State:
$1,763
Percentage of individuals using paid preparers for their 2004 taxes: 64.8%
Here:
65%
State:
66%
(% for various income ranges: 59.3% for AGIs below $10k, 60.6% for AGIs $10k-25k, 58.0% for AGIs $25k-50k, 61.0% for AGIs $50k-75k, 67.8% for AGIs $75k-100k, 76.0% for AGIs over 100k)
Likely homosexual households (counted as self-reported same-sex unmarried-partner households)
Lesbian couples: 0.1% of all households
Gay men: 0.0% of all households
Household received Food Stamps/SNAP in the past 12 months: 145 Household did not receive Food Stamps/SNAP in the past 12 months: 8,678
Women who had a birth in the past 12 months: 153 (83 now married, 71 unmarried) Women who did not have a birth in the past 12 months: 4,294 (1,781 now married, 2,510 unmarried)
Housing units in zip code 90254 with a mortgage: 3,312 (505 second mortgage, 30 home equity loan, 446 both second mortgage and home equity loan) Houses without a mortgage: 21
Median monthly owner costs for units with a mortgage: $3,876 Median monthly owner costs for units without a mortgage: $865
Residents with income below the poverty level in 2022:
This zip code:
5.8%
Whole state:
12.2%
Residents with income below 50% of the poverty level in 2022:
This zip code:
2.4%
Whole state:
6.2%
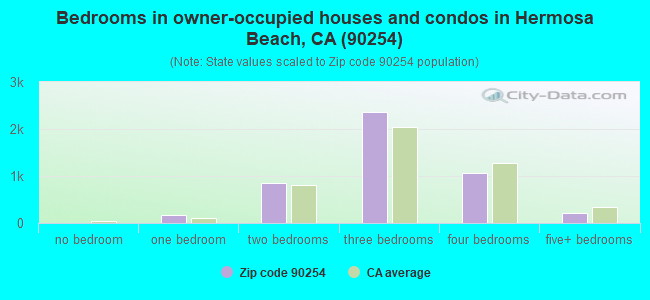
Median number of rooms in houses and condos:
Here:
5.9
State:
6.0
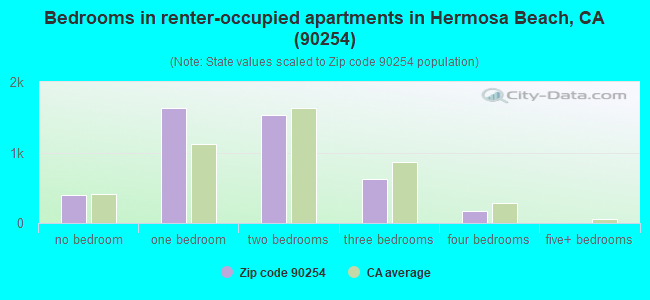
Median number of rooms in apartments:
Here:
3.5
State:
3.9
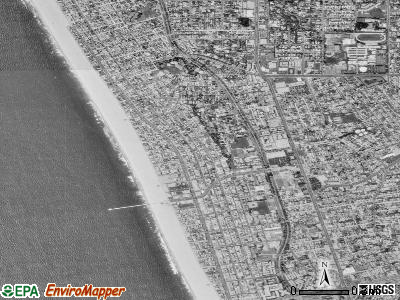
Notable locations in this zip code not listed on our city pages
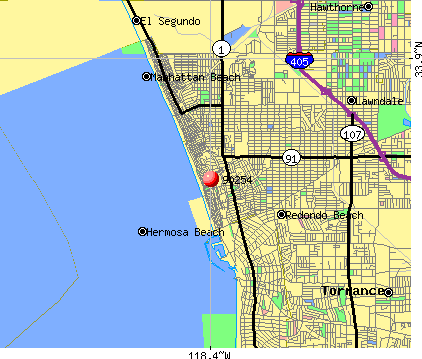
Notable locations in zip code 90254: Hermosa Beach Municipal Pier (A), Hermosa Beach Branch County of Los Angeles Public Library (B), Hermosa Beach City Hall (C), Hermosa Beach Fire Department (D). Display/hide their locations on the map
Churches in zip code 90254 include: Church of Christ (A), Church of the Nazarene (B), Community Baptist Church (C), First Church of Christ Scientist (D), Hermosa Gospel Tabernacle Assembly of God Church (E), Our Lady of Guadalupe Roman Catholic Church (F), Saint Cross Episcopal Church (G). Display/hide their locations on the map
2,721 married couples with children.
772 single-parent households (241 men, 531 women).
86.3% of residents of 90254 zip code speak English at home.
4.2% of residents speak Spanish at home (78% very well, 18% well, 4% not well).
5.8% of residents speak other Indo-European language at home (94% very well, 3% well, 3% not well).
2.5% of residents speak Asian or Pacific Island language at home (55% very well, 32% well, 13% not well).
0.7% of residents speak other language at home (100% very well).
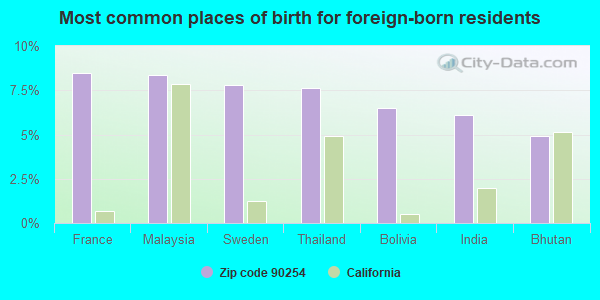
Foreign born population: 2,333 (12.0%) (67.6% of them are naturalized citizens)
This zip code:
12.0%
Whole state:
26.7%
8%France
8%Malaysia
8%Sweden
8%Thailand
6%Bolivia
6%India
5%Bhutan
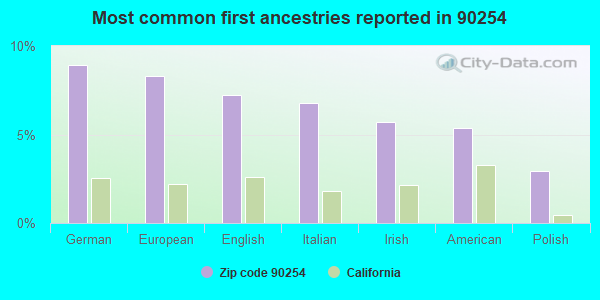
9%German
8%European
7%English
7%Italian
6%Irish
5%American
3%Polish
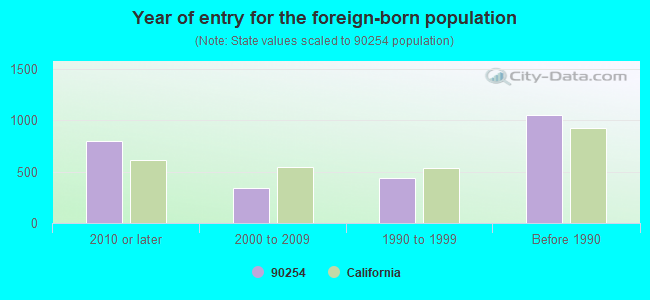
Year of entry for the foreign-born population
7962010 or later
3442000 to 2009
4341990 to 1999
1,053Before 1990
Facilities with environmental interests located in this zip code:
HERMOSA VALLEY ELEMENTARY (1645 VALLEY DR. in HERMOSA BEACH, CA)
(National Center for Education Statistics) - STATE ID-6095434 Organizations: HERMOSA BEACH CITY ELEMENTARY (SCHOOL DISTRICT)
HERMOSA VIEW ELEMENTARY (1800 PROSPECT AVE. in HERMOSA BEACH, CA)
(National Center for Education Statistics) - STATE ID-6014047 Organizations: HERMOSA BEACH CITY ELEMENTARY (SCHOOL DISTRICT)
EXXONMOBIL OIL CORP. (931 PACIFIC COAST HWY in HERMOSA BEACH, CA)
HAZARDOUS WASTE BIENNIAL REPORTER (Resource Conservation and Recovery Act (tracking hazardous waste)) Large Quantity Generators, more that 1000 kg of hazardous waste/month (Resource Conservation and Recovery Act (tracking hazardous waste)) Organizations: EXXONMOBIL OIL CORPORATION (CONTACT/OWNER)
A AND M TOWING AUTO REPAIR (421 PACIFIC COAST HWY in HERMOSA BEACH, CA)
(Resource Conservation and Recovery Act (tracking hazardous waste)) Business NAICS classification: ALL OTHER AUTOMOTIVE REPAIR AND MAINTENANCE. Organizations: ABBAS FATIGH JAMES CROSS (CONTACT/OWNER)
HERMOSA 1 HOUR PHOTO (1200 PAC COAST HWY in HERMOSA BEACH, CA)
Small Quantity Generators, between 100 kg and 1000 kg of hazardous waste/month (Resource Conservation and Recovery Act (tracking hazardous waste)) Organizations: CHANG JAMES (CONTACT/OWNER)
J R SPORTS CARS (555 PACIFIC COAST HWY in HERMOSA BEACH, CA)
Small Quantity Generators, between 100 kg and 1000 kg of hazardous waste/month (Resource Conservation and Recovery Act (tracking hazardous waste)) Organizations: JERRY SERKOSHIAN (CONTACT/OWNER)
MERCEDES BEST (700 PACIFIC COAST HWY in HERMOSA BEACH, CA)
Small Quantity Generators, between 100 kg and 1000 kg of hazardous waste/month (Resource Conservation and Recovery Act (tracking hazardous waste)) - notification Organizations: STEWART MAYO (CONTACT/OWNER)
ENGINEERING SUPPORT SERVICES (516 3RD ST in HERMOSA BEACH, CA)
Small Quantity Generators, between 100 kg and 1000 kg of hazardous waste/month (Resource Conservation and Recovery Act (tracking hazardous waste)) Business NAICS classification: ALL OTHER BUSINESS SUPPORT SERVICES.
HOPE CHAPEL ACADEMY (2420 PACIFIC COAST HWY in HERMOSA BEACH, CA)
COMPLIANCE ACTIVITY (Tracking inspections of insecticide, fungicide, and rodenticide, and toxic substances)
JO L DESIGN (717 VALLEY DR UNIT A1 in HERMOSA BEACH, CA)
Small Quantity Generators, between 100 kg and 1000 kg of hazardous waste/month (Resource Conservation and Recovery Act (tracking hazardous waste)) - notification Organizations: JOEL ANDRYKOWSKI (CONTACT/OWNER)
ALLIANCE ENVIRONMENTAL GROUP (20 17TH STREET in HERMOSA BEACH, CA)
COMPLIANCE ACTIVITY (Tracking inspections of insecticide, fungicide, and rodenticide, and toxic substances) Alternative names: ALLIANE ENVIRONMENTAL GROUP
INTERNATIONAL BILINGUAL SCHOOL (425 VALLEY DR in HERMOSA BEACH, CA)
COMPLIANCE ACTIVITY (Tracking inspections of insecticide, fungicide, and rodenticide, and toxic substances)
Housing units lacking complete plumbing facilities: 0.4% Housing units lacking complete kitchen facilities: 4.0%
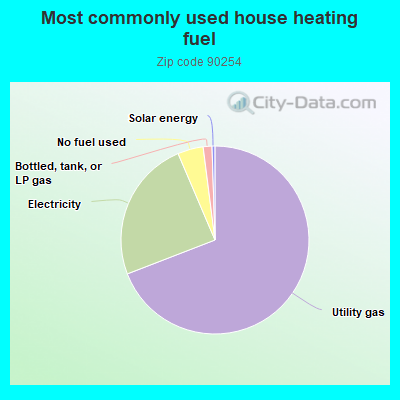
69.0%Utility gas
24.4%Electricity
4.4%No fuel used
1.5%Bottled, tank, or LP gas
0.5%Solar energy
Population in 1990: 18,289. Population change in the 1990s: +393 (+2.1%).
Place of birth for U.S.-born residents:
This state: 9,532
Northeast: 2,361
Midwest: 2,606
South: 1,411
West: 707
43% of the 90254 zip code residents lived in the same house 5 years ago. Out of people who lived in different houses, 57% lived in this county. Out of people who lived in different counties, 50% lived in California.
86% of the 90254 zip code residents lived in the same house 1 year ago. Out of people who lived in different houses, 55% moved from this county. Out of people who lived in different houses, 17% moved from different county within same state. Out of people who lived in different houses, 23% moved from different state. Out of people who lived in different houses, 3% moved from abroad.
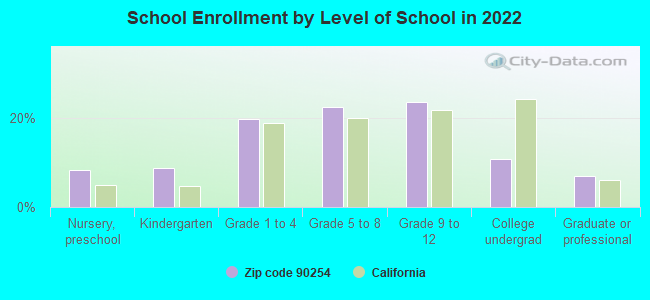
Private vs. public school enrollment:
Students in private schools in grades 1 to 8 (elementary and middle school): 249
Here:
16.5%
California:
10.5%
Students in private schools in grades 9 to 12 (high school): 141
Here:
16.7%
California:
8.5%
Students in private undergraduate colleges: 39
Here:
10.2%
California:
15.9%
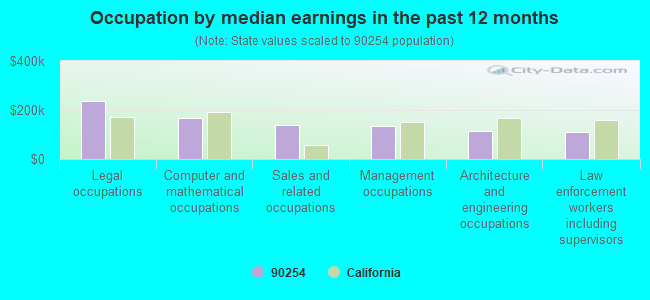
Occupation by median earnings in the past 12 months ($)
237,352Legal occupations
166,076Computer and mathematical occupations
138,401Sales and related occupations
133,083Management occupations
113,523Architecture and engineering occupations
110,650Law enforcement workers including supervisors
Companies with federal contracts located in this zip code (HERMOSA BEACH, CA):
BEAVENS SYSTEMS INCORPORATED (2200 PACIFIC COAST HIGHWAY; small business) : $147,486 in 13 contractsfrom 2001 to 2006
Contracts for Maintenance, Repair and Rebuilding of Equipment -- Automatic Data Processing Equipment (Including Firmware), Software, Supplies and Support Equipment, Maintenance, Repair and Rebuilding of Equipment -- Miscellaneous by Navy Signed by year:2000: $0; 2001: $3,640; 2002: $21,875; 2003: $21,875; 2004: $44,460; 2005: $37,546; 2006: $18,090.
Biggest contracts:
$22,585 with Navy for Maintenance, Repair and Rebuilding of Equipment -- Automatic Data Processing Equipment (Including Firmware), Software, Supplies and Support Equipment. Taking place in HI. Signed on 2004-02-25. Completion date: 2004-06-18.
$21,875, same as above.Signed on 2004-02-25. Completion date: 2005-02-25.
$21,875, same as above.Signed on 2003-02-25. Completion date: 2003-02-25.
$21,875, same as above.Signed on 2002-02-20. Completion date: 2005-02-25.
STEAM MACHINES, INCORPORATED (620 CYPRESS AVENUE; small business) : $146,690 in 2 contractsfrom 2001 to 2002
$91,085 with Navy for Marine Lifesaving and Diving Equipment. Signed on 2002-03-14. Completion date: 2002-07-15.
$55,605 with Navy for Equipment and Materials Testing -- Miscellaneous. Signed on 2001-09-26. Completion date: 2002-02-28.
HYSIGNAL INCORPORATED (2309 PACIFIC COAST HWY.; small business)
$94,203 with Army for Other Defense -- Applied Research and Exploratory Development (R&D). Signed on 2000-04-20. Completion date: 2000-12-07.
BENNETT SUPPLY COMPANY (679 VALLEY DR; small business) : $71,090 in 2 contractsfrom 2000 to 2005
$59,290 with Navy for Marine Lifesaving and Diving Equipment. Signed on 2000-06-01. Completion date: 2000-10-30.
$11,800 with Navy for Waste Disposal Equipment. Signed on 2005-12-08. Completion date: 2006-03-08.
ACCORDENT TECHNOLOGIES INC (1221 HERMOSA AVE 2ND FL; small business) : $23,966 in 3 contractsin 2005
$17,966 with Army for ADP Software. Taking place in AZ. Signed on 2005-08-08. Completion date: 2005-09-04.
$3,000 with Army for ADP Software. Signed on 2005-03-22. Completion date: 2006-03-21.
$3,000 with U.S. Army Corps of Engineers - civil program financing only for ADP Software. Signed on 2005-03-22. Completion date: 2006-03-21.
DOG BROTHERS INC (703 PIER AVE STE 664; small business)
$5,750 with Army for Other Education and Training Services. Taking place in KY. Signed on 2004-02-09. Completion date: 2004-02-09.
Top industries in this zip code by the number of employees in 2005:
Administrative and Support and Waste Management and Remediation Services: Temporary Help Services (250-499: 1, 100-249: 1, 50-99: 1, 10-19: 2, 5-9: 1, 1-4: 1)
2002 - 2018 National Fire Incident Reporting System (NFIRS) incidents
According to the data from the years 2002 - 2018 the average number of fire incidents per year is 37. The highest number of fire incidents - 67 took place in 2008, and the least - 0 in 2003. The data has a rising trend.
When looking into fire subcategories, the most incidents belonged to: Structure Fires (62.2%), and Outside Fires (25.4%).
Fire incident types reported to NFIRS in Zip Code 90254


 Nearest zip codes: 90266, 90278, 90277, 90503, 90245, 90260.
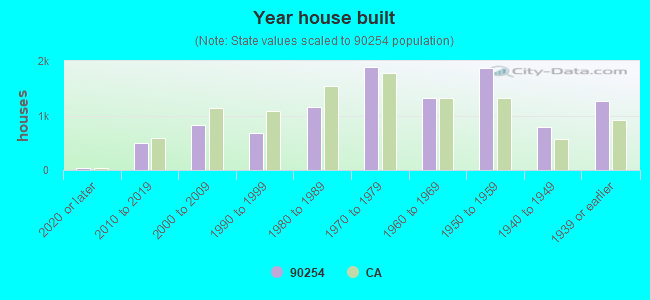


 According to the data from the years 2002 - 2018 the average number of fire incidents per year is 37. The highest number of fire incidents - 67 took place in 2008, and the least - 0 in 2003. The data has a rising trend.
 When looking into fire subcategories, the most incidents belonged to: Structure Fires (62.2%), and Outside Fires (25.4%).