Estimated zip code population in 2022: 35,913 Zip code population in 2010: 36,678 Zip code population in 2000: 34,855
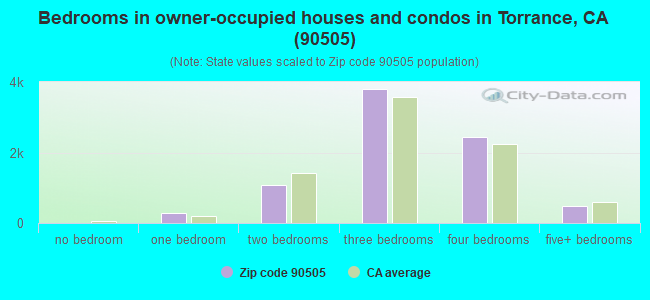
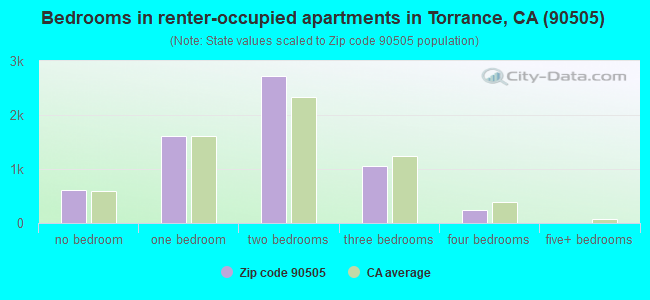
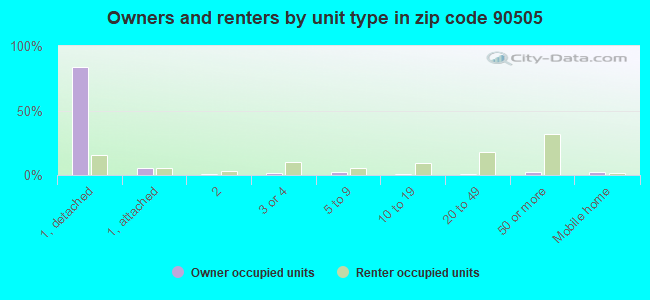
Houses and condos: 15,576 Renter-occupied apartments: 6,264
% of renters here:
44%
State:
44%
March 2022 cost of living index in zip code 90505: 139.4 (high, U.S. average is 100)
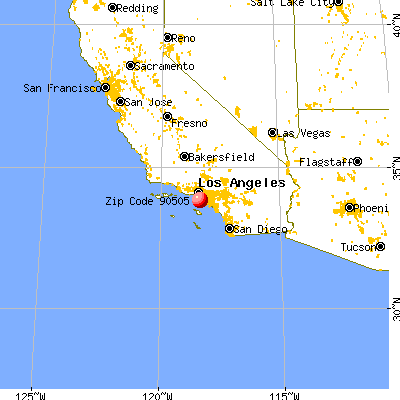
Land area: 5.8 sq. mi. Water area: 0.0 sq. mi.
Population density: 6,198 people per square mile
(high).
OSM Map
General Map
Google Map
MSN Map
OSM Map
General Map
Google Map
MSN Map
OSM Map
General Map
Google Map
MSN Map
OSM Map
General Map
Google Map
MSN Map
Please wait while loading the map...
Real estate property taxes paid for housing units in 2022:
This zip code:
0.6% ($6,806)
California:
0.7% ($4,831)
Median real estate property taxes paid for housing units with mortgages in 2022: $7,936 (0.7%) Median real estate property taxes paid for housing units with no mortgage in 2022: $4,753 (0.4%)
Estimated median house/condo value in 2022: $1,189,004
90505:
$1,189,004
California:
$715,900
According to our research of California and other state lists, there were 10 registered sex offenders living in 90505 zip code as of April 27, 2024. The ratio of all residents to sex offenders in zip code 90505 is 3,778 to 1. The ratio of registered sex offenders to all residents in this zip code is much lower than the state average.
Median resident age:
This zip code:
44.7 years
California median age:
37.9 years
Average household size:
This zip code:
2.5 people
California:
2.8 people
Averages for the 2020 tax year for zip code 90505, filed in 2021:
Average Adjusted Gross Income (AGI) in 2020: $117,294 (Individual Income Tax Returns)
Here:
$117,294
State:
$95,910
Salary/wage: $96,550 (reported on 74.4% of returns)
Here:
$96,550
State:
$77,331
(% of AGI for various income ranges: 1103.8% for AGIs below $25k, 3722.8% for AGIs $25k-50k, 7171.4% for AGIs $50k-75k, 10269.8% for AGIs $75k-100k, 20275.0% for AGIs $100k-200k, 82391.1% for AGIs over 200k)
Taxable interest for individuals: $2,253 (reported on 49.4% of returns)
This zip code:
$2,253
California:
$2,294
(% of AGI for various income ranges: 46.8% for AGIs below $25k, 78.1% for AGIs $25k-50k, 99.9% for AGIs $50k-75k, 170.6% for AGIs $75k-100k, 300.7% for AGIs $100k-200k, 1167.7% for AGIs over 200k)
Ordinary dividends: $9,114 (reported on 35.8% of returns)
Here:
$9,114
State:
$10,949
(% of AGI for various income ranges: 65.4% for AGIs below $25k, 109.1% for AGIs $25k-50k, 187.7% for AGIs $50k-75k, 286.7% for AGIs $75k-100k, 623.2% for AGIs $100k-200k, 5131.1% for AGIs over 200k)
Net capital gain/loss in AGI: +$22,391 (reported on 33.8% of returns)
Here:
+$22,391
State:
+$49,306
(% of AGI for various income ranges: 26.0% for AGIs below $25k, 77.8% for AGIs $25k-50k, 195.1% for AGIs $50k-75k, 295.3% for AGIs $75k-100k, 853.5% for AGIs $100k-200k, 15234.5% for AGIs over 200k)
Profit/loss from business: +$16,852 (reported on 20.3% of returns)
Here:
+$16,852
State:
+$15,671
(% of AGI for various income ranges: 203.8% for AGIs below $25k, 336.4% for AGIs $25k-50k, 400.4% for AGIs $50k-75k, 589.2% for AGIs $75k-100k, 834.2% for AGIs $100k-200k, 3095.1% for AGIs over 200k)
Taxable individual retirement arrangement distribution: $27,910 (reported on 12.2% of returns)
90505:
$27,910
California:
$23,505
(% of AGI for various income ranges: 81.8% for AGIs below $25k, 164.4% for AGIs $25k-50k, 370.4% for AGIs $50k-75k, 643.9% for AGIs $75k-100k, 1164.8% for AGIs $100k-200k, 3015.1% for AGIs over 200k)
Self-employed (Keogh) retirement plans: $25,952 (reported on 1.3% of returns)
90505:
$25,952
California:
$30,163
(% of AGI for various income ranges: 6.6% for AGIs below $25k, 28.2% for AGIs $50k-75k, 72.4% for AGIs $100k-200k, 547.2% for AGIs over 200k)
Total itemized deductions: $38,088 (reported on 22.2% of returns)
Here:
$38,088
State:
$39,517
(% of AGI for various income ranges: 161.1% for AGIs below $25k, 391.8% for AGIs $25k-50k, 738.3% for AGIs $50k-75k, 1141.8% for AGIs $75k-100k, 2661.8% for AGIs $100k-200k, 9287.7% for AGIs over 200k)
Charity contributions: $8,587 (reported on 19.0% of returns)
Here:
$8,587
State:
$12,598
(% of AGI for various income ranges: 9.4% for AGIs below $25k, 25.5% for AGIs $25k-50k, 82.6% for AGIs $50k-75k, 140.5% for AGIs $75k-100k, 352.6% for AGIs $100k-200k, 2639.2% for AGIs over 200k)
Taxes paid: $9,090 (reported on 22.1% of returns)
90505:
$9,090
State:
$8,807
(% of AGI for various income ranges: 34.3% for AGIs below $25k, 78.5% for AGIs $25k-50k, 175.2% for AGIs $50k-75k, 289.5% for AGIs $75k-100k, 725.9% for AGIs $100k-200k, 2002.7% for AGIs over 200k)
Earned income credit: $1,535 (reported on 7.5% of returns)
Here:
$1,535
State:
$2,074
(% of AGI for various income ranges: 50.2% for AGIs below $25k, 44.1% for AGIs $25k-50k)
Percentage of individuals using paid preparers for their 2020 taxes: 92.0%
Here:
92%
State:
92%
(% for various income ranges: 89.6% for AGIs below $25k, 92.6% for AGIs $25k-50k, 93.2% for AGIs $50k-75k, 92.5% for AGIs $75k-100k, 92.5% for AGIs $100k-200k, 93.5% for AGIs over 200k)
Averages for the 2012 tax year for zip code 90505, filed in 2013:
Average Adjusted Gross Income (AGI) in 2012: $90,074 (Individual Income Tax Returns)
Here:
$90,074
State:
$72,726
Salary/wage: $78,216 (reported on 76.4% of returns)
Here:
$78,216
State:
$59,079
(% of AGI for various income ranges: 64.5% for AGIs below $25k, 69.7% for AGIs $25k-50k, 70.1% for AGIs $50k-75k, 69.6% for AGIs $75k-100k, 75.9% for AGIs $100k-200k, 55.9% for AGIs over 200k)
Taxable interest for individuals: $1,884 (reported on 49.9% of returns)
This zip code:
$1,884
California:
$2,146
(% of AGI for various income ranges: 2.5% for AGIs below $25k, 1.3% for AGIs $25k-50k, 1.2% for AGIs $50k-75k, 1.0% for AGIs $75k-100k, 0.8% for AGIs $100k-200k, 1.0% for AGIs over 200k)
Ordinary dividends: $6,754 (reported on 31.6% of returns)
Here:
$6,754
State:
$9,308
(% of AGI for various income ranges: 3.5% for AGIs below $25k, 1.8% for AGIs $25k-50k, 1.9% for AGIs $50k-75k, 1.8% for AGIs $75k-100k, 1.5% for AGIs $100k-200k, 3.3% for AGIs over 200k)
Net capital gain/loss in AGI: +$26,151 (reported on 25.5% of returns)
Here:
+$26,151
State:
+$30,460
(% of AGI for various income ranges: 0.7% for AGIs $50k-75k, 0.4% for AGIs $75k-100k, 1.1% for AGIs $100k-200k, 18.7% for AGIs over 200k)
Profit/loss from business: +$16,997 (reported on 20.0% of returns)
Here:
+$16,997
State:
+$17,064
(% of AGI for various income ranges: 14.8% for AGIs below $25k, 9.6% for AGIs $25k-50k, 4.5% for AGIs $50k-75k, 4.6% for AGIs $75k-100k, 3.6% for AGIs $100k-200k, 1.3% for AGIs over 200k)
Taxable individual retirement arrangement distribution: $20,831 (reported on 13.9% of returns)
90505:
$20,831
California:
$19,557
(% of AGI for various income ranges: 5.0% for AGIs below $25k, 4.0% for AGIs $25k-50k, 4.6% for AGIs $50k-75k, 4.7% for AGIs $75k-100k, 3.4% for AGIs $100k-200k, 2.0% for AGIs over 200k)
Self-employment retirement plans: $18,342 (reported on 1.4% of returns)
90505:
$18,342
California:
$24,530
(% of AGI for various income ranges: 0.3% for AGIs $25k-50k, 0.2% for AGIs $75k-100k, 0.3% for AGIs $100k-200k, 0.4% for AGIs over 200k)
Total itemized deductions: $33,568 (22% of AGI, reported on 45.8% of returns)
Here:
$33,568
State:
$34,004
Here:
22.0% of AGI
State:
22.7% of AGI
(% of AGI for various income ranges: 18.3% for AGIs below $25k, 13.7% for AGIs $25k-50k, 15.2% for AGIs $50k-75k, 17.5% for AGIs $75k-100k, 20.0% for AGIs $100k-200k, 15.5% for AGIs over 200k)
Charity contributions: $3,916 (reported on 39.5% of returns)
Here:
$3,916
State:
$4,659
(% of AGI for various income ranges: 0.9% for AGIs below $25k, 1.2% for AGIs $25k-50k, 1.5% for AGIs $50k-75k, 2.0% for AGIs $75k-100k, 2.0% for AGIs $100k-200k, 1.6% for AGIs over 200k)
Taxes paid: $14,073 (reported on 45.7% of returns)
90505:
$14,073
State:
$14,448
(% of AGI for various income ranges: 3.5% for AGIs below $25k, 3.3% for AGIs $25k-50k, 4.3% for AGIs $50k-75k, 5.8% for AGIs $75k-100k, 8.1% for AGIs $100k-200k, 8.5% for AGIs over 200k)
Earned income credit: $1,684 (reported on 9.9% of returns)
Here:
$1,684
State:
$2,286
(% of AGI for various income ranges: 3.6% for AGIs below $25k, 0.7% for AGIs $25k-50k)
Percentage of individuals using paid preparers for their 2012 taxes: 64.5%
Here:
64%
State:
64%
(% for various income ranges: 57.9% for AGIs below $25k, 64.4% for AGIs $25k-50k, 68.0% for AGIs $50k-75k, 66.5% for AGIs $75k-100k, 68.1% for AGIs $100k-200k, 70.8% for AGIs over 200k)
Averages for the 2004 tax year for zip code 90505, filed in 2005:
Average Adjusted Gross Income (AGI) in 2004: $66,780 (Individual Income Tax Returns)
Here:
$66,780
State:
$58,600
Salary/wage: $62,390 (reported on 76.0% of returns)
Here:
$62,390
State:
$49,455
(% of AGI for various income ranges: 60.4% for AGIs $10k-25k, 71.6% for AGIs $25k-50k, 71.0% for AGIs $50k-75k, 76.0% for AGIs $75k-100k, 68.4% for AGIs over 100k)
Taxable interest for individuals: $2,167 (reported on 62.1% of returns)
This zip code:
$2,167
California:
$2,365
(% of AGI for various income ranges: 4.4% for AGIs $10k-25k, 2.5% for AGIs $25k-50k, 1.9% for AGIs $50k-75k, 1.8% for AGIs $75k-100k, 1.6% for AGIs over 100k)
Taxable dividends: $3,113 (reported on 36.6% of returns)
Here:
$3,113
State:
$4,746
(% of AGI for various income ranges: 3.0% for AGIs $10k-25k, 1.7% for AGIs $25k-50k, 1.6% for AGIs $50k-75k, 1.3% for AGIs $75k-100k, 1.6% for AGIs over 100k)
Net capital gain/loss: +$12,261 (reported on 31.6% of returns)
Here:
+$12,261
State:
+$23,418
(% of AGI for various income ranges: 0.1% for AGIs $10k-25k, 0.6% for AGIs $25k-50k, 0.8% for AGIs $50k-75k, 1.2% for AGIs $75k-100k, 9.6% for AGIs over 100k)
Profit/loss from business: +$16,926 (reported on 20.6% of returns)
Here:
+$16,926
State:
+$16,826
(% of AGI for various income ranges: 12.4% for AGIs $10k-25k, 7.3% for AGIs $25k-50k, 5.4% for AGIs $50k-75k, 4.5% for AGIs $75k-100k, 4.3% for AGIs over 100k)
IRA payment deduction: $3,605 (reported on 4.3% of returns)
90505:
$3,605
California:
$3,192
(% of AGI for various income ranges: 0.3% for AGIs $10k-25k, 0.4% for AGIs $25k-50k, 0.3% for AGIs $50k-75k, 0.3% for AGIs $75k-100k, 0.1% for AGIs over 100k)
Self-employed pension: $13,198 (reported on 1.9% of returns)
Here:
$13,198
California:
$17,688
(% of AGI for various income ranges: 0.2% for AGIs $10k-25k, 0.2% for AGIs $25k-50k, 0.2% for AGIs $50k-75k, 0.3% for AGIs $75k-100k, 0.5% for AGIs over 100k)
Total itemized deductions: $27,415 (25% of AGI, reported on 46.7% of returns)
Here:
$27,415
State:
$28,113
Here:
25.0% of AGI
State:
25.3% of AGI
(% of AGI for various income ranges: 16.7% for AGIs $10k-25k, 15.9% for AGIs $25k-50k, 18.3% for AGIs $50k-75k, 21.4% for AGIs $75k-100k, 19.2% for AGIs over 100k)
Charity contributions deductions: $3,318 (3% of AGI, reported on 41.8% of returns)
Here:
$3,318
State:
$3,923
Here:
2.9% of AGI
State:
3.3% of AGI
(% of AGI for various income ranges: 1.3% for AGIs $10k-25k, 1.7% for AGIs $25k-50k, 2.1% for AGIs $50k-75k, 2.4% for AGIs $75k-100k, 2.1% for AGIs over 100k)
Total tax: $10,952 (reported on 83.1% of returns)
90505:
$10,952
State:
$10,761
(% of AGI for various income ranges: 5.4% for AGIs $10k-25k, 8.0% for AGIs $25k-50k, 10.1% for AGIs $50k-75k, 10.7% for AGIs $75k-100k, 16.8% for AGIs over 100k)
Earned income credit: $1,380 (reported on 7.3% of returns)
Here:
$1,380
State:
$1,763
Percentage of individuals using paid preparers for their 2004 taxes: 65.4%
Here:
65%
State:
66%
(% for various income ranges: 58.0% for AGIs below $10k, 65.4% for AGIs $10k-25k, 65.3% for AGIs $25k-50k, 68.7% for AGIs $50k-75k, 66.7% for AGIs $75k-100k, 68.4% for AGIs over 100k)
Likely homosexual households (counted as self-reported same-sex unmarried-partner households)
Lesbian couples: 0.1% of all households
Gay men: 0.0% of all households
Household received Food Stamps/SNAP in the past 12 months: 685 Household did not receive Food Stamps/SNAP in the past 12 months: 13,432
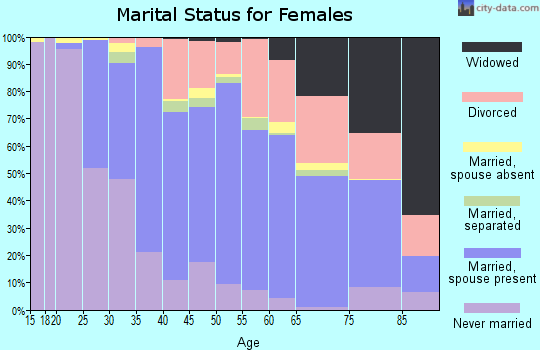
Women who had a birth in the past 12 months: 76 (76 now married, 0 unmarried) Women who did not have a birth in the past 12 months: 8,147 (3,853 now married, 4,268 unmarried)
Housing units in zip code 90505 with a mortgage: 5,118 (469 second mortgage, 448 both second mortgage and home equity loan) Houses without a mortgage: 137
Median monthly owner costs for units with a mortgage: $3,236 Median monthly owner costs for units without a mortgage: $820
Residents with income below the poverty level in 2022:
This zip code:
6.1%
Whole state:
12.2%
Residents with income below 50% of the poverty level in 2022:
This zip code:
3.2%
Whole state:
6.2%
Median number of rooms in houses and condos:
Here:
5.9
State:
6.0
Median number of rooms in apartments:
Here:
3.7
State:
3.9
Notable locations in this zip code not listed on our city pages
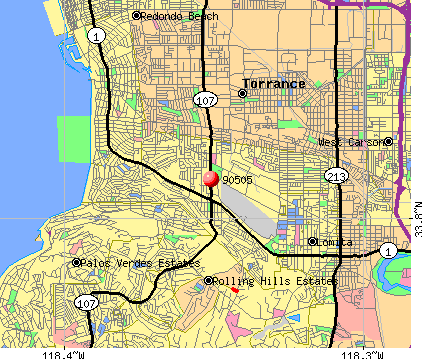
Notable locations in zip code 90505: Las Canchas Raquet Club (A), Walteria Branch Torrance Public Library (B), Torrance Fire Department Fire Station 4 (C), Torrance Fire Department Fire Station 2 (D). Display/hide their locations on the map
Shopping Centers: Rolling Hills Plaza Shopping Center (1), Pacific Plaza Shopping Center (2), Crossroads Shopping Center (3), Country Hills Shopping Center (4), Airport Plaza Shopping Center (5). Display/hide their locations on the map
Churches in zip code 90505 include: South Bay Oriental Mission Church (A), Walteria United Methodist Church (B), Christian United Methodist Church (C), Del Amo Southern Baptist Church (D), Seaside Community United Church (E). Display/hide their locations on the map
Parks in zip code 90505 include: Sea-Aire Park (1), Walteria Park (2), Alta Loma Park (3), De Portola Park (4), Hickory Park (5), Lago Seco Park (6), Los Arboles Park (7). Display/hide their locations on the map
In group quarters: 318 (-1 institutionalized population)
Size of family households: 4,027 2-persons, 2,307 3-persons, 2,234 4-persons, 765 5-persons, 115 6-persons, 62 7-or-more-persons
Size of nonfamily households: 4,068 1-person, 679 2-persons, 110 3-persons
6,592 married couples with children.
1,263 single-parent households (171 men, 1,092 women).
60.8% of residents of 90505 zip code speak English at home.
6.7% of residents speak Spanish at home (72% very well, 22% well, 5% not well, 1% not at all).
7.7% of residents speak other Indo-European language at home (63% very well, 30% well, 6% not well).
23.0% of residents speak Asian or Pacific Island language at home (45% very well, 38% well, 15% not well, 2% not at all).
2.0% of residents speak other language at home (65% very well, 27% well, 8% not well).
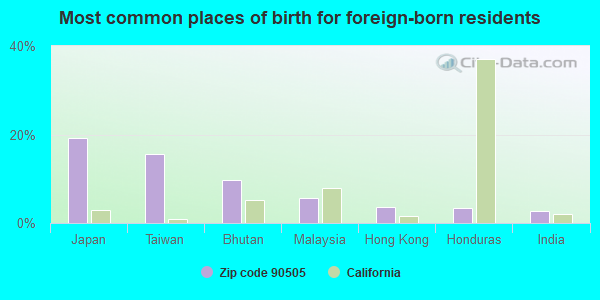
Foreign born population: 10,670 (29.7%) (62.0% of them are naturalized citizens)
Major facilities with environmental interests located in this zip code:
CHEVRON STATION 90826 (24505 HAWTHORNE BLVD in TORRANCE, CA)
STATE MASTER (California - Hazardous Waste Tracking) - HAZARDOU WASTE PROGRAM Small Quantity Generators, between 100 kg and 1000 kg of hazardous waste/month (Resource Conservation and Recovery Act (tracking hazardous waste)) - notification STATE MASTER (California - Used Oil Recycling System ) - USED OIL RECYCLING Organizations: CHEVRON PRODUCTS CO (CONTACT/OWNER)
Alternative names: HILLSIDE CHEVRON
MERCEDES-BENZ OF SOUTH BAY (3233 PACIFIC COAST HWY in TORRANCE, CA) . Federal Facility
STATE MASTER (California - Hazardous Waste Tracking) - HAZARDOU WASTE PROGRAM (Resource Conservation and Recovery Act (tracking hazardous waste)) Large Quantity Generators, more that 1000 kg of hazardous waste/month (Resource Conservation and Recovery Act (tracking hazardous waste)) - notification Organizations: AUTONATION INC (CONTACT/OWNER)
, BILL ATKINS (CONTACT/OWNER)
Alternative names: CARWELL LLC DBA SOUTH BAY AUTOHAUS, SOUTHBAY AUTOHAUS
GARRETT ENGINE BOOSTING SYSTEMS (3201 WEST LOMITA BOULEVARD in TORRANCE, CA)
AIR MAJOR (AIRS/AFS) SUPERFUND (Superfund database) STATE MASTER (California - Hazardous Waste Tracking) - HAZARDOU WASTE PROGRAM COMPLIANCE ACTIVITY (Tracking inspections of insecticide, fungicide, and rodenticide, and toxic substances) CRITERIA AND HAZARDOUS AIR POLLUTANT INVENTORY (Inventory of air pollution sources) HAZARDOUS WASTE BIENNIAL REPORTER (Resource Conservation and Recovery Act (tracking hazardous waste)) Small Quantity Generators, between 100 kg and 1000 kg of hazardous waste/month (Resource Conservation and Recovery Act (tracking hazardous waste)) - notification TRI REPORTER (Tracking of toxic chemicals releasing facilities) Business SIC classification: MOTOR VEHICLE PARTS AND ACCESSORIES; DEPARTMENT STORES Organizations: HONEYWELL INTERNATIONAL INC (CONTACT/OWNER)
Alternative names: ALLIED-SIGNAL, TURBOCHARGING SYS., GARRETT CORPORATION, AIR RESEARCH, GARRETT TUBOCHARGER DIVISION, GARRETT TURBOCHARGER DIVISION, HONEYWELL TURBO TECHNOLOGIES
BACHEM INCORPORATED (3132 KASHIWA ST. in TORRANCE, CA)
FORMAL ENFORCEMENT ACTION (Integrated Compliance Information System) - ICIS-09-2005-0170, ENFORCEMENT/COMPLIANCE ACTIVITY CRITERIA AND HAZARDOUS AIR POLLUTANT INVENTORY (Inventory of air pollution sources) HAZARDOUS WASTE BIENNIAL REPORTER (Resource Conservation and Recovery Act (tracking hazardous waste)) Large Quantity Generators, more that 1000 kg of hazardous waste/month (Resource Conservation and Recovery Act (tracking hazardous waste)) TRI REPORTER (Tracking of toxic chemicals releasing facilities) Business SIC classification: PHARMACEUTICAL PREPARATIONS Business NAICS classification: PHARMACEUTICAL PREPARATION MANUFACTURING.; PHARMACEUTICAL PREPARATION MANUFACTURING.
CHEVRON STATION NO 93280 (5230 SEPULVEDA BOULEVARD in TORRANCE, CA)
STATE MASTER (California - Hazardous Waste Tracking) - HAZARDOU WASTE PROGRAM Small Quantity Generators, between 100 kg and 1000 kg of hazardous waste/month (Resource Conservation and Recovery Act (tracking hazardous waste)) - notification Small Quantity Generators, between 100 kg and 1000 kg of hazardous waste/month (Resource Conservation and Recovery Act (tracking hazardous waste)) - notification Organizations: CHEVRON PRODUCTS CO (CONTACT/OWNER)
, JAE RO (CONTACT/OWNER)
Alternative names: JAES CHEVRON SERVICE
A-1 COAST RENTALS INCORPORATED (24000 CRENSHAW BOULEVARD in TORRANCE, CA)
STATE MASTER (California - Hazardous Waste Tracking) - HAZARDOU WASTE PROGRAM CRITERIA AND HAZARDOUS AIR POLLUTANT INVENTORY (Inventory of air pollution sources) Small Quantity Generators, between 100 kg and 1000 kg of hazardous waste/month (Resource Conservation and Recovery Act (tracking hazardous waste)) - notification Business SIC classification: EQUIPMENT RENTAL AND LEASING Organizations: BILLINGS ALLAN (CONTACT/OWNER)
ACURA OF SOUTH BAY (25341 CRENSHAW BLVD in TORRANCE, CA) . Federal Facility
STATE MASTER (California - Hazardous Waste Tracking) - HAZARDOU WASTE PROGRAM CRITERIA AND HAZARDOUS AIR POLLUTANT INVENTORY (Inventory of air pollution sources) Small Quantity Generators, between 100 kg and 1000 kg of hazardous waste/month (Resource Conservation and Recovery Act (tracking hazardous waste)) - notification Business SIC classification: MOTOR VEHICLE DEALERS (NEW AND USED) Organizations: PEYTON CRAMER ACURA (CONTACT/OWNER)
Alternative names: PEYTON CRAMER ACURA
GENERAL MOTORS ADVANCED TECH VEH (3050 LOMITA BLVD in TORRANCE, CA)
STATE MASTER (California - Hazardous Waste Tracking) - HAZARDOU WASTE PROGRAM HAZARDOUS WASTE BIENNIAL REPORTER (Resource Conservation and Recovery Act (tracking hazardous waste)) Large Quantity Generators, more that 1000 kg of hazardous waste/month (Resource Conservation and Recovery Act (tracking hazardous waste)) Business NAICS classification: OTHER MOTOR VEHICLE ELECTRICAL AND ELECTRONIC EQUIPMENT MANUFACTURING. Alternative names: GENERAL MOTORS ADV TECH VEHICLES
JANO INCORPORATED (3032 KASHIWA STREET in TORRANCE, CA)
STATE MASTER (California - Hazardous Waste Tracking) - HAZARDOU WASTE PROGRAM CRITERIA AND HAZARDOUS AIR POLLUTANT INVENTORY (Inventory of air pollution sources) Small Quantity Generators, between 100 kg and 1000 kg of hazardous waste/month (Resource Conservation and Recovery Act (tracking hazardous waste)) - notification Business SIC classification: TOP, BODY, AND UPHOLSTERY REPAIR SHOPS AND PAINT SHOPS Business NAICS classification: GENERAL AUTOMOTIVE REPAIR. Organizations: ROBERT TURNAGE (CONTACT/OWNER)
Alternative names: AUTOCRAFT OF TORRANCE
INDUSTRIAL DYNAMICS CO LTD (23661 TELO AVE in TORRANCE, CA)
STATE MASTER (California - Hazardous Waste Tracking) - HAZARDOU WASTE PROGRAM Small Quantity Generators, between 100 kg and 1000 kg of hazardous waste/month (Resource Conservation and Recovery Act (tracking hazardous waste)) - notification
FRENCH DECORATING (23644 SUSANA AVE in TORRANCE, CA)
STATE MASTER (California - Hazardous Waste Tracking) - HAZARDOU WASTE PROGRAM Small Quantity Generators, between 100 kg and 1000 kg of hazardous waste/month (Resource Conservation and Recovery Act (tracking hazardous waste)) - notification Organizations: DAVID AND JEANNINE SAUL J T (CONTACT/OWNER)
MARTIN CHEVROLET (23505 HAWTHORNE BLVD in TORRANCE, CA)
STATE MASTER (California - Hazardous Waste Tracking) - HAZARDOU WASTE PROGRAM Small Quantity Generators, between 100 kg and 1000 kg of hazardous waste/month (Resource Conservation and Recovery Act (tracking hazardous waste)) - notification Organizations: JOSEPH A GIACOMIN (CONTACT/OWNER)
A.J. RYNOLDS COMPANY, INC. (3435 W LOMITA BLVD in TORRANCE, CA)
(Integrated Compliance Information System) - ICIS-09-1998-0156, FORMAL ENFORCEMENT ACTION COMPLIANCE ACTIVITY (Tracking inspections of insecticide, fungicide, and rodenticide, and toxic substances) Alternative names: A J REYNOLDS COMPANY
Housing units lacking complete plumbing facilities: 0.7% Housing units lacking complete kitchen facilities: 4.1%
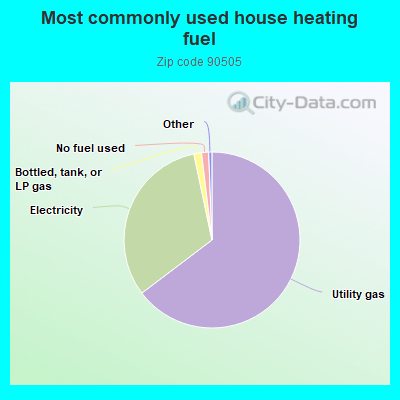
64.7%Utility gas
32.0%Electricity
1.4%Bottled, tank, or LP gas
1.3%No fuel used
Population in 1990: 33,933. Population change in the 1990s: +922 (+2.7%).
Place of birth for U.S.-born residents:
This state: 18,713
Northeast: 1,746
Midwest: 1,767
South: 1,058
West: 1,365
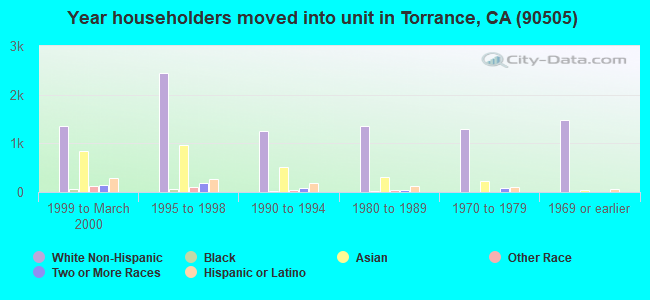
59% of the 90505 zip code residents lived in the same house 5 years ago. Out of people who lived in different houses, 81% lived in this county. Out of people who lived in different counties, 50% lived in California.
91% of the 90505 zip code residents lived in the same house 1 year ago. Out of people who lived in different houses, 71% moved from this county. Out of people who lived in different houses, 10% moved from different county within same state. Out of people who lived in different houses, 11% moved from different state. Out of people who lived in different houses, 7% moved from abroad.
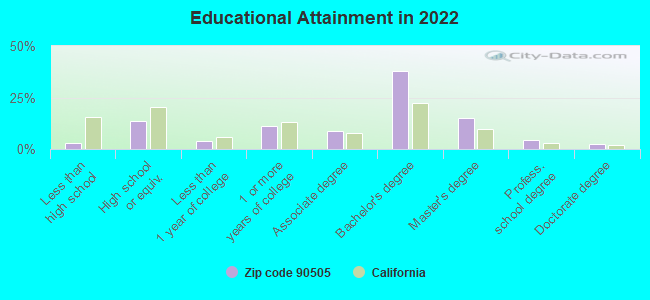
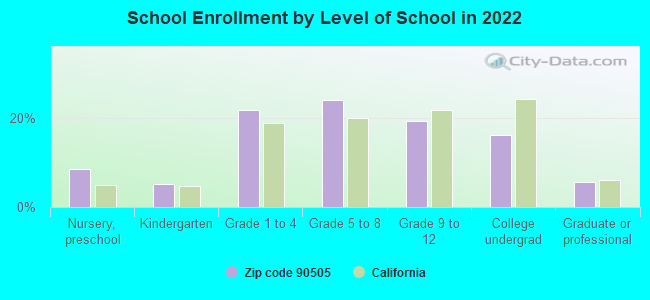
Private vs. public school enrollment:
Students in private schools in grades 1 to 8 (elementary and middle school): 514
Here:
11.8%
California:
10.5%
Students in private schools in grades 9 to 12 (high school): 112
Here:
6.1%
California:
8.5%
Students in private undergraduate colleges: 172
Here:
11.3%
California:
15.9%
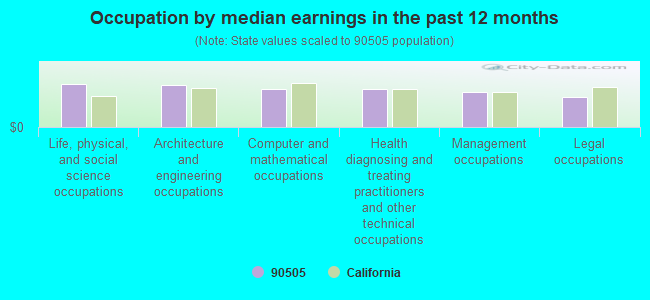
Occupation by median earnings in the past 12 months ($)
129,032Life, physical, and social science occupations
123,872Architecture and engineering occupations
114,032Computer and mathematical occupations
113,483Health diagnosing and treating practitioners and other technical occupations
104,392Management occupations
90,447Legal occupations
Companies with biggest federal contracts located in this zip code (TORRANCE, CA):
AMCOMP CORPORATION (23332 HAWTHORNE BLVD , SUI) : $66,256,757 in 191 contractsfrom 1999 to 2006
Contracts for Space Vehicles, Engineering and Technical Services, ADP Software, ADP Support Equipment, and moreby Air Force, Federal Technology Service, U.S. Coast Guard Signed by year:2000: $8,327,861; 2001: $8,612,983; 2002: $12,006,706; 2003: $10,541,781; 2004: $9,643,867; 2005: $10,953,299; 2006: $5,334,729.
Biggest contracts:
$2,315,835 with Air Force for Space Vehicles. Signed on 2000-02-17. Completion date: 2001-01-14.
$2,225,949 with Air Force for Engineering and Technical Services. Signed on 2002-12-24. Completion date: 2003-11-30.
$2,132,460, same as above.Signed on 2004-01-28. Completion date: 2003-11-30.
$1,985,200 with Air Force for Engineering and Technical Services. Taking place in OH. Signed on 2005-02-25. Completion date: 2006-03-22.
HI-SHEAR TECHNOLOGY CORPORATIO (24225 GARNIER STREET; small business) 100 employees, $0 revenue. : $27,034,488 in 100 contractsfrom 1999 to 2006
Contracts for Cartridge and Propellant Actuated Devices and Components, Demolition Materials, Space Vehicle Components, , and moreby Navy, NASA, Army, Air Force, and others Signed by year:2000: $4,770,536; 2001: $916,117; 2002: $4,282,810; 2003: $6,585,471; 2004: $4,980,600; 2005: $5,144,176; 2006: $282,778.
Biggest contracts:
$3,499,700 with Navy for Cartridge and Propellant Actuated Devices and Components. Signed on 2005-06-20. Completion date: 2006-07-18.
$3,027,182 with Navy for Demolition Materials. Signed on 2003-07-31. Completion date: 2008-07-31.
$2,818,620 with Navy for Cartridge and Propellant Actuated Devices and Components. Signed on 2002-08-22. Completion date: 2003-08-23.
$2,375,000, same as above.Signed on 2000-05-05. Completion date: 2001-03-05.
ACTA SERVICES CORPORATION (2790 SKYPARK DR STE 310; small business) : $26,860,313 in 23 contractsfrom 2002 to 2006
Contracts for Maintenance, Repair and Rebuilding of Equipment -- Miscellaneous, Engineering -- Applied Research and Exploratory Development (R&D) by Air Force Signed by year:2000: $0; 2001: $0; 2002: $4,435,440; 2003: $3,973,704; 2004: $6,794,086; 2005: $10,067,736; 2006: $1,589,347.
Biggest contracts:
$4,408,000 with Air Force for Maintenance, Repair and Rebuilding of Equipment -- Miscellaneous. Signed on 2002-10-01. Completion date: 2003-09-30.
$4,289,785 with Air Force for Engineering -- Applied Research and Exploratory Development (R&D). Signed on 2004-02-10. Completion date: 2008-09-30.
$3,352,182, same as above.Signed on 2005-10-01. Completion date: 2006-09-30.
$3,133,348, same as above.Signed on 2005-01-01. Completion date: 2005-09-30.
ACTA INCORPORATED (2790 SKYPARK DR STE 310; small business) : $25,006,423 in 96 contractsfrom 1999 to 2006
Contracts for Scientific Data Studies, Engineering and Technical Services, Defense Electronics and Communication Equipment -- Management and Support (R&D), Weapons -- Basic Research (R&D), and moreby Air Force, Federal Technology Service, Navy, Army, and others Signed by year:2000: $7,135,770; 2001: $6,692,066; 2002: $1,762,767; 2003: $3,482,748; 2004: $4,282,868; 2005: $1,410,106; 2006: $170,098.
Biggest contracts:
$2,525,100 with Air Force for Scientific Data Studies. Signed on 2000-02-11. Completion date: 2000-09-30.
$2,261,138, same as above.Signed on 2001-12-05. Completion date: 2002-03-31.
$1,812,694, same as above.Signed on 2000-11-17. Completion date: 2001-09-30.
$1,535,041, same as above.Signed on 2000-03-27. Completion date: 2000-09-30.
NEXTGEN AERONAUTICS INC (2780 SKYPARK DR STE 400; small business) : $9,743,664 in 47 contractsfrom 2003 to 2006
Contracts for Invalid code: AD97, Aeronautics and Space Technology -- Basic Research (R&D), Other Research and Development -- Basic Research (R&D), Other Defense -- Applied Research and Exploratory Development (R&D), and moreby Air Force, NASA, Army, Department of Defense, and others Signed by year:2000: $0; 2001: $0; 2002: $0; 2003: $169,865; 2004: $2,434,403; 2005: $2,846,596; 2006: $4,292,800.
Biggest contracts:
$1,299,222 with Air Force for Invalid code: AD97. Signed on 2004-03-10. Completion date: 2005-06-10.
$835,000 with NASA for Aeronautics and Space Technology -- Basic Research (R&D). Signed on 2006-05-19. Effective on 2006-05-01. Completion date: 2007-03-31.
$835,000, same as above.Signed on 2006-09-27. Completion date: 2007-03-31.
$399,746 with Air Force for Invalid code: AD97. Signed on 2005-05-18. Completion date: 2005-06-10.
SKY III CORPORATION (3142 PACIFIC COAST HWY, #2; small business) : $6,474,683 in 170 contractsfrom 2000 to 2006
Contracts for Architect - Engineer Services (including landscaping, interior layout, and designing), Other Architect and Engineering Services by Navy Signed by year:2000: $102,686; 2001: $26,338; 2002: $1,466,750; 2003: $1,587,577; 2004: $1,434,526; 2005: $744,903; 2006: $1,111,903.
Biggest contracts:
$313,125 with Navy for Architect - Engineer Services (including landscaping, interior layout, and designing). Signed on 2004-03-09. Completion date: 2004-06-27.
$223,017, same as above.Signed on 2002-09-25. Completion date: 2003-01-13.
$216,306, same as above.Signed on 2004-03-09. Completion date: 2004-06-30.
$175,849, same as above.Signed on 2006-02-09. Completion date: 2006-06-01.
QUINSTAR TECHNOLOGY INC (24085 GARNIER ST; small business) : $4,286,639 in 51 contractsfrom 2000 to 2006
Contracts for Antennas, Waveguides, and Related Equipment, Other Defense -- Basic Research (R&D), Miscellaneous Communication Equipment, Defense Missile and Space Systems -- Basic Research (R&D), and moreby Navy, Air Force, Army, National Oceanic and Atmospheric Administration/Under Secretary for Oceans and Atmosphere, and others Signed by year:2000: $627,190; 2001: $267,979; 2002: $208,055; 2003: $648,606; 2004: $1,109,017; 2005: $1,286,532; 2006: $139,260.
Biggest contracts:
$928,795 with Navy for Antennas, Waveguides, and Related Equipment. Signed on 2005-05-03. Completion date: 2007-06-30.
$375,000 with Air Force for Other Defense -- Basic Research (R&D). Signed on 2004-04-19. Completion date: 2006-07-15.
$368,846, same as above.Signed on 2004-11-08. Completion date: 2006-07-15.
$350,000 with Navy for Miscellaneous Communication Equipment. Signed on 2003-07-17. Completion date: 2004-01-14.
KEPNER PLASTICS FABRICATORS, I (3131 LOMITA BOULEVARD; small business) : $4,072,562 in 34 contractsfrom 2000 to 2006
Contracts for Other Research and Development -- Applied Research and Exploratory Development (R&D), Miscellaneous Ship and Marine Equipment, Miscellaneous Items, Pontoons And Floating Docks, and moreby Army, U.S. Army Corps of Engineers - civil program financing only, Navy, Defense Logistics Agency, and others Signed by year:2000: $817,871; 2001: $1,936,865; 2002: $1,120,903; 2003: $45,998; 2004: $11,430; 2005: $116,070; 2006: $23,425.
Biggest contracts:
$978,580 with Army for Other Research and Development -- Applied Research and Exploratory Development (R&D). Signed on 2002-05-30. Completion date: 2002-10-30.
$541,016, same as above.Signed on 2001-06-07. Completion date: 2002-05-20.
$458,190, same as above.Signed on 2001-06-29. Completion date: 2002-05-20.
$359,992 with U.S. Army Corps of Engineers - civil program financing only for Other Research and Development -- Applied Research and Exploratory Development (R&D). Signed on 2000-03-31. Completion date: 2000-07-30.
MCCULLOUGH AERO CO (23891 MADISON ST; small business) : $4,028,215 in 54 contractsfrom 1999 to 2006
Contracts for Miscellaneous Power Transmission Equipment, Hardware, Commercial, Packing and Gasket Materials, Airframe Structural Components, and moreby Army, Defense Logistics Agency Signed by year:2000: $433,137; 2001: $1,163,314; 2002: $277,649; 2003: $0; 2004: $388,031; 2005: $1,393,663; 2006: $41,920.
Biggest contracts:
$445,567 with Army for Miscellaneous Power Transmission Equipment. Signed on 2005-06-28. Completion date: 2010-06-30.
$408,215 with Defense Logistics Agency for Hardware, Commercial. Signed on 2005-07-07. Completion date: 2005-08-07.
$303,601 with Army for Hardware, Commercial. Signed on 1999-11-18. Completion date: 2000-06-19.
$145,280 with Defense Logistics Agency for Packing and Gasket Materials. Signed on 2001-05-23. Completion date: 2001-09-23.
VALUESAT (22527 CRENSHAW BLVD , SUIT; small business) : $3,471,293 in 81 contractsfrom 2000 to 2003
Contracts for ADP Telecommunications and Transmission Services by Department of Defense Signed by year:2000: $775,800; 2001: $2,553,366; 2002: $83,110; 2003: $59,017; 2004: $0; 2005: $0; 2006: $0.
Biggest contracts:
$283,500 with Department of Defense for ADP Telecommunications and Transmission Services. Signed on 2000-08-31. Completion date: 2005-08-03.
$105,819, same as above.Signed on 2001-04-30. Completion date: 2006-03-27.
$83,106, same as above.Signed on 2002-09-30. Completion date: 2002-10-01.
$80,640, same as above.Signed on 2000-08-31. Completion date: 2005-08-20.
Top industries in this zip code by the number of employees in 2005:
Administrative and Support and Waste Management and Remediation Services: Temporary Help Services (250-499: 1, 100-249: 2, 50-99: 1, 20-49: 3, 5-9: 2, 1-4: 4)
Health Care and Social Assistance: Offices of Dentists (20-49: 4, 10-19: 22, 5-9: 37, 1-4: 50)
People in group quarters in 2010:
175 people in nursing facilities/skilled-nursing facilities
50 people in residential treatment centers for juveniles (non-correctional)
33 people in group homes intended for adults
29 people in other noninstitutional facilities
19 people in workers' group living quarters and job corps centers
People in group quarters in 2000:
152 people in other noninstitutional group quarters
146 people in nursing homes
51 people in homes for the mentally ill
12 people in other nonhousehold living situations
6 people in mental (psychiatric) hospitals or wards
4 people in other group homes
Fatal accident statistics in 2014:
Fatal accident count: 2
Vehicles involved in fatal accidents: 3
Fatal accidents caused by drunken drivers: 0
Fatalities: 2
Persons involved in fatal accidents: 3
Pedestrians involved in fatal accidents: 1
Fatal accident statistics in 2013:
Fatal accident count: 3
Vehicles involved in fatal accidents: 5
Fatal accidents caused by drunken drivers: 1
Fatalities: 3
Persons involved in fatal accidents: 6
Pedestrians involved in fatal accidents: 0
Home Mortgage Disclosure Act Aggregated Statistics For Year 2009 (Based on 11 full and 2 partial tracts)
A) FHA, FSA/RHS & VA Home Purchase Loans
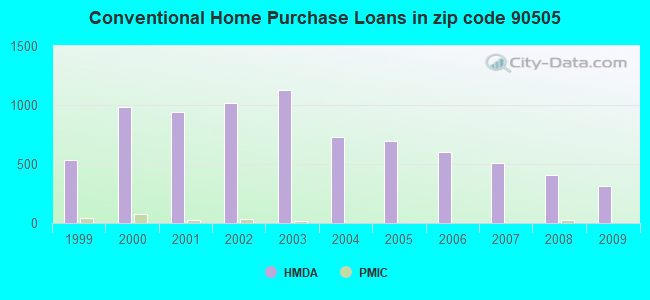
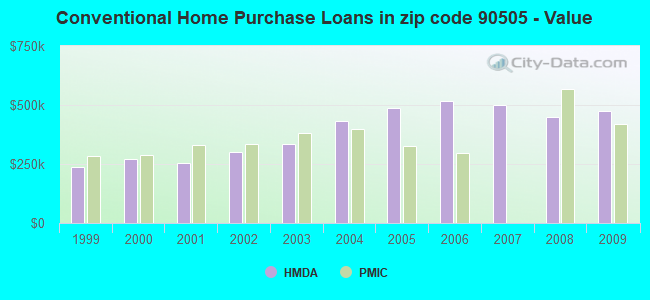
B) Conventional Home Purchase Loans
C) Refinancings
D) Home Improvement Loans
E) Loans on Dwellings For 5+ Families
F) Non-occupant Loans on < 5 Family Dwellings (A B C & D)
G) Loans On Manufactured Home Dwelling (A B C & D)
Number
Average Value
Number
Average Value
Number
Average Value
Number
Average Value
Number
Average Value
Number
Average Value
Number
Average Value
LOANS ORIGINATED
59
$571,023
310
$474,928
2,056
$368,658
113
$259,548
2
$11,795,280
89
$306,170
0
$0
APPLICATIONS APPROVED, NOT ACCEPTED
4
$549,235
38
$459,465
233
$420,245
8
$319,828
0
$0
7
$291,336
6
$223,278
APPLICATIONS DENIED
7
$576,731
66
$506,139
389
$414,545
15
$223,145
0
$0
42
$310,007
4
$72,048
APPLICATIONS WITHDRAWN
7
$515,529
41
$397,899
253
$421,656
18
$382,456
0
$0
17
$298,504
2
$100,280
FILES CLOSED FOR INCOMPLETENESS
0
$0
12
$496,907
96
$418,367
4
$54,940
0
$0
7
$294,229
0
$0
Aggregated Statistics For Year 2008 (Based on 11 full and 2 partial tracts)
A) FHA, FSA/RHS & VA Home Purchase Loans
B) Conventional Home Purchase Loans
C) Refinancings
D) Home Improvement Loans
E) Loans on Dwellings For 5+ Families
F) Non-occupant Loans on < 5 Family Dwellings (A B C & D)
G) Loans On Manufactured Home Dwelling (A B C & D)
Number
Average Value
Number
Average Value
Number
Average Value
Number
Average Value
Number
Average Value
Number
Average Value
Number
Average Value
LOANS ORIGINATED
8
$587,575
406
$447,845
631
$396,386
58
$198,247
4
$1,157,010
84
$338,267
3
$21,507
APPLICATIONS APPROVED, NOT ACCEPTED
0
$0
78
$568,884
110
$416,772
9
$184,038
0
$0
1
$169,770
11
$162,537
APPLICATIONS DENIED
4
$534,522
79
$561,200
255
$493,698
33
$245,797
6
$811,527
25
$337,631
8
$83,000
APPLICATIONS WITHDRAWN
7
$567,516
61
$486,910
132
$434,772
14
$210,446
0
$0
12
$296,305
2
$231,715
FILES CLOSED FOR INCOMPLETENESS
0
$0
12
$360,538
48
$498,937
11
$399,362
0
$0
6
$195,943
0
$0
Aggregated Statistics For Year 2007 (Based on 11 full and 2 partial tracts)
B) Conventional Home Purchase Loans
C) Refinancings
D) Home Improvement Loans
E) Loans on Dwellings For 5+ Families
F) Non-occupant Loans on < 5 Family Dwellings (A B C & D)
G) Loans On Manufactured Home Dwelling (A B C & D)
Number
Average Value
Number
Average Value
Number
Average Value
Number
Average Value
Number
Average Value
Number
Average Value
LOANS ORIGINATED
508
$499,427
866
$446,512
83
$326,039
15
$2,253,345
119
$435,997
6
$139,225
APPLICATIONS APPROVED, NOT ACCEPTED
111
$495,344
210
$447,403
32
$301,842
0
$0
40
$340,657
6
$114,560
APPLICATIONS DENIED
134
$548,092
386
$533,277
49
$300,310
0
$0
64
$506,978
6
$54,197
APPLICATIONS WITHDRAWN
64
$472,524
158
$451,447
32
$202,157
0
$0
28
$429,661
0
$0
FILES CLOSED FOR INCOMPLETENESS
26
$556,068
36
$524,706
8
$245,879
0
$0
1
$430,570
0
$0
Aggregated Statistics For Year 2006 (Based on 11 full and 2 partial tracts)
B) Conventional Home Purchase Loans
C) Refinancings
D) Home Improvement Loans
E) Loans on Dwellings For 5+ Families
F) Non-occupant Loans on < 5 Family Dwellings (A B C & D)
G) Loans On Manufactured Home Dwelling (A B C & D)
Number
Average Value
Number
Average Value
Number
Average Value
Number
Average Value
Number
Average Value
Number
Average Value
LOANS ORIGINATED
599
$516,354
1,170
$430,716
131
$327,249
5
$2,260,408
152
$487,879
0
$0
APPLICATIONS APPROVED, NOT ACCEPTED
128
$478,836
205
$393,398
25
$231,855
0
$0
23
$471,291
6
$81,225
APPLICATIONS DENIED
141
$486,805
401
$506,867
48
$320,255
0
$0
55
$546,539
3
$114,513
APPLICATIONS WITHDRAWN
117
$486,233
287
$458,777
29
$411,247
0
$0
43
$470,878
2
$99,305
FILES CLOSED FOR INCOMPLETENESS
30
$466,120
61
$447,949
8
$182,654
0
$0
10
$560,903
0
$0
Aggregated Statistics For Year 2005 (Based on 11 full and 2 partial tracts)
B) Conventional Home Purchase Loans
C) Refinancings
D) Home Improvement Loans
E) Loans on Dwellings For 5+ Families
F) Non-occupant Loans on < 5 Family Dwellings (A B C & D)
G) Loans On Manufactured Home Dwelling (A B C & D)
Number
Average Value
Number
Average Value
Number
Average Value
Number
Average Value
Number
Average Value
Number
Average Value
LOANS ORIGINATED
692
$486,849
1,456
$411,896
175
$296,133
12
$3,407,346
151
$355,952
4
$58,415
APPLICATIONS APPROVED, NOT ACCEPTED
135
$479,390
226
$401,909
32
$295,886
0
$0
17
$357,661
7
$129,079
APPLICATIONS DENIED
177
$490,906
306
$424,164
64
$227,011
0
$0
40
$352,427
7
$102,891
APPLICATIONS WITHDRAWN
111
$433,439
373
$398,876
51
$249,399
1
$5,600,000
33
$429,020
2
$61,000
FILES CLOSED FOR INCOMPLETENESS
28
$454,306
86
$383,512
15
$252,805
0
$0
6
$400,040
0
$0
Aggregated Statistics For Year 2004 (Based on 11 full and 2 partial tracts)
A) FHA, FSA/RHS & VA Home Purchase Loans
B) Conventional Home Purchase Loans
C) Refinancings
D) Home Improvement Loans
E) Loans on Dwellings For 5+ Families
F) Non-occupant Loans on < 5 Family Dwellings (A B C & D)
G) Loans On Manufactured Home Dwelling (A B C & D)
Number
Average Value
Number
Average Value
Number
Average Value
Number
Average Value
Number
Average Value
Number
Average Value
Number
Average Value
LOANS ORIGINATED
0
$0
728
$432,302
2,153
$348,093
154
$241,171
11
$1,977,864
175
$330,223
0
$0
APPLICATIONS APPROVED, NOT ACCEPTED
0
$0
147
$400,001
289
$359,194
20
$140,627
0
$0
25
$344,702
0
$0
APPLICATIONS DENIED
0
$0
136
$448,543
376
$359,268
82
$220,540
0
$0
47
$302,362
4
$79,650
APPLICATIONS WITHDRAWN
2
$300,940
98
$427,338
438
$363,146
32
$153,683
0
$0
24
$344,652
0
$0
FILES CLOSED FOR INCOMPLETENESS
0
$0
31
$393,548
126
$325,000
19
$256,597
0
$0
3
$428,987
0
$0
Aggregated Statistics For Year 2003 (Based on 11 full and 2 partial tracts)
B) Conventional Home Purchase Loans
C) Refinancings
D) Home Improvement Loans
E) Loans on Dwellings For 5+ Families
F) Non-occupant Loans on < 5 Family Dwellings (A B C & D)
Number
Average Value
Number
Average Value
Number
Average Value
Number
Average Value
Number
Average Value
LOANS ORIGINATED
1,126
$334,573
5,664
$283,779
94
$92,288
13
$2,683,029
288
$244,603
APPLICATIONS APPROVED, NOT ACCEPTED
146
$344,954
889
$300,883
22
$100,323
0
$0
44
$228,672
APPLICATIONS DENIED
120
$349,462
635
$314,858
29
$81,943
0
$0
39
$358,671
APPLICATIONS WITHDRAWN
164
$332,981
795
$294,168
21
$65,480
0
$0
46
$269,979
FILES CLOSED FOR INCOMPLETENESS
42
$394,177
197
$292,786
6
$100,003
0
$0
24
$267,570
Aggregated Statistics For Year 2002 (Based on 11 full and 2 partial tracts)
A) FHA, FSA/RHS & VA Home Purchase Loans
B) Conventional Home Purchase Loans
C) Refinancings
D) Home Improvement Loans
E) Loans on Dwellings For 5+ Families
F) Non-occupant Loans on < 5 Family Dwellings (A B C & D)
Number
Average Value
Number
Average Value
Number
Average Value
Number
Average Value
Number
Average Value
Number
Average Value
LOANS ORIGINATED
0
$0
1,018
$300,285
3,848
$276,105
70
$73,660
16
$1,767,947
185
$266,124
APPLICATIONS APPROVED, NOT ACCEPTED
2
$59,600
137
$307,613
588
$266,896
12
$40,191
0
$0
36
$262,109
APPLICATIONS DENIED
2
$57,440
123
$353,301
433
$284,149
23
$71,581
2
$1,972,630
31
$297,446
APPLICATIONS WITHDRAWN
2
$6,815
107
$298,931
444
$278,455
31
$108,005
0
$0
11
$199,615
FILES CLOSED FOR INCOMPLETENESS
0
$0
36
$301,294
168
$299,989
5
$82,974
3
$6,081,200
8
$191,898
Aggregated Statistics For Year 2001 (Based on 11 full and 2 partial tracts)
A) FHA, FSA/RHS & VA Home Purchase Loans
B) Conventional Home Purchase Loans
C) Refinancings
D) Home Improvement Loans
E) Loans on Dwellings For 5+ Families
F) Non-occupant Loans on < 5 Family Dwellings (A B C & D)
Number
Average Value
Number
Average Value
Number
Average Value
Number
Average Value
Number
Average Value
Number
Average Value
LOANS ORIGINATED
0
$0
940
$253,126
2,305
$253,591
106
$81,362
15
$2,006,574
116
$214,868
APPLICATIONS APPROVED, NOT ACCEPTED
0
$0
110
$294,007
357
$253,573
31
$52,313
0
$0
29
$162,953
APPLICATIONS DENIED
5
$193,768
78
$235,369
492
$246,838
43
$75,645
2
$4,033,385
19
$265,918
APPLICATIONS WITHDRAWN
4
$196,385
130
$238,058
421
$237,728
20
$56,650
0
$0
30
$207,466
FILES CLOSED FOR INCOMPLETENESS
0
$0
34
$302,325
152
$239,828
0
$0
3
$3,149,040
8
$186,728
Aggregated Statistics For Year 2000 (Based on 11 full and 2 partial tracts)
A) FHA, FSA/RHS & VA Home Purchase Loans
B) Conventional Home Purchase Loans
C) Refinancings
D) Home Improvement Loans
E) Loans on Dwellings For 5+ Families
F) Non-occupant Loans on < 5 Family Dwellings (A B C & D)
Number
Average Value
Number
Average Value
Number
Average Value
Number
Average Value
Number
Average Value
Number
Average Value
LOANS ORIGINATED
3
$155,500
987
$270,535
508
$202,095
139
$45,288
9
$1,804,927
67
$233,893
APPLICATIONS APPROVED, NOT ACCEPTED
0
$0
159
$259,558
76
$233,264
38
$44,249
0
$0
4
$166,000
APPLICATIONS DENIED
0
$0
157
$274,629
237
$209,159
48
$59,760
1
$2,337,380
8
$201,882
APPLICATIONS WITHDRAWN
0
$0
119
$277,876
153
$171,258
25
$62,143
2
$2,199,120
10
$212,873
FILES CLOSED FOR INCOMPLETENESS
0
$0
37
$310,629
59
$256,986
2
$59,990
6
$1,815,367
2
$267,740
Aggregated Statistics For Year 1999 (Based on 5 full and 2 partial tracts)
A) FHA, FSA/RHS & VA Home Purchase Loans
B) Conventional Home Purchase Loans
C) Refinancings
D) Home Improvement Loans
E) Loans on Dwellings For 5+ Families
F) Non-occupant Loans on < 5 Family Dwellings (A B C & D)
2005 - 2018 National Fire Incident Reporting System (NFIRS) incidents
According to the data from the years 2005 - 2018 the average number of fires per year is 29. The highest number of fire incidents - 59 took place in 2005, and the least - 0 in 2010. The data has a declining trend.
When looking into fire subcategories, the most reports belonged to: Outside Fires (43.9%), and Structure Fires (26.7%).
Fire incident types reported to NFIRS in Zip Code 90505


 Nearest zip codes: 90503, 90717, 90274, 90501, 90277, 90710.


 According to the data from the years 2005 - 2018 the average number of fires per year is 29. The highest number of fire incidents - 59 took place in 2005, and the least - 0 in 2010. The data has a declining trend.
 When looking into fire subcategories, the most reports belonged to: Outside Fires (43.9%), and Structure Fires (26.7%).